
 Open Access Article
 This Open Access Article is licensed under a
 Creative Commons Attribution 3.0 Unported Licence
Quantification and physical analysis of nanoparticle emissions from a marine engine using different fuels and a laboratory wet scrubber†
Luis F. E. d.
Santos
 *a,
Kent
Salo
b and
Erik S.
Thomson
*a
*a,
Kent
Salo
b and
Erik S.
Thomson
*a
aDepartment of Chemistry and Molecular Biology, Atmospheric Science, University of Gothenburg, Gothenburg 41296, Sweden. E-mail: luis.santos@cmb.gu.se; erik.thomson@chem.gu.se
bDepartment of Mechanics and Maritime Sciences, Maritime Studies, Chalmers University of Technology, Gothenburg 41756, Sweden
First published on 24th August 2022
Abstract
A marine test-bed diesel engine was used to study how international fuel sulfur content (FSC) regulations and wet scrubbing can affect physical properties of submicron exhaust particles. Particle size distributions, particle number and mass emission factors as well as effective densities of particulate emissions were measured for three distillate fuels of varying FSC and a laboratory wet scrubber. While particle number concentrations were reduced by up to 9% when switching to low FSC fuels, wet scrubbing led to increased ultrafine particulate emissions (<30 nm). Exhaust processed through the scrubber was also found to have particles with greater effective densities, a result that directly contradicts the particulate characteristics of low FSC fuel emissions. The results demonstrate that alternative pathways to comply with marine FSC regulations can have opposing effects and thus may have very different implications for important atmospheric processes. The relevance for air quality, and the potential implications for cloud and climate interactions are discussed.
1 Introduction
Marine transport remains a large source of particulate matter (PM) emissions and shipping alone contributes nearly as many particles to the air as all continental anthropogenic emissions.1 Ship exhaust particles are formed from incomplete combustion processes and engine wear, and consist mostly of carbonaceous species, black carbon, or soot, and may also include other inorganic compounds.2,3 Exhaust is dominated by ultrafine particulates below 100 nm, which are particularly harmful for humans and ecosystems4 and have been estimated to significantly affect human mortality in coastal areas.5,6 Physicochemical properties such as particle size, chemical composition and total particle number (PN) have been shown to depend on the fuel type consumed,7–9 engine load2,8 and lubricating oil.9,10 These properties also determine how particles interact within the climate system, for example by increasing cloud reflectivity or suppressing precipitation.11 Soot has the ability to directly absorb solar radiation and cause local warming,12 but with time in the atmosphere, oxidation and aging processes might change this first order behavior.13,14 Studies have shown that ship exhaust particles can impact cloud properties, yet it remains unclear how such perturbations affect different cloud types and whether they have larger scale effects.15–20In order to reduce sulfur oxides (SOx) and PM emissions the International Maritime Organization (IMO) has introduced regulations that limit the maximum allowed fuel sulfur content (FSC; Usually stated as a relative mass fraction in % m/m. For simplicity, herein FSC is abbreviated as %) in marine fuels. Since January 2020 the global limit of marine FSC has been 0.5%, while in sulfur emission control areas (SECAs) the FSC has been limited to 0.1% since 2015.21 However, in reality ship operators have two alternative pathways to achieve regulatory compliance. As an alternative to using distilled marine fuels with low FSC, exhaust after-treatment systems like wet scrubber (WS) systems allow ships to run on high FSC fuels.21 Wet scrubbing removes SOx by directing the exhaust gas through high pressure sprays of seawater or fresh water. Gaseous SOx and PM are captured by the sprayed water and removed from the exhaust gas before it is emitted into the atmosphere.22,23 Different types of WS technology exist where the water is subsequently discharged directly back into the sea (open loop mode) or recirculated within the system after undergoing a treatment process (closed loop). While the wastewater in closed loop scrubbers may still be discharged at later stages, on the open sea, wet scrubbers are largely operated in an open loop mode. Depending on the ship type, ship operators may also choose to switch between fuel types, and WS usage, and even alternate between open- and closed loop modes. Such fuel and treatment switching practices are often used when ships enter or leave SECAs and pose an additional challenge for assessing and quantifying global particulate emissions from ships to the environment, especially in near-shore environments.
Economics typically control ship operators’ decision-making when choosing low FSC fuels and/or scrubbing systems. For example, switching from heavy fuel oil (HFO) or other high sulfur content fuels to low FSC fuels is associated with a cost premium due to the higher prices of more distilled fuels. However, scrubber installation is also costly and on-board wet scrubbing, particularly open-loop scrubbers, has been a focus of ecotoxicological studies because the discharge water is a source of marine pollution.24–26
A wide range of studies have examined particulate emissions from ships and/or combustion of different marine fuels based on on-board measurements,1,2,27,28 plume intercepts1,18,29–31 and lab-based studies.1,9,28,32,33 In recent years more studies have specifically investigated the effects of IMO FSC regulations on particulate emissions, e.g., by examining the differences between HFO, low FSC distillate fuels and alternative fuels such as liquefied natural gas (LNG).1,34–37 However, the amount of research into WS emissions remains limited. While SOx removal efficiency is undisputed, studies investigating other, less targeted, effects of scrubbing on ship exhaust particles show large variations with regards to particulate removal efficiencies. Some studies show scrubbers reduce total PM concentrations with a wide range of variability, anywhere from 8% to 75% reductions compared to HFO,28,38–40 while others observe no clear PM reductions in post-scrubber emissions.41 The discrepancies are highlighted in a recent IMO report.42 The current consensus is that WS technology might reduce PN and PM emissions compared to the combustion of HFO but does not provide a clear reduction compared to the usage of low sulfur distillate fuels. There is also a lack of studies that investigate secondary effects of wet scrubbing on particles, such as impacts on particle mixing states, morphologies and densities like those observed by Lieke et al.43
In this study, we characterize how submicron particulate emissions of a marine test-bed engine are affected by IMO FSC regulations by examining particle number size distributions, effective densities and particulate mass emissions. We use IMO compliant marine distillate fuels as well as a non-compliant marine distillate fuel with and without a laboratory based WS. Potential implications for cloud and climate interactions, as well as human health are discussed.
2 Methods
This study, investigating gaseous and particulate exhaust emissions from a marine diesel engine, was conducted during May and June 2020 at Chalmers University of Technology’s Marine Engine Laboratory in Gothenburg, Sweden.2.1 Engine and fuels
The laboratory is equipped with a four-stroke, turbo-charged Volvo Penta D3-110 marine diesel test-bed engine. The engine has five cylinders with a common rail fuel injection system and can achieve a maximum crankshaft power output of 81 kW as well as a maximum engine speed of 3000 RPM. Each cylinder has a bore of 81.0 mm and a stroke of 93.2 mm. For the measurements presented here the engine was operated at a load of 32 ± 1%. The engine load was determined based on the operational engine speed and output torque. Cruising or ocean-going ships often operate at engine loads above 60%, whereas loads as low as 30% are common for ships operating in coastal and port areas as well as in sea-ice or in ice-breaking conditions.44 To study the effects of IMO FSC regulations on ship exhaust particulate emissions three fuels were used. Heavy gas oil (HGO), a marine distillate fuel with a FSC of 0.86%, served as a proxy for fuels that do not meet IMO FSC compliance (global and SECA). In contrast to HFO, HGO has a lower viscosity and density, thus it does not need to be heated prior to combustion. This is expected to affect emitted particle number concentrations8 and the physicochemical properties of the exhaust particles,34 however the Chalmers engine is not suitable or equipped to operate with HFO. HGO was also the fuel used in conjunction with the laboratory wet scrubber. An additional two low FSC fuels ≤0.03% were used during the experiments. Both Marine gas oil (MGO) and hydrotreated vegetable oil (HVO) are compliant with IMO FSC regulations on global and SECA levels. Marine gas oil is widely used in shipping for medium- and high-speed engines and HVO is a biodiesel, which has the lowest density and aromatic content of the three tested fuels. The notable physical and chemical characteristics of the tested fuels are presented in Table 1.| HGO | MGO | HVO | |
|---|---|---|---|
| Density at 15 °C [kg m−3] | 865.3 | 847.4 | 780.0 |
![[thin space (1/6-em)]](https://www.rsc.org/images/entities/char_2009.gif) |
|||
| Heat of combustion [MJ kg −1 ] | |||
| Gross heat of combustion | 45.02 | 45.60 | 46.57 |
| Net heat of combustion | 42.30 | 42.79 | 43.55 |
|
|||
| Carbon content [%] | 86.4 | 86.5 | 85.2 |
| Sulfur content [%] | 0.86 | <0.03 | <0.03 |
|
|||
| Aromatic content [vol. %] | |||
| Total aromatics | 27.4 | 23.6 | 0.2 |
| Mono-aromatics | 20.2 | 20.5 | 0.2 |
| Di-aromatics | 6.46 | 2.60 | <0.1 |
| Poly aromatics (Tri+) | 0.71 | 0.43 | <0.02 |
|
|||
| Additive and wear metals [mg kg −1 ] | |||
| Cu | 1.81 | <0.1 | <0.1 |
| K | 0.4 | 0.27 | 0.25 |
| Al, Ca, Cr, Fe, Pb, Ni, Na, V, Zi | <0.1 | <0.1 | <0.1 |
2.2 Laboratory wet scrubber and seawater sampling
The laboratory-scale WS used in these experiments was engineered and constructed at Chalmers University of Technology with its primary purpose being to reduce SOx emissions in exhaust gas. Thus, its design is based on scrubbers currently deployed in the shipping sector. The 50 cm long, stainless steel scrubber is cylindrical with a 40 cm inner diameter. Six water nozzles are mounted concentrically around the circumference of the inner wall, with an additional seventh nozzle suspended in the center and aimed at the exhaust inlet (see Fig. 1 and S1†). Water flow from a storage tank to the spray nozzles is regulated by a pressure pump. During experiments the water flow was fixed between 1.5 and 2 L min−1. Two demister plates mounted close to the scrubber outlet separate large water droplets from the exhaust gas and the resulting discharge water is continuously removed from the scrubber and collected in wastewater tanks. For these experiments the WS was operated with both freshwater and seawater to investigate effects of salinity on the particulate emissions. The general design of scrubbers including dimensions and liquid separation techniques can vary substantially between systems and thus individual designs may impact scrubbed particle emissions differently. The design of the laboratory WS used in this study is simplistic compared to what is employed on-board ocean-going ships. These generally have much larger dimensions, allowing for longer exhaust gas residence times and may also utilize enhanced particulate removal technology, such as packed beds and cyclonic air flows. That said, WS design is not regulated by the IMO, rather they must simply satisfy compliance guidelines.45Scrubber freshwater was taken from the Gothenburg municipal water supply and seawater was sourced from a sampling line at the University of Gothenburg’s Kristineberg Marine Research Station, located on Gullmar Fjord north of Gothenburg. The seawater in the fjord is influenced by both the fresher Baltic and Kattegat/Skagerrak surface waters, as well as high salinity bottom water from the North Sea.46 The Kristineberg sampling line pumps water from depths representative of those from which ships equipped with WS obtain water.
During measurements involving the scrubber operation, IMO FSC regulation compliance with respect to gaseous SO2 emissions was monitored according to the Guidelines for Exhaust Gas Cleaning Systems.45 The guidelines state that the ratio between SO2 (ppm) and CO2 (%) measured after the cleaning system should not exceed the ratio measured for a corresponding compliant fuel. For fuels with 0.1% and 0.5% FSC this corresponds to ratios of 4.1 and 21.7, respectively.45 The average emission ratio measured during the WS experiments was ≈1.25, and thus well below the required thresholds.
2.3 Instrumentation & data analysis
A schematic of the instrumental set-up is presented in Fig. 1. Transient experimental periods were observed during engine ignition and warm-up periods, and up to 30 minutes after fuel changes. Data analysis has excluded these periods, in order to focus on periods of stable gas and particle emissions within the raw exhaust, and to minimize the effect of sample contamination from fuel mixing.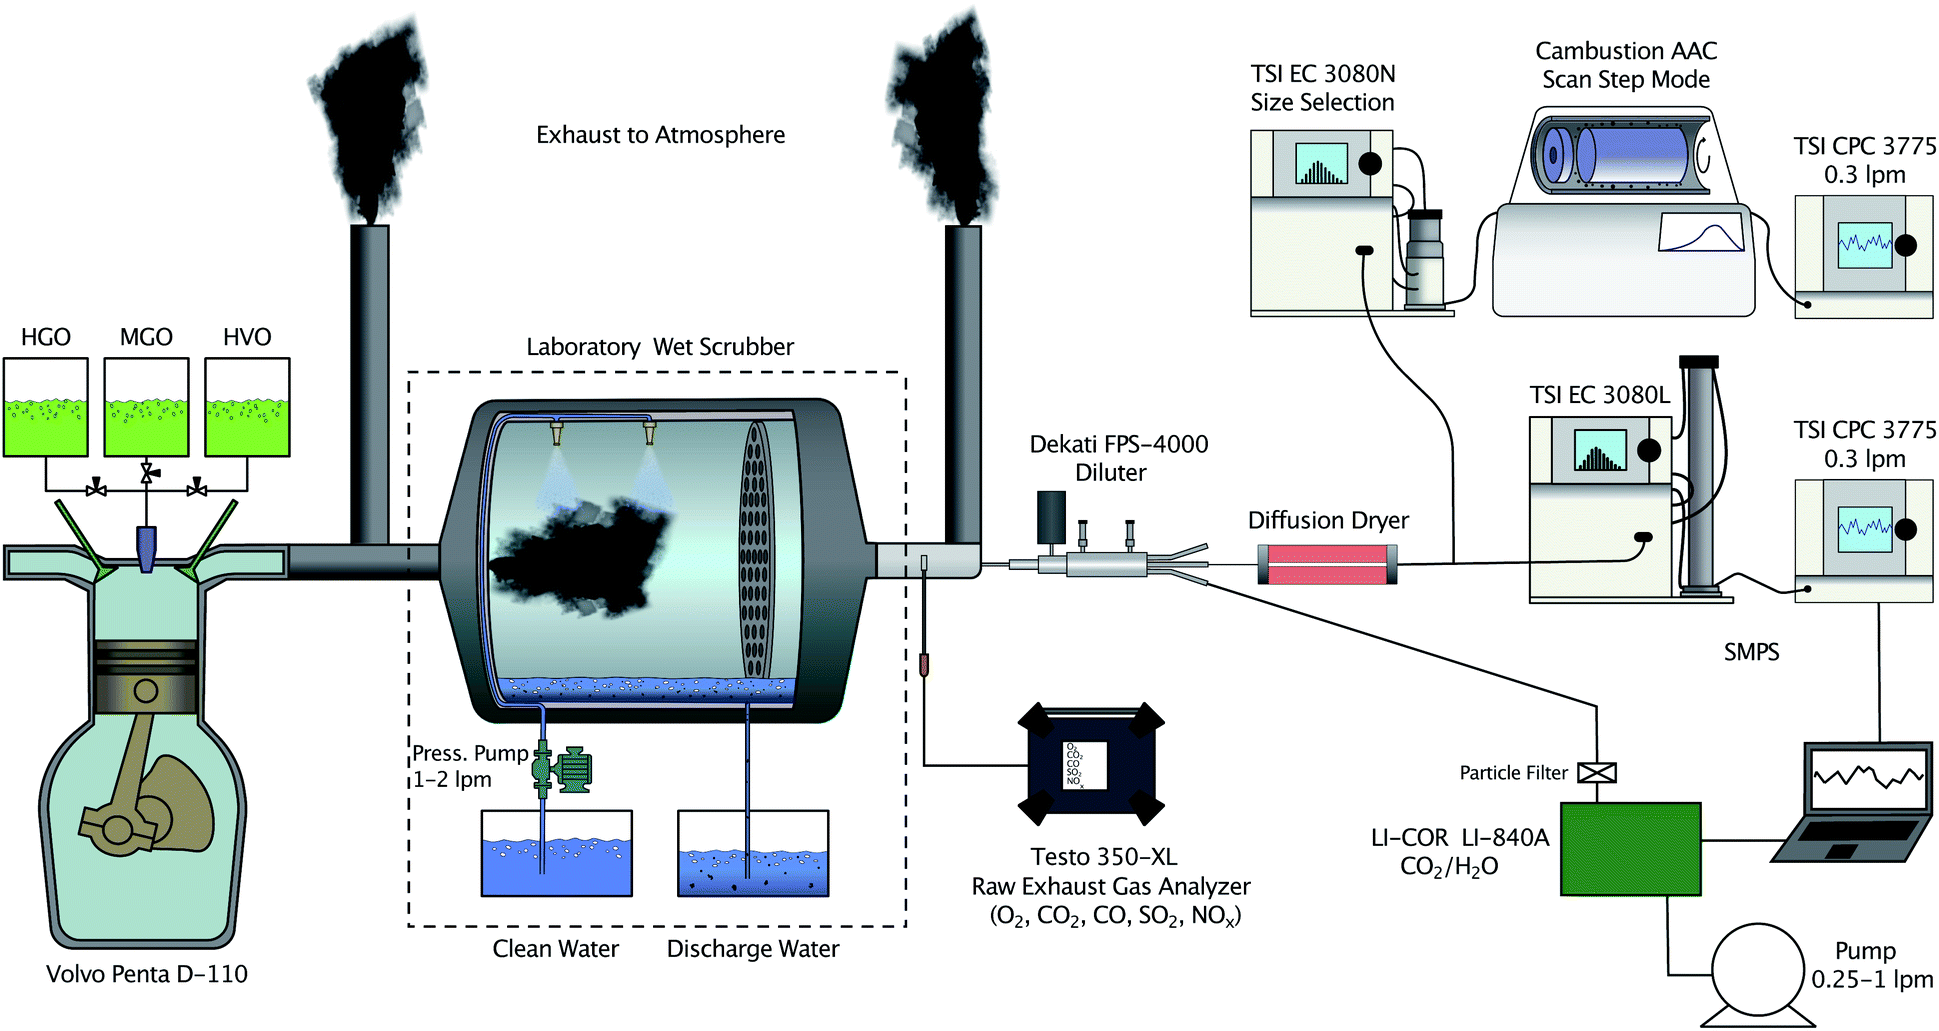 | ||
| Fig. 1 Schematic of the experimental system, where the exhaust flow originates within the Volvo engine and proceeds through or bypasses the scrubber before being diluted and fed into analysis instrumentation. | ||
Gaseous species in the undiluted, raw exhaust gas were measured using a Testo 350-XL gas analyzer (Testo SE & Co. KGaA, Germany). The analyzer measures oxygen (O2; range = 0–25%; resolution = 0.01%), carbon dioxide (CO2; range = 0–50%; resolution <25% = 0.01%), carbon monoxide (CO; range = 0–10000 ppm; resolution = 1 ppm), nitrous oxides (NOx = NO + NO2; range 0–3000/500 ppm; resolution = 1/0.1 ppm) and sulfur dioxide (SO2; range = 0–5000 ppm; resolution = 1 ppm) at 5 second intervals.
Emission factors (EF) for total particle number (EFPN) and mass concentrations (EFPM) were calculated as,34,47
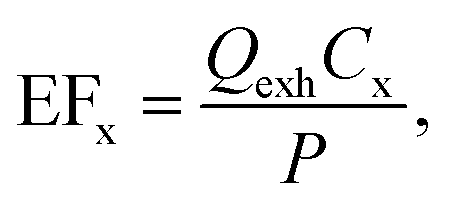 | (1) |
![[P with combining macron]](https://www.rsc.org/images/entities/i_char_0050_0304.gif) of 25.25 kW was used. The flow Qexh was approximated by assuming that all carbon in the fuel is converted to CO2 using,48
of 25.25 kW was used. The flow Qexh was approximated by assuming that all carbon in the fuel is converted to CO2 using,48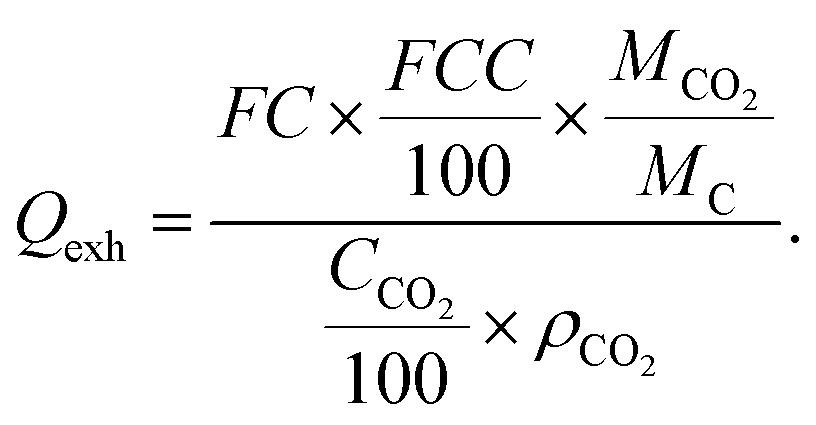 | (2) |
Exhaust gas was diluted using a 2-stage dilution system (FPS-4000, Dekati Ltd., Finland). Dilution ratios were determined from the CO2 ratios between the raw and diluted exhaust. Diluted CO2 was measured with a LI-840A CO2 analyzer (LI-COR Inc., USA) and corrected for background CO2 values. Throughout the experiments the dilution ratio was kept between 60 and 126.
The diluted sample aerosol was passed through a silica gel diffusion dryer prior to entering the particle analysis instrumentation. Particle size distributions (PSD) were measured using a scanning mobility particle sizer (SMPS; Electrostatic classifier, EC, Model 3080L, and condensation particle counter, CPC, Model 3075, TSI Inc., USA). The SMPS was operated with a sample flow of 0.3 L min−1 and a sheath flow of 3 L min−1 and measured mobility diameters (dmo) between 15.1 nm and 661.2 nm. Lognormal distributions were fitted to the measured PSDs to determine the count median diameter (CMD) and the geometric standard deviation (σg). PSDs were corrected for the dilution ratios and diffusional losses within the sampling lines and diffusion dryers.49
A second particle sizing system consisting of an EC (3080N, TSI Inc., USA) paired with an aerodynamic aerosol classifier (AAC, Cambustion Ltd., UK) was used to determine the effective density ρeff of size-selected particles. The ρeff is defined as the particle mass m divided by the volume of a sphere with a diameter equal to the particle’s mobility diameter. The 3080N was used to pre-select particles from the sample flow at constant dmo, while the AAC was operated in scanning mode to classify selected particles by their aerodynamic diameter, dae. Aerodynamic diameters of the pre-selected particles were calculated by applying Gaussian fittings to the resulting dae distributions. Using these values, m was calculated following Tavakoli and Olfert,50
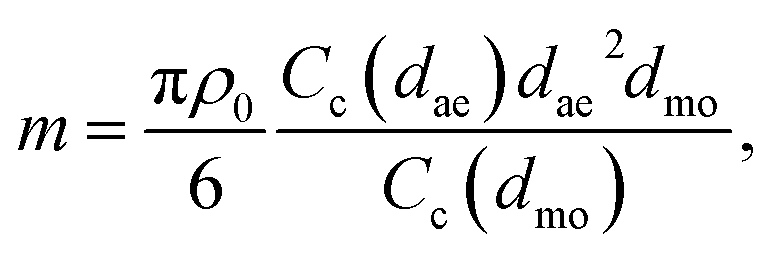 | (3) |
 | (4) |
It has been shown that soot particles become less compact with size due to aggregation of smaller primary particles, which is often observed for diesel exhaust particles.51 Consequently, ρeff of these particles decreases with size. A mass-mobility relationship, which assumes that the radius of primary particles is constant captures this behavior as,
 | (5) |
PM emissions in this study are only derived from PSDs, i.e. filter-based techniques were not employed. Given the ≈660 nm upper size limit of the SMPS, this means only submicron (nano)particles are characterized. Studies have shown that primary particulate mass emissions from ships are dominated by particles with diameter modes up to 8 μm.54–56 This leads to a systematic underestimation of total PM emissions in this study and hence, observed effects on PM emissions are only valid for submicron exhaust particles.
3 Results and discussion
Experiments were performed over a six week time span with some experiments repeated on multiple days. Results are summarized in Table 2 where the acronyms HGO, MGO and HVO correspond to fuel usage and FWS and SWS identify experiments using HGO and the WS with fresh- (FWS) or seawater (SWS), respectively. Variability in engine parameters and combustion conditions affected exhaust emissions, and in these instances, sampling periods are subcategorized using the subscripts h and l. These refer to relatively low (l) or high (h) CO2 concentrations in the raw exhaust during the sampling periods. It is assumed that this variability was caused by changes in engine cooling water temperature. Average gas concentrations and exhaust gas temperatures for the individual cases are summarized in Table S1.†| Case | CMD (nm) | σ g | ρ eff (g cm−3) | D m | N PN (107 # cm−3) | EFPN (1014 # kWh−1) | N PM (mg m−3) | EFPM (1) (10−2 g kWh−1) | EFPM,ρ0 (2) (10−2 g kWh−1) | ||
|---|---|---|---|---|---|---|---|---|---|---|---|
| 50 nm | 90 nm | 150 nm | |||||||||
| HGOl | 45 | 1.56 | 1.01 | 0.86 | 0.65 | 2.62 | 1.9 ± 0.3 | 1.0 ± 0.2 | 4.1 ± 0.7 | 2.3 ± 0.5 | 3.4 ± 0.7 |
| HGOh | 53 | 1.49 | 2.6 ± 0.1 | 1.4 ± 0.1 | 7.8 ± 1.2 | 4.2 ± 0.9 | 6.4 ± 0.7 | ||||
| MGO | 53 | 1.54 | 0.91 | 0.71 | 0.53 | 2.53 | 2.4 ± 0.4 | 1.2 ± 0.2 | 6.2 ± 1.0 | 3.2 ± 0.7 | 6.1 ± 1.4 |
| HVO | 46 | 1.47 | 0.91 | 0.70 | 0.52 | 2.51 | 1.8 ± 0.2 | 0.9 ± 0.1 | 2.8 ± 0.4 | 1.4 ± 0.3 | 2.4 ± 0.3 |
| FWSl | 20/59 | 1.18/1.32 | 1.14 | 0.94 | 0.78 | 2.67 | 3.6 ± 0.6 | 2.0 ± 0.4 | 3.7 ± 0.6 | 2.1 ± 0.4 | 2.5 ± 0.9 |
| FWSh | 19/70 | 1.20/1.33 | 3.6 ± 0.6 | 1.7 ± 0.4 | 10.1 ± 1.6 | 4.7 ± 1.0 | 6.1 ± 0.8 | ||||
| SWSl | 17/59 | 1.24/1.32 | 1.18 | 0.97 | 0.81 | 2.66 | 3.1 ± 0.2 | 1.7 ± 0.1 | 3.1 ± 0.5 | 1.7 ± 0.4 | 2.0 ± 0.2 |
| SWSh | 22/64 | 1.21/1.28 | 3.9 ± 0.3 | 2.0 ± 0.3 | 4.3 ± 0.7 | 2.3 ± 0.5 | 2.7 ± 0.2 | ||||
3.1 Particle size distributions and PN emission factors
The statistical information summarized in Table 2 is largely aggregated from the lognormal least squares fittings of the PSDs presented in Fig. 2a–e. All fuels exhibit unimodal PSDs dominated by particle sizes in the ultrafine mode (dmo < 100 nm). Two distinct sampling periods were observed for HGO with average CO2 concentrations of 7.53% (HGOl) and 7.76% (HGOh). Similar observations were also made for both WS cases, FWS and SWS. The CMD for HGOl was found at 45 nm and shifted to 53 nm for HGOh. The respective σg were 1.56 and 1.49 and corresponding total particle number concentrations were 1.9 × 10⁷ # cm−3 and 2.6 × 10⁷ # cm−3. These values are comparable to total number concentrations measured for two low FSC distillate fuels at engine loads of 25% and 35% by Anderson et al.8 and are significantly lower than number concentrations for HFO measured within the same study. We assume that the increase in total number concentration and shift in the CMD between HGOl and HGOh are not directly related to an increase in engine load, but as mentioned earlier, likely result from changes in the engine cooling water temperature affecting engine parameters and thus, exhaust emissions. In supplemental experiments performed in 2021 PSDs for HGO (new fuel batch; FSC = 0.28%) and HVO (same batch as Table 1; FSC < 0.03%) exhaust at engine loads of 10%, 30% and 50% were measured using the same engine. Results showed that total number concentrations and CMDs decreased with increasing engine load (Fig. S3 and S4†). PSDs for the two low FSC fuels are similar to HGO. Comparing average values of total particle number concentrations (NPN) of HGOh and MGO as well as HGOl and HVO we measured NPN reductions of 9% and 7% respectively when switching to the low sulfur content fuels. Several studies investigating particulate emissions from the combustion of marine fuels report nucleation mode particles at or below 15 nm for different fuel types.8,9,32,33 Anderson et al.8 observed bimodal particle emissions for high FSC fuels with a dominant mode around 10 nm and a minor mode between 45 and 50 nm, also using the Chalmers D3 engine. Although, the size range of the SMPS system used in this study was insufficient to observe similar nucleation mode particles, a limited number of scans using a nano-SMPS indicate an exhaust particle mode around 5 nm for HGO (Fig. S5†). Nevertheless, this mode is far less pronounced than those observed in the aforementioned studies. | ||
| Fig. 2 (a–e) Measured average PSDs for all cases are depicted by square and circular markers. Lognormal distributions have been fitted to the PSDs and are represented by the colored solid lines. HGO, MGO and HVO refer to the combustion of the respective fuels, whereas FWS and SWS indicate HGO combustion in conjunction with wet scrubbing using either sea- (SWS) or freshwater (FWS). In these cases bimodal lognormal distributions have been fitted to the data points. (f) Average EFPN are plotted with whiskers indicating ± two standard deviations. Observed differences in combustion conditions for HGO, FWS and SWS are denoted by downward triangles for relatively low CO2 concentrations, HGOl, and upward triangles for relatively high CO2 concentrations, HGOh. | ||
In WS experiments the PSDs become bimodal (Fig. 2d and e), with the primary mode between 17 nm and 22 nm. This result appears irrespective of scrubber water composition, and in fact post-scrubber particle emissions appear unaffected by the type of scrubber water utilized (FWS vs. SWS). Wu et al.58 measured similar bimodal PSDs from container ship exhaust, with the engine operating at 80% load using both HFO and diesel oil (DO). Particularly, the PSD for DO is similar to what we have measured using the WS, with a peak around 23 nm.58 Moreover, computational studies have demonstrated that within diesel exhaust gas sulfuric acid and water can combine to nucleate particles if the FSC is sufficient and the exhaust gas is rapidly cooled.59 A similar result is manifest in a Schneider et al.60 study where particulate emissions from diesel road vehicles, operating with different FSC fuels, and emissions near a motorway were measured. The authors observed nucleation mode particles in high FSC fuel emissions and assumed those to be formed from sulfuric acid, with subsequent growth through condensation of low-volatile organic compounds. The primary mode particles measured near the motorway were assumed to contain a significant contribution of organic matter from emitted unburned fuel and/or lubricant oil.60 Here, we suspect that particles within the primary mode are formed from nucleation/agglomeration that is favored by the high humidity and lower temperature within the WS. The exhaust gas temperature (Texh) is reduced significantly by the WS from ![[T with combining macron]](https://www.rsc.org/images/entities/i_char_0054_0304.gif) exh,HGO = 234.8 °C to exh,WS = 40.8 °C which is below the dew point of sulfuric acid.61 Srivastava et al.61 suggest that SO2 in exhaust is oxidized to SO3 which then reacts with the water to form a fine mist of sulfuric acid (SA) droplets. A similar hypothesis was posed by Yang et al.41 who measured PM emissions from a container ship equipped with a WS system and observed low PM removal efficiencies. The authors propose that small SA particles formed within the WS do not to diffuse to water droplets’ surfaces to be absorbed.41 Follow-up experiments using the WS system with HVO and a new batch of HGO (FSC = 0.28%) under different engine load conditions indicate that the primary particle mode depends on FSC and engine load. A link between measured SO2 concentrations, which is used as a proxy for S-containing compounds in the exhaust including SO3, and the formation and magnitude of this mode was observed (see Fig. S7†). Moreover, the primary particle mode did not appear when the WS was used with HVO exhaust (Fig. S8†).
exh,HGO = 234.8 °C to exh,WS = 40.8 °C which is below the dew point of sulfuric acid.61 Srivastava et al.61 suggest that SO2 in exhaust is oxidized to SO3 which then reacts with the water to form a fine mist of sulfuric acid (SA) droplets. A similar hypothesis was posed by Yang et al.41 who measured PM emissions from a container ship equipped with a WS system and observed low PM removal efficiencies. The authors propose that small SA particles formed within the WS do not to diffuse to water droplets’ surfaces to be absorbed.41 Follow-up experiments using the WS system with HVO and a new batch of HGO (FSC = 0.28%) under different engine load conditions indicate that the primary particle mode depends on FSC and engine load. A link between measured SO2 concentrations, which is used as a proxy for S-containing compounds in the exhaust including SO3, and the formation and magnitude of this mode was observed (see Fig. S7†). Moreover, the primary particle mode did not appear when the WS was used with HVO exhaust (Fig. S8†).
It has been shown that the particle removal efficiency of WS systems increases with increasing particle aerodynamic diameter.39 However, small particles formed within the WS may not grow large enough to be removed efficiently.42 Tests of the scrubber itself demonstrate that absent an exhaust flow it is not a significant source of particles (Fig. S9†). Results obtained from a test using heated air and the WS are presented in Fig. S9.† In this case, there is a unimodal distribution that peaks around 10 nm but the total number concentration is more than four orders of magnitude less than that observed in experiments with scrubbed exhaust. Low background particle number concentrations from water spraying and the results shown in Fig. S7 and S8† indicate that particles in this mode are not artificial sea spray aerosol and are rather formed through secondary processes.
In the bimodal distributions the secondary mode is located between 59 (SWSl) and 70 nm (FWSh) where FWSh had the sampling periods with the highest measured CO2 concentration (8.05%). Under these conditions the nucleation mode appears reduced relative to other scrubber cases and the secondary peak appears shifted to larger sizes by ≈10 nm. The CO2 rich FWSh are also the only scrubber experiments that show a substantially different peak ratio. Given the generally consistent scrubber results it is likely the unique FWSh measurements are altered due to engine conditions and are not related to the scrubbing water composition. The dilution ratios during WS experiments varied between 73 and 126, and during FWSh the average dilution ratio was 81. The relatively larger and shifted secondary mode may indicate that in these conditions primary particles grow via continued condensation and coagulation, and therefore such emissions might include primary soot coated with compounds of different volatilities. The final mixing state of particles is undetermined, but future work will focus on illuminating such details.
Total particle number concentrations were generally higher in all WS cases compared to unscrubbed cases (Table 2 and Fig. 2f). In all comparisons we observed increases in number concentration ranging from 38% to 87% that result from new primary mode particles. Although this WS does not efficiently remove particles ≥30 nm, in part due to its laboratory-scale dimensions that limit the residence time and therefore particle growth, thus impacting removal efficiency – such issues also arise with full-sized, ship-based installations that are not designed to optimize particulate removal.39,41,42 It is also important to note that in previous experiments with the same engine where Anderson et al.8 measured comparable EFPN for distilled fuels similar to those used in our experiments, they also observed strong increases in EFPN (≥10×) for less distilled fuels than we have used here. Thus, those without scrubbing observations might be further amplified when a WS is inserted to achieve regulatory compliance.8
3.2 Effective density measurements
Effective densities calculated from the tandem DMA-AAC measurements are presented in Fig. 3a and plotted with the measurement uncertainty. In these calculations, uncertainty in dmo and/or dae is quickly amplified by the cubic nature of their ratios (eqn (4)) and was therefore carefully evaluated in idealized laboratory experiments using polystyrene latex beads, sodium chloride and ammonium sulfate particles (Fig. S2†). A general decreasing trend for ρeff with increasing dmo was observed. This observation is in-line with previous studies that characterize ρeff of diesel exhaust particles.34,51,62,65 | ||
| Fig. 3 (a) Effective densities (ρeff) determined for the three fuels (HGO, MGO and HVO) as well as both WS cases using HGO and either sea- (SWS) or freshwater (FWS) plotted as a function of mobility diameter with the measurement uncertainty given by the whiskered error bars. The mass-mobility power law fittings are shown as dotted lines with the resulting fractal dimensions (Dm) given in the legend. (b) Fitting results are replotted for comparison with published size-resolved effective densities, measured for particles emerging from compression ignition engines. Park et al.51 conducted measurements on John Deere (10% and 50% engine loads) and Volkswagen (idling) diesel engines using fuels with different FSC. Rissler et al.62 investigated low FSC fuels using a heavy duty test-bench diesel engine and a light duty Euro II vehicle. Corbin et al.34 used a 80 kW, 4-stroke marine diesel engine with HFO and MGO. The black solid line represents the universal fit proposed by Olfert and Rogak.63 Momenimovahed et al.64 are from IFO (FSC = 0.8%) and low FSC DIN EN 590 diesel fuel oil (diesel) particles using a marine test-bed engine. The fit-uncertainty represented by measurement uncertainty is now depicted using the color shading. | ||
The lowest observed ρeff resulted from MGO and HVO, both with ρeff = 0.91 and 0.91 g cm−3 at dmo of 50 nm and 0.53 and 0.52 g cm−3 at 150 nm respectively. For HGO ρeff = 1.01 and 0.65 g cm−3 at 50 and 150 nm respectively. A similar trend with respect to FSC was previously observed by Park et al.51 who measured ρeff for diesel engines using fuels with FSCs of 0.0036% and 0% at idling conditions (Fig. 3b). An increase in ρeff for exhaust particles from fuels with higher FSCs can be attributed to sulfates and sulfuric acid which can partition into the particle phase via condensation.34,51,66 FWS and SWS yielded the largest ρeff with 1.14 g cm−3 (FWS) and 1.18 g cm−3 (SWS) at 50 nm and 0.78 g cm−3 (FWS) and 0.81 g cm−3 (SWS) at 150 nm, similar to the trends in effective densities observed for the other fuel types. Higher effective densities for FWS and SWS may derive from greater amounts of condensed material and also from restructuring of the particles themselves. Lieke et al.43 investigated effects of an exhaust gas recirculation scrubber system and observed an increase in exhaust particles’ fractal dimension as a result of a restructuring and densification, attributed to the abundance of water vapor and hygroscopic growth. They also found that particle mixing-state was affected and that the fraction of sulfates and salts increased when compared to pre-scrubbed particles.43 In our experiments slightly greater ρeff was observed for particles emerging from the SWS, which might result from salts and other compounds in the seawater that partition into the particle phase. However, the differences from FWS particles were not significant, and lay within the envelope of measurement uncertainty, suggesting that the scrubber water composition does not strongly affect emissions.
Studies investigating ρeff of ship exhaust particles remain limited. In Fig. 3b published results for ρeff of diesel engine exhaust particles34,51,62,64 are collected and replotted for comparison with our measurements. Our measured values agree well with the previous measurements. Corbin et al.34 analyzed the ρeff of particles emitted from a marine diesel engine burning HFO (ρeff = 1.46 ± 0.05 g cm−3) and MGO (ρeff = 0.89 ± 0.03 g cm−3) and found a similar FSC dependence but did not observe ρeff to vary with particle size. While different engine loads were tested by Corbin et al.34 it is not clear at which engine load ρeff measurements were performed. It is therefore difficult to conclude whether higher engine loads and consequently, larger amounts of gaseous SOx are responsible for the, comparably, large ρeff of HFO. The FSC of HFO used by Corbin et al.34 was 2.33% and thus substantially larger than the FSC of HGO.67 By comparison, Petzold et al.32 calculated ρeff = 1.385 ± 0.007 g cm−3 for exhaust particles from a large marine four-stroke engine utilizing HFO with a FSC of 2.21%. Importantly, HFO differs significantly from marine distillate fuels in its physicochemical characteristics, which affects the chemical composition of exhaust particles.27 Two cases from Momenimovahed et al.64 who used a marine test-bed engine are also shown in Fig. 3b. Similar to HFO in Corbin et al.34 intermediate fuel oil (IFO) particles yield relatively large ρeff, which is hypothesized to arise from the presence of heavy metals in the particulate phase. Conversely, diesel oil particles display an increasing trend of ρeff with dmo which highlights the range of ρeff values obtained for exhaust particles using different marine fuels and engine types.64 Olfert and Rogak63 reviewed and summarized effective density measurements of fresh soot particles from different sources and derived a universal fit that is represented by the solid black line in Fig. 3b. Although, values from our study generally display larger ρeff values than the universal fit, they are consistent with data points from compression ignition engines.63 In addition, Olfert and Rogak63 only included data from soot particles stripped of, or with relatively low amounts of, volatile material. Our experiments and the data points presented from the literature represent undenuded particles. Consequently, the positive bias with respect to Olfert and Rogak63 is expected, as condensation of volatile material leads to an increase in ρeff compared to denuded particles.
The Dm for HGO, FWS and SWS were 2.62, 2.67, and 2.66 respectively and larger than the Dm of MGO and HVO (2.53 and 2.51). These values agree with earlier studies of diesel exhaust particles,51,62,66 and support the idea that more sulfate, the formation of sulfuric acid and the consequent partitioning into the particulate phase, also leads to more dense particulate. For example, Olfert et al.66 observed an increase in Dm from 2.22–2.48 to 2.47–2.76 when switching to higher engine loads and attributed this to elevated gaseous sulfate. It remains to be determined how diverse scrubbing conditions might affect particulate ρeff, but our observations show that scrubbing leads to densification.
3.3 PM emissions
Number distributions are converted to mass distributions using the SMPS size channel mid-point diameters and ρeff, where for dmo ≤ 50 nm a constant ρeff = ρeff,50nm is employed. The mass distributions are integrated and scaled for the dilution etc., to determine the mass concentrations of emitted nanoparticles (Table 2). The results show that switching to low FSC fuels potentially reduces particle emissions by mass on the order of 21% (HGOhvs. MGO) to 33% (HGOlvs. HVO), which can be largely attributed to the change in particle density and variability in combustion conditions. When using the scrubber although both ρeff and particle emissions by number are increased, the total emitted mass was generally reduced relative to the unscrubbed cases. The new, small particles that appear within the primary mode of the WS cases tend to contribute little mass relative to what is lost from the larger particle fraction. In Fig. 4a average HGOl and FWSl PSDs observed from almost matching engine operating conditions, and their difference spectrum (Δ, black line) shows that the scrubber removes some particles above 50 nm, although these reductions lie within the ranges of uncertainty and thus, we cannot exclude whether a slight change in combustion conditions, indicated by an increase in CO2 concentration, for FWSl would eliminate the observed PN reduction above 50 nm. The lone exceptions to the observed mass reductions were FWSh experiments, where the secondary particle mode remained pronounced. These observations are valid for submicron exhaust particle emissions but we cannot exclude that there may be also particles with diameters above 1 μm in the exhaust gas.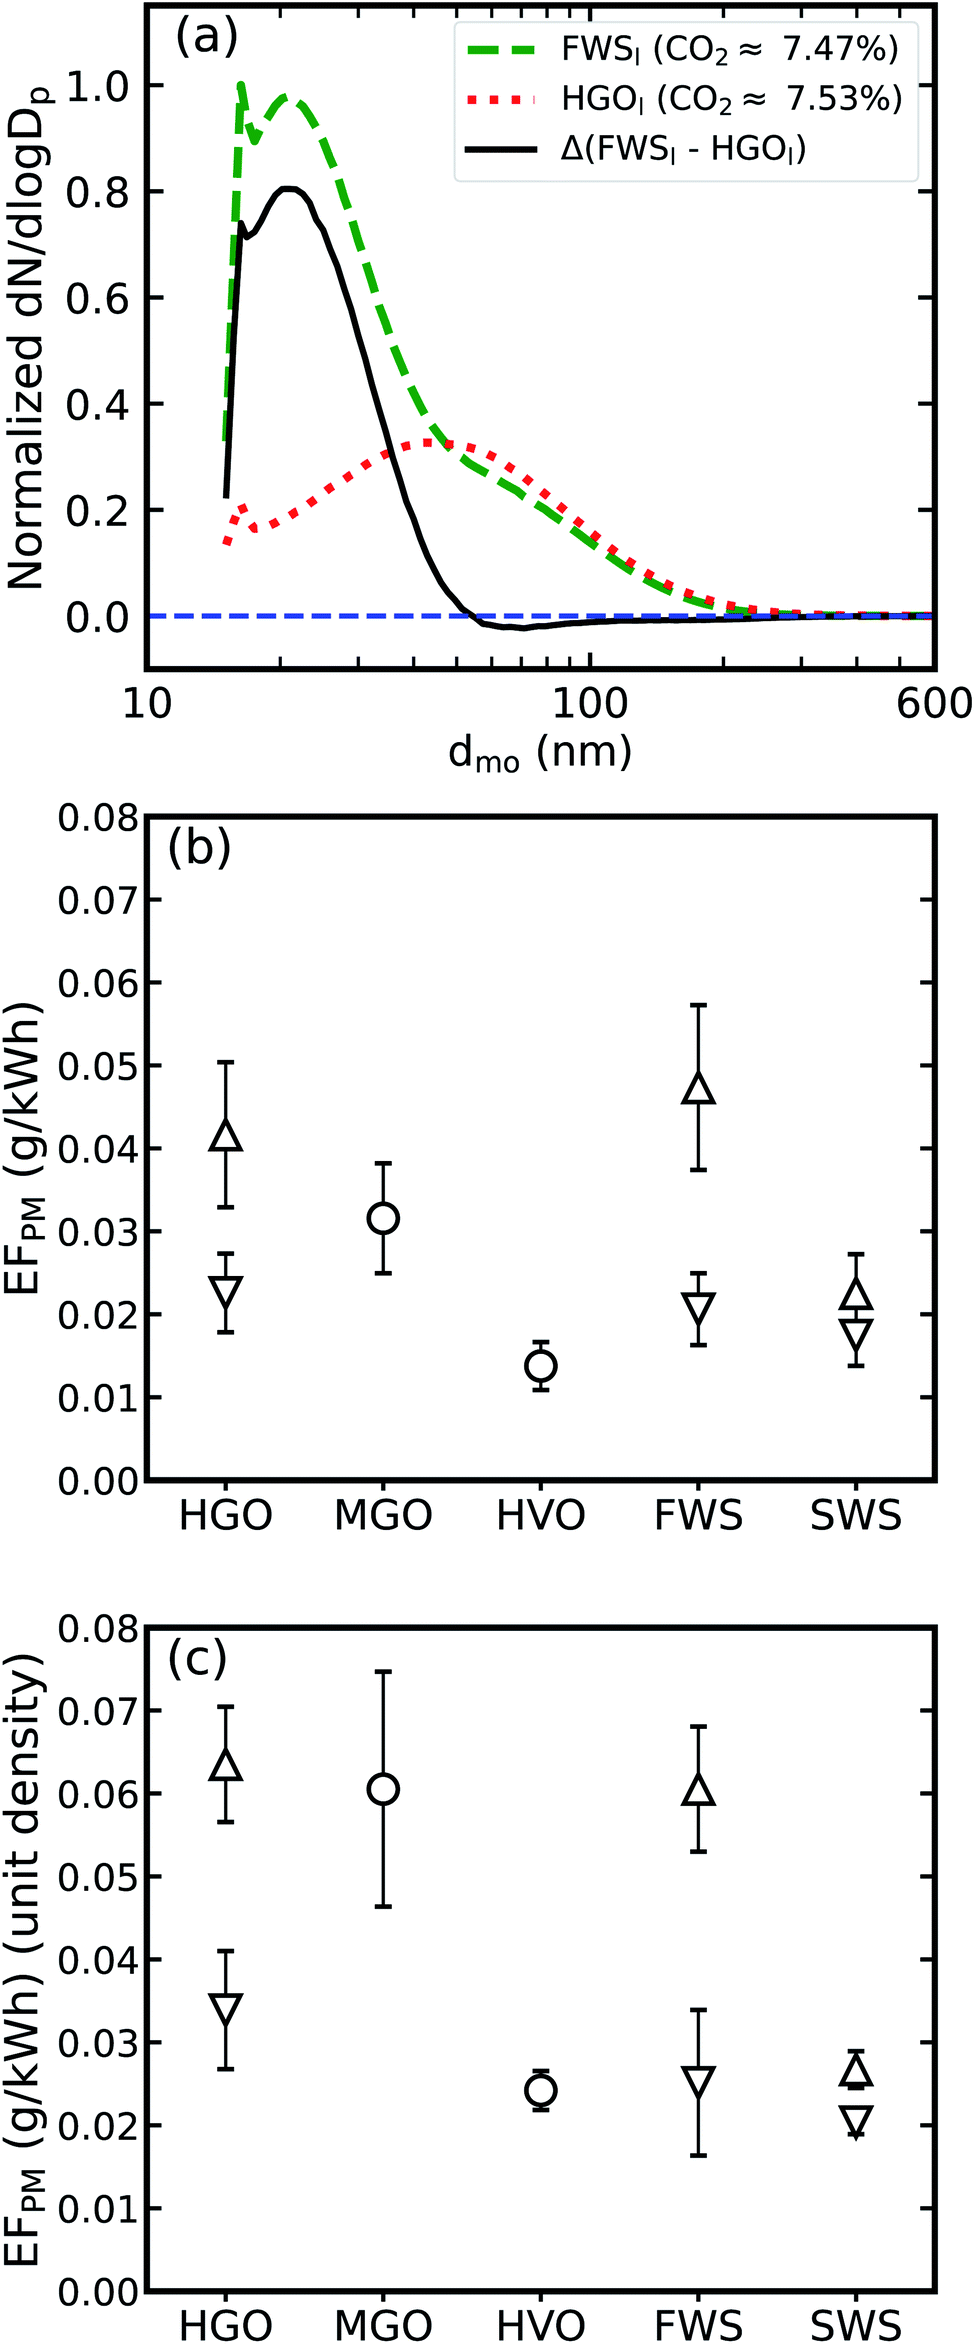 | ||
| Fig. 4 (a) Particle number spectra for HGOl and FWSl experiments with comparable engine conditions and their difference spectrum. (b) PM emission factors (EFPM) calculated using eqn (1) and ρeff,MB values. Systematic uncertainty was calculated following Tavakoli and Olfert50 and Momenimovahed and Olfert.57 (c) EFPM calculated using a size independent particle density of 1 g cm−3. In this case, uncertainties are given as ± two standard deviations. HGO, HVO and MGO refer to the combustion of the respective fuels, whereas FWS and SWS indicate HGO combustion in conjunction with wet scrubbing using either sea- (SWS) or freshwater (FWS). Observed differences in combustion conditions for HGO, FWS and SWS are denoted by downward triangles for relatively low CO2 concentrations, HGOl, and upward triangles for relatively high CO2 concentrations, HGOh. | ||
Emission factors calculated from eqn (1) are shown in Fig. 4b, c and Table 2. The measured values are qualitatively comparable with previous measurements by Anderson et al.8 who calculated EFPM between 0.67 and 2.13 × 10⁻² g (kW h)−1 for two low FSC distillate fuels and marine diesel oil (MDO) at engine loads of 25% and 35% – when assuming unit density (cf., Fig. 4c). However, considering both the previous observations and our new observations, no clear trend of EFPM with the level of fuel refinement emerges. Rather Fig. 4b and c suggests that variability in combustion conditions may have affected mass emissions as well as fuel changes or scrubbing (i.e., compare relative differences between upward and downward triangle symbols versus the differences between fuels). Moreover, as with other parameters mass emissions appear weakly correlated with scrubber water composition. It is, however, important to note that the particle density is a key determinant to accurately calculating the EFPM (compare Fig. 4b and c). In this case the trend, or lack of trend, between fuels is not significantly affected, but in most cases the absolute values are shifted. Furthermore, an increase in EFPM when assuming unit density was observed for all cases. Whereas the increase in EFPM for both SWS cases ranged from 17% to 19%, EFPM increased by 92% for MGO. On average EFPM were ≈48% larger compared to values estimated using case-dependent ρeff data. This highlights the need for careful and transparent accounting of assumed particle properties when comparisons and/or inventory estimates are made. The discrepancy also supports the previous Liu et al.68 suggestion that robust estimates of PM emissions from online aerosol size spectrometers should utilize documented ρeff values.
4 Environmental implications
Combustion-related nanoparticles have particularly adverse effects on human health,69,70 and shipping is observed to enhance particle concentrations downwind of major transit corridors.71 Corbett et al.5 have shown that most mortality effects from shipping-related PM emissions are seen in Asia and near the European North Sea, a SECA where fuel switching and/or WS usage is mandatory. A report by IVL, the Swedish Environmental Research Institute,72 calculated that ships within the Port of Gothenburg consume ≈46 kilotons of fuel per year, and a later study projected that by 2040 annual PM emissions for the Port could be 14 tons of particles per year.73 Using average EFPM normalized by fuel consumption for each individual case, choices with regard to fuel compliance measures and scrubber usage may account for up to 35% of this total 2040 emission inventory. Given that this estimate is based on a bottom-up approach using a single test-bed engine and only includes emissions of particles below 1 μm, these values are likely conservative. Moreover, additional effects may amplify the impacts of ship emissions. Wu et al.35 observed increased emissions of reactive volatile organic compounds by ships at berth that can lead to ozone pollution and through oxidation pathways lead to the formation of secondary organic aerosols, and thus add complexity and potential health impacts downwind of ports and heavily transited areas. Passig et al.74 measured health-relevant metals in exhaust particles of ships equipped with WS, which are generally associated with combustion of residual fuel oils such as HFO,55 at distances of more than 10 km, showing that long range transport of toxic wet scrubber exhaust particles poses a health risk.Moreover, observed differences in ρeff show that both compliance measures have secondary effects on exhaust particles, affecting their physicochemical properties which are key to understand the role of ship exhaust particles within the atmosphere and the climate system. Petzold et al.75 have shown that the ability of combustion particles to act as CCN increased significantly with increasing FSC due to the formation of sulphuric acid layers on the particulate. Moreover, the authors observed that the formation and presence of H2O–H2SO4 particles further enhanced CCN activity due to increased mass transfer of water-soluble material from the gas-to the particle-phase.75 Anything that changes the cloud forming potential of ship exhaust will possibly have amplified effects due to the radiative properties of clouds, and strong precipitation and cloud lifetime feedbacks. The Arctic is possibly the critical testbed of such feedbacks, because we already know that shipping activity is projected to increase in the Arctic given the steady sea ice retreat.76 In its current state the Arctic has very low background aerosol particle concentrations and the introduction of strong point source emissions like ships will have effects and potential feedbacks on radiative properties of Arctic mixed-phase clouds, and thus climate.77
5 Conclusions
Present IMO regulations are aimed at reducing global emissions of SOx and PM from the shipping sector. Ship operators can comply with regulations by using marine fuels with low FSC or by using high FSC fuels in conjunction with exhaust after treatment technologies, like wet scrubbers. However, particle emissions from marine diesel engines are not only driven by FSC.8,30,33 While our results show that FSC compliant marine distillate fuels reduce mass emissions of submicron exhaust particles compared to a non-compliant marine distillate fuel, PM emissions also appear to be very sensitive to variations in combustion conditions.The laboratory-based scrubber used in this study is capable of reaching IMO FSC regulation compliance when operated with a high sulfur content distillate fuel. When operated at compliance levels, exhaust that went through the scrubber did not efficiently reduce number of particles larger than 50 nm and simultaneously generates many more smaller diameter particles, ≈20 nm. Thus, a potentially small reduction in larger particles is offset by the large increase in total particle number concentration, and the effect on mass concentration of submicron particles is negligible. As previously mentioned, wet scrubber engineering is not regulated as long as they achieve emissions compliance and thus, our observations illuminate a potential risk for real-world scenarios, as increases in combustion-related ultrafine particulate may have unintended consequences. The results make clear the need for further investigations into particulate emissions from ships using WS technology, as well as more comprehensive regulations regarding the usage of WS on-board ships.
The choice of wet scrubbing as a fuel compliance measure can lead to other secondary effects on the particulate matter. Here we observe that WS usage results in increased effective densities. The shift is of the same magnitude but opposite in sign to density changes observed when using FSC compliant distillate fuels. Such secondary effects could imply, for example, an increase in the particulate mass fraction of water soluble compounds as well as changes in morphological properties of scrubbed particles, which can potentially influence atmospheric processes, such as affecting the water uptake and atmospheric lifetime of the exhaust particles. Raw, diesel exhaust particles are generally considered to have limited cloud forming potential, for example by acting as cloud condensation nuclei78 or as ice nucleating particles.18 The potential for denser particles with modified mixing states and chemical compositions to alter this behavior is a key future step of this research.
This study makes clear that not all pathways towards IMO fuel sulfur compliance have the same broad benefit of the simplest solution, which is the use of distilled, low FSC fuels. Solutions, like scrubber usage, may be detrimental by increasing emissions of ultrafine particulate and by changing the potential for exhaust particles to play new, unanticipated physicochemical roles in atmospheric processes. Given our observations it is important that future studies also examine physicochemical properties of exhaust particles, including their chemical compositions, morphologies, their abilities to act as cloud forming particles, et al., in order to evaluate how IMO compliance measures may alter the atmospheric fate of ship exhaust.
Conflicts of interest
There are no conflicts to declare.Acknowledgements
This research was funded by the Swedish Research Councils FORMAS (2017-00564) and VR (2013-05153, 2020-03497). EST and LS thank the Swedish Strategic Research Area MERGE for support.Notes and references
- N. Kuittinen, J.-P. Jalkanen, J. Alanen, L. Ntziachristos, H. Hannuniemi, L. Johansson, P. Karjalainen, E. Saukko, M. Isotalo, P. Aakko-Saksa, K. Lehtoranta, J. Keskinen, P. Simonen, S. Saarikoski, E. Asmi, T. Laurila, R. Hillamo, F. Mylläri, H. Lihavainen, H. Timonen and T. Rönkkö, Shipping Remains a Globally Significant Source of Anthropogenic PN Emissions Even after 2020 Sulfur Regulation, Environ. Sci. Technol., 2021, 55, 129–138 CrossRef CAS PubMed.
- J. Moldanová, E. Fridell, H. Winnes, S. Holmin-Fridell, J. Boman, A. Jedynska, V. Tishkova, B. Demirdjian, S. Joulie, H. Bladt, N. P. Ivleva and R. Niessner, Physical and chemical characterisation of PM emissions from two ships operating in European Emission Control Areas, Atmos. Meas. Tech., 2013, 6, 3577–3596 CrossRef.
- O. Sippula, B. Stengel, M. Sklorz, T. Streibel, R. Rabe, J. Orasche, J. Lintelmann, B. Michalke, G. Abbaszade, C. Radischat, T. Gröger, J. Schnelle-Kreis, H. Harndorf and R. Zimmermann, Particle Emissions from a Marine Engine: Chemical Composition and Aromatic Emission Profiles under Various Operating Conditions, Environ. Sci. Technol., 2014, 48, 11721–11729 CrossRef CAS PubMed.
- D. E. Schraufnagel, The health effects of ultrafine particles, Exp. Mol. Med., 2020, 52, 311–317 CrossRef CAS PubMed.
- J. J. Corbett, J. J. Winebrake, E. H. Green, P. Kasibhatla, V. Eyring and A. Lauer, Mortality from Ship Emissions: A Global Assessment, Environ. Sci. Technol., 2007, 41, 8512–8518 CrossRef CAS PubMed.
- J. J. Winebrake, J. J. Corbett, E. H. Green, A. Lauer and V. Eyring, Mitigating the health impacts of pollution from oceangoing shipping: An assessment of low-sulfur fuel mandates, Environ. Sci. Technol., 2009, 43, 4776–4782 CrossRef CAS PubMed.
- M. Anderson, K. Salo and E. Fridell, Particle- and Gaseous Emissions from an LNG Powered Ship, Environ. Sci. Technol., 2015, 49, 12568–12575 CrossRef CAS PubMed.
- M. Anderson, K. Salo, Å. M. Hallquist and E. Fridell, Characterization of particles from a marine engine operating at low loads, Atmos. Environ., 2015, 101, 65–71 CrossRef CAS.
- J. Alanen, M. Isotalo, N. Kuittinen, P. Simonen, S. Martikainen, H. Kuuluvainen, M. Honkanen, K. Lehtoranta, S. Nyyssönen, H. Vesala, H. Timonen, M. Aurela, J. Keskinen and T. Rönkkö, Physical Characteristics of Particle Emissions from a Medium Speed Ship Engine Fueled with Natural Gas and Low-Sulfur Liquid Fuels, Environ. Sci. Technol., 2020, 54, 5376–5384 CrossRef CAS PubMed.
- P. Eichler, M. Müller, C. Rohmann, B. Stengel, J. Orasche, R. Zimmermann and A. Wisthaler, Lubricating Oil as a Major Constituent of Ship Exhaust Particles, Environ. Sci. Technol. Lett., 2017, 4, 54–58 CrossRef CAS.
- N. Bellouin, J. Quaas, E. Gryspeerdt, S. Kinne, P. Stier, D. Watson-Parris, O. Boucher, K. S. Carslaw, M. Christensen, A. L. Daniau, J. L. Dufresne, G. Feingold, S. Fiedler, P. Forster, A. Gettelman, J. M. Haywood, U. Lohmann, F. Malavelle, T. Mauritsen, D. T. McCoy, G. Myhre, J. Mülmenstädt, D. Neubauer, A. Possner, M. Rugenstein, Y. Sato, M. Schulz, S. E. Schwartz, O. Sourdeval, T. Storelvmo, V. Toll, D. Winker and B. Stevens, Bounding Global Aerosol Radiative Forcing of Climate Change, Rev. Geophys., 2020, 58, 1–45 CrossRef PubMed.
- T. C. Bond, S. J. Doherty, D. W. Fahey, P. M. Forster, T. Berntsen, B. J. Deangelo, M. G. Flanner, S. Ghan, B. Kärcher, D. Koch, S. Kinne, Y. Kondo, P. K. Quinn, M. C. Sarofim, M. G. Schultz, M. Schulz, C. Venkataraman, H. Zhang, S. Zhang, N. Bellouin, S. K. Guttikunda, P. K. Hopke, M. Z. Jacobson, J. W. Kaiser, Z. Klimont, U. Lohmann, J. P. Schwarz, D. Shindell, T. Storelvmo, S. G. Warren and C. S. Zender, Bounding the role of black carbon in the climate system: A scientific assessment, J. Geophys. Res.: Atmos., 2013, 118, 5380–5552 CrossRef CAS.
- C. Wittbom, A. C. Eriksson, J. Rissler, J. E. Carlsson, P. Roldin, E. Z. Nordin, P. T. Nilsson, E. Swietlicki, J. H. Pagels and B. Svenningsson, Cloud droplet activity changes of soot aerosol upon smog chamber ageing, Atmos. Chem. Phys., 2014, 14, 9831–9854 CrossRef CAS.
- X. Pei, M. Hallquist, A. C. Eriksson, J. Pagels, N. M. Donahue, T. Mentel, B. Svenningsson, W. Brune and R. K. Pathak, Morphological transformation of soot: Investigation of microphysical processes during the condensation of sulfuric acid and limonene ozonolysis product vapors, Atmos. Chem. Phys., 2018, 18, 9845–9860 CrossRef CAS.
- M. W. Christensen, K. Suzuki, B. Zambri and G. L. Stephens, Ship track observations of a reduced shortwave aerosol indirect effect in mixed-phase clouds, Geophys. Res. Lett., 2014, 41, 6970–6977 CrossRef.
- A. Possner, E. Zubler, U. Lohmann and C. Schär, The resolution dependence of cloud effects and ship-induced aerosol-cloud interactions in marine stratocumulus, J. Geophys. Res., 2016, 121, 4810–4829 CrossRef CAS.
- A. Possner, A. M. Ekman and U. Lohmann, Cloud response and feedback processes in stratiform mixed-phase clouds perturbed by ship exhaust, Geophys. Res. Lett., 2017, 44, 1964–1972 CAS.
- E. S. Thomson, D. Weber, H. G. Bingemer, J. Tuomi, M. Ebert and J. B. C. Pettersson, Intensification of ice nucleation observed in ocean ship emissions, Sci. Rep., 2018, 8, 1111 CrossRef CAS PubMed.
- S. R. Stephenson, W. Wang, C. S. Zender, H. Wang, S. J. Davis and P. J. Rasch, Climatic Responses to Future Trans-Arctic Shipping, Geophys. Res. Lett., 2018, 45, 9898–9908 CrossRef PubMed.
- A. Gilgen, W. T. K. Huang, L. Ickes, D. Neubauer and U. Lohmann, How important are future marine and shipping aerosol emissions in a warming Arctic summer and autumn?, Atmos. Chem. Phys., 2018, 18, 10521–10555 CrossRef CAS.
- International Maritime Organisation, Revised MARPOL Annex VI - AMENDMENTS TO THE ANNEX OF THE PROTOCOL OF 1997 TO AMEND THE INTERNATIONAL CONVENTION FOR THE PREVENTION OF POLLUTION FROM SHIPS, 1973, AS MODIFIED BY THE PROTOCOL OF 1978 RELATING THERETO (MEPC.176(58)), 2008 Search PubMed.
- K. Oikawa, C. Yongsiri, K. Takeda and T. Harimoto, Seawater flue gas desulfurization: Its technical implications and performance results, Environ. Prog., 2003, 22, 67–73 CrossRef CAS.
- A. Andreasen and S. Mayer, Use of seawater scrubbing for SO2 removal from marine engine exhaust gas, Energy Fuels, 2007, 21, 3274–3279 CrossRef CAS.
- E. Ytreberg, I. M. Hassellöv, A. T. Nylund, M. Hedblom, A. Y. Al-Handal and A. Wulff, Effects of scrubber washwater discharge on microplankton in the Baltic Sea, Mar. Pollut. Bull., 2019, 145, 316–324 CrossRef CAS PubMed.
- J. Teuchies, T. J. Cox, K. Van Itterbeeck, F. J. Meysman and R. Blust, The impact of scrubber discharge on the water quality in estuaries and ports, Environ. Sci. Eur., 2020, 32, 130 CrossRef.
- S. Ushakov, D. Stenersen, P. M. Einang and T. Ø. Ask, Meeting future emission regulation at sea by combining low-pressure EGR and seawater scrubbing, J. Mar. Sci. Technol., 2020, 25, 482–497 CrossRef.
- M. Zetterdahl, J. Moldanová, X. Pei, R. K. Pathak and B. Demirdjian, Impact of the 0.1% fuel sulfur content limit in SECA on particle and gaseous emissions from marine vessels, Atmos. Environ., 2016, 145, 338–345 CrossRef CAS.
- K. Lehtoranta, P. Aakko-Saksa, T. Murtonen, H. Vesala, L. Ntziachristos, T. Rönkkö, P. Karjalainen, N. Kuittinen and H. Timonen, Particulate Mass and Nonvolatile Particle Number Emissions from Marine Engines Using Low-Sulfur Fuels, Natural Gas, or Scrubbers, Environ. Sci. Technol., 2019, 53, 3315–3322 CrossRef CAS PubMed.
- D. A. Lack, J. J. Corbett, T. Onasch, B. Lerner, P. Massoli, P. K. Quinn, T. S. Bates, D. S. Covert, D. Coffman, B. Sierau, S. Herndon, J. Allan, T. Baynard, E. Lovejoy, A. R. Ravishankara and E. Williams, Particulate emissions from commercial shipping: Chemical, physical, and optical properties, J. Geophys. Res.: Atmos., 2009, 114, 1–16 CrossRef.
- D. A. Lack, C. D. Cappa, J. Langridge, R. Bahreini, G. Buffaloe, C. Brock, K. Cerully, D. Coffman, K. Hayden, J. Holloway, B. Lerner, P. Massoli, S.-M. Li, R. McLaren, A. M. Middlebrook, R. Moore, A. Nenes, I. Nuaaman, T. B. Onasch, J. Peischl, A. Perring, P. K. Quinn, T. Ryerson, J. P. Schwartz, R. Spackman, S. C. Wofsy, D. Worsnop, B. Xiang and E. Williams, Impact of Fuel Quality Regulation and Speed Reductions on Shipping Emissions: Implications for Climate and Air Quality, Environ. Sci. Technol., 2011, 45, 9052–9060 CrossRef CAS PubMed.
- Å. M. Jonsson, J. Westerlund and M. Hallquist, Size-resolved particle emission factors for individual ships, Geophys. Res. Lett., 2011, 38, 1–5 CrossRef.
- A. Petzold, E. Weingartner, J. Hasselbach, P. Lauer, C. Kurok and F. Fleischer, Physical Properties, Chemical Composition, and Cloud Forming Potential of Particulate Emissions from a Marine Diesel Engine at Various Load Conditions, Environ. Sci. Technol., 2010, 44, 3800–3805 CrossRef CAS PubMed.
- A. Petzold, P. Lauer, U. Fritsche, J. Hasselbach, M. Lichtenstern, H. Schlager and F. Fleischer, Operation of Marine Diesel Engines on Biogenic Fuels: Modification of Emissions and Resulting Climate Effects, Environ. Sci. Technol., 2011, 45, 10394–10400 CrossRef CAS PubMed.
- J. C. Corbin, S. M. Pieber, H. Czech, M. Zanatta, G. Jakobi, D. Massabò, J. Orasche, I. El Haddad, A. A. Mensah, B. Stengel, L. Drinovec, G. Mocnik, R. Zimmermann, A. S. Prévôt and M. Gysel, Brown and Black Carbon Emitted by a Marine Engine Operated on Heavy Fuel Oil and Distillate Fuels: Optical Properties, Size Distributions, and Emission Factors, J. Geophys. Res.: Atmos., 2018, 123, 6175–6195 CrossRef CAS.
- Z. Wu, Y. Zhang, J. He, H. Chen, X. Huang, Y. Wang, X. Yu, W. Yang, R. Zhang, M. Zhu, S. Li, H. Fang, Z. Zhang and X. Wang, Dramatic increase in reactive volatile organic compound (VOC) emissions from ships at berth after implementing the fuel switch policy in the Pearl River Delta Emission Control Area, Atmos. Chem. Phys., 2020, 20, 1887–1900 CrossRef CAS.
- A. T. Anastasopolos, U. M. Sofowote, P. K. Hopke, M. Rouleau, T. Shin, A. Dheri, H. Peng, R. Kulka, M. D. Gibson, P.-M. Farah and N. Sundar, Air quality in Canadian port cities after regulation of low-sulphur marine fuel in the North American Emissions Control Area, Sci. Total Environ., 2021, 791, 147949 CrossRef CAS PubMed.
- T. Gronholm, T. Makela, J. Hatakka, J. P. Jalkanen, J. Kuula, T. Laurila, L. Laakso and J. Kukkonen, Evaluation of Methane Emissions Originating from LNG Ships Based on the Measurements at a Remote Marine Station, Environ. Sci. Technol., 2021, 55, 13677–13686 CrossRef CAS PubMed.
- E. Fridell and K. Salo, Measurements of abatement of particles and exhaust gases in a marine gas scrubber, Proc. Inst. Mech. Eng., Part M, 2016, 230, 154–162 CrossRef.
- J. Zhou, S. Zhou and Y. Zhu, Characterization of Particle and Gaseous Emissions from Marine Diesel Engines with Different Fuels and Impact of After-Treatment Technology, Energies, 2017, 10, 1110 CrossRef.
- H. Winnes, E. Fridell and J. Moldanová, Effects of marine exhaust gas scrubbers on gas and particle emissions, J. Mar. Sci. Eng., 2020, 8, 299 CrossRef.
- J. Yang, T. Tang, Y. Jiang, G. Karavalakis, T. D. Durbin, J. Wayne Miller, D. R. Cocker and K. C. Johnson, Controlling emissions from an ocean-going container vessel with a wet scrubber system, Fuel, 2021, 304, 121323 CrossRef CAS.
- International Maritime Organisation, Environmental Impact Evaluation of Marine Exhaust Gas Cleaning Systems (Scrubbers): A Critical Literature Review (MEPC 74/INF.10), 2019 Search PubMed.
- K. I. Lieke, T. Rosenørn, J. Pedersen, D. Larsson, J. Kling, K. Fuglsang and M. Bilde, Micro- and Nanostructural Characteristics of Particles Before and After an Exhaust Gas Recirculation System Scrubber, Aerosol Sci. Technol., 2013, 47, 1038–1046 CrossRef CAS.
- A. A. Aliabadi, J. L. Thomas, A. B. Herber, R. M. Staebler, W. R. Leaitch, H. Schulz, K. S. Law, L. Marelle, J. Burkart, M. D. Willis, H. Bozem, P. M. Hoor, F. Köllner, J. Schneider, M. Levasseur and J. P. Abbatt, Ship emissions measurement in the Arctic by plume intercepts of the Canadian Coast Guard icebreaker Amundsen from the Polar 6 aircraft platform, Atmos. Chem. Phys., 2016, 16, 7899–7916 CrossRef CAS.
- International Maritime Organisation, Guidelines for exhaust gas cleaning systems (MEPC.259(68)), 2015 Search PubMed.
- Kristineberg Marine Research Station Homepage, 2022, https://www.gu.se/en/kristineberg/about-us, accessed February 2022 Search PubMed.
- L. Mueller, G. Jakobi, H. Czech, B. Stengel, J. Orasche, J. M. Arteaga-Salas, E. Karg, M. Elsasser, O. Sippula, T. Streibel, J. G. Slowik, A. S. Prevot, J. Jokiniemi, R. Rabe, H. Harndorf, B. Michalke, J. Schnelle-Kreis and R. Zimmermann, Characteristics and temporal evolution of particulate emissions from a ship diesel engine, Appl. Energy, 2015, 155, 204–217 CrossRef CAS.
- IVL Swedish Environmental Research Institute, Scrubbers: Closing the loop Activity 3: Task 1 Air emission measurements (No. B 2318), 2018, https://www.ivl.se/download/18.34244ba71728fcb3f3f902/1591705290431/B2318.pdf, accessed February 2022 Search PubMed.
- W. C. Hinds, Aerosol Technology: Properties, Behavior, and Measurement of Airborne Particles, Wiley, New York, 2nd edn., 1999 Search PubMed.
- F. Tavakoli and J. S. Olfert, Determination of particle mass, effective density, mass-mobility exponent, and dynamic shape factor using an aerodynamic aerosol classifier and a differential mobility analyzer in tandem, J. Aerosol Sci., 2014, 75, 35–42 CrossRef CAS.
- K. Park, F. Cao, D. B. Kittelson and P. H. McMurry, Relationship between particle mass and mobility for diesel exhaust particles, Environ. Sci. Technol., 2003, 37, 577–583 CrossRef CAS PubMed.
- M. M. Maricq and N. Xu, The effective density and fractal dimension of soot particles from premixed flames and motor vehicle exhaust, J. Aerosol Sci., 2004, 35, 1251–1274 CrossRef CAS.
- P. F. DeCarlo, J. G. Slowik, D. R. Worsnop, P. Davidovits and J. L. Jimenez, Particle morphology and density characterization by combined mobility and aerodynamic diameter measurements. Part 1: Theory, Aerosol Sci. Technol., 2004, 38, 1185–1205 CrossRef CAS.
- E. Fridell, E. Steen and K. Peterson, Primary particles in ship emissions, Atmos. Environ., 2008, 42, 1160–1168 CrossRef CAS.
- O. Popovicheva, E. Kireeva, N. Shonija, N. Zubareva, N. Persiantseva, V. Tishkova, B. Demirdjian, J. Moldanová and V. Mogilnikov, Ship particulate pollutants: Characterization in terms of environmental implication, J. Environ. Monit., 2009, 11, 2077–2086 RSC.
- J. Moldanová, E. Fridell, O. Popovicheva, B. Demirdjian, V. Tishkova, A. Faccinetto and C. Focsa, Characterisation of particulate matter and gaseous emissions from a large ship diesel engine, Atmos. Environ., 2009, 43, 2632–2641 CrossRef.
- A. Momenimovahed and J. S. Olfert, Effective Density and Volatility of Particles Emitted from Gasoline Direct Injection Vehicles and Implications for Particle Mass Measurement, Aerosol Sci. Technol., 2015, 49, 1051–1062 CrossRef CAS.
- D. Wu, Q. Li, X. Ding, J. Sun, D. Li, H. Fu, M. Teich, X. Ye and J. Chen, Primary Particulate Matter Emitted from Heavy Fuel and Diesel Oil Combustion in a Typical Container Ship: Characteristics and Toxicity, Environ. Sci. Technol., 2018, 52, 12943–12951 CrossRef CAS PubMed.
- M. Lemmetty, L. Pirjola, J. M. Mäkelä, T. Rönkkö and J. Keskinen, Computation of maximum rate of water-sulphuric acid nucleation in diesel exhaust, J. Aerosol Sci., 2006, 37, 1596–1604 CrossRef CAS.
- J. Schneider, N. Hock, S. Weimer, S. Borrmann, U. Kirchner, R. Vogt and V. Scheer, Nucleation particles in diesel exhaust: Composition inferred from in situ mass spectrometric analysis, Environ. Sci. Technol., 2005, 39, 6153–6161 CrossRef CAS PubMed.
- R. K. Srivastava, C. A. Miller, C. Erickson and R. Jambhekar, Emissions of sulfur trioxide from coal-fired power plants, J. Air Waste Manage. Assoc., 2004, 54, 750–762 CrossRef CAS PubMed.
- J. Rissler, M. E. Messing, A. I. Malik, P. T. Nilsson, E. Z. Nordin, M. Bohgard, M. Sanati and J. H. Pagels, Effective density characterization of soot agglomerates from various sources and comparison to aggregation theory, Aerosol Sci. Technol., 2013, 47, 792–805 CrossRef CAS.
- J. Olfert and S. Rogak, Universal relations between soot effective density and primary particle size for common combustion sources, Aerosol Sci. Technol., 2019, 53, 485–492 CrossRef CAS.
- A. Momenimovahed, S. Gagné, Z. Gajdosechova, J. C. Corbin, G. J. Smallwood, Z. Mester, B. Behrends, V. Wichmann and K. A. Thomson, Effective density and metals content of particle emissions generated by a diesel engine operating under different marine fuels, J. Aerosol Sci., 2021, 151, 1–15 CrossRef.
- U. Trivanovic, J. C. Corbin, A. Baldelli, W. Peng, J. Yang, P. Kirchen, J. W. Miller, P. Lobo, S. Gagné and S. N. Rogak, Size and morphology of soot produced by a dual-fuel marine engine, J. Aerosol Sci., 2019, 138, 105448 CrossRef CAS.
- J. S. Olfert, J. P. Symonds and N. Collings, The effective density and fractal dimension of particles emitted from a light-duty diesel vehicle with a diesel oxidation catalyst, J. Aerosol Sci., 2007, 38, 69–82 CrossRef CAS.
- J. C. Corbin, A. A. Mensah, S. M. Pieber, J. Orasche, B. Michalke, M. Zanatta, H. Czech, D. Massabò, F. Buatier De Mongeot, C. Mennucci, I. El Haddad, N. K. Kumar, B. Stengel, Y. Huang, R. Zimmermann, A. S. Prévôt and M. Gysel, Trace Metals in Soot and PM2.5 from Heavy-Fuel-Oil Combustion in a Marine Engine, Environ. Sci. Technol., 2018, 52, 6714–6722 CrossRef CAS PubMed.
- Z. Liu, J. Swanson, D. B. Kittelson and D. Y. H. Pui, Comparison of Methods for Online Measurement of Diesel Particulate Matter, Environ. Sci. Technol., 2012, 46, 6127–6133 CrossRef CAS PubMed.
- C. Arden Pope III and D. W. Dockery, Health Effects of Fine Particulate Air Pollution: Lines that Connect, J. Air Waste Manage. Assoc., 2006, 56, 709–742 CrossRef PubMed.
- P. Kumar, A. Wiedensohler, W. Birmili, P. Quincey and M. Hallquist, The Quality of Air, Elsevier, 2016,vol. 73, pp. 369–390 Search PubMed.
- N. Kivekäs, A. Massling, H. Grythe, R. Lange, V. Rusnak, S. Carreno, H. Skov, E. Swietlicki, Q. T. Nguyen, M. Glasius and A. Kristensson, Contribution of ship traffic to aerosol particle concentrations downwind of a major shipping lane, Atmos. Chem. Phys., 2014, 14, 8255–8267 CrossRef.
- IVL Swedish Environmental Research Institute, Energy efficient port calls - A study of Swedish shipping with international outlooks (No. C 212), 2016, https://www.ivl.se/download/18.34244ba71728fcb3f3fa0d/1591705619737/C212.pdf, accessed April 2021 Search PubMed.
- M. O. Ramacher, L. Tang, J. Moldanová, V. Matthias, M. Karl, E. Fridell and L. Johansson, The impact of ship emissions on air quality and human health in the Gothenburg area - Part II: Scenarios for 2040, Atmos. Chem. Phys., 2020, 20, 10667–10686 CrossRef CAS.
- J. Passig, J. Schade, R. Irsig, L. Li, X. Li, Z. Zhou, T. Adam and R. Zimmermann, Detection of ship plumes from residual fuel operation in emission control areas using single-particle mass spectrometry, Atmos. Meas. Tech., 2021, 14, 4171–4185 CrossRef CAS.
- A. Petzold, M. Gysel, X. Vancassel, R. Hitzenberger, H. Puxbaum, S. Vrochticky, E. Weingartner, U. Baltensperger and P. Mirabel, On the effects of organic matter and sulphur-containing compounds on the CCN activation of combustion particles, Atmos. Chem. Phys., 2005, 5, 3187–3203 CrossRef CAS.
- G. P. Peters, T. B. Nilssen, L. Lindholt, M. S. Eide, S. Glomsrød, L. I. Eide and J. S. Fuglestvedt, Future emissions from shipping and petroleum activities in the Arctic, Atmos. Chem. Phys., 2011, 11, 5305–5320 CrossRef CAS.
- T. Mauritsen, J. Sedlar, M. Tjernström, C. Leck, M. Martin, M. Shupe, S. Sjogren, B. Sierau, P. O. Persson, I. M. Brooks and E. Swietlicki, An Arctic CCN-limited cloud-aerosol regime, Atmos. Chem. Phys., 2011, 11, 165–173 CrossRef CAS.
- K. A. Koehler, P. J. DeMott, S. M. Kreidenweis, O. B. Popovicheva, M. D. Petters, C. M. Carrico, E. D. Kireeva, T. D. Khokhlova and N. K. Shonija, Cloud condensation nuclei and ice nucleation activity of hydrophobic and hydrophilic soot particles, Phys. Chem. Chem. Phys., 2009, 11, 7906–7920 RSC.
Footnote |
| † Electronic supplementary information (ESI) available. See https://doi.org/10.1039/d2em00054g |
| This journal is © The Royal Society of Chemistry 2022 |