
 Open Access Article
 This Open Access Article is licensed under a
 Creative Commons Attribution 3.0 Unported Licence
Mercury in air and soil on an urban-rural transect in East Africa†
Maja
Nipen
 *ab,
Susanne Jøntvedt
Jørgensen
a,
Pernilla
Bohlin-Nizzetto
b,
Katrine
Borgå
c,
Knut
Breivik
ab,
Aviti John
Mmochi
d,
Eliezer Brown
Mwakalapa
e,
M. Isabel
Quant
f,
Martin
Schlabach
b,
Rolf David
Vogt
g and
Frank
Wania
f
*ab,
Susanne Jøntvedt
Jørgensen
a,
Pernilla
Bohlin-Nizzetto
b,
Katrine
Borgå
c,
Knut
Breivik
ab,
Aviti John
Mmochi
d,
Eliezer Brown
Mwakalapa
e,
M. Isabel
Quant
f,
Martin
Schlabach
b,
Rolf David
Vogt
g and
Frank
Wania
f
aCentre for Biogeochemistry in the Anthropocene, Department of Chemistry, University of Oslo, P.O. Box 1033, 0315 Oslo, Norway. E-mail: majanip@kjemi.uio.no; mni@nilu.no
bNILU-Norwegian Institute for Air Research, P.O. Box 100, 2027 Kjeller, Norway
cAquatic Biology and Toxicology and Centre for Biogeochemistry in the Anthropocene, Department of Biosciences, University of Oslo, P.O. Box 1066, 0316 Oslo, Norway
dInstitute for Marine Sciences, University of Dar Es Salaam, Zanzibar, Tanzania
eDepartment of Natural Sciences, Mbeya University of Science and Technology, Mbeya, Tanzania
fDepartment of Physical and Environmental Sciences, University of Toronto Scarborough, 1265, Military Trail, ON MIC 1A4 Toronto, Canada
gNorwegian Institute for Water Research, 0579 Oslo, Norway
First published on 18th May 2022
Abstract
There are large knowledge gaps concerning concentrations, sources, emissions, and spatial trends of mercury (Hg) in the atmosphere in developing regions of the Southern Hemisphere, particularly in urban areas. Filling these gaps is a prerequisite for assessing the effectiveness of international regulation and for enabling a better understanding of the global transport of Hg in the environment. Here we use a passive sampling technique to study the spatial distribution of gaseous elemental Hg (Hg(0), GEM) and assess emission sources in and around Dar es Salaam, Tanzania's largest city. Included in the study were the city's main municipal waste dumpsite and an e-waste processing facility as potential sources of GEM. To complement the GEM data and for a better overview of the Hg contamination status of Dar es Salaam, soil samples were collected from the same locations where passive air samplers were deployed and analysed for total Hg. Overall, GEM concentrations ranged between <0.86 and 5.34 ng m−3, indicating significant local sources within the urban area. The municipal waste dumpsite and e-waste site had GEM concentrations elevated above the background, at 2.41 and 1.77 ng m−3, respectively. Hg concentrations in soil in the region (range 0.0067 to 0.098 mg kg−1) were low compared to those of other urban areas and were not correlated with atmospheric GEM concentrations. This study demonstrates that GEM is a significant environmental issue in the urban region of Dar es Salaam. Further studies from urban areas in the Global South are needed to better identify sources of GEM.
Environmental significanceMost research on gaseous elemental mercury (GEM) in the atmosphere has been conducted in the Northern Hemisphere, while the available data on atmospheric GEM concentrations from the Southern Hemisphere, particularly from urban areas in sub-Saharan Africa, are very limited. At the same time, global emission estimates indicate increasing GEM emissions in Africa. We present here for the first time spatially resolved GEM concentrations across an urban area in the Southern Hemisphere (Dar es Salaam, Tanzania), determined using a passive sampling technique. Signs of significant GEM sources were observed in the urban area, but they remain unidentified. We therefore recommend further studies in this area and other urban areas in sub-Saharan Africa to gain further insight into emissions and sources of GEM. |
1 Introduction
Harmful effects of mercury (Hg) on human health and ecosystems have been thoroughly documented and have resulted in national, regional, and international regulation e.g., in the form of the Minamata Convention.1 This has led to declining Hg emissions to the environment in Europe and North America.2 On the global scale however, these declines are being offset by increased emissions in Asia and Africa.2 These temporal and spatial trends in Hg emissions are reflected in atmospheric Hg concentrations, where North America and Europe have seen declines.2,3 On the other hand, Hg concentrations at Cape Point in South Africa show signs of increasing concentrations during recent years.4,5Primary sources of Hg to the atmosphere include natural processes (i.e., rock weathering and volcanism), though these emissions are exceeded by anthropogenic emissions.6 Major anthropogenic sources of primary Hg emissions include fossil fuel combustion, artisanal and small-scale gold mining (ASGM), metal smelting, cement production, waste incineration, processing of e-waste, and burning of biomass.7–11 Most of these activities are conducted within urban areas, which are thus important source regions of atmospheric Hg. Hg also has secondary sources, in the form of re-emissions of legacy Hg from contaminated surface reservoirs.12
Hg in the form of gaseous elemental Hg (Hg(0), GEM) is globally distributed through atmospheric transport.12,13 Environmental monitoring of air is thus vital to assess the effectiveness of regulation. Monitoring of GEM has generally been conducted using active sampling techniques providing data on long-term temporal trends at a limited number of sites.14,15 Spatial coverage is however also of importance to better identify the sources and assess emission levels as well as the biogeochemical mobility and transport processes, governing the GEM concentrations, particularly in urban environments.16 However, the practical feasibility to concurrently deploy active sampling instruments at multiple locations is limited, due to their high cost, requirements for trained personnel, electricity, and compressed carrier gases. Studies using mobile instruments have been conducted,17 but it is difficult to attribute concentration variations specifically to spatial or temporal factors. Passive air samplers (PASs) offer a low-cost alternative. PASs are easy to use and can be deployed simultaneously at multiple locations, thereby allowing for the determination of both spatial and temporal trends, including in remote and developing regions.18–21 A recent comparison determined the PAS developed and tested on a global scale by McLagan et al.22,23 to be the most accurate and precise PAS for GEM at the present time.24
Besides the atmosphere, soil is also an important environmental compartment for Hg, as it represents the largest Hg reservoir.25 On a large scale, the terrestrial environment acts as a sink of Hg in the Southern Hemisphere.26 Hg is deposited from the atmosphere to soil by oxidation of GEM to Hg(II), followed by wet and dry deposition, or by plant uptake of GEM followed by oxidation to Hg(II) in the leaf interior and deposition through litterfall.12,25,27 The soils' ability to retain Hg is dependent on soil properties and climate.25,28 Hg emissions from soil to the atmosphere generally occur in the form of GEM and are a result of e.g., photoreduction of Hg(II).29–31
Most studies on GEM are conducted in the Northern Hemisphere. Data on spatial and temporal trends of GEM in the Southern Hemisphere, including sub-Saharan Africa, therefore remain limited.13,14 The Global Mercury Observation System (GMOS), which was established in 2010 to provide global monitoring data, reflects this. This monitoring network comprises 40 atmospheric monitoring stations,14 though it includes only six stations in the Southern Hemisphere and only one in the African continent (Cape Point, South Africa).14 Most data on GEM from sub-Saharan Africa are thus derived from this one location in South Africa, in addition to some studies from ASGM communities in Ghana and Burkina Faso.11,32,33 Consequently, there are large knowledge gaps regarding GEM levels and emissions in sub-Saharan Africa.
Socioeconomic factors are known to affect anthropogenic sources and emissions, leading to potential differences between the industrialised Northern Hemisphere and developing regions in sub-Saharan Africa.34 In addition, differences in the land/ocean ratio, vegetation coverage, and climate may furthermore affect physical- and biogeochemical processes governing mobility, transport, and sinks of Hg compared to the Northern Hemisphere.26 The gap in GEM data from sub-Saharan Africa is therefore important to fill in order to assess the effectiveness of current and future regulation and to gain more complete insight into the global cycling of Hg. The greater Dar es Salaam area, Tanzania, has more than six million inhabitants and a tropical climate. As a consequence of its rapidly growing economy, population, and consumption, the region suffers from insufficient systems for handling waste and e-waste.35–37 In this study, areas in and around Dar es Salaam were therefore chosen as the study region.
The main objective of this study is thus to characterize spatial trends of GEM and identify potential emission sources in an urban area in sub-Saharan Africa using the PAS by McLagan et al.22 Total Hg content in soil is also reported to provide an extended image of urban Hg contamination and thus complement the understanding of the spatial trends of atmospheric GEM. This study represents the first documentation of spatial trends of GEM in air across an urban area in the Southern Hemisphere.
2 Materials and methods
2.1 Passive air sampler
The PAS used in this study is described in detail in McLagan et al.22 The sampler consists of a sulphur impregnated activated carbon sorbent (HGR-AC, Calgon Carbon Corporation) in a Radiello® diffusive barrier that constrains the sampling rate. The sorbent and diffusive barrier are housed in a polyethylene terephthalate housing to protect them from rain and minimize the effect of wind speed on sampling rates.38 The sampler collects GEM, while other forms of airborne Hg (gaseous oxidised mercury and particle bound mercury) are unable to pass the diffusive barrier to any significant extent.39 GEM typically comprises >95% of total gaseous mercury (TGM),12 meaning that GEM levels provide a good estimate of TGM under most conditions.2.2 Sampling
PASs were deployed at 33 locations in and around the city of Dar es Salaam, Tanzania, for approximately 60 days, between February and April 2019. PASs were deployed in duplicate at two locations, and five field blanks were collected along with the PAS. The deployment of the PASs and treatment of field blanks were done according to standard operating procedures described in McLagan et al.23 The study had two main components, aimed at (i) determining GEM levels and its spatial distribution within and between urban and rural/suburban areas, in order to assess the significance of urban emission sources, and (ii) to specifically evaluate the role of handling of municipal waste and e-waste as sources of GEM. The first study component was addressed by sampling at 24 locations along an urban-rural transect across the city of Dar es Salaam as well as 40 and 60 km upwind and downwind, respectively. The sampling locations within Dar es Salaam were selected to cover different urbanized areas, including commercial districts downtown, heavily trafficked areas, heavy industrial areas, and more and less affluent residential areas. Samples were additionally collected in the vicinity of two cement production facilities, one located 30 km south and one 20 km north of Dar es Salaam. These samplers were collected as close to the facilities as achievable (within ∼1000 m) within site access restrictions. For the second study component, eight samples were collected along a transect (12 km) covering the city's main municipal waste dumpsite and an e-waste recycling facility 20 km west of Dar es Salaam. Soil samples were collected from 28 locations in February 2019, as described in Nipen et al.40 Table S1 in the ESI† provides detailed information on sampling locations.2.3 Sample preparation and analysis
The measured Hg content in the PAS was converted to volumetric GEM air concentrations by dividing the Hg mass by the sampling time (days) and a sampling rate (m3 per day). A global calibration study determined the PAS sampling rate to be 0.135 ± 0.016 m3 per day.23 This sampling rate was adjusted for temperature and wind speed at each site (average for the duration of the sampling period) according to equations given in McLagan et al.43 Location specific meteorological data were extracted from the ERA5-dataset from ECMWF (European Centre for Medium-Range Weather Forecasts).44
2.3.2 Analysis of soil
The soil samples were analysed at the University of Oslo, Norway. The samples were air dried at room temperature (21 °C) for between two days and one week until constant weight. The dry soils were carefully crushed before being sifted through a 2 mm sieve.45The soil samples (∼50 mg) were analysed for total Hg content using a Direct Mercury Analyser (DMA-80) (Milestone, Italy), with a similar method to the PAS analysis.45 Nickel sample boats were used, and no sodium carbonate addition was necessary given the lower content of sulphur in the analysed soil compared to the PAS sorbent. Soil pH was determined potentiometrically according to ISO10390, and effective cation exchange capacity (CEC) was determined using barium chloride adhering to ISO11260. Soil organic matter (SOM) content was determined gravimetrically by loss on ignition (LOI) at 550 °C. LOI was subsequently corrected for structural water loss according to Hoogsteen et al.46 to determine OM content. Clay content was roughly estimated according to Ritchey et al.47
2.4 QA/QC
For the analysis of GEM in the PAS, three types of standards were analysed between the samples. Liquid standards (N = 14) showed 98 ± 1% recovery, the NIST standard reference material (Bituminous coal; SRM-2685c) (N = 8) showed 93 ± 2% recovery, while an in-house reference material (PAS sorbent loaded with Hg) (N = 6) showed 102 ± 5% recovery. Concentration of Hg in field blanks (N = 5) represented on average 12% of the Hg concentration in the samples (Table S3†). The samples were blank corrected based on the average of field blanks, after one field blank was omitted as an outlier. Detection and quantification limits (LOD and LOQ) were calculated as three and 10 times the standard deviation of the field blanks, respectively, and correspond to 0.26 ng m−3 and 0.86 ng m−3 using the average sampling volume. The LOD and LOQ reported here are comparable to the LODs and LOQs reported by Quant et al.,48 and in the lower range of the LODs and LOQs reported by Snow et al.,11 but higher than those reported by McLagan et al.22 The two duplicate samples showed 6% and 9% deviation. This is comparable to the precision achieved by Quant et al.,48 and at the lower end of precision achieved by McLagan et al.23 using the same type of PAS.For the analysis of Hg in soils, a light sandy soil JRC reference material (BCR-142) was analysed with 95.7% compliance with the certified concentration. Blank levels for the soils were low, representing <1% of the average Hg content in the soil samples (Table S6†). Soil Hg concentrations were therefore not blank corrected, and the LOD (0.0003 mg kg−1) and LOQ (0.0005 mg kg−1) were determined as the average plus three and 10 times the standard deviation of blanks (N = 10), respectively, divided by the average sample amount. One rural sample (R-1, average concentration 0.012 mg kg−1) was analysed in five parallels, yielding a relative standard deviation of 13%.
2.5 Emission estimates for the urban area
GEM emissions from the urban area were estimated using a simple inflow–outflow box model of the urban atmosphere. As the Dar es Salaam region has varying degrees of urbanization, only the most central 37 of the ∼90 wards of Dar es Salaam were defined as urban in this study, covering an area of approximately 100 km2. Assuming an atmospheric boundary layer at 1.2 km, the total volume of the urban atmosphere in the model was 120 km3. We assumed steady-state conditions and a well-mixed atmosphere. The background GEM concentration (air inflow) was based on Slemr et al.49 For urban GEM concentrations (air outflow), we used the mean GEM concentrations of the urban locations found in this study after removal of outliers. Wind speed used in the model represented the mean for all urban sampling locations in Dar es Salaam.44 Table S4† provides the parameters and equations used for the urban emission model. Uncertainty in the emissions was estimated using a Monte Carlo approach including likely variability in the atmospheric boundary layer height, wind speed, and GEM concentration in inflowing and outflowing air (further described in the ESI). Predicted annual emissions from urban Dar es Salaam based on measured concentrations were compared to the gridded AMAP/UNEP global Hg emission inventory for 2010.502.6 Statistical analysis
Data treatment was conducted using Microsoft Excel and R studio version 4.0.5. Differences between location categories were tested using the non-parametric Wilcoxon rank sum test. Correlations between GEM, Hg in soil, and soil properties were determined using the Spearman rank correlation.3 Results and discussion
3.1 General overview
The LOQ for GEM obtained in this study (0.86 ng m−3) lies at the lower end of annual mean background concentrations in air reported for the Southern Hemisphere between 2007 and 2013 (range: 0.85–1.05 ng m−3).49 Two rural/suburban locations had GEM concentrations between the LOD and the LOQ. GEM concentrations below the LOQ are reported in italics in the following text. One sample from the municipal waste/e-waste transect had a GEM concentration considerably lower than those of the blanks. This sample has thus likely been subject to some unknown instrumental error and was therefore excluded from the study. An additional PAS from the outer edge of the municipal waste/e-waste transect was lost during transport.GEM concentrations over the study area as a whole ranged between 0.79 and 5.34 ng m−3 for the two-month sampling period (Fig. 1 and Table 1). Concentration data are provided in Table S2.†
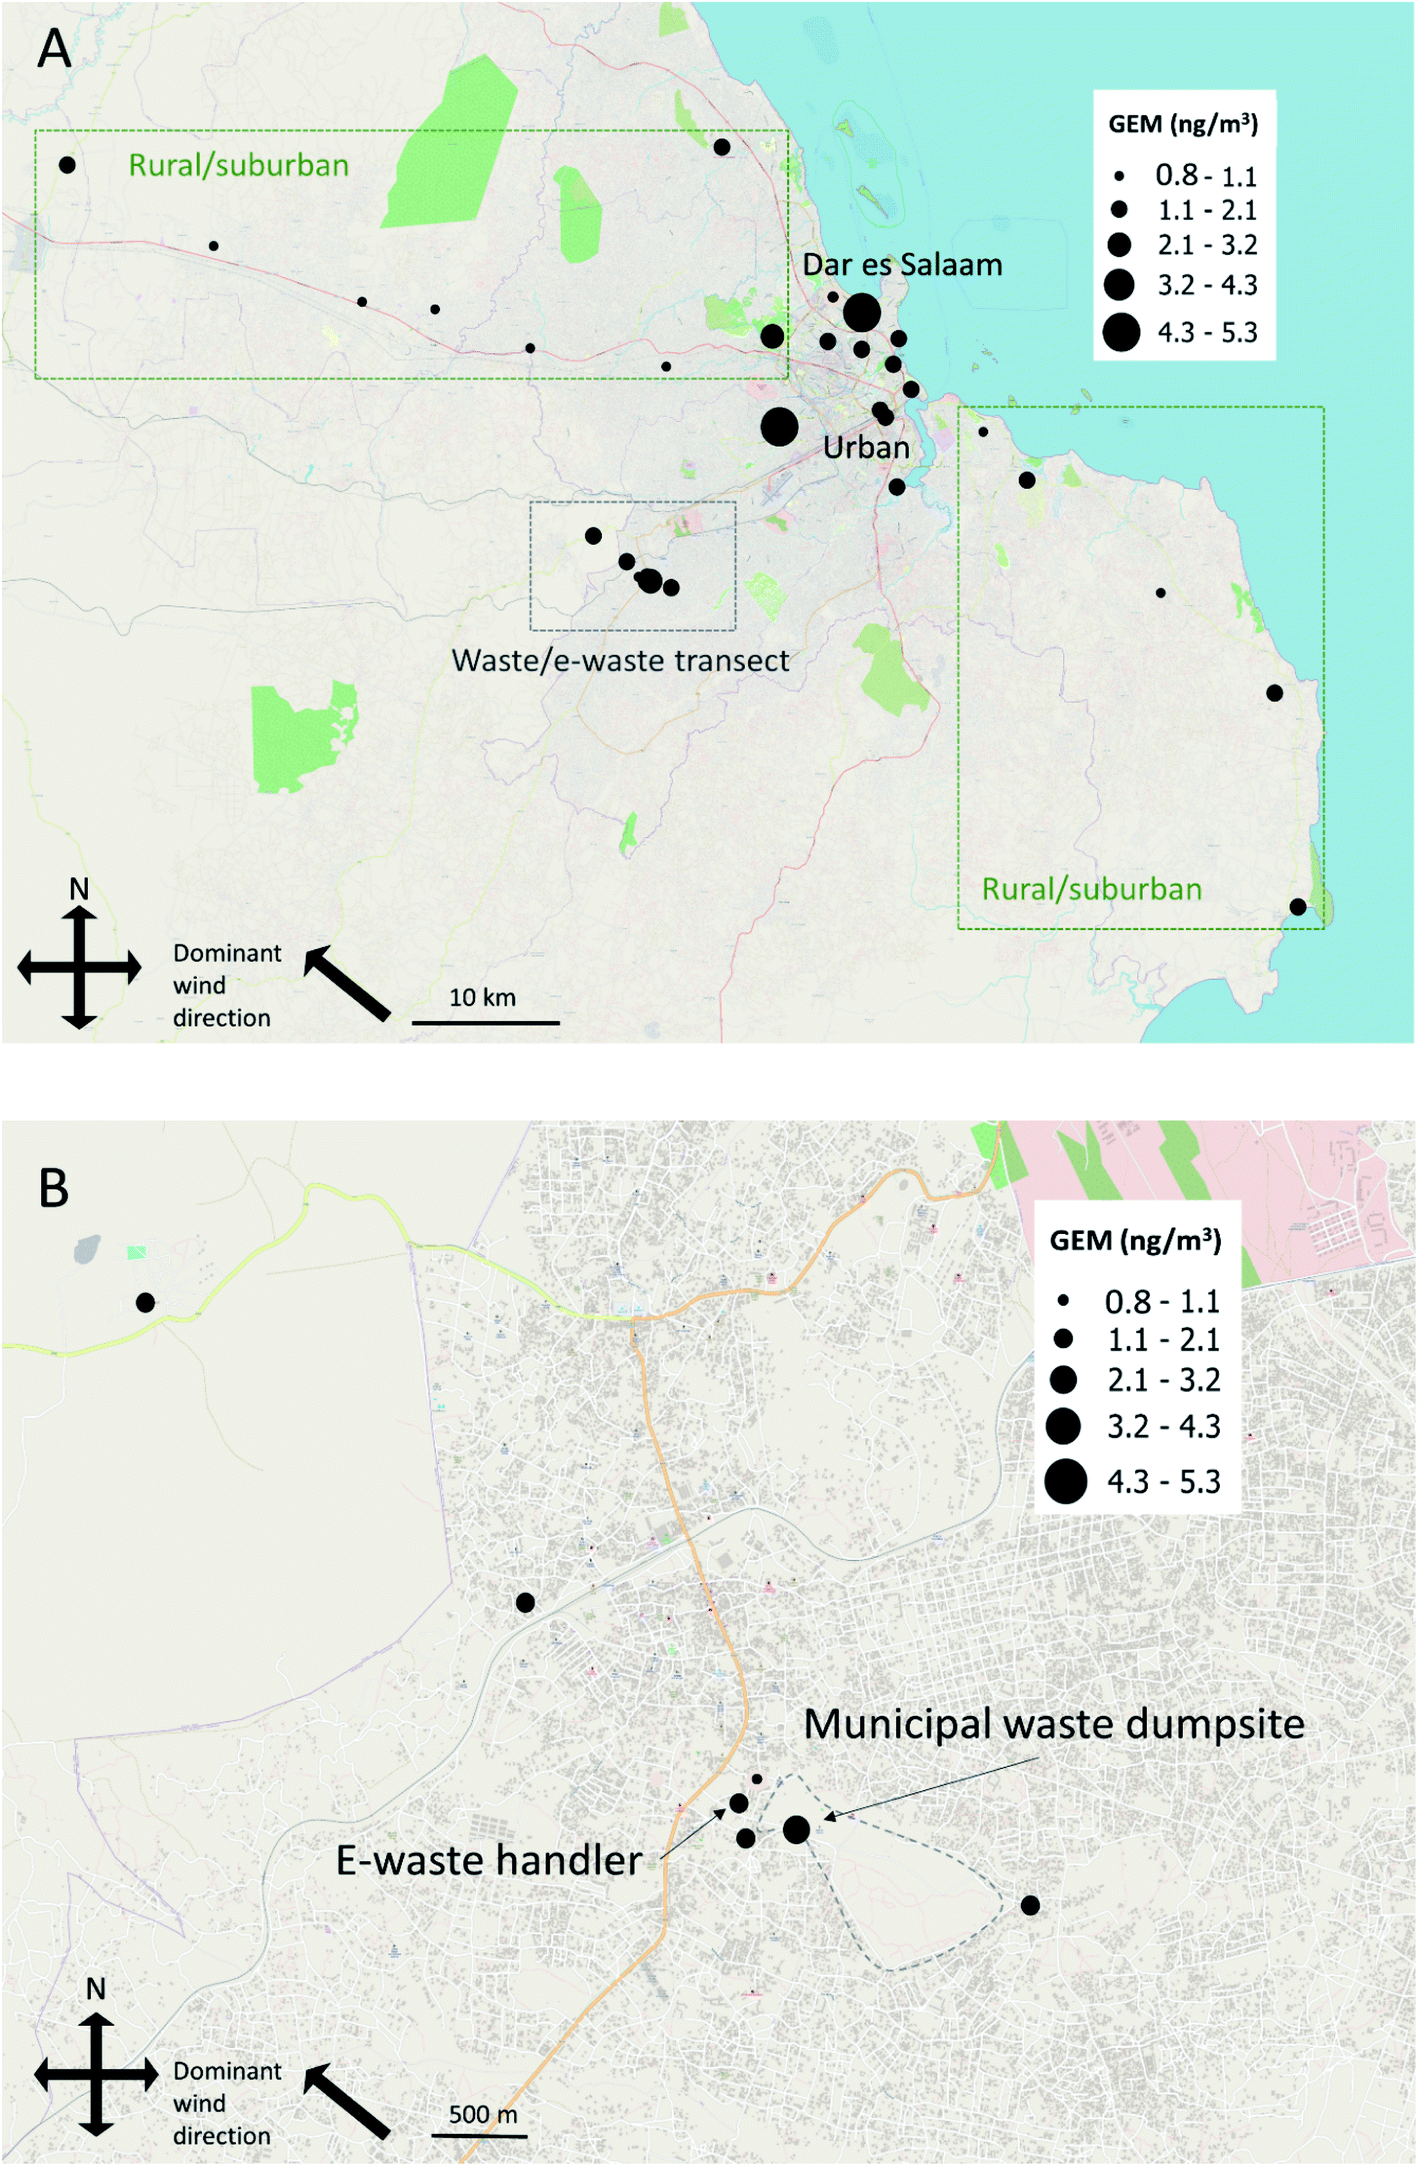 | ||
| Fig. 1 A: Spatial variation in the concentrations of GEM in Dar es Salaam and surrounding regions, time-averaged over a two-month period from February to April in 2019. B: Spatial variation in the concentrations of GEM along the municipal waste/e-waste transect, time-averaged over a two-month period from February to April in 2019. Base maps are produced in QGIS. | ||
| Category | Sampling | Location | Mean (median) | Range | Ref. |
|---|---|---|---|---|---|
| a Means from three locations within the Highveld. b Range of means. | |||||
| Urban-rural, (e−)waste | PAS | Dar es Salaam, Tanzania | 1.57 (1.15) | 0.79–5.34 | This study |
| Urban | PAS | Basel, Switzerland | 2.21 | 1.83–2.52 | 55 |
| Urban | PAS | Toronto, Canada | 1.46 | 0.94–2.37 | 16 |
| Urban | Active | Taoyuan, Taiwan | 2.61 | 56 | |
| Urban | Active | Da Nang, Vietnam | 3.86 | 58 | |
| Urban (TGM) | Active | Seoul, Korea | 3.72 | 59 | |
| Urban | Active | Bronx, NY, USA | 1.92 (1.77) | 52 | |
| Urban | Active | Rochester, NY, USA | 1.66 (1.50) | 52 | |
| Urban | Active | Beltsville, USA | 1.41 | 53 | |
| Urban | Active | Shanghai, China | 2.77 | 60 | |
| Urban (TGM) | Active | Nanjing, China | 7.9 | 62 | |
| Urban | Active | Guiyang, China | 9.72 | 61 | |
| Urban | Active | Chicago, USA | 2.50 | 54 | |
| Urban | Active | Pretoria, South Africa | 2.24 | 57 | |
| Urban-rural transect | PAS | Beijing, China | 1.4–7.0 | 21 | |
| Suburban/industrial (TGM) | Active | Highveld, South Africa | 1.04, 1.25, 1.99a | 64 | |
| Landfill | PAS | Gamsenried, Switzerland | 1.22–10.8 | 76 | |
| E-waste | PAS | Norway | 0.9–75 | 11 | |
| Background, Southern Hemisphere | Active | Multiple remote sites | 0.85–1.05b | 49 | |
Concentrations of Hg in soil in the present study ranged from 0.0067 to 0.098 mg kg−1 (Table 2 and S5†). Globally, background Hg content in soil varies, but reported values lie in the range of 0.01 to 0.1 mg kg−1 (Beckers and Rinklebe51 and references therein). As such, the range of Hg concentrations in soil found in the region is comparable to background concentrations. Hg concentrations in soil were poorly correlated with GEM concentrations in air (Spearman's rho 0.34; p = 0.076).
| Category | Location | Mean (median) | Range | Ref. |
|---|---|---|---|---|
| Urban-rural, (e−)waste | Dar es Salaam, Tanzania | 0.024 (0.015) | 0.0067–0.098 | This study |
| Urban | Beijing, China | (0.26) | 0.022–9.4 | 68 |
| Urban | Beijing, China | 1.67 (1.34) | 0.16–3.68 | 69 |
| Urban | Beijing, China | 0.012–8.49 | 70 | |
| Urban | Wuhu, China | 0.21 | 0.024–2.84 | 71 |
| Urban | Brno, Czech Republic | 0.084–0.326 | 72 | |
| Urban | Athens, Greece | (0.096) | 0.010–1.08 | 73 |
| Urban | Vanadzor, Armenia | 0.042 (0.039) | 0.0015–0.29 | 67 |
| Urban | Arak, Iran | (0.088) | 0.066–0.581 | 74 |
| Urban | Kumasi, Ghana | 0.051 | 66 | |
| Urban | Kumasi, Ghana | 0.050 | 65 | |
| Waste | Kingtom, Sierra Leone | 0.18 | 0.03–0.33 | 77 |
| E-waste | Agbogbloshie, Ghana | 0.47 | 0.12–0.94 | 77 |
| Global background | 0.01–0.1 | 51 |
3.2 Urban-rural transect
The mean GEM concentrations found in urban areas in this study were compared to GEM concentrations found in other urban areas of the world in the last decade (Table 1). Only one study from the Southern Hemisphere including urban areas could be found in the peer reviewed literature, illustrating the need for the present study. This is of relevance when comparing concentrations between the Hemispheres, as background concentrations in air in the Northern Hemisphere (1.3 to 1.7 ng m−3) are higher than in the Southern Hemisphere (0.85 to 1.05 ng m−3).12,15,49 The mean GEM concentration over urban locations found in our study was higher than GEM concentrations found in Toronto, Canada, and in Bronx, Rochester, and Beltsville, USA.16,52,53 The GEM concentrations were comparable to GEM concentrations in Pretoria, South Africa; Basel, Switzerland; Taoyuan, Taiwan, and Chicago, USA,54–57 and lower compared to Da Nang, Vietnam; Seoul, South Korea, and Shanghai, Beijing, Nanjing, and Guiyang, China.21,58–62
Studies assessing spatial trends of GEM using PASs in urban areas have, as far as we are aware, only been conducted in Toronto, Canada,16 and in Basel, Switzerland,55 Both these studies showed lower spatial variability in Hg concentrations in the urban environment (range Toronto: 0.94 to 2.37 ng m−3; range Basel: 1.83 to 2.52 ng m−3) compared to our study (1.07 to 5.34 ng m−3). However, the Canadian study also contained a component where samples were collected along transects in the vicinity of industrial facilities registered as Hg emission sources. The highest measured GEM concentration amongst these samples was 12.3 ng m−3, collected within a few metres of a facility handling disposal of Hg containing products. The GEM concentrations along the transects in the Canadian study decreased exponentially, approaching average urban concentrations after 2000 to 3500 m. The two locations in our study with GEM concentrations in excess of 5 ng m−3 thus suggest the presence of significant local sources of Hg. However, given the unknown nature of these sources and thus the unknown distance between the sampler and source, no quantitative estimate of the magnitude of GEM emissions from the sources can be made.
Using the mean urban GEM concentrations measured in this study (excluding the two highest concentrations as outliers), we estimated an annual emission of 500 ± 400 kg for the 100 km2 Dar es Salaam urban area using a simple box model. Estimated annual Hg emissions from the AMAP/UNEP emission inventory for the grid cell corresponding to Dar es Salaam (covering 3070 km2) is lower than this, at 20 kg.50 The AMAP/UNEP emission estimate for Dar es Salaam is also low compared to grid cells corresponding to other urban areas in Africa, e.g., Nairobi, Kenya (170 kg), and Johannesburg, South Africa (1100 kg).50 Fossil fuel combustion (notably coal combustion) and ASGM are considered the dominating Hg emission sources in Africa.2,7,63 However, to our knowledge, there are no coal fired power plants and no major ASGM activity within or near Dar es Salaam. Despite the high associated uncertainty, our emission estimates based on measurements suggest that there are significant Hg sources within urban Dar es Salaam that are not accounted for in UNEP/AMAP emission estimates, which therefore could be biased low.
The median GEM concentration measured at rural and suburban sites of 1.05 ng m−3 (range 0.79 to 2.16 ng m−3) is consistent with the Southern Hemisphere background concentrations reported by Slemr et al.49 Elevated GEM concentrations at three rural and suburban locations (1.99, 2.05, and 2.16 ng m−3) indicate the presence of local emissions. Two of these sites were at the outer edges of the urban/rural transect, excluding proximity to the urban environment as an explanatory factor for these elevated concentrations. Consequently, no significant difference was seen between urban locations and rural/suburban locations (p = 0.27). Belelie et al.64 reported spatial variability in GEM concentrations in the South African Highveld region by measuring at three monitoring sites in a suburban area with comparatively high industrial activity. Their range of averages from 1.04 to 1.99 ng m−3 is very similar to the range measured at the rural/suburban locations in the present study.
GEM concentrations in the vicinity of two cement production facilities (1.34 and 1.48 ng m−3) were slightly elevated above the Southern Hemisphere background. This suggests that these facilities may represent Hg sources locally. A larger number of samples and/or samples collected in closer vicinity to the facilities would be required to determine the extent of local Hg contamination.
The highest soil Hg concentration was found close to the downtown area, potentially influenced by traffic, industrial activity, and e-waste processing. SOM content at this location was low. This location does not correspond to either of the two locations with the highest GEM concentrations in air. In combination with the lack of correlation between GEM in air and Hg in soil, this suggests that historically contaminated soil in the urban area is not a dominating source of GEM.
In rural and suburban regions, the Hg concentrations in soil ranged from 0.0067 to 0.092 mg kg−1, with a median of 0.012 mg kg−1. More remote locations had Hg concentrations below 0.015 mg kg−1, while some suburban locations showed elevated concentrations. This was particularly the case at one location where the SOM content was also high. The presence of some high Hg concentrations in suburban regions and the presence of some lower Hg concentrations in urban regions ensured no significant difference in Hg concentrations between urban and rural/suburban regions in soil (p = 0.23).
Soil physicochemical properties (pH, CEC, SOM and clay content) are known to influence soil capacity to bind Hg and thus its spatial distribution.51,75 Of these properties, SOM showed the strongest positive correlation with Hg concentrations in soil (Table S9†) (Spearman's rho 0.44; p = 0.019); however, this correlation was strongly influenced by one location. Soils in the region generally have low SOM content, but with relatively large variability (median 1.7%, range <0.01–9.6%). Overall, it seems likely that soil Hg concentrations are influenced by the physicochemical properties of the soil in the form of the SOM content, in combination with proximity to sources, given the presence of some higher concentrations in urban locations.
3.3 Municipal waste and e-waste transect
PASs have previously been applied to determine GEM concentrations near a landfill known to contain Hg contaminated materials in Switzerland76 and at an e-waste handling facility in Norway11 (Table 1). The GEM concentration at the municipal waste dumpsite in our study was within the lower range of GEM measured in the Swiss study. Moreover, the GEM concentration at the e-waste site in our study was lower than the range of GEM concentrations in ambient air in the vicinity of the Norwegian facility and comparable to ambient air at some distance from it.11 Overall, the spatial distribution of GEM concentrations in the present study suggests that both general waste and e-waste are sources of GEM. The relatively low levels of GEM around the e-waste handler and municipal waste dumpsite compared to similar sites in industrialized countries could be explained by an overall lower volume of Hg containing products entering the waste stream in Tanzania.
The municipal waste dumpsite had a soil Hg concentration in the lower range of concentrations reported from a municipal waste dumpsite in Sierra Leone.77 Moreover, the Hg concentration in the soil at the e-waste site was lower than the concentrations reported from an informal e-waste site in Ghana.77
3.4 Concluding remarks
This study shows that urban ambient GEM concentrations in Dar es Salaam are lower than those found in some urban areas in Asia. Nevertheless, GEM concentrations exceeded 5 ng m−3 at two locations, demonstrating the presence of significant local sources. Further investigations using multiple PASs should be conducted in the vicinity of these locations to identify sources and to facilitate estimation of the magnitude of their emissions. The comparatively high estimated annual GEM emissions in Dar es Salaam further support the presence of significant unidentified sources. This raises questions regarding current emission estimates for Africa, as the sources expected to be most important in Africa, i.e., AGSM and coal power plants, are not known to be relevant for Dar es Salaam. Further studies should also be carried out in other urban regions in Africa to gain further insight into urban emissions and sources for GEM. The PAS applied in this study has been shown to be suitable to carry out such investigations in urban areas in the Global South, given the quantification limits in the lower range of GEM background concentrations for the Southern Hemisphere. Longer deployment times could further lower the quantification limits.In addition to disclosing unidentified sources of GEM in Dar es Salaam, our study shows that handling of municipal waste and e-waste represent sources of GEM at waste sites in the outskirts of the city and that e-waste also represents a source within Dar es Salaam. Further efforts in waste management at the regional level should be made, but this should also be addressed in regulatory efforts at the international level to reduce trade of products and waste which contain Hg.
Conflicts of interest
There are no conflicts to declare.Acknowledgements
This study was conducted as part of the AnthroTox project, a convergence environment at the University of Oslo combining social and natural sciences to study anthropogenic toxicants. The AnthroTox project is funded through the University of Oslo and the Norwegian Ministry of Education and Research. We would like to thank Ane Haarr, Franziska Klaas, Samwel Moses Ntapanta, and Signe Mikkelsen for their contributions during fieldwork; local authorities for their cooperation; the residents and businesses of Dar es Salaam and the Coastal Region who allowed us to collect samples on their properties; Sabine Eckhart for providing meteorological data; Katrine Aspmo Pfaffhuber for valuable advice; and Helene Lunder Halvorsen who helped produce Fig. 1 using QGIS.References
- UNEP, Minamata Convention on Mercury: Text and Annexes, United Nations Environmental Programme, Geneva, Switzerland, 2013 Search PubMed.
- D. G. Streets, H. M. Horowitz, Z. Lu, L. Levin, C. P. Thackray and E. M. Sunderland, Global and regional trends in mercury emissions and concentrations, 2010–2015, Atmos. Environ., 2019, 201, 417–427 CrossRef CAS.
- Y. Zhang, D. J. Jacob, H. M. Horowitz, L. Chen, H. M. Amos, D. P. Krabbenhoft, F. Slemr, V. L. S. Louis and E. M. Sunderland, Observed decrease in atmospheric mercury explained by global decline in anthropogenic emissions, Proc. Natl. Acad. Sci., 2016, 113, 526–531 CrossRef CAS PubMed.
- L. G. Martin, C. Labuschagne, E.-G. Brunke, A. Weigelt, R. Ebinghaus and F. Slemr, Trend of atmospheric mercury concentrations at Cape Point for 1995–2004 and since 2007, Atmos. Chem. Phys., 2017, 17, 2393–2399 CrossRef CAS.
- F. Slemr, L. Martin, C. Labuschagne, T. Mkololo, H. Angot, O. Magand, A. Dommergue, P. Garat, M. Ramonet and J. Bieser, Atmospheric mercury in the Southern Hemisphere–Part 1: Trend and inter-annual variations in atmospheric mercury at Cape Point, South Africa, in 2007–2017, and on Amsterdam Island in 2012–2017, Atmos. Chem. Phys., 2020, 20, 7683–7692 CrossRef CAS.
- D. G. Streets, M. K. Devane, Z. Lu, T. C. Bond, E. M. Sunderland and D. J. Jacob, All-time releases of mercury to the atmosphere from human activities, Environ. Sci. Technol., 2011, 45, 10485–10491 CrossRef CAS PubMed.
- E. G. Pacyna, J. Pacyna, K. Sundseth, J. Munthe, K. Kindbom, S. Wilson, F. Steenhuisen and P. Maxson, Global emission of mercury to the atmosphere from anthropogenic sources in 2005 and projections to 2020, Atmos. Environ., 2010, 44, 2487–2499 CrossRef CAS.
- N. Pirrone, S. Cinnirella, X. Feng, R. B. Finkelman, H. R. Friedli, J. Leaner, R. Mason, A. B. Mukherjee, G. B. Stracher and D. Streets, Global mercury emissions to the atmosphere from anthropogenic and natural sources, Atmos. Chem. Phys., 2010, 10, 5951–5964 CrossRef CAS.
- N. E. Selin, Global biogeochemical cycling of mercury: a review, Annu. Rev. Environ. Resour., 2009, 34, 43–63 CrossRef.
- X. Huang, M. Li, H. R. Friedli, Y. Song, D. Chang and L. Zhu, Mercury emissions from biomass burning in China, Environ. Sci. Technol., 2011, 45, 9442–9448 CrossRef CAS PubMed.
- M. A. Snow, G. Darko, O. Gyamfi, E. Ansah, K. Breivik, C. Hoang, Y. D. Lei and F. Wania, Characterization of inhalation exposure to gaseous elemental mercury during artisanal gold mining and e-waste recycling through combined stationary and personal passive sampling, Environ. Sci.: Processes Impacts, 2021, 23, 569–579 RSC.
- C. T. Driscoll, R. P. Mason, H. M. Chan, D. J. Jacob and N. Pirrone, Mercury as a global pollutant: sources, pathways, and effects, Environ. Sci. Technol., 2013, 47, 4967–4983 CrossRef CAS PubMed.
- N. Pirrone, W. Aas, S. Cinnirella, R. Ebinghaus, I. M. Hedgecock, J. Pacyna, F. Sprovieri and E. M. Sunderland, Toward the next generation of air quality monitoring: Mercury, Atmos. Environ., 2013, 80, 599–611 CrossRef CAS.
- F. Sprovieri, N. Pirrone, M. Bencardino, F. D'Amore, F. Carbone, S. Cinnirella, V. Mannarino, M. Landis, R. Ebinghaus and A. Weigelt, Atmospheric mercury concentrations observed at ground-based monitoring sites globally distributed in the framework of the GMOS network, Atmos. Chem. Phys., 2016, 16, 11915–11935 CrossRef CAS PubMed.
- F. Sprovieri, N. Pirrone, R. Ebinghaus, H. Kock and A. Dommergue, A review of worldwide atmospheric mercury measurements, Atmos. Chem. Phys., 2010, 10, 8245–8265 CrossRef CAS.
- D. S. McLagan, B. A. Hussain, H. Huang, Y. D. Lei, F. Wania and C. P. Mitchell, Identifying and evaluating urban mercury emission sources through passive sampler-based mapping of atmospheric concentrations, Environ. Res. Lett., 2018, 13, 074008 CrossRef.
- E. Cairns, K. Tharumakulasingam, M. Athar, M. Yousaf, I. Cheng, Y. Huang, J. Lu and D. Yap, Source, concentration, and distribution of elemental mercury in the atmosphere in Toronto, Canada, Environ. Pollut., 2011, 159, 2003–2008 CrossRef CAS PubMed.
- J. Huang, H.-D. Choi, M. S. Landis and T. M. Holsen, An application of passive samplers to understand atmospheric mercury concentration and dry deposition spatial distributions, J. Environ. Monit., 2012, 14, 2976–2982 RSC.
- H. Skov, B. T. Sørensen, M. S. Landis, M. S. Johnson, P. Sacco, M. E. Goodsite, C. Lohse and K. S. Christiansen, Performance of a new diffusive sampler for Hg0 determination in the troposphere, Environ. Chem., 2007, 4, 75–80 CrossRef CAS.
- M. S. Gustin, S. N. Lyman, P. Kilner and E. Prestbo, Development of a passive sampler for gaseous mercury, Atmos. Environ., 2011, 45, 5805–5812 CrossRef CAS.
- W. Zhang, Y. Tong, D. Hu, L. Ou and X. Wang, Characterization of atmospheric mercury concentrations along an urban–rural gradient using a newly developed passive sampler, Atmos. Environ., 2012, 47, 26–32 CrossRef CAS.
- D. S. McLagan, C. P. Mitchell, H. Huang, Y. D. Lei, A. S. Cole, A. Steffen, H. Hung and F. Wania, A high-precision passive air sampler for gaseous mercury, Environ. Sci. Technol. Lett., 2015, 3, 24–29 CrossRef.
- D. S. McLagan, C. P. Mitchell, A. Steffen, H. Hung, C. Shin, G. W. Stupple, M. L. Olson, W. T. Luke, P. Kelley and D. Howard, Global evaluation and calibration of a passive air sampler for gaseous mercury, Atmos. Chem. Phys., 2018, 18, 5905–5919 CrossRef CAS.
- A. Naccarato, A. Tassone, M. Martino, S. Moretti, A. Macagnano, E. Zampetti, P. Papa, J. Avossa, N. Pirrone and M. Nerentorp, A field intercomparison of three passive air samplers for gaseous mercury in ambient air, Atmos. Meas. Tech., 2021, 14, 3657–3672 CrossRef CAS.
- D. Obrist, J. L. Kirk, L. Zhang, E. M. Sunderland, M. Jiskra and N. E. Selin, A review of global environmental mercury processes in response to human and natural perturbations: Changes of emissions, climate, and land use, Ambio, 2018, 47, 116–140 CrossRef PubMed.
- J. Bieser, H. Angot, F. Slemr and L. Martin, Atmospheric mercury in the Southern Hemisphere–Part 2: Source apportionment analysis at Cape Point station, South Africa, Atmos. Chem. Phys., 2020, 20, 10427–10439 CrossRef CAS.
- A. P. Rutter, J. J. Schauer, M. M. Shafer, J. E. Creswell, M. R. Olson, M. Robinson, R. M. Collins, A. M. Parman, T. L. Katzman and J. L. Mallek, Dry deposition of gaseous elemental mercury to plants and soils using mercury stable isotopes in a controlled environment, Atmos. Environ., 2011, 45, 848–855 CrossRef CAS.
- D. Obrist, C. Pearson, J. Webster, T. Kane, C.-J. Lin, G. R. Aiken and C. N. Alpers, A synthesis of terrestrial mercury in the western United States: Spatial distribution defined by land cover and plant productivity, Sci. Total Environ., 2016, 568, 522–535 CrossRef CAS PubMed.
- C. S. Eckley, M. T. Tate, C.-J. Lin, M. Gustin, S. Dent, C. Eagles-Smith, M. A. Lutz, K. P. Wickland, B. Wang and J. E. Gray, Surface-air mercury fluxes across Western North America: A synthesis of spatial trends and controlling variables, Sci. Total Environ., 2016, 568, 651–665 CrossRef CAS PubMed.
- A. Carpi and S. E. Lindberg, Sunlight-mediated emission of elemental mercury from soil amended with municipal sewage sludge, Environ. Sci. Technol., 1997, 31, 2085–2091 CrossRef CAS.
- M. Xin and M. S. Gustin, Gaseous elemental mercury exchange with low mercury containing soils: investigation of controlling factors, Appl. Geochem., 2007, 22, 1451–1466 CrossRef CAS.
- E. de Barros Santos, P. Moher, S. Ferlin, A. H. Fostier, I. O. Mazali, K. Telmer and A. G. Brolo, Proof of concept for a passive sampler for monitoring of gaseous elemental mercury in artisanal gold mining, Sci. Rep., 2017, 7, 1–11 CrossRef CAS PubMed.
- O. Gyamfi, P. B. Sorenson, G. Darko, E. Ansah and J. L. Bak, Human health risk assessment of exposure to indoor mercury vapour in a Ghanaian artisanal small-scale gold mining community, Chemosphere, 2020, 241, 125014 CrossRef CAS PubMed.
- F. Steenhuisen and S. Wilson, Development and application of an updated geospatial distribution model for gridding 2015 global mercury emissions, Atmos. Environ., 2019, 211, 138–150 CrossRef CAS.
- R. S. Mahenge, P. Ulanga, M. Malabeja, J. Pilly and W. Massoy, Performance Audit Report on Electronic Waste Management, 2018, Available at ELECTRONIC-WASTE-MANAGEMENT-2018.pdf (nao.go.tz). (Accessed March 2021) Search PubMed.
- M. Yhdego, From a Sanitary Landfill to a Dump Site: Pugu Kinyamwezi Community Curse in Dar es Salaam, 2017, DOI:10.13140/RG.2.2.27828.04483.
- WorldBank, The World Bankin Tanzania, 2021, http://www.worldbank.org/en/country/tanzania/overview, (accessed January) Search PubMed.
- F. Wania and C. Shunthirasingham, Passive air sampling for semi-volatile organic chemicals, Environ. Sci.: Processes Impacts, 2020, 22, 1925–2002 RSC.
- N. Szponar, D. S. McLagan, R. J. Kaplan, C. P. Mitchell, F. Wania, A. Steffen, G. W. Stupple, F. Monaci and B. A. Bergquist, Isotopic characterization of atmospheric gaseous elemental mercury by passive air sampling, Environ. Sci. Technol., 2020, 54, 10533–10543 CrossRef CAS PubMed.
- M. Nipen, R. D. Vogt, P. Bohlin-Nizzetto, K. Borgå, E. B. Mwakalapa, A. R. Borgen, S. J. Jørgensen, S. M. Ntapanta, A. J. Mmochi and M. Schlabach, Spatial trends of chlorinated paraffins and dechloranes in air and soil in a tropical urban, suburban, and rural environment, Environ. Pollut., 2022, 118298 CrossRef CAS PubMed.
- USEPA, Method 7473: Mercury in Solids and Solutions by Thermal Decomposition, Amalgamation, and Atomic Absorption Spectrophotometry, vol. 17, 2007 Search PubMed.
- D. S. McLagan, H. Huang, Y. D. Lei, F. Wania and C. P. Mitchell, Application of sodium carbonate prevents sulphur poisoning of catalysts in automated total mercury analysis, Spectrochim. Acta, Part B, 2017, 133, 60–62 CrossRef CAS.
- D. S. McLagan, C. P. Mitchell, H. Huang, B. Abdul Hussain, Y. D. Lei and F. Wania, The effects of meteorological parameters and diffusive barrier reuse on the sampling rate of a passive air sampler for gaseous mercury, Atmos. Meas. Tech., 2017, 10, 3651–3660 CrossRef CAS.
- ECMWF, European Centre for Medium-Range Weather Forecasts, ERA5 dataset, 2021 Search PubMed.
- S. J. Jørgensen, Studying Spatial Trends of Heavy Metals in Soil from a Tropical Region, Master’s thesis, University of Oslo, 2020 Search PubMed.
- M. J. Hoogsteen, E. A. Lantinga, E. J. Bakker, J. C. Groot and P. A. Tittonell, Estimating soil organic carbon through loss on ignition: effects of ignition conditions and structural water loss, Eur. J. Soil Sci., 2015, 66, 320–328 CrossRef CAS.
- E. L. Ritchey, J. M. McGrath and D. Gehring, Determining Soil Texture by Feel, Agriculture and Natural Resources Publications, 2015, vol. 139 Search PubMed.
- M. I. Quant, M. Feigis, S. Mistry, Y. D. Lei, C. P. Mitchell, R. Staebler, A. Di Guardo, E. Terzaghi and F. Wania, Using passive air samplers to quantify vertical gaseous elemental mercury concentration gradients within a forest and above soil, J. Geophys. Res.: Atmos., 2021, 126, e2021JD034981 CAS.
- F. Slemr, H. Angot, A. Dommergue, O. Magand, M. Barret, A. Weigelt, R. Ebinghaus, E.-G. Brunke, K. A. Pfaffhuber and G. Edwards, Comparison of mercury concentrations measured at several sites in the Southern Hemisphere, Atmos. Chem. Phys., 2015, 15, 3125–3133 CrossRef CAS.
- AMAP/UNEP, Technical Background Report for the Global Mercury Assessment 2013. Arctic Monitoringand Assessment Programme, Oslo, Norway/UNEP ChemicalsBranch, Geneva, Switzerland. vol. 263, 2013 Search PubMed.
- F. Beckers and J. Rinklebe, Cycling of mercury in the environment: Sources, fate, and human health implications: A review, Crit. Rev. Environ. Sci. Technol., 2017, 47, 693–794 CrossRef CAS.
- H. Zhou, C. Zhou, P. K. Hopke and T. M. Holsen, Mercury wet deposition and speciated mercury air concentrations at rural and urban sites across New York state: Temporal patterns, sources and scavenging coefficients, Sci. Total Environ., 2018, 637, 943–953 CrossRef PubMed.
- X. Ren, W. T. Luke, P. Kelley, M. D. Cohen, R. Artz, M. L. Olson, D. Schmeltz, M. Puchalski, D. L. Goldberg and A. Ring, Atmospheric mercury measurements at a suburban site in the Mid-Atlantic United States: Inter-annual, seasonal and diurnal variations and source-receptor relationships, Atmos. Environ., 2016, 146, 141–152 CrossRef CAS.
- L. E. Gratz, G. J. Keeler, F. J. Marsik, J. A. Barres and J. T. Dvonch, Atmospheric transport of speciated mercury across southern Lake Michigan: Influence from emission sources in the Chicago/Gary urban area, Sci. Total Environ., 2013, 448, 84–95 CrossRef CAS PubMed.
- L. Wohlgemuth, D. McLagan, B. Flückiger, D. Vienneau and S. Osterwalder, Concurrently measured concentrations of atmospheric mercury in indoor (household) and outdoor air of basel, Switzerland, Environ. Sci. Technol. Lett., 2020, 7, 234–239 CrossRef CAS PubMed.
- G.-R. Sheu, L. S. P. Nguyen, M. T. Truong and D.-W. Lin, Characteristics of atmospheric mercury at a suburban site in northern Taiwan and influence of trans-boundary haze events, Atmos. Environ., 2019, 214, 116827 CrossRef CAS.
- P. Higueras, R. Oyarzun, J. Kotnik, J. M. Esbrí, A. Martínez-Coronado, M. Horvat, M. A. López-Berdonces, W. Llanos, O. Vaselli and B. Nisi, A compilation of field surveys on gaseous elemental mercury (GEM) from contrasting environmental settings in Europe, South America, South Africa and China: separating fads from facts, Environ. Geochem. Health, 2014, 36, 713–734 CrossRef CAS PubMed.
- G.-R. Sheu, N.-H. Lin, C.-T. Lee, J.-L. Wang, M.-T. Chuang, S.-H. Wang, K. H. Chi and C.-F. Ou-Yang, Distribution of atmospheric mercury in northern Southeast Asia and South China Sea during Dongsha experiment, Atmos. Environ., 2013, 78, 174–183 CrossRef CAS.
- Y.-J. Han, J.-E. Kim, P.-R. Kim, W.-J. Kim, S.-M. Yi, Y.-S. Seo and S.-H. Kim, General trends of atmospheric mercury concentrations in urban and rural areas in Korea and characteristics of high-concentration events, Atmos. Environ., 2014, 94, 754–764 CrossRef CAS.
- X. Qin, X. Wang, Y. Shi, G. Yu, N. Zhao, Y. Lin, Q. Fu, D. Wang, Z. Xie and C. Deng, Characteristics of atmospheric mercury in a suburban area of east China: sources, formation mechanisms, and regional transport, Atmos. Chem. Phys., 2019, 19, 5923–5940 CrossRef CAS.
- X. Fu, X. Feng, G. Qiu, L. Shang and H. Zhang, Speciated atmospheric mercury and its potential source in Guiyang, China, Atmos. Environ., 2011, 45, 4205–4212 CrossRef CAS.
- J. Zhu, T. Wang, R. Talbot, H. Mao, C. Hall, X. Yang, C. Fu, B. Zhuang, S. Li and Y. Han, Characteristics of atmospheric total gaseous mercury (TGM) observed in urban Nanjing, China, Atmos. Chem. Phys., 2012, 12, 12103–12118 CrossRef CAS.
- K. E. Masekoameng, J. Leaner and J. Dabrowski, Trends in anthropogenic mercury emissions estimated for South Africa during 2000–2006, Atmos. Environ., 2010, 44, 3007–3014 CrossRef CAS.
- M. Belelie, S. Piketh, R. Burger, A. Venter and M. Naidoo, Characterisation of ambient Total Gaseous Mercury concentrations over the South African Highveld, Atmos. Pollut. Res., 2019, 10, 12–23 CrossRef CAS.
- G. Darko, M. Dodd, M. A. Nkansah, E. Ansah and Y. Aduse-Poku, Distribution and bioaccessibility of metals in urban soils of Kumasi, Ghana, Environ. Monit. Assess., 2017, 189, 260 CrossRef PubMed.
- O. Akoto, N. Bortey-Sam, Y. Ikenaka, S. M. Nakayama, E. Baidoo, Y. B. Yohannes and M. Ishizuka, Contamination levels and sources of heavy metals and a metalloid in surface soils in the Kumasi Metropolis, Ghana, J. Health Pollut., 2017, 7, 28–39 CrossRef PubMed.
- L. Sahakyan, G. Tepanosyan, G. Melkonyan, N. Maghakyan and A. Saghatelyan, Mercury soil contents and associated ecological and health risks in kindergartens and functional areas of the city of Vanadzor (Armenia), Geogr. Environ. Sustain., 2019, 12, 252–271 CrossRef.
- X. Chen, X. Xia, S. Wu, F. Wang and X. Guo, Mercury in urban soils with various types of land use in Beijing, China, Environ. Pollut., 2010, 158, 48–54 CrossRef CAS PubMed.
- Q. Liu, Y. Liu and M. Zhang, Mercury and cadmium contamination in traffic soil of Beijing, China, Bull. Environ. Contam. Toxicol., 2012, 88, 154–157 CrossRef CAS PubMed.
- X.-H. Li, H.-X. Cheng, C.-D. Zhao and X.-B. Xu, Mercury contamination in the topsoil and subsoil of urban areas of Beijing, China, Bull. Environ. Contam. Toxicol., 2010, 85, 224–228 CrossRef CAS PubMed.
- F. Fang, H. Wang and Y. Lin, Spatial distribution, bioavailability, and health risk assessment of soil Hg in Wuhu urban area, China, Environ. Monit. Assess., 2011, 179, 255–265 CrossRef CAS PubMed.
- P. Pelcová, I. Zouharová, A. Ridošková and V. Smolíková, Evaluation of mercury availability to pea parts (Pisum sativum L.) in urban soils: Comparison between diffusive gradients in thin films technique and plant model, Chemosphere, 2019, 234, 373–378 CrossRef PubMed.
- E. Kelepertzis and A. Argyraki, Mercury in the urban topsoil of Athens, Greece, Sustainability, 2015, 7, 4049–4062 CrossRef.
- E. Solgi, A. Esmaili-Sari and A. Riyahi-Bakhtiari, Spatial distribution of mercury in the surface soils of the urban areas, Arak, Iran, Bull. Environ. Contam. Toxicol., 2014, 93, 710–715 CrossRef CAS PubMed.
- D. O'Connor, D. Hou, Y. S. Ok, J. Mulder, L. Duan, Q. Wu, S. Wang, F. M. Tack and J. Rinklebe, Mercury speciation, transformation, and transportation in soils, atmospheric flux, and implications for risk management: A critical review, Environ. Int., 2019, 126, 747–761 CrossRef PubMed.
- D. S. McLagan, S. Osterwalder and H. Biester, Temporal and spatial assessment of gaseous elemental mercury concentrations and emissions at contaminated sites using active and passive measurements, Environ. res. commun., 2021, 3, 051004 CrossRef.
- C. Möckel, K. Breivik, T. H. Nøst, A. Sankoh, K. C. Jones and A. Sweetman, Soil pollution at a major West African E-waste recycling site: Contamination pathways and implications for potential mitigation strategies, Environ. Int., 2020, 137, 105563 CrossRef PubMed.
Footnote |
| † Electronic supplementary information (ESI) available. See https://doi.org/10.1039/d2em00040g |
| This journal is © The Royal Society of Chemistry 2022 |