
 Open Access Article
 This Open Access Article is licensed under a Creative Commons Attribution-Non Commercial 3.0 Unported Licence
Occurrence and fate of chiral and achiral drugs in estuarine water – a case study of the Clyde Estuary, Scotland†
Bruce
Petrie
 * and
Colin F.
Moffat
* and
Colin F.
Moffat
School of Pharmacy and Life Sciences, Robert Gordon University, Aberdeen, AB10 7GJ, UK. E-mail: b.r.petrie@rgu.ac.uk
First published on 25th February 2022
Abstract
There is currently a lack of enantiospecific studies on chiral drugs in estuarine environments. In this study, the occurrence and fate of 20 prescription and illicit drugs, metabolites and associated contaminants were investigated in the Clyde Estuary, Scotland, over a 6 month period. More than half of the drugs were detected in at least 50% of water samples collected (n = 30), with considerable enantiomer enrichment observed for some of the compounds. Enantiomeric fraction (EF) values of the chiral drugs investigated in this study ranged from <0.03 for amphetamine to 0.70 for bisoprolol. Microcosm studies revealed enantioselective degradation of fluoxetine and citalopram for the first-time in estuarine waters (over 14 days at 8.0 °C in water of 27.8 practical salinity units). Interestingly, fish collected from the inner estuary (Platichthys flesus – European flounder) contained drug enantiomers in muscle and liver tissues. This included propranolol, fluoxetine, citalopram, and venlafaxine. Considerable enantiospecific differences were observed between the two fish tissues, and between fish tissues and water samples. For example, citalopram EF values in muscle and liver were 0.29 ± 0.03 and 0.18 ± 0.01, respectively. In water samples EF values were in the range 0.36–0.49. This suggests enantioselective metabolism of citalopram by P. flesus. The enantioselectivity of drugs observed within the Clyde Estuary highlights the need for enantiospecific effect-driven studies on marine organisms to better understand their impact in estuarine environments, contributing to the likely cumulative impacts of the range of contaminants to which marine coastal wildlife is exposed.
Environmental significanceDrugs are essential and their use is increasing due to an aging and growing population. Human excretion and incomplete removal during wastewater treatment results in their release into the water environment. Many drugs are chiral, and this phenomenon influences their fate and effects in the environment. Yet, there is limited knowledge on drug chirality in some environmental compartments including estuaries. Our study of the Clyde Estuary revealed notable differences in the composition of chiral drugs compared to their manufactured forms. This is important as toxicity studies do not normally account for this, resulting in an underestimation or overestimation of environmental risk. An accurate understanding of the risk posed by drugs will enable appropriate management steps to be undertaken to protect these ecosystems. |
1. Introduction
Various drugs, including prescription, over-the counter and illicit drugs, are ubiquitous in the aqueous environment and are adding to the range of contaminants to which marine life are exposed.1–4 Their presence at ng L−1 to μg L−1 concentrations in estuarine water poses a largely unknown threat to aquatic organisms.5,6 The main pathways for these drugs to enter the environment is through the discharge of treated wastewater effluents or combined sewer overflows.7–9 Most research to date has focused on their fate and behaviour in freshwaters due to the lower dilution of wastewater discharges and the greater perceived risk to the biota. However, differences in organisms found in freshwaters and waters of varying salinity need to be considered, especially given the large number and geographic spread of ecosystems covered by waters of different salinity. Increasing numbers of studies have investigated drugs in the marine environment, including estuaries.10–14 Studies have found numerous drugs above 10 ng L−1 (the action threshold set by the European Medicines Agency for predicted environmental concentrations of drugs in surface waters)15 in estuarine waters from a range of locations.10–14 Drug metabolites also need to be monitored, where possible, as they can be biologically active, can be transformed back into the parent compound, and can be found at greater concentrations than the parent compound (e.g., carbamazepine-10,11-epoxide).16An important consideration for understanding the fate and behaviour of drugs in the environment is their chirality. Approximately 50% of drugs are chiral and exist as two or more enantiomers.17 Chiral drugs can be dispensed in racemic (equimolar enantiomer concentrations) or enantiopure (single enantiomer) forms. Enantiomers of the same drug can differ in their metabolism, but also in their degradation and toxicity in the environment.18–21 However, little research has been undertaken on drugs at the enantiomeric level in estuaries. Instead, enantiomers of the same drug are measured together with reported drugs concentrations representing the sum of all enantiomers. Given that enantiomer enrichment in the environment is likely, and the existence of enantiospecific toxicity, it is apparent that the environmental risk of a drug or mixture of drugs can be under- or over-estimated.
A significant contributor to the limited enantiomeric data in estuarine environments is the lack of robust analytical methods for enantioselective analysis of drugs in such matrices. The high sodium chloride concentration possible in estuarine waters (up to approximately 3.4% w/v) can influence enantioselective separations and ionisation efficiency in high temperature mass spectrometers.22 Nevertheless, methods have recently been successfully developed and applied to estuarine waters.22,23
Coelho et al.23 conducted a weeklong sampling of five locations within the Douro River Estuary, Portugal. Most drugs studied, including beta-blockers and antidepressants, were present in non-racemic compositions showing the clear presence of these drugs, adding to the range of contaminants to which the biota are exposed. Differences in enantiomeric composition for some drugs was observed between different sampling locations.23 Similar observations were made by McKenzie et al.22 from the Forth and Clyde Estuaries, Scotland, albeit with considerably fewer samples available. Both studies provide valuable insights into both the presence of drugs and their enantiospecific composition in estuaries. In addition, they also demonstrate the limited knowledge in this area. For example, it is not clear whether differences in drug enantiomeric composition within the estuaries is a result of enantiospecific degradation or different wastewater inputs along the estuary. Previous research associated with freshwater environments has made use of laboratory microcosms conducted on the environmental matrix (and spiked with the analytes of interest) to assess the enantiospecific degradation of various drugs. Several drugs, including stimulants, antidepressants, and beta-blockers, were subject to enantioselective transformation which helped explain the enantioselectivity observed during freshwater river monitoring studies.19,21
Previous research has demonstrated the uptake of drugs by fish in surface waters contaminated by wastewater discharges.24–26 However, studies at the enantiomeric level are lacking. Enantiospecific studies on anti-inflammatory drugs have not detected any drug residues.27,28 Chiral anti-inflammatory drugs are weakly acidic and in anionic form at environmental pH values (pH 7–8) limiting absorption into organisms.29 On the other hand, Ruan et al.30 undertook enantioselective analysis of several cationic and non-ionised drugs in 15 species of fish collected from marine waters surrounding Hong Kong. The beta-blockers atenolol, metoprolol, the antidepressant venlafaxine, and the antibiotic chloramphenicol were present in the muscle of most species studied. Furthermore, evidence of enantioselective differences of metoprolol between fish and organisms in lower trophic levels (trophic levels 2 to 3) was reported.30 However, fish exposure to drug enantiomers from surrounding marine waters was not investigated. Therefore, additional studies are needed at the enantiomeric level that include a broader range of drugs found in marine waters as well as different fish and prey (lower trophic level) species.
To further our understanding on the enantioselectivity of drugs in estuarine systems, the objectives of the study were to: (i) determine the enantiomeric composition of drugs throughout the Clyde Estuary (salinity range <2.0 to 32.9 practical salinity units, PSU) over a six-month period, (ii) investigate the enantiospecific behaviour of drugs in estuarine water using laboratory microcosm studies, and (iii) assess the enantioselectivity of drugs within the tissues of fish collected from the Estuary. The Clyde Estuary was selected for study due to our previous pilot study demonstrating the occurrence of various drug enantiomers at concentrations >10 ng L−1 throughout the estuary.22
2. Materials and methods
2.1 Chemicals
The analytical reference standards used in the study were paracetamol, caffeine, carbamazepine, carbamazepine-10,11-epoxide, (−)-cotinine, R/S(±)-acebutolol, R/S(±)-amphetamine, R/S(±)-atenolol, R/S(±)-bisoprolol, R/S(±)-chlorpheniramine, R/S(±)-citalopram, R/S(±)-desmethylvenlafaxine, R/S(±)-fluoxetine, R/S(±)-methamphetamine, R/S(±)-3,4-methylenedioxymethamphetamine (MDMA), R/S(±)-metoprolol, R/S(±)-propranolol, R/S(±)-salbutamol, R/S(±)-sotalol and R/S(±)-venlafaxine. The deuterated or carbon-13 enriched surrogates were paracetamol-d4 caffeine-13C3 carbamazepine-d10, R/S(±)-cotinine-d3, R/S(±)-acebutolol-d5, R/S(±)-amphetamine-d11, R/S(±)-atenolol-d7, R/S(±)-bisoprolol-d5, R/S(±)-chlorpheniramine-d6, R/S(±)-citalopram-d6, R/S(±)-fluoxetine-d6, R/S(±)-methamphetamine-d11, R/S(±)-metoprolol-d7, R/S(±)-MDMA-d5, R/S(±)-propranolol-d7, R/S(±)-salbutamol-d3, R/S(±)-sotalol-d6 and R/S(±)-venlafaxine-d6. All were purchased from Sigma Aldrich (Gillingham, UK) or Toronto Research Chemicals (North York, Canada) and prepared at 0.1 or 1.0 mg mL−1 in methanol. The standards were stored at −20 °C in the dark. Sodium azide (NaN3) and high-performance liquid chromatography (HPLC) grade methanol, acetonitrile, acetic acid, and ammonium acetate, were purchased from Fisher Scientific (Loughborough, UK). Ultrapure water was 18.2 MΩ cm−1 quality and prepared using a PureLab Flex 1 (Elga, Marlow, UK).2.2 Sampling in the Clyde Estuary
Water samples were collected monthly (June 2019–November 2019) from five different locations within the Clyde Estuary, Scotland (n = 30, see Fig. 1). The sampling locations (decimal latitude/longitude, salinity range) were named the Kelvin confluence (55.86416/−4.30400, <2.0–13.0 PSU), Dalmuir (55.90544/−4.43557, <2.0–17.8 PSU), Milton (55.92849/−4.52116, 3.3–28.8 PSU), Woodhall (55.93899/−4.65588, 17.9–28.0 PSU) and Dunoon (55.94758/−4.89306, 26.7–32.9 PSU). Samples (2.5 L) were collected in high-density polyethylene (HDPE) bottles at a depth of 3 m, from a small boat. No loss of the analytes to the HDPE bottles was previously found.22 Samples were kept cool and in the dark whilst transported to the laboratory, arriving within 5 hours. Samples were frozen at −20 °C until extraction as described in Section 2.3.1. A separate 10 L water sample was collected from the outer estuary (55.98633/−4.879984, 27.8 PSU) during November 2019 for use in microcosm studies. Description of the microcosm studies can be found in the ESI.† Fish, 10 individuals per species, were collected from two locations during November 2019. Platichthys flesus (European flounder) were collected from the inner estuary (55.92500/−4.48000) and Limanda limanda (common dab) from the outer estuary (55.97100/−4.89200). Muscle and liver were excised on-board the boat, wrapped in aluminium foil, and maintained at −20 °C until extraction (Section 2.3.2). Fish tissues were provided by Marine Scotland Science. The fish that were sampled were obtained from their environment using conventional fishing methods. Removal of tissues was undertaken post-mortem in line with standard procedures as conducted by UK Government Laboratories undertaking environmental assessments. | ||
| Fig. 1 Sampling locations and total analyte concentrations in water samples collected from the Clyde Estuary in 2019. The list of analytes (n = 36 when determined on the basis of the different enantiomers) is presented in Table 1. The broken line represents the average (n = 6) total analyte concentration at each location. The scale on the y-axis is consistent for all plots to allow direct comparisons to be made between the specific locations. | ||
2.3 Extraction processes
![[thin space (1/6-em)]](https://www.rsc.org/images/entities/char_2009.gif) :50 (v/v) 0.63% acetic acid:methanol. Ultrasonic extraction was performed at 25 °C for 15 minutes. Samples were then centrifuged at 1500 × g for 20 minutes and the supernatant diluted with ultrapure water to <5% methanol and loaded directly onto 60 mg Oasis PRIME SPE cartridges. Cartridges were washed with 3 mL of 5% methanol in water. Analytes were eluted using 3 mL 90:10 (v/v) acetonitrile:methanol. Following drying at 40 °C under nitrogen, the extracts were reconstituted in methanol (100 μL) and filtered through 0.45 μm PVDF pre-filters (Fisher Scientific, Loughborough, UK) prior to instrumental analysis. All extractions were performed in quintuplicate. Enantiomer bioaccumulation factors (BAFs) were calculated using eqn (1):
:50 (v/v) 0.63% acetic acid:methanol. Ultrasonic extraction was performed at 25 °C for 15 minutes. Samples were then centrifuged at 1500 × g for 20 minutes and the supernatant diluted with ultrapure water to <5% methanol and loaded directly onto 60 mg Oasis PRIME SPE cartridges. Cartridges were washed with 3 mL of 5% methanol in water. Analytes were eluted using 3 mL 90:10 (v/v) acetonitrile:methanol. Following drying at 40 °C under nitrogen, the extracts were reconstituted in methanol (100 μL) and filtered through 0.45 μm PVDF pre-filters (Fisher Scientific, Loughborough, UK) prior to instrumental analysis. All extractions were performed in quintuplicate. Enantiomer bioaccumulation factors (BAFs) were calculated using eqn (1):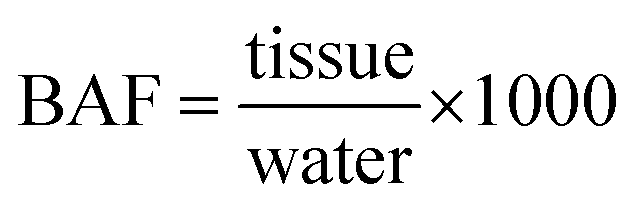 | (1) |
2.4 Enantioselective liquid chromatography-tandem mass spectrometry
Analysis was performed using an Agilent 1200 series HPLC (Cheshire, UK) coupled to a 6420 MS/MS triple quadrupole using positive electrospray ionisation. Separation was achieved using an InfinityLab Poroshell 120 Chiral-V column (150 × 2.1 mm; 2.7 μm particle size) maintained at 15 °C. The mobile phase was 2 mM ammonium acetate in methanol containing 0.01% acetic acid at a flow rate of 0.15 mL min−1. The injection volume was 10 μL. Two multiple reaction monitoring (MRM) transitions were monitored for each analyte for quantification and confirmation purposes (one in the case of deuterated surrogates). A mixed analyte calibration ranging from 0.01 to 500 ng mL−1 was prepared in methanol (containing 200 ng mL−1 deuterated and carbon-13 enriched enantiomers for analysis of water samples or 50 ng mL−1 deuterated enantiomers for fish extracts). The method detection limit (MDL) and method quantitation limit (MQL) for each analyte are presented in Table 1 and represent the lowest concentrations that the analyte can be identified and quantified, respectively. Details of the method performance can be found in the ESI (Tables S1 and S2).† Enantiomeric fraction (EF) was used to report the enantiomeric composition of the drugs and was calculated according to eqn (2):22 | (2) |
| Analyte | MDL (ng L−1) | MQL (ng L−1) | Detection frequency (%, n = 30) | Concentration (ng L−1) | Enantiomeric fraction | |||||
|---|---|---|---|---|---|---|---|---|---|---|
| Min. | Max. | Median | n | Min. | Max. | Median | ||||
| a Key: MDL, method detection limit; MQL, method quantitation limit; ND, not detected; MDMA, 3,4-methylenedioxymethamphetamine; NR, not relevant; —, insufficient data/unable to determine. b Number of samples where enantiomeric fraction could be calculated (i.e., at least one enantiomer was greater than the MQL). c MDL of S(+)-amphetamine was used to determine the enantiomeric fraction of amphetamine. d Fluoxetine MDLs and MQLs are greater than the other analytes due to lower SPE recovery from the multi-residue analytical approach. | ||||||||||
| Pain killer | ||||||||||
| Paracetamol | 8.8 | 26.3 | 97 | <MQL | 509.1 | 77.5 | NR | NR | NR | NR |
| Anti-convulsant | ||||||||||
| Carbamazepine | 1.0 | 3.3 | 93 | <MQL | 78.9 | 12.3 | NR | NR | NR | NR |
| Carbamazepine-10,11-epoxide | 0.4 | 1.3 | 90 | <MQL | 58.9 | 13.7 | NR | NR | NR | NR |
|
||||||||||
| Stimulant | ||||||||||
| Caffeine | 2.0 | 6.6 | 100 | 34.3 | 504.3 | 220.3 | NR | NR | NR | NR |
| R/S(±)-cotinine | 0.1 | 0.2 | 97 | <MQL | 28.0 | 10.9 | — | — | — | — |
| R/S(±)-MDMA | 1.0 | 3.3 | 67 | <MQL | 17.6 | 6.1 | — | — | — | — |
| S(+)-amphetamine | 1.6 | 6.2 | 0 | ND | — | — | 23c | <0.03 | <0.24 | — |
| R(−)-amphetamine | 1.3 | 5.1 | 87 | <MQL | 57.8 | 12.6 | ||||
| S(+)-methamphetamine | 1.2 | 2.5 | 0 | ND | — | — | — | — | — | — |
| R(−)-methamphetamine | 0.2 | 0.7 | 0 | ND | — | — | ||||
|
||||||||||
| Anti-histamine | ||||||||||
| S(+)-chlorpheniramine | 0.4 | 1.4 | 33 | <MQL | — | — | — | — | — | — |
| R(−)-chlorpheniramine | 0.4 | 1.4 | 33 | <MQL | — | — | ||||
|
||||||||||
| β-Blocker/agonist | ||||||||||
| Salbutamol-E1 | 0.5 | 1.5 | 13 | <MQL | — | — | — | — | — | — |
| Salbutamol-E2 | 0.5 | 1.5 | 13 | <MQL | — | — | ||||
| S(−)-propranolol | 0.7 | 2.3 | 67 | <MQL | 35.2 | 13.2 | 17 | 0.40 | 0.51 | 0.44 |
| R(+)-propranolol | 0.6 | 2.1 | 67 | <MQL | 24.5 | 10.5 | ||||
| S(−)-atenolol | 2.0 | 6.5 | 70 | <MQL | 30.8 | 15.7 | 12 | 0.50 | 0.58 | 0.52 |
| R(+)-atenolol | 2.2 | 7.2 | 70 | <MQL | 38.7 | 17.9 | ||||
| Sotalol-E1 | 1.4 | 4.5 | 27 | <MQL | 5.1 | — | 3 | 0.40 | 0.43 | 0.43 |
| Sotalol-E2 | 1.4 | 4.6 | 27 | <MQL | 7.4 | — | ||||
| Bisoprolol-E1 | 0.1 | 0.4 | 83 | <MQL | 7.3 | 2.7 | 20 | 0.33 | 0.70 | 0.54 |
| Bisoprolol-E2 | 0.1 | 0.5 | 83 | <MQL | 5.9 | 2.8 | ||||
| Acebutolol-E1 | 0.1 | 0.4 | 3 | <MQL | — | — | — | — | — | — |
| Acebutolol-E2 | 0.2 | 0.8 | 3 | <MQL | — | — | ||||
| Metoprolol-E1 | 1.0 | 3.0 | 13 | <MQL | 23.5 | — | 2 | 0.45 | 0.48 | — |
| Metoprolol-E2 | 1.0 | 3.2 | 13 | <MQL | 26.9 | — | ||||
|
||||||||||
| Antidepressant | ||||||||||
| S(+)-fluoxetined | 21.2 | 67.7 | 23 | <MQL | — | — | — | — | — | — |
| R(−)-fluoxetined | 12.3 | 39.4 | 23 | <MQL | — | — | ||||
| R(−)-citalopram | 0.6 | 2.2 | 97 | <MQL | 23.3 | 6.5 | 21 | 0.36 | 0.49 | 0.39 |
| S(+)-citalopram | 0.6 | 2.2 | 97 | <MQL | 13.9 | 4.2 | ||||
| Venlafaxine-E1 | 0.1 | 0.4 | 100 | <MQL | 49.2 | 9.1 | 29 | 0.50 | 0.59 | 0.52 |
| Venlafaxine-E2 | 0.1 | 0.4 | 100 | <MQL | 44.9 | 8.3 | ||||
| Desmethylvenlafaxine-E1 | 0.4 | 1.5 | 97 | <MQL | 68.8 | 11.7 | 27 | 0.35 | 0.52 | 0.47 |
| Desmethylvenlafaxine-E2 | 0.4 | 1.3 | 97 | <MQL | 90.0 | 14.6 | ||||
Where the enantiomer elution order is unknown (salbutamol, sotalol, bisoprolol, acebutolol, metoprolol, venlafaxine, and desmethylvenlafaxine) the EF was calculated using eqn (3):22
 | (3) |
The EF value can vary between 0 (when the concentration of E(+) or E1 is zero) and 1 (when the concentration of E(−) or E2 is zero) and an EF of 0.5 represents a racemic mixture (equimolar concentrations) of enantiomers.
3. Results and discussion
3.1 Occurrence and enantiomeric composition of drugs in the Clyde Estuary
All the studied analytes except methamphetamine were detected at least once in water samples from the Clyde Estuary (Table 1). Caffeine and the venlafaxine enantiomers were the only analytes to be detected in all 30 water samples, but in the case of venlafaxine not necessarily quantifiable for all samples. Paracetamol, carbamazepine, carbamazepine-10,11-epoxide, and cotinine, as well as enantiomers of citalopram and desmethylvenlafaxine were all detected in at least 90% of the 30 water samples (Table 1). Both caffeine and paracetamol are well established marker compounds of wastewater discharge,32,33 and were found at a maximum concentration of ∼500 ng L−1. Other than indicating wastewater discharges, these markers can also be relevant from a toxicological viewpoint. For example, Minguez et al.34 derived a predicted no effect concentration (PNEC) of paracetamol in marine water of 81 ng L−1. This is below the paracetamol concentration that was detected in several of the water samples from the Clyde Estuary. All other analytes studied were present at <100 ng L−1 (Table 1).Average total analyte concentrations for each of the six monthly samples were ∼800 ng L−1 at the Kelvin confluence and Dalmuir (Fig. 1). This reduced to 598, 355 and 113 ng L−1 at Milton, Woodhall and Dunoon, owing to increased dilution of the wastewater discharges as they are dispersed due to mixing as they flow ‘down-river’. Similar average concentrations at the Kelvin confluence and Dalmuir sampling locations are attributed to wastewater discharges from the Dalmuir WTP that compensates for dilution immediately downstream of the Kelvin confluence. This is one of the largest WTPs in Glasgow serving a population of ∼600000 people.
Chiral drugs were often present in a non-racemic composition (Table 1). The EF values, when they could be calculated, ranged from <0.03 for amphetamine to 0.70 for bisoprolol. Amphetamine was present exclusively in the water samples as R(−)-amphetamine (Fig. 2). Prescription forms of amphetamine include the racemate and S(+)-amphetamine. On the other hand, illicit amphetamine is most commonly produced using the Leuckart method which yields racemic amphetamine.35 Amphetamine can also result from the metabolism of other drugs (e.g., methamphetamine). However, amphetamine metabolism is enantioselective whereby S(+)-amphetamine is metabolised faster than R(−)-amphetamine.36 Furthermore, S(+)-amphetamine is readily transformed compared to its antipode during wastewater treatment and in the environment.19 This explains the presence of R(−)-amphetamine and low EF values for amphetamine observed in the Clyde Estuary.
 | ||
| Fig. 2 Concentrations of selected drugs at different sampling locations in the Clyde Estuary. Only analytes detected in at least 50% (i.e., 15/30) of all water samples are shown. The lower and upper extent of the boxes represent the lower (5%) and upper (95%) percentiles respectively with the horizontal line within the box representing the median value. Whiskers are the maximum and minimum values. Enantiomeric fractions of those chiral species are shown on the secondary axis (plots with blue bars). Open circles represent the mean enantiomeric fraction (using the right-hand y-axis), and the whiskers show the maximum and minimum values. The numbers above the bars represent the number of samples where the analyte was greater than the MQL. The samples are presented on the x-axis as progressing down river going from left to right. Key: EF, enantiomeric fraction; MDMA, 3,4-methylenedioxymethamphetamine. Note: S(+)-amphetamine was not detected in any sample therefore the enantiomeric fraction was calculated using the S(+)-amphetamine MDL. The venlafaxine and desmethylvenlafaxine data are presented without assigning the R and S enantiomers (and presented based on their elution order as enantiomer 1 (E1) and enantiomer 2 (E2)). Neither atenolol nor R/S(±)-MDMA were detected at Dunoon. The scale on the left-hand y-axis is analyte specific. | ||
Beta-blockers such as bisoprolol, atenolol, and propranolol are marketed in racemic composition and are subject to enantioselective metabolism.37 Average EF values of bisoprolol were >0.50 for Kelvin confluence, Dalmuir, Milton and Woodhall (Fig. 2). It was only quantifiable in one sample from Dunoon. This sample gave an EF value of 0.33. Enantiomer enrichment of bisoprolol has previously been observed in the Douro Estuary, Portugal with EF values in the range 0.1–0.6.23 Individual enantiomer concentrations across the five sampling sites in the Clyde Estuary were <10 ng L−1 which are generally lower than those reported in the Douro Estuary.23
Moderate enrichment of R(+)-atenolol and S(−)-propranolol was observed at each sampling location in the Clyde Estuary (Fig. 2). Both atenolol and propranolol have been detected in estuarine waters globally.38–43 Enrichment of R(+)-atenolol agrees with limited water data from the Victoria Harbor, Hong Kong.30 Although enantiomeric data for propranolol and atenolol is limited for different estuary locations, the observations are consistent with river water data (salinity not reported).21,44 Whole drug concentrations (i.e., sum of both enantiomers) of propranolol were below the previously reported marine PNEC value of 163 ng L−1.34 The greatest R/S(±)-propranolol concentration (60 ng L−1) was observed at the Kelvin confluence. The R/S(±)-atenolol concentrations ranged from <MQL to 70 ng L−1 and were considerably lower than the 10 μg L−1 PNEC.34
The EF values of venlafaxine and desmethylvenlafaxine in the Clyde Estuary were 0.50–0.59 and 0.35–0.52, respectively (Fig. 2). Dispensed as the racemate, venlafaxine undergoes stereoselective metabolism in the body45 and is transformed into several metabolites including desmethylvenlafaxine. However, the elution order of enantiomers from the HPLC column is not known in this study.22 The venlafaxine and desmethylvenlafaxine data is presented without assigning the R and S enantiomers (and presented based on their elution order as enantiomer 1 (E1) and enantiomer 2 (E2) in the tables and figures).
Citalopram EF values were <0.50 in all samples where the EF could be calculated (Table 1). Citalopram is dispensed as the racemate and as the biologically active enantiomer only (escitalopram, the S(+)-citalopram enantiomer).46 Human metabolism favours the conversion of S(+)-citalopram.47 Furthermore, S(+)-citalopram is transformed at a faster rate than R(−)-citalopram during biological wastewater treatment (e.g., activated sludge).21 This explains why the EF values of citalopram were <0.50 in the Clyde Estuary whereas the EF value of total citalopram dispensed was >0.50.46 Traveling downstream from the Kelvin confluence to Dunoon the average EF values of citalopram were 0.39 ± 0.02 (n = 6), 0.39 ± 0.01 (n = 6), 0.40 ± 0.02 (n = 5), 0.42 ± 0.01 (n = 3) and 0.49 (n = 1) (Fig. 2).
Marine PNECs of 322 ng L−1 and 51 ng L−1 have been reported for venlafaxine and citalopram respectively.34 The maximum whole drug concentrations of venlafaxine and citalopram were 94 ng L−1 and 37 ng L−1 respectively (Table 1). The maximum citalopram concentration recorded in the Humber Estuary, UK was slightly higher than in the Clyde Estuary at 43 ng L−1.13 Similarity between environmental and PNEC concentrations of citalopram as well as the enantiomer enrichment observed strongly points to the requirement for enantiospecific toxicity testing. To date, no ecotoxicological effects data exists for citalopram enantiomers in the environment.
The remaining drug detected in >50% of collected samples was R/S(±)-MDMA. However, the methodology applied here does not enable enantiomer separation. Nevertheless, whole drug concentrations in the inner estuary were in the range <MQL-17.6 ng L−1 (Table 1). Although no aquatic toxicity data exists for MDMA, sample concentrations at some locations were above the action threshold for further research for drug concentrations in surface waters (10 ng L−1).15
3.2 Behaviour of drugs in estuarine water microcosms
Microcosms studies were undertaken on water collected from the outer estuary (salinity of 27.8 PSU, Fig. 1) to assess analyte degradation within estuarine water. Degradation of paracetamol as well as enantiomers of chlorpheniramine, propranolol and fluoxetine and S(+)-citalopram was observed under biotic conditions within 14 days (Table S3†). Both fluoxetine and citalopram degraded enantioselectively in the biotic microcosm under artificial light (Table S3†). This is the first time that enantioselective degradation of fluoxetine and citalopram has been confirmed in estuarine water. However, it should be noted that microcosm studies were undertaken on a single water sample collected from the outer estuary and further studies are needed to better appreciate the degradation of drugs in an estuarine environment. Further description of the findings from the microcosm study can be found in the ESI.†3.3 Enantioselectivity of chiral drugs in fish tissues
European flounder (P. flesus) and common dab (L. limanda) were collected from the inner and outer estuary respectively and analysed for the range of drugs covered in this study (Fig. 1). None of the compounds under investigation were detected in the muscle or liver of L. limanda from the outer estuary. On the other hand, enantiomers of propranolol, fluoxetine, citalopram, and venlafaxine were detected in liver of P. flesus from the inner estuary (Tables 2 and S4†). This is attributed to the more hydrophobic nature of these compounds compared to the other drugs in this study. However, propranolol enantiomers and venlafaxine-E2 were below their respective MQLs (in liver). Propranolol enantiomers were not detected and venlafaxine-E2 was below the MQL in P. flesus muscle (Table 2). Drug enantiomer concentrations were three to nine times greater in liver compared to muscle. This is similar to findings by Brooks et al.48 of several fish species in an effluent dominated freshwater stream, albeit measurements were not at the enantiomeric level. Greater enantiomer concentrations in the liver may be expected due to it being the primary site of detoxification.49 Enantiomer concentrations ranged from 0.11 ± 0.01 ng g−1 wet weight for S(+)-citalopram in muscle to 2.71 ± 0.25 ng g−1 wet weight for S(+)-fluoxetine in liver (Table 2). Whole drug concentrations in muscle and liver tissue are similar to those previously reported.49,50| Analyte | Muscle tissue | Liver tissue | ||||||||
|---|---|---|---|---|---|---|---|---|---|---|
| MDL (ng g−1 w/w) | MQL (ng g−1 w/w) | Concentration (ng g−1 w/w) | BAF (L kg−1) | EF | MDL (ng g−1 w/w) | MQL (ng g−1 w/w) | Concentration (ng g−1 w/w) | BAF (L kg−1) | EF | |
| a Key: MDL, method detection limit; MQL, method quantitation limit; BAF, bioaccumulation factor; EF, enantiomeric fraction; ND, not detected; ww, wet weight. b The fish tissue MDL was used to calculate the BAF. c Tnsufficient concentration data for water samples to derive a BAF. | ||||||||||
| S(−)-propranolol | 0.03 | 0.10 | ND | — | — | 0.06 | 0.19 | <MQL | 7b | — |
| R(+)-propranolol | 0.03 | 0.09 | ND | — | 0.05 | 0.18 | <MQL | 7b | ||
| S(+)-fluoxetine | 0.05 | 0.15 | 0.31 ± 0.03 | —c | 0.62 ± 0.02 | 0.09 | 0.30 | 2.71 ± 0.25 | —c | 0.74 ± 0.01 |
| R(−)-fluoxetine | 0.04 | 0.14 | 0.19 ± 0.03 | —c | 0.09 | 0.28 | 0.94 ± 0.08 | —c | ||
| R(−)-citalopram | 0.03 | 0.09 | 0.25 ± 0.02 | 38 | 0.29 ± 0.03 | 0.05 | 0.18 | 1.50 ± 0.17 | 227 | 0.18 ± 0.01 |
| S(+)-citalopram | 0.03 | 0.09 | 0.11 ± 0.01 | 26 | 0.06 | 0.19 | 0.33 ± 0.04 | 79 | ||
| Venlafaxine-E1 | 0.01 | 0.04 | 0.25 ± 0.02 | 18 | >0.86 | 0.02 | 0.08 | 1.20 ± 0.05 | 86 | >0.94 |
| Venlafaxine-E2 | 0.01 | 0.04 | <MQL | 1b | 0.02 | 0.07 | <MQL | 2b | ||
Average drug enantiomer concentrations in water at Milton were used to determine BAFs due to its proximity to the sampling location of P. flesus in the inner estuary (Fig. 1). Calculated field BAFs ranged from 1–38 L kg−1 for muscle to 2–227 L kg−1 for liver (Table 2). BAFs were higher for liver tissues reflecting the higher enantiomer concentrations in the liver. The greatest BAFs were recorded for citalopram enantiomers with 227 L kg−1 and 79 L kg−1 found for R(−)-citalopram and S(+)-citalopram, respectively. Whole drug BAFs for citalopram in liver of Salmo trutta (brown trout) in an effluent dominated freshwater stream in the Czech Republic ranged from 260 to 590 L kg−1.25 On the other hand, citalopram BAFs in various fish from a large freshwater river in the United States (Niagara) were <20 L kg−1,24 indicating species specific bioaccumulation of pharmaceuticals. This has previously been observed for other pharmaceuticals in the Tejo Estuary, Portugal.26 To the best of our knowledge, our study is the first to report enantiospecific field derived BAFs for pharmaceuticals in fish.
Interestingly, considerable differences were observed in drug EF values between muscle and liver tissues, but also with the EF values of water samples. Fluoxetine EF values were 0.62 ± 0.02 and 0.74 ± 0.01 in muscle and liver tissue showing an enrichment of S(+)-fluoxetine. Citalopram was enriched with R(−)-citalopram with EF values of 0.29 ± 0.03 and 0.18 ± 0.01 in muscle and liver (Table 2). In contrast, citalopram EF values in the water samples were in the range 0.36–0.49 (Table 1). Most notable differences in EF were observed for venlafaxine due to venlafaxine-E2 being less than the MQL. The EF values were >0.86 in muscle and >0.94 in liver tissue (Table 2). Again, these were different to the EF values of 0.50–0.59 in water samples (Table 1). Ruan et al.30 found enrichment of R(−)-venlafaxine in fish samples from Hong Kong. Furthermore, Qu et al.51 reported enantiospecific accumulation of venlafaxine in Misgurnus anguillicaudatus (pond loach) co-exposed to the drug and microplastic in laboratory studies. In our study, differences in EF values between muscle and liver as well as the water suggest that these compounds are metabolised enantioselectively by P. flesus. However, enantiomer specific uptake and distribution within the fish may contribute to this. For example, enantioselectivity of the insecticide profenofos by an isolated bacterial strain was attributed to the uptake process over enzymatic degradation.52 Unfortunately, there is a lack of toxicokinetic data of drug enantiomers in fish. Therefore, further work is needed to ascertain the mechanisms of enantioselectivity observed in P. flesus.
4. Conclusions and outlook
Widespread occurrence of a range of commonly used human drugs were found in the Clyde Estuary, with the enantiomeric composition of some drugs differing from their manufactured forms. Enantioselectivity of fluoxetine, venlafaxine and citalopram was observed in fish (European flounder) from the inner estuary. The enantiomeric composition of these drugs in liver and muscle tissues were markedly different from water samples. There is a need for enantioselective ecotoxicological studies. Both the agonistic or antagonistic impacts of the individual enantiomers in the cocktail of chemicals (e.g. persistent organic pollutants and heavy metals) to which the biota are being exposed needs assessed. Furthermore, the potential consequences of such chemicals being present in marine coastal waters on the wide range of species present, including zooplankton and the adult invertebrates, needs considered.Conflicts of interest
There are no conflicts to declare.Acknowledgements
This work was supported by the Royal Society (RGS\R1\191250). Support by the Royal Society of Edinburgh is also greatly appreciated. The authors wish to thank Marine Scotland Science (MSS) and the Scottish Environment Protection Agency (SEPA) for providing the samples used in this study. In particular, Matt Blackburn and Jack Bloodworth (both SEPA) and Hannah Anderson (MSS) are acknowledged for their assistance. Contains SEPA data© Scottish Environment Protection Agency and database right 2019. All rights reserved.References
- J. B. Ellis, Pharmaceutical and personal care products (PPCPs) in urban receiving waters, Environ. Pollut., 2006, 144(1), 184–189 CrossRef CAS PubMed.
- S. R. Hughes, P. Kay and L. E. Brown, Global synthesis and critical evaluation of pharmaceutical data sets collected from river systems, Environ. Sci. Technol., 2013, 47(2), 661–677 CrossRef CAS PubMed.
- E. Zuccato, S. Castiglioni R. Bagnati, C. Chiabrando, P. Grassi and R. Fanelli, Illicit drugs, a novel group of environmental contaminants, Water Res., 2008, 42(4–5), 961–968 CrossRef CAS PubMed.
- Scottish Government, Contaminants in sediment and biota, available from: https://marine.gov.scot/sma/assessment-theme/contaminants-sediment-and-biotaMarineScotland, Edinburgh, UK, 2020, accessed 03/11/21 Search PubMed.
- K. A. Kidd, P. J. Blanchfield, K. H. Mills, V. P. Palace, R. E. Evans, J. M. Lazorchak and R. W. Flick, Collapse of a fish population after exposure to a synthetic estrogen, Proc. Natl. Acad. Sci. U. S. A., 2007, 104(21), 8897–8901 CrossRef CAS PubMed.
- T. Brodin, J. Fick, M. Jonsson and J. Klaminder, Dilute concentrations of a psychiatric drug alter behavior of fish from natural populations, Science, 2013, 339(6121), 814–815 CrossRef CAS PubMed.
- M. S. Kostich, A. L. Batt and J. M. Lazorchak, Concentrations of prioritized pharmaceuticals in effluents from 50 large wastewater treatment plants in the USA and implications for risk estimation, Environ. Pollut., 2014, 184, 354–359 CrossRef CAS PubMed.
- W. C. Li, Occurrence, sources, and fate of pharmaceuticals in aquatic environment and soil, Environ. Pollut., 2014, 187, 193–201 CrossRef CAS PubMed.
- B. Petrie, A review of combined sewer overflows as a source of wastewater-derived emerging contaminants in the environment and their management, Environ. Sci. Pollut. Res., 2021, 28, 32095–32110 CrossRef CAS PubMed.
- H. Zhao, J. L. Zhou and J. Zhang, Tidal impact on the dynamic behavior of dissolved pharmaceuticals in the Yangtze Estuary, China, Sci. Total Environ., 2015, 536, 946–954 CrossRef CAS PubMed.
- M. G. Cantwell, D. R. Katz, J. C. Sullivan, D. Shapley, J. Lipscomb, J. Epstein, A. R. Juhl, C. Knudson and G. D. O'Mullan, Spatial patterns of pharmaceuticals and wastewater tracers in the Hudson River Estuary, Water Res., 2018, 137, 335–343 CrossRef CAS PubMed.
- P. Reis-Santos, M. Pais, B. Duarte, I. Caçador, A. Freitas, A. S. Vila Pouca, J. Barbosa, S. Leston, J. Rosa, F. Ramos, H. N. Cabral, B. M. Gillanders and V. F. Fonseca, Screening of human and veterinary pharmaceuticals in estuarine waters: A baseline assessment for the Tejo estuary, Mar. Pollut. Bull., 2018, 135, 1079–1084 CrossRef CAS PubMed.
- S. Letsinger, P. Kay, S. Rodríguez-Mozaz, M. Villagrassa, D. Barceló and J. M. Rotchell, Spatial and temporal occurrence of pharmaceuticals in UK estuaries, Sci. Total Environ., 2019, 678, 74–84 CrossRef CAS PubMed.
- T. Topaz, A. Boxall, Y. Suari, R. Egozi, T. Sade and B. Chefetz, Ecological Risk Dynamics of Pharmaceuticals in Micro-Estuary Environments, Environ. Sci. Technol., 2020, 54(18), 11182–11190 CrossRef CAS PubMed.
- EMEA, Guideline on the Environmental Risk Assessment of Medicinal Products for Human Use, EMEA/CHMP/SWP/4447/00, 2006 Search PubMed.
- M. Huerta-Fontela, M. T. Galceran and F. Ventura, Fast liquid chromatography-quadrupole-linear ion trap mass spectrometry for the analysis of pharmaceuticals and hormones in water resources, J. Chromatogr. A, 2010, 1217(25), 4212–4222 CrossRef CAS PubMed.
- E. Sanganyado, Z. Lu, Q. Fu, D. Schlenk and J. Gan, Chiral pharmaceuticals: A review on their environmental occurrence and fate processes, Water Res., 2017, 124, 527–542 CrossRef CAS PubMed.
- J. K. Stanley, A. J. Ramirez, C. K. Chambliss and B. W. Brooks, Enantiospecific sublethal effects of the antidepressant fluoxetine to a model aquatic vertebrate and invertebrate, Chemosphere, 2007, 69(1), 9–16 CrossRef CAS PubMed.
- J. Bagnall, L. Malia, A. Lubben and B. Kasprzyk-Hordern, Stereoselective biodegradation of amphetamine and methamphetamine in river microcosms, Water Res., 2013, 47(15), 5708–5718 CrossRef CAS PubMed.
- M. J. Andrés-Costa, K. Proctor, M. T. Sabatini, A. P. Gee, S. E. Lewis, Y. Pico and B. Kasprzyk-Hordern, Enantioselective transformation of fluoxetine in water and its ecotoxicological relevance, Sci. Rep., 2017, 7(1), 15777 CrossRef PubMed.
- S. Evans, J. Bagnall and B. Kasprzyk-Hordern, Enantiomeric profiling of a chemically diverse mixture of chiral pharmaceuticals in urban water, Environ. Pollut., 2017, 230, 368–377 CrossRef CAS PubMed.
- K. McKenzie, C. F. Moffat and B. Petrie, Multi-residue enantioselective determination of emerging drug contaminants in seawater by solid phase extraction and liquid chromatography-tandem mass spectrometry, Anal. Methods, 2020, 12(22), 2881–2892 RSC.
- M. M. Coelho, A. R. Lado Ribeiro, J. C. G. Sousa, C. Ribeiro, C. Fernandes, A. M. T. Silva and M. E. Tiritan, Dual enantioselective LC-MS/MS method to analyse chiral drugs in surface water: Monitoring in Douro River estuary, J. Pharm. Biomed. Anal., 2019, 170, 89–101 CrossRef CAS PubMed.
- P. Arnnok, R. R. Singh, R. Burakham, A. Pérez-Fuentetaja and D. S. Aga, Selective Uptake and Bioaccumulation of Antidepressants in Fish from Effluent-Impacted Niagara River, Environ. Sci. Technol., 2017, 51(18), 10652–10662 CrossRef CAS PubMed.
- K. Grabicova, R. Grabic, G. Fedorova, J. Fick, D. Cerveny, J. Kolarova, J. Turek, V. Zlabek and T. Randak, Bioaccumulation of psychoactive pharmaceuticals in fish in an effluent dominated stream, Water Res., 2017, 124, 654–662 CrossRef CAS PubMed.
- V. F. Fonseca, I. A. Duarte, B. Duarte, A. Freitas, A. S. V. Pouca, J. Barbosa, B. M. Gillanders and P. Reis-Santos, Environmental risk assessment and bioaccumulation of pharmaceuticals in a large urbanized estuary, Sci. Total Environ., 2021, 783, 147021 CrossRef CAS PubMed.
- M. Li, X. Liang, X. Guo, X. Di and Z. Jiang, Enantiomeric separation and enantioselective determination of some representive non-steroidal anti-inflammatory drug enantiomers in fish tissues by using chiral liquid chromatography coupled with tandem mass spectrometry, Microchem. J., 2020, 153, 104511 CrossRef CAS.
- C. Caballo, M. D. Sicilia and S. Rubio, Enantioselective analysis of non-steroidal anti-inflammatory drugs in freshwater fish based on microextraction with a supramolecular liquid and chiral liquid chromatography-tandem mass spectrometry, Anal. Bioanal. Chem., 2015, 407(16), 4721–4731 CrossRef CAS PubMed.
- G. C. Nallani, P. M. Paulos, L. A. Constantine, B. J. Venables and D. B. Huggett, Bioconcentration of ibuprofen in fathead minnow (Pimephales promelas) and channel catfish (Ictalurus punctatus), Chemosphere, 2011, 84(10), 1371–1377 CrossRef CAS PubMed.
- Y. Ruan, H. Lin, X. Zhang, R. Wu, K. Zhang, K. M. Y. Leung, J. C. W. Lam and P. K. S. Lam, Enantiomer-specific bioaccumulation and distribution of chiral pharmaceuticals in a subtropical marine food web, J. Hazard. Mater., 2020, 394, 122589 CrossRef CAS PubMed.
- A. J. Ramirez, R. A. Brain, S. Usenko, M. A. Mottaleb, J. G. O'Donnell, L. L. Stahl, J. B. Wathen, B. D. Snyder, J. L. Pitt, P. Perez-Hurtado, L. L. Dobbins, B. W. Brooks and C. K. Chambliss, Occurrence of pharmaceuticals and personal care products in fish: Results of a national pilot study in the United States, Environ. Toxicol. Chem., 2009, 28(12), 2587–2597 CrossRef CAS PubMed.
- I. J. Buerge, T. Poiger T, M. D. Müller and H. R. Buser, Caffeine, an anthropogenic marker for wastewater contamination of surface waters, Environ. Sci. Technol., 2003, 37(4), 691–700 CrossRef CAS PubMed.
- M. J. Benotti and B. J. Brownawell, Microbial degradation of pharmaceuticals in estuarine and coastal seawater, Environ. Pollut., 20079, 157, 994–1002 CrossRef PubMed.
- L. Minguez, J. Pedelucq, E. Farcy, C. Ballandonne, H. Budzinski and M.-P. Halm-Lemeille, Toxicities of 48 pharmaceuticals and their freshwater and marine environmental assessment in northwestern France, Environ. Sci. Pollut. Res., 2016, 23(6), 4992–5001 CrossRef CAS PubMed.
- E. Emke, S. Evans, B. Kasprzyk-Hordern and P. de Voogt, Enantiomer profiling of high loads of amphetamine and MDMA in communal sewage: A Dutch perspective, Sci. Total Environ., 2014, 487, 666–672 CrossRef CAS PubMed.
- B. Kasprzyk-Hordern and D. R. Baker, Estimation of community-wide drugs use via stereoselective profiling of sewage, Sci. Total Environ., 2012, 423, 142–150 CrossRef CAS PubMed.
- V. K. Vashistha and A. Kumar, A. Stereochemical facets of clinical β-blockers: An overview, Chirality, 2020, 32, 722–735 CrossRef CAS PubMed.
- F. O. Agunbiade and B. Moodley, Pharmaceuticals as emerging organic contaminants in Umgeni River water system, KwaZulu-Natal, South Africa, Environ. Monit. Assess., 2014, 186(11), 7273–7291 CrossRef CAS PubMed.
- P. A. Lara-Martín, E. González-Mazo, M. Petrovic, D. Barceló and B. J. Brownawell, Occurrence, distribution and partitioning of nonionic surfactants and pharmaceuticals in the urbanized Long Island Sound Estuary (NY), Mar. Pollut. Bull., 2014, 85(2), 710–719 CrossRef PubMed.
- G. F. Birch, D. S. Drage, K. Thompson, G. Eaglesham and J. F. Mueller, Emerging contaminants (pharmaceuticals, personal care products, a food additive and pesticides) in waters of Sydney estuary, Australia, Mar. Pollut. Bull., 2015, 97(1–2), 56–66 CrossRef CAS PubMed.
- Y. Aminot, K. Le Menach, P. Pardon, H. Etcheber and H. Budzinski, Inputs and seasonal removal of pharmaceuticals in the estuarine Garonne River, Mar. Chem., 2016, 185, 3–11 CrossRef CAS.
- M. G. Cantwell, D. R. Katz, J. C. Sullivan, D. Shapley, J. Lipscomb, J. Epstein, A. R. Juhl, C. Knudson and G. D. O'Mullan, Spatial patterns of pharmaceuticals and wastewater tracers in the Hudson River Estuary, Water Res., 2018, 137, 335–343 CrossRef CAS PubMed.
- N. A. H. Ismail, S. Y. Wee, N. H. Kamarulzaman and A. Z. Aris, Quantification of multi-classes of endocrine-disrupting compounds in estuarine water, Environ. Pollut., 2019, 249, 1019–1028 CrossRef CAS PubMed.
- L. J. Fono and D. L. Sedlak, Use of the chiral pharmaceutical propranolol to identify sewage discharges into surface waters, Environ. Sci. Technol., 2005, 39(23), 9244–9252 CrossRef CAS PubMed.
- G. Hancu, D. Lupu, A. Milan, M. Budău and E. Barabás-Hajdu, Enantioselective analysis of venlafaxine and its active metabolites: A review on the separation methodologies, Biomed. Chromatogr., 2021, 35, e4874 CrossRef CAS PubMed.
- Public Health Scotland, 2021, Community Dispensing, available from: https://www.isdscotland.org/Health-topics/Prescribing-and-medicines/Community-Dispensing/Dispenser-Remuneration/Date, accessed: 15/11/21 Search PubMed.
- O. V. Olesen and K. Linnet, Studies on the Stereoselective Metabolism of Citalopram by Human Liver Microsomes and cDNA-Expressed Cytochrome P450 Enzymes, Pharmacology, 1999, 59, 298–309 CrossRef CAS PubMed.
- B. W. Brooks, C. K. Chambliss, J. K. Stanley, A. Ramirez, K. E. Banks, R. D. Johnson and R. J. Lewis, Determination of select antidepressants in fish from an effluent-dominated stream, Environ. Toxicol. Chem., 2005, 24(2), 464–469 CrossRef CAS PubMed.
- T. H. Miller, N. R. Bury, S. F. Owen, J. I. MacRae and L. P. Barron, A review of the pharmaceutical exposome in aquatic fauna, Environ. Pollut., 2018, 239, 129–146 CrossRef CAS PubMed.
- E. S. McCallum, E. Krutzelmann, T. Brodin, J. Fick, A. Sundelin and S. Balshine, Exposure to wastewater effluent affects fish behaviour and tissue-specific uptake of pharmaceuticals, Sci. Total Environ., 2017, 605–606, 578–588 CrossRef CAS PubMed.
- H. Qu, R. Ma, B. Wang, J. Yang, L. Duan and G. Yu, Enantiospecific toxicity, distribution and bioaccumulation of chiral antidepressant venlafaxine and its metabolite in loach (Misgurnus anguillicaudatus) co-exposed to microplastic and the drugs, J. Hazard. Mater., 2019, 370, 203–211 CrossRef CAS PubMed.
- L. Fang, Q. Shi, L. Xu, T. Shi, X. Wu, Q. X. Li and R. Hua, Enantioselective Uptake Determines Degradation Selectivity of Chiral Profenofos in Cupriavidus nantongensis X1T, J. Agric. Food Chem., 2020, 68(24), 6493–6501 CrossRef CAS PubMed.
Footnote |
| † Electronic supplementary information (ESI) available. See DOI: 10.1039/d1em00500f |
| This journal is © The Royal Society of Chemistry 2022 |