
 Open Access Article
 This Open Access Article is licensed under a Creative Commons Attribution-Non Commercial 3.0 Unported Licence
Selenium concentration in herring from the Baltic Sea tracks decadal and spatial trends in external sources†
Anne L.
Soerensen
 *a,
Aryeh
Feinberg
b and
Amina T.
Schartup
c
*a,
Aryeh
Feinberg
b and
Amina T.
Schartup
c
aDepartment of Environmental Research and Monitoring, Swedish Museum of Natural History, Stockholm, Sweden. E-mail: anne.soerensen@nrm.se
bInstitute for Data, Systems, and Society, Massachusetts Institute of Technology, Cambridge, Massachusetts, USA
cScripps Institution of Oceanography, University of California San Diego, La Jolla, California, USA
First published on 25th February 2022
Abstract
Selenium (Se) has a narrow range between nutritionally optimal and toxic concentrations for many organisms, including fish and humans. However, the degree to which humans are affecting Se concentrations in coastal food webs with diffuse Se sources is not well described. Here we examine large-scale drivers of spatio-temporal variability in Se concentration in herring from the Baltic Sea (coastal sea) to explore the anthropogenic impact on a species from the pelagic food web. We analyze data from three herring muscle time series covering three decades (1979–2010) and herring liver time series from 20 stations across the Baltic Sea covering a fourth decade (2009–2019). We find a 0.7–2.0% per annum (n = 26–30) Se decline in herring muscle samples from 0.34 ± 0.02 μg g−1 ww in 1979–1981 to 0.18 ± 0.03 μg g−1 ww in 2008–2010. This decrease continues in the liver samples during the fourth decade (6 of 20 stations show significant decrease). We also find increasing North-South and East-West gradients in herring Se concentrations. Using our observations, modelled Se deposition (spatio-temporal information) and estimated Se river discharge (spatial information), we show that the spatial variability in herring Se tracks the variability in external source loads. Further, between 1979 and 2010 we report a ∼5% per annum decline in direct Se deposition and a more gradual, 0.7–2.0% per annum, decline in herring Se concentrations. The slower rate of decrease for herring can be explained by stable or only slowly decreasing riverine inputs of Se to the Baltic Sea as well as recycling of Se within the coastal system. Both processes can reduce the effect of the trend predicted from direct Se deposition. We show that changing atmospheric emissions of Se may influence Se concentrations of a pelagic fish species in a coastal area through direct deposition and riverine inputs from the terrestrial landscape.
Environmental significanceSelenium (Se) is an essential nutrient that can become toxic at elevated concentrations. However, the degree to which humans are affecting Se concentrations in coastal food webs with diffuse sources is not well described. Here, we analyze four decades (1979–2019) of Se concentrations in herring (Clupea harengus) from the Baltic Sea. We find a 0.7–2.0% per annum decline in herring Se and a North-South and East-West concentration gradient consistent with spatio-temporal patterns in atmospheric deposition and river Se inputs. Our study shows that decreasing anthropogenic emissions and spatial variability in deposition is a likely driver of observed Se concentrations in coastal food webs through direct deposition and riverine inputs from the terrestrial landscape. |
Introduction
Selenium (Se) is released naturally from weathering of rock and volcanic activity, but also from human industrial activities such as metal smelting, fossil fuel combustion and manufacturing.1–3 It is an essential trace element for many organisms, including phytoplankton, fish and humans but can be toxic at levels above the nutritional requirement.4,5 Therefore even modest changes in Se levels can have implications for the marine food web and human exposure.6 While several studies have investigated the response of estuarine and coastal food webs to changes in local point sources,7,8 the degree to which large scale changes in anthropogenic emissions can drive Se concentrations in coastal food webs is not well described. To explore this, we compare four decades (1979–2019) of Se concentrations in herring (Clupea harengus) captured across the Baltic Sea (56°–62°N) with trends in external source loads.The few earlier studies on the impact of changing source loads to aquatic systems have focused on freshwater and estuarine environments. Most of these studies have investigated either spatial or temporal variability and limited the focus to the link between point sources and water or water and biota. For example, Feinberg et al.9 compared modeled Se deposition to time series (≤20 years) of stream Se concentrations. They found that deposition trends were reflected in some watersheds dominated by direct deposition, whereas terrestrial runoff controlled stream concentrations for other watersheds. In rivers and large estuaries, local point sources and mobilization through seasonal irrigation activities have also been shown to significantly impact seasonal and, in some cases, long term variability of not only the water concentrations but also Se concentrations in mussel and fish.7,8,10 Furthermore, Ponton and Hare11 found that the planktivore Chaoborus tracked the spatial variability of Se water concentration across 16 lakes. While factors other than external loads can impact the uptake into the food web (like Se speciation,12–14 partitioning,8,15 plankton species present12,16 and sulfate (SO42−) concentration12,17), many studies suggest that variability in source loads are reflected in food web Se concentration.
Anthropogenic Se emissions began a rapid increase in the 1850s and peaked in the 1970s.18,19 Recent improvements in pollution control technology have led to a 25–65% deposition decrease per decade in Europe.9 Feinberg et al.9 found that the decrease is most notable on land but that it is also reflected in coastal areas. A short average residence time of total Se in the water column of coastal oceans globally of ∼100 days18 suggest that water Se concentrations are likely to closely follow changes in external Se sources. The Baltic Sea is a semi-enclosed sea divided into shallow basins (ca. 50% less than 50 m deep20) by sills with a range of large rivers draining into it.21 Its river catchments are influenced to a different degree by agriculture and other human activities.22 The Baltic Sea is therefore an excellent system to investigate a link between external sources and the food web in coastal systems. Ponton and Hare11 showed that a planktivorous species could be used as an indicator for Se levels in the water column of lakes. Planktivorous species will integrate Se over time, reducing some of the variability associated with short-term temporal changes in water column Se concentrations. Herring, a planktivorous species,23,24 is found across the entire Baltic Sea system. Its Se level in the region is below the quality criteria set by the US EPA for freshwater fish (11.3 μg g−1 muscle dry weight (dw)).25 Due to the seasonal migration of herring, its Se concentration integrates variability across larger geographical areas. In the Baltic Sea, herring migrate mostly within basin boundaries26–28 making it useful for exploring large scale spatio-temporal patterns in the region.
In this study, we investigate the impact of external Se loads on the spatio-temporal variability of Se concentrations in a coastal sea using herring as a proxy for Se variability in the pelagic food web. We do this by combining data analysis from three time series covering three decades (1979–2010) with more geographically diverse time series from 20 stations across the Baltic Sea covering a fourth decade (2009–2019). We compare these data to the spatio-temporal variability in Se deposition, predicted by the atmospheric aerosol-chemistry-climate model SOCOL-AERv2, and the spatial variability of river Se discharge to identify possible anthropogenic drivers of herring Se concentrations.
Method
To carry out both temporal and spatial analysis of Se concentrations in the Baltic Sea biota, we combine the analysis of multiple datasets that have previously been published separately.29–31 All Se concentrations used for our study were obtained from herring which is the primary species collected through the Swedish monitoring program for contaminants in marine biota.29 Total body weight, total length, body length, sex, age, reproductive stage, and liver weight were registered for all specimen according to Soerensen and Faxneld.29In this study, we rely on (1) Se concentrations in herring liver from 20 locations across the Baltic Sea and Kattegat (2009–2019) to examine the spatial variability and short term temporal changes in herring Se, (2) Se concentrations in herring muscle from three Baltic Sea locations (1979–2010) to investigate the decadal change in herring Se and (3) Se concentrations in different herring tissues from a screening project conducted in 2016 to establish a muscle to liver conversion factor, which we use to visually compare results from the first two datasets.
Male–female tissue and organ comparison
In 2016, 25 females and 25 males were collected at the Lilla Vartan site (Fig. 1). Brain, eyes, gills, gonads, kidney, liver, skin and subcutaneous fat, muscle, spine, stomach and remaining tissue (carcass) was collected following the protocol in Danielsson et al.,31 after which samples were homogenized and distributed into jars for analysis. 0.8–5.0 g wet weight (ww) of homogenate was used for Se analysis. The samples were analyzed according to the method used in the Swedish monitoring program for contaminants in marine biota described below and in detail in Soerensen and Faxneld.29 Eleven duplicate tissues samples were analyzed and averaged 2% (<1–5%) relative difference.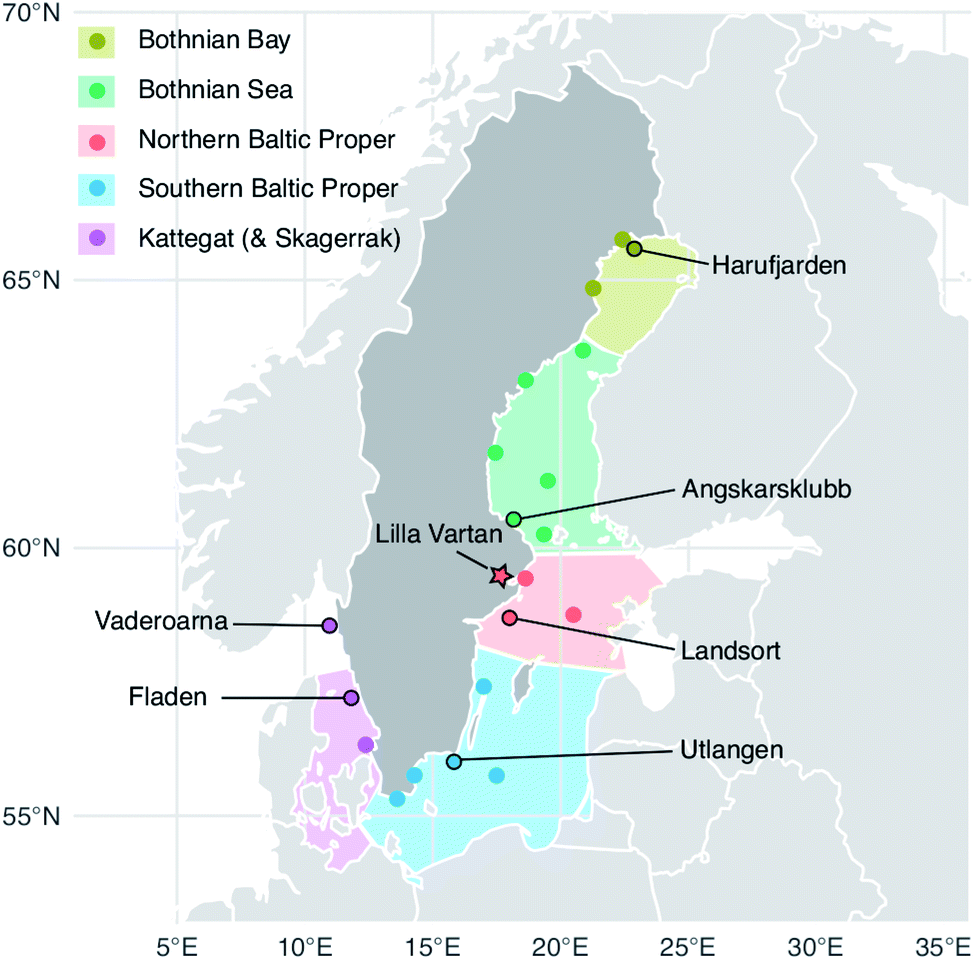 | ||
| Fig. 1 Herring capture locations (stations) and outline of the five Baltic Sea basins. The Baltic Proper is often considered in its full extend but to highlight the north to south gradient in the data we have divided it into a northern and a southern sub-basin. Circles: sites used in the 2009–2019 temporal trends analysis of liver samples; outlined circles with names: sites where 10 individual specimen samples are collected each year. These stations were used in the spatial analysis (2009–2019 liver data) and three of them in the historic trend analysis (1979–2010 muscle data); star: site sampled for the multi tissue study (2016). A full list of site names and coordinates are found in the ESI Table S1.† The Kattegat basin includes a station (Vaderoarna) which is located just north of the basin border in Kattegat. | ||
Monitoring data
The Swedish monitoring program for contaminants in marine biota started reporting Se in herring liver in 2009; we use the currently available data from 2009 to 2019. Fish samples were handled following the Swedish National Monitoring Program's manual for collection, preparation, and storage.29Fig. 1 shows the 20 herring capture sites (a full list of site names and coordinates are found in the ESI Table S1†). To minimize the impact of environmental and biological variability, fish were harvested in the fall (August–October) and, to the extent possible, 3-to-5-year-old fish were selected for Se analysis. To capture seasonal variability an additional spring (May) sampling was conducted at stations Utlangen and Angskarsklubb. In our data analysis, we handle spring and fall data as separate time series. For 6 of the stations, 10 individual liver samples were analyzed, while for the remaining 14 stations, two pooled (homogenized) liver samples consisting of 10–12 individuals were analyzed (Fig. 1).Livers were completely removed from carcasses and weighed, 0.5–1 g were used for metal analyses at the Department of Environmental Science at Stockholm University. Samples were freeze-dried, then microwave acid digested (assisted pressure digestion) in nitric acid (HNO3) and hydrogen peroxide (H2O2) according to the Swedish standard SS-EN 13805:2014 (foodstuffs – determination of trace elements – pressure digestion). The Se concentrations were then quantified following the Swedish standard SS-EN ISO 17294-2:2016 (water quality – application of inductively coupled plasma mass spectrometry (ICP-MS) – part 2: determination of 62 elements) using ICP-MS in collision/reaction cell mode. The level of detection (LOD) was 0.06 ± 0.01 μg g−1 dw and the level of quantification (LOQ) was 0.17 ± 0.3 μg g−1 dw for 2018–2019 (n = 150) (LOD and LOQ was not reported for prior years but the method did not change between 2009 and 2019).
Retrospective analyses
All retrospective analyses were done on samples taken from specimen stored at the Swedish Environmental Specimen Bank (ESB) at the Swedish Museum of Natural History. At the ESB fish were stored at −20 °C from collection and until they were thawed for sample extraction and processing. For each station, samples for all years included in the time series were prepared and analyzed together. For Angskarsklubb (1979–2010, n = 28) and Utlangan (1980–2009, n = 30) 0.2 g herring muscle from 12 individual specimen were pooled (total 2.4 g per pool) for each year. The samples were microwave digested in HNO3 and H2O2 and analyzed following EPA-methods (modified) 200.7 (ICP-AES) and/or 200.8 (ICP-SFMS). For Landsort (1981–2006, n = 26), herring muscle samples from 10 individual specimen were pooled and homogenized for each year before analysis were conducted by the Department of Environmental Science at Stockholm University as described for the Swedish monitoring program.29 Herring stored at the ESB are collected based on a criterion of a standardized length to avoid changes in biological variables to bias the concentrations. A correlation analysis with mean biological variables (age, length, weight) for the homogenized samples confirmed that there was no systematic influence from these variables (ESI Fig. S1†) and we therefore make no normalization of data.Conversion factor
We use the Bevelhimer et al.32 approach to calculate a muscle to liver dry weight conversion factor (k) for herring. We assume proportionality between muscle (Cmuscle) and liver (Cliver) concentrations (corresponding to a slope of one) and calculate k using the equation: ln(Cliver) − ln(Cmuscle) = ln(k). We use pooled samples wherein each batch consists of 12–25 fish. The pooled samples are from (1) Lilla Vartan and (2) years where observations for the retrospective muscle time-series and liver concentrations from the monitoring program at Bothnian Sea (Angskarsklubb), Northern Baltic Proper (Landsort) and Southern Baltic Proper (Utlangan) overlapped (see ESI Fig. S2 and Table S2† for information on data and calculation).Atmospheric selenium model
We obtain Se deposition estimates from the aerosol-chemistry-climate model SOCOL-AERv2![[thin space (1/6-em)]](https://www.rsc.org/images/entities/char_2009.gif) 33 that tracks Se emissions, atmospheric transport, and gaseous and particulate chemistry.34 A detailed model description can be found in Feinberg et al.34,35 In the model, emitted volatile Se species are oxidized into low volatility compounds that partition to the aerosol phase. The SOCOL-AER model tracks the sulfate particle size distribution in 40 size bins between 0.39 nm and 3.2 μm, and the Se content of each sulfate aerosol bin. The model includes microphysical processes like aerosol sedimentation, nucleation, condensation, evaporation, coagulation, and gaseous Se absorption into sulfate aerosols. Wet and dry deposition in SOCOL-AER are interactively coupled with grid cell meteorology and surface variables.36–38 For this study, we use the model version from Feinberg et al.,35 where the model resolution is ∼2.8° × 2.8° and with 39 vertical levels up to 80 km. Model simulations are nudged towards ERA-Interim39 surface pressure, temperature, vorticity, and divergence fields to increase the similarity between modelled and observed meteorology. The model is run with Se emission inventories developed in Feinberg et al.34,35 for four source categories: anthropogenic activities, marine biosphere, terrestrial biosphere, and volcanos. The Se emission inventories are scaled from the spatial distribution of existing sulfur emission inventories,40–43 with global scaling factors for each source type based on the median estimates from a Bayesian inversion.35 The Se simulation has been evaluated in Feinberg et al.9,35 showing good agreement with available aerosol (R2 = 0.66) and wet deposition (R2 = 0.57) measurements, as well as matching the recent declining trends in Se deposition measured in North America and Western Europe. We use model output from 4 sub-regions of the Baltic Sea and a North Sea reference point from the period 1979–2017 (Fig. 2B).
33 that tracks Se emissions, atmospheric transport, and gaseous and particulate chemistry.34 A detailed model description can be found in Feinberg et al.34,35 In the model, emitted volatile Se species are oxidized into low volatility compounds that partition to the aerosol phase. The SOCOL-AER model tracks the sulfate particle size distribution in 40 size bins between 0.39 nm and 3.2 μm, and the Se content of each sulfate aerosol bin. The model includes microphysical processes like aerosol sedimentation, nucleation, condensation, evaporation, coagulation, and gaseous Se absorption into sulfate aerosols. Wet and dry deposition in SOCOL-AER are interactively coupled with grid cell meteorology and surface variables.36–38 For this study, we use the model version from Feinberg et al.,35 where the model resolution is ∼2.8° × 2.8° and with 39 vertical levels up to 80 km. Model simulations are nudged towards ERA-Interim39 surface pressure, temperature, vorticity, and divergence fields to increase the similarity between modelled and observed meteorology. The model is run with Se emission inventories developed in Feinberg et al.34,35 for four source categories: anthropogenic activities, marine biosphere, terrestrial biosphere, and volcanos. The Se emission inventories are scaled from the spatial distribution of existing sulfur emission inventories,40–43 with global scaling factors for each source type based on the median estimates from a Bayesian inversion.35 The Se simulation has been evaluated in Feinberg et al.9,35 showing good agreement with available aerosol (R2 = 0.66) and wet deposition (R2 = 0.57) measurements, as well as matching the recent declining trends in Se deposition measured in North America and Western Europe. We use model output from 4 sub-regions of the Baltic Sea and a North Sea reference point from the period 1979–2017 (Fig. 2B).
 | ||
| Fig. 2 Five-year average concentration of (A) Se liver content (dry weight) (2015–2019) and (B) modeled deposition (2013–2017), (C) terrestrial discharge based on stream Se concentrations (1998–2001), (D) the correlation between modelled deposition and liver concentration indicating the coefficient of determination (R2). Numbers 1–5 on (B) indicate the grid cells used for the time series in Fig. 4B. (1) Bothnian Bay, (2) Northern Baltic Proper and Bothnian Sea, (3) Southern Baltic Proper, (4) Kattegat, (5) North Atlantic reference site. Triangular ends of color bars indicate that there are extreme values mapped which are below or above the color bar limits. | ||
Terrestrial Se input loads
We calculate basin specific and total Baltic Sea Se river discharge concentrations and input loads as well as loads per m2 (basins: (1) Bothnian Bay and Sea, (2) Northern and Southern Baltic Proper, (3) Kattegat (including the Belt Seas), and two additional water bodies to the east in the Baltic Sea: (4) Gulf of Finland, (5) Gulf of Riga). To do this, we divide the Baltic Sea river catchment into 21 areas (ESI Table S3†). Fourteen areas are large international river basins where drainage area and river discharge are taken from Nilsson.21 The additional areas are defined by combining the remaining river basins into larger areas based on catchment information from Helcom meta data catalogue (http://metadata.helcom.fi). River discharge for each area was estimated based on information on region wide river discharge using 1950–2015 averages44,45 except for Kattegat where river discharge from 2000 was used.22 Salminen et al.46 provide a broad geographical survey of Se in streams across Europe from 1998–2001 (ESI Fig. S3†). 214 observations in streams overlap with our 21 areas and we calculate an average Se stream concentration for each area (ESI Table S3†). We use the water discharge and Se concentration for each area to calculate the yearly load of Se to the Baltic Sea. To get the input per m2 we divide by the area of each of the Baltic Sea basins.To explore possible temporal Se trends in river water, we compile results from published surveys (ESI Table S4†). Data are available from 1977 to 2012.
Statistics
All statistical analyses were done in R.47 We use log-linear regression analysis to detect temporal trends. The slope of the regression line describes the annual percentage change. The log-linear model assumes that the residuals are independent of each other and evenly distributed, which means that the residuals for each year should be randomly spread around zero. We further calculate the statistical power to find a trend in the time series given the variability in our samples and the length of the time series.48 For the three retrospective muscle time series, observational residual standard deviations were in the range of 0.11–0.12. This implies >95% statistical power to detect a yearly change of 1% over 25 years. For the shorter liver time series most observational residual standard deviations indicated >90% statistical power to detect a yearly change of 5% over 10 years.To examine differences in Se concentrations between sites ANOVA and ANCOVA were used for parametric data while a Kruskal–Wallis with Dunn's multiple comparison post-hoc test was used for nonparametric data. Reported values below the LOQ are substituted by the value of the reported LOQ divided by the square root of 2. This only applies to the monitoring program as there are no values below LOQ for the retrospective data series or samples from Lilla Vartan.
Results and discussion
Selenium tissue distribution
Fig. 3A shows the homogenate (n = 25) tissue Se concentrations in female and male herring at Lilla Vartan (data in ESI Table S5†) and Fig. 3B the Se body burden for an average specimen. The concentration ranges from 0.25 μg g−1 dw in the skeleton of male herring to 3.81 μg g−1 dw in the liver of female herring, with an average concentration for whole fish of 0.77 μg g−1 dw (female) and 0.71 μg g−1 dw (male). While the muscle tissue contains some of the lowest Se concentrations (0.45–0.51 μg g−1 dw), the large percentage of muscle mass in herring (ESI Table S5†) means that it is the tissue where most Se is stored (31%). Since both female and male herring are included in the spatio-temporal analyses of Se variability we compare Se between sexes and confirm that there are no large differences in muscle and liver Se content (13% and <1%, respectively; see ESI Text S1† for discussion of other tissues). This suggest that our results from the spatio-temporal analyses are not impacted by the sex of the fish analyzed and are representative of the entire herring population.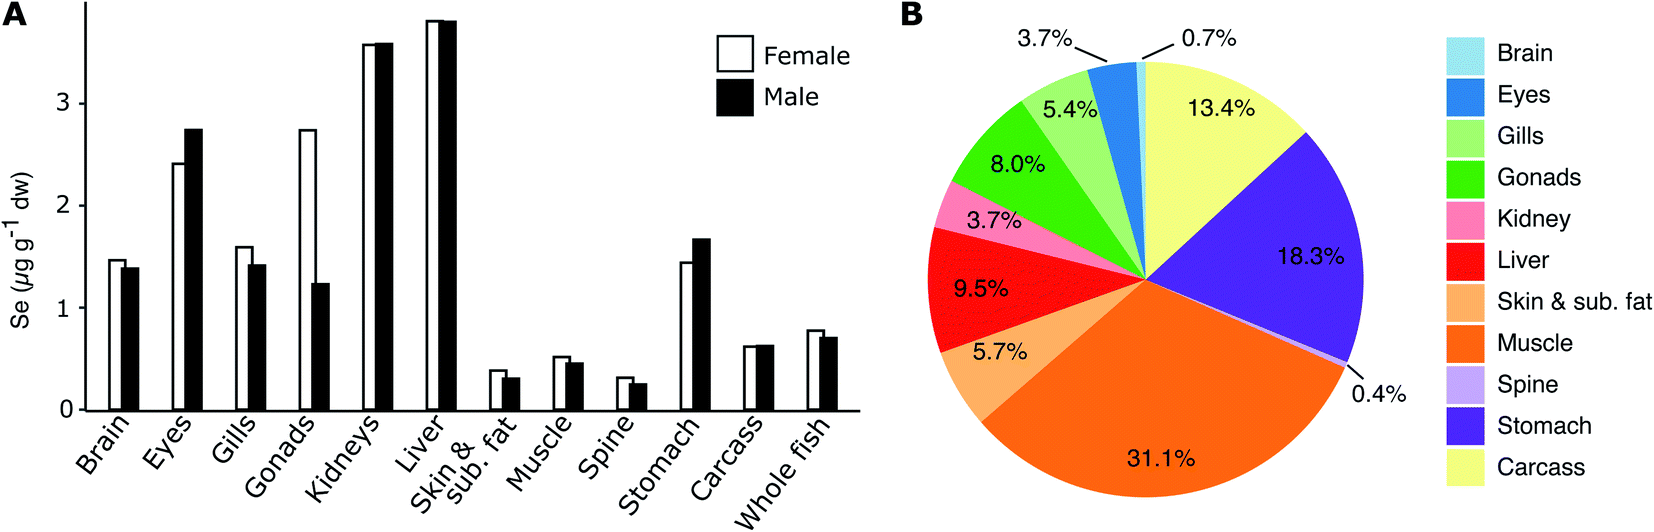 | ||
| Fig. 3 (A) Selenium concentrations in different tissues of female (homogenate of 25 fish, left columns) and male (homogenate of 25 fish; right columns) herring caught at Lilla Vartan and (B) the relative Se body burden of herring tissues (% of total Se mass found in each tissue calculated on a wet weight basis). Skin & sub. fat is short for “skin and subcutaneous fat”. | ||
Selenium liver to muscle relationship
We find an average dry weight muscle to liver conversion factor of 7.5 with a confidence interval of 6.5–8.6 (ESI Fig. S2 and Table S2†). Our conversion factor is higher than the factor of ∼4 that was found in a study of herring in the Southern Baltic Sea close to the Polish coast.49 However, since the Polish coast study did not report individual fish Se concentrations in muscle or liver, nor fish size and age intervals, a direct comparison with our findings is difficult as these could impact the result (as discussed in the Method section fish collected for use in our analysis is screened to ensure a small variability in age). For other fish species, relationships between Se liver and muscle concentrations show a wide range of conversion factors (liver/muscle ratios from 3 to >50,50–52 with most data on freshwater species). We conclude that since Se concentrations in muscle and liver tissue in herring from the Swedish coast and Baltic Sea offshore stations show a proportional relationship (ESI Fig. S2†), we can rely on the variability in Se concentrations in the two tissues to reflect the same external forcings and use both datasets to explore spatio-temporal trends. The conversion factor is further used to convert the 2009–2019 liver data to muscle concentrations for the three stations Angskarsklubb, Landsort and Utlangen. Retrospective muscle time series and converted liver time series are plotted together on Fig. 4 in order to give an idea about the decrease across the entire period of observations (1979–2019).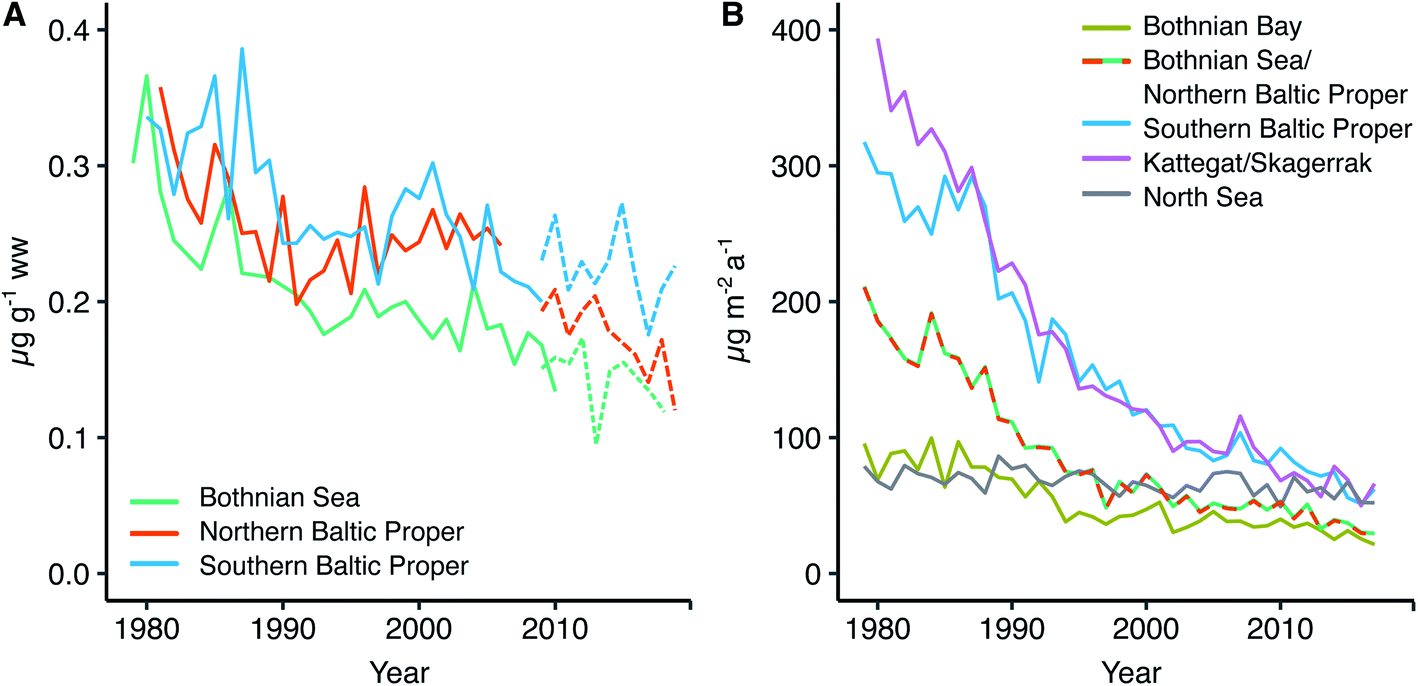 | ||
| Fig. 4 (A) Historic trend in herring Se muscle concentrations from three Baltic Sea locations (solid line) and data on herring Se liver concentrations from the monitoring program converted to muscle concentration using the muscle to liver conversion factor of 7.5 and the muscle dw percent (punctuated line), (B) modeled historic trend in selenium deposition to individual Baltic Sea sub-basins. Modeled Se deposition data for the Bothnian Sea and Northern Baltic Proper is from the same grid in the model (see Fig. 2B). Angskarsklubb represents the Southern Bothnian Sea, Landsort the Northern Baltic Proper and Utlangen the Southern Baltic Proper. | ||
Herring spatial selenium distribution
Fig. 2A shows the spatial variability of Se in herring liver. Between 2009 and 2019, the average liver Se concentrations was 7.55 ± 2.84 μg g−1 dw. There is a significant (p < 0.001) increase in the concentrations from north to south and east to west (Kruskal–Wallis non-parametric test followed by Dunn's test; Fig. 5). The Se concentration increases with 27% from the Bothnian Bay and Sea to the Southern Baltic Proper (north to south) and with 24% from the Southern Baltic Proper to Kattegat (east to west). In support of this result, we also find a significant increase in the Se concentrations in herring muscle from north to south in the retrospective time series (Bothnian Sea (Angskarsklubb) < Northern Baltic Proper (Landsort) < Southern Baltic Proper (Utlangan); ANCOVA with site and year as independent variables; ESI Fig. S4†).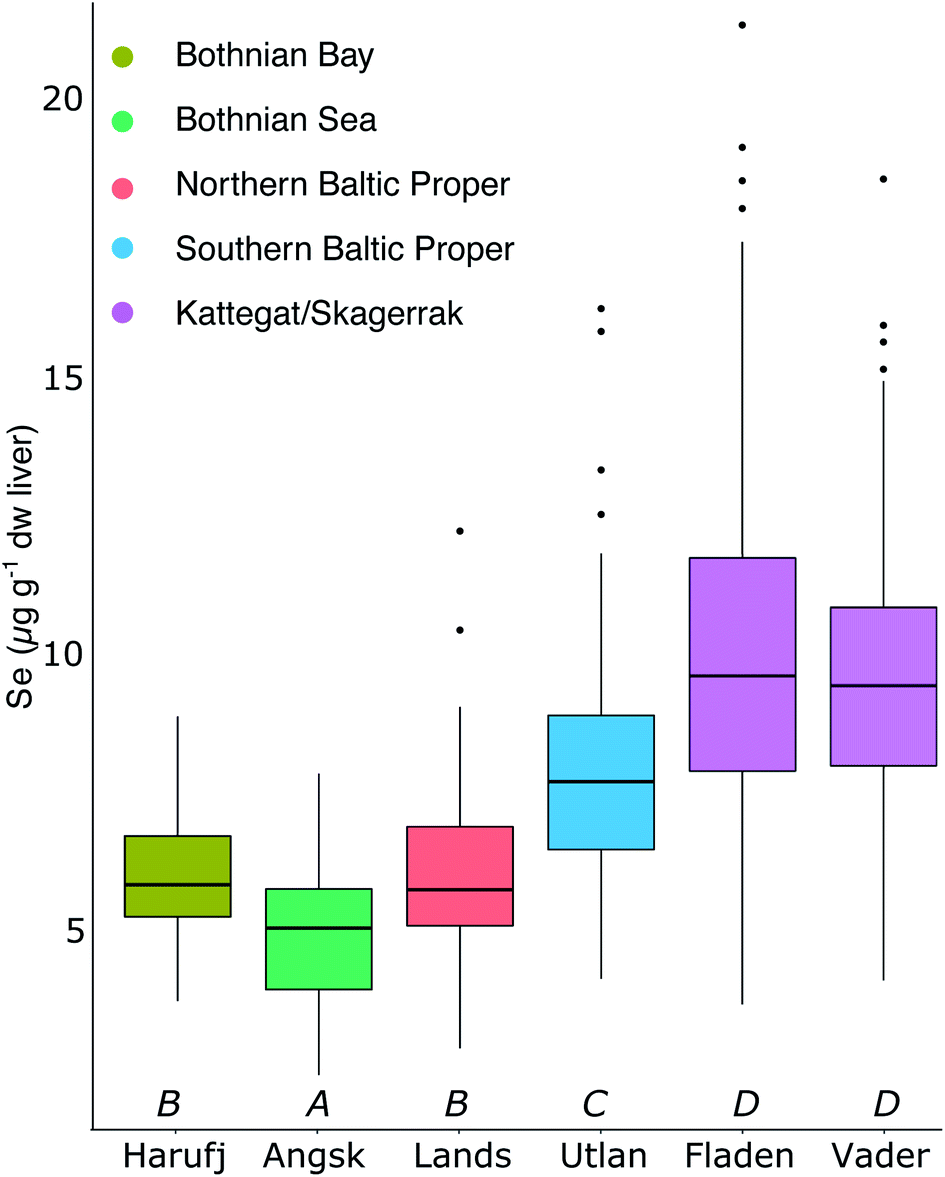 | ||
| Fig. 5 Median and 25th/75th percentile of the 2009–2019 Se liver concentration for the 6 stations with analysis of 10 individual fish per year. Same letters indicate that the averages are not statistically different (Dunn's test with Bonferroni adjustment). | ||
Fig. 2B shows the spatial distribution of modeled deposition (2013–2017), which is increasing from north to south and from east to west. This spatial pattern correlates with that of Se in herring liver (R2 = 0.65, p < 0.01; Fig. 2D). We find a present day average modeled deposition that ranges from 27 to 102 μg Se per m2 per annum across the Baltic Sea. Data on Se in European streams (1998–2001) also showed a geographical distribution similar to that of Se in herring and deposition with a general increase in concentrations from north to south (ESI Fig. S3†).46 The similarity of the spatial patterns of terrestrial Se fluxes and deposition may be explained by a causal relationship, since deposition is thought to increase soil Se concentrations in the region.53,54 Based on these measurements, we estimate a 300% higher Se concentration in the streams discharging into the Baltic Proper (0.51 μg L−1; range: 0.36–0.89) than in the streams discharging into the Bothnian Bay and Sea (0.16 μg L−1; range: 0.07–0.23) (ESI Fig. S3†). However, when the input loads are normalized to reflect the area of the basins, the Baltic Proper (303 μg Se per m2 per annum) only receives a load 24% higher than the Bothnian Bay and Sea (253 μg per Se per m2 per annum) while the input to Kattegat is highest (431 μg per Se per m2 per annum; Fig. 2C). This result in an overall (deposition and riverine inputs combined) increase in external inputs per m2 in the Baltic Proper and Kattegat of ∼30% and ∼67%, respectively, compared to the Bothnian Bay and Sea.
The modelled deposition can explain 65% of the geographical variability in herring Se (R2 = 0.65; Fig. 2D). Further, we find a similar percentage increase in both total Se loads (deposition and riverine inputs combined) and herring Se concentrations from Bothnian Bay and Sea to the Baltic Proper (∼30%) and Kattegat (65–80%). Even though the riverine input numbers are on the basin scale and rely on Se observations from 1998–2001, this supports the importance of external loads in shaping the geographical pattern of herring Se concentrations. Other factors that could affect the variability of herring Se concentration are the biogeochemical speciation and food web uptake of Se within the water column after entering the Baltic Sea. Wang et al.55 found that suspended particles made up 1.5–28.6% of the total Se and that 36% were complexed with humic substances in some Finnish rivers impacted by agricultural runoff, possibly making a part of the Se entering the Baltic Sea through rivers less bioavailable. The Se speciation and differentiated uptake by plankton species could also impact the bioconcentration of Se.12–14 Moreover, the phytoplankton communities change considerably across the Baltic Sea56,57 because of variability in nutrient status, salinity and temperature.58,59 More information on Se dynamics in the Baltic Sea water column and uptake rates for different plankton species is needed to understand the impact of these processes. We conclude that there is a significant difference in the geographical distribution of Se in herring and that, despite changing ecosystem dynamics across the Baltic Sea, much of this large-scale pattern can be explained by the variability in Se deposition and riverine Se inputs.
Herring temporal selenium trend
Fig. 4A shows the retrospective time series for Se observed in herring muscle (solid lines) and Se muscle concentrations calculated from liver Se using our conversion factor (dashed lines). The retrospective time series cover the Bothnian Sea to the Southern Baltic Proper (4.5° latitude; Fig. 1) and show a decrease of 0.7–2.0% per annum over the 1979 to 2010 period (Table 1) from 0.34 ± 0.02 μg g−1 ww (1979–1981) to 0.18 ± 0.03 μg g−1 ww (2008–2010). In addition, of the 20 sites where herring liver was collected 30% show significant downwards trends for the period 2009–2019 (1.2–9.4% per annum; p < 0.05, n = 6–11 per site; Fig. 6). The liver time series thus indicates that the decrease seen in the retrospective muscle time series continues for the Baltic Sea, strongest in the Bothnian Sea and Northern Baltic Proper, with an average of ∼2% per annum after 2009 (Fig. 6). The lack of significant downwards trends for some of the 2009–2019 liver time series in the Southern Baltic Proper and Kattegat could be the result of a high year to year variability and the relatively short time series or that the decline of the past decades could be levelling out. We found that with the year to year variability in the time series most stations require between 11 and 18 years of data to be able to predict a yearly change of 2% with a power of >90%; more data is thus needed to confirm whether the decrease continues across all stations.| Site | Period (years) | n | Change (μg per g per annum) | Change (% per annum) | p-Value | Change deposition (% per annum) |
|---|---|---|---|---|---|---|
| a Data for 1983, 1988, 1990 and 1994 missing. | ||||||
| Bothnian Sea (Angskarsklubb) | 1979–2010 | 28a | −4.3 × 10⁻³ | −2.0 | <0.01 | −5.2 |
| Nortern Baltic Proper (Landsort) | 1981–2006 | 26 | −2.1 × 10⁻³ | −0.7 | <0.05 | −5.2 |
| Southern Baltic Proper (Utlangan) | 1980–2009 | 30 | −3.8 × 10⁻³ | −1.4 | <0.01 | −4.8 |
 | ||
| Fig. 6 The spatial distribution of yearly relative change in herring liver concentrations (2009–2019). Each bar indicate a station with 6–11 years of observations. Black stars indicate stations with a significant decrease (p < 0.05; n = 6–11). The location of the basins and stations is shown on Fig. 1. | ||
Fig. 4B shows the modeled temporal development in deposition for four areas in the Baltic Sea and one reference site in the North Sea (see Fig. 2B for locations). We find that Se deposition has decreased significantly in all parts of the Baltic Sea over the period 1979 to 2017 (from 3.3% per annum in the Bothnian Bay to 5.3% per annum in Kattegat) while the decrease is smaller for the North Sea reference site (0.6% per annum; Table 1). This indicates the importance of changes in regional anthropogenic sources in driving the deposition trend. The Baltic Sea total deposition loads decreased from 105 Mg per annum in 1980 to 18 Mg per annum in 2017 (301 μg per m2 per annum to 52 μg per m2 per annum; ESI Fig. S5†), a decrease of 83%.
We estimated a riverine Se input for the Baltic Sea for the period ∼1998–2001 of 143 Mg per annum (ESI Table S3,† see explanation on the calculation in the section “Herring spatial selenium distribution”). For the same period Se deposition was estimated to be 43 Mg per annum, which suggest that rivers are a larger source to the Baltic Sea than deposition. The few studies on Se concentrations in Swedish and Finnish lake and stream water from other decades (studies from 1978 to 2012) are too sparse to reveal significant temporal trends (ESI Table S4†).46,55,60–63 Without long term monitoring data on lakes or streams from the Baltic Sea region it is difficult to conclude how stream Se fluxes have changed due to large spatial and seasonal variability in stream concentrations. For example, in the Salminen et al.46 survey of European streams the concentrations across Swedish streams ranged from <10 ng L−1 to 530 ng L−1 (ESI Fig. S3†) and Wang et al.55 found that rainfall related seasonal variations in the Se concentrations in stream water in Finland could exceed 100%. In the United States, different watersheds show diverging Se stream flux trends, with more agricultural watersheds in central US showing recent increases in stream Se while watersheds affected by anthropogenic Se deposition in the northeastern US have shown recent decreases.9 A possible predictor for agricultural and wastewater Se runoff is the correlation between leaching of nutrients (e.g., nitrogen and phosphorus) and Se.9 The loads of these nutrients peaked in the Baltic Sea in the 1980s and had decreased with 40–50% by 2016.58,64 Most nutrients (∼50% from agriculture and ∼30% from wastewater treatment) are released to the Baltic Proper65,66 from agricultural land to the south. It is also in the Baltic Proper that the decrease in nutrient release have been strongest while the Bothnian Bay and Sea have experienced constant inputs over the past three decades (ESI Fig. S6†).64 Thus, if there is a connection between nutrient runoff and Se loads to the Baltic Sea between the 1980s and present day it should result in a strong decrease in Se loads to the Baltic Proper but not to the Bothnian Bay and Sea.
We find that herring Se mirrors the 40 years decline predicted for Se deposition in the Baltic Proper and Bothnian Sea (Fig. 4). However, the model predicts a deposition decrease of ∼5% per annum over the period of the retrospective time series while the observed trend in herring is smaller 0.7–2% per annum (muscle data 1979–2010; Fig. 4) and ∼2% per annum (liver data 2009–2019; Fig. 6). Feinberg et al.9 found a faster decrease in modelled deposition compared to observed water concentrations in a range of watersheds dominated by deposition inputs in the Northeastern United States and concluded that the smaller overall trend in the reservoir was due to other input sources. Declining deposition to soils is likely to be reflected in decreasing river runoff but with a delayed response time; other watersheds have shown such a lag being controlled by catchment retention processes.9,67 We suggest that a stable input or slower decrease in the Se concentration in the river discharged (∼142 Mg per annum) compared to atmospheric deposition to the Baltic Sea can explain why herring Se is decreasing slower than deposition. The model predicts that deposition has decreased by ∼73% over the period 1980 to 2010 (105 Mg per annum to 28 Mg per annum; ESI Fig. S5†). If we combine the two sources (deposition and riverine inputs) we get a decrease in the input of 31% between 1980 (247 Mg per annum) and 2010 (170 Mg per annum) more in line with the overall observed decrease in the retrospective herring time series (34–50%; Angskarsklubb and Utlangen; ESI Table S6†). Furthermore, if we assume a slow decrease in riverine Se fluxes between 1979 and 2010, for example following the decline in nutrient input to the Baltic Sea (40–50%),58,64 we get a decline of 54–60%, in the higher end of that observed in herring (ESI Table S6†). The herring Se concentrations could also be influenced by recycling of Se within the coastal system for example through remobilization from sediments. Lemly10 found that 10 years after the removal of an anthropogenic point source the Se biota concentrations in a lake had decreased by 85–95% and the sediment Se concentration by 65–75%. For an estuarine system it was further shown that Se remobilization from sediment was a small source compared to external loads.68 Considering our multi-decadal trends and the steady changes in input loads, it is likely that recycling of Se in the coastal system can cause some lag in the speed at which Se in herring decreases.
We find the largest decrease in herring Se concentrations in the Bothnian Sea (Angskarsklubb), an area where nutrient inputs have been constant to increasing over the period (ESI Fig. S6†)64 and where agricultural soils were amended with Se in some Finish catchments.61 Therefore, the role of Se inputs from wastewater and agriculture to the Baltic Sea in shaping the herring Se decrease remains uncertain. However, declines in deposition to the terrestrial landscape, which have been more uniform, may also lead to a decrease in Se riverine inputs and contribute to the decrease in herring Se. This hypothesis is supported by a mass balance for Se addition to Swedish arable soils that showed that deposition was on average a larger source to soils than sewage sludge or fertilizer.69 More observations of watershed Se concentrations – than are currently available (ESI Table S4†) – are needed to confirm our hypothesis and quantify the role of Se deposition to land versus wastewater and agricultural Se runoff trends.
Based on the existing data, we propose that the main driver of the temporal trend of Se in herring is deposition. We further suggest that a stable or slower decrease in Se input from the terrestrial landscape and recycling of Se can explain the difference in the rate of decline between Se deposition and herring concentrations.
Future herring Se concentrations
Atmospheric Se and its deposition to the Baltic Sea is dominated by direct anthropogenic emissions.9,70 For the Baltic Sea region, the model predicts that 94% of the deposition, or 306 μg per m2 per annum, was from direct anthropogenic emission in 1979 and 60%, or 32 μg per m2 per annum, in 2017. The deposition from natural emissions was stable during the period at around 20 μg per m2 per annum. In contrast, for our North Sea reference site, the predicted influence of direct anthropogenic emissions has been smaller during the entire period (<50%), with the marine biogenic source of Se accounting for the largest fraction of the deposition (42–48%). Since it appears that the decrease in anthropogenic emissions is the main cause of the regional decline in deposition in the coastal Baltic Sea system (ESI Fig. S5†), we posit that these changes in anthropogenic emissions are also driving the observed declines in herring Se concentrations.Atmospheric model simulations of two future socioeconomic scenarios suggest a continued decrease in Se deposition in the Baltic Sea region of 50–70% between the 2000s and the 2090s.9 This is larger than a 23–31% global decrease9 and suggests that deposition will continue to play a major role in controlling the trends in the Baltic Sea. However, our results show that direct deposition is becoming a smaller fraction of the total Se input to the Baltic Sea. For example, we estimate that 78% (143 Mg per annum) of total Se input to the Baltic Sea in 1998–2001 was from rivers and only 22% (43 Mg per annum) from direct deposition. As direct deposition continues to decline, the terrestrial input likely increases its dominance of the total Se input. While the terrestrial input is also in part influenced by deposition changes, there is a lag time between Se deposition to the watershed and export to the ocean controlled by the catchment retention processes.9,67 Therefore, we expect that in the coming decades the terrestrial input, rather than direct atmospheric deposition to the Baltic Sea, will control the Se concentrations in herring.
Author contributions
Conceptualization, data curation, and formal analysis was conducted by ALS, investigation and methodology were conducted by ALS and AF, and writing of the original draft and response to reviewers were conducted by ALS, AF, and ATS.Conflicts of interest
There are no conflicts of interest to declare.Acknowledgements
We thank current and former colleagues at the Swedish Museum of Natural History and sample analysis labs for their work on collecting and analyzing samples for use in national reports, which we have synthesized for our study. The Swedish Environmental Protection Agency funds the Swedish National Monitoring Program of Contaminants in Biota. AF acknowledges support from the ETH grant ETH-39 15-2 and a Swiss National Science Foundation Early Postdoc Mobility Grant (P2EZP2_195424). ATS acknowledges support from the Sloan Foundation and the National Academies of Sciences, Engineering, and Medicine-Gulf Research Program.References
- H. Wen and J. Carignan, Reviews on atmospheric selenium: Emissions, speciation and fate, Atmos. Environ., 2007, 41(34), 7151–7165 CrossRef CAS.
- B. W. Mosher and R. A. Duce, A global atmospheric selenium budget, J. Geophys. Res.: Atmos., 1987, 92(D11), 13289–13298 CrossRef CAS.
- J. O. Nriagu, A global assessment of natural sources of atmospheric trace metals, Nature, 1989, 338(6210), 47–49 CrossRef CAS.
- R. Lavado, D. Shi and D. Schlenk, Effects of salinity on the toxicity and biotransformation of L-selenomethionine in Japanese medaka (Oryzias latipes) embryos: mechanisms of oxidative stress, Aquat. Toxicol., 2012, 108, 18–22 CrossRef CAS PubMed.
- S. J. Hamilton, Review of residue-based selenium toxicity thresholds for freshwater fish, Ecotoxicol. Environ. Saf., 2003, 56(2), 201–210 CrossRef CAS.
- C. C. Hicks, P. J. Cohen, N. A. Graham, K. L. Nash, E. H. Allison, C. D'Lima, D. J. Mills, M. Roscher, S. H. Thilsted and A. L. Thorne-Lyman, Harnessing global fisheries to tackle micronutrient deficiencies, Nature, 2019, 574(7776), 95–98 CrossRef CAS PubMed.
- A. R. Stewart, S. N. Luoma, K. A. Elrick, J. L. Carter and M. van der Wegen, Influence of estuarine processes on spatiotemporal variation in bioavailable selenium, Mar. Ecol.: Prog. Ser., 2013, 492, 41–56, DOI:10.3354/meps10503.
- J. E. Brandt, J. J. Roberts, C. A. Stricker, H. A. Rogers, P. Nease and T. S. Schmidt, Temporal Influences on Selenium Partitioning, Trophic Transfer, and Exposure in a Major US River, Environ. Sci. Technol., 2021, 55(6), 3645–3656 CrossRef CAS PubMed.
- A. Feinberg, A. Stenke, T. Peter, E.-L. S. Hinckley, C. T. Driscoll and L. H. Winkel, Reductions in the deposition of sulfur and selenium to agricultural soils pose risk of future nutrient deficiencies, Communications Earth & Environment, 2021, 2(101), 1–8, DOI:10.1038/s43247-021-00172-0.
- A. D. Lemly, Ecosystem recovery following selenium contamination in a freshwater reservoir, Ecotoxicol. Environ. Saf., 1997, 36(3), 275–281 CrossRef CAS PubMed.
- D. E. Ponton and L. Hare, Relating selenium concentrations in a planktivore to selenium speciation in lakewater, Environ. Pollut., 2013, 176, 254–260 CrossRef CAS PubMed.
- M. Schiavon, A. Ertani, S. Parrasia and F. Dalla Vecchia, Selenium accumulation and metabolism in algae, Aquat. Toxicol., 2017, 189, 1–8 CrossRef CAS PubMed.
- S. B. Baines, N. S. Fisher, M. A. Doblin, G. A. Cutter, L. S. Cutter and B. Cole, Light dependence of selenium uptake by phytoplankton and implications for predicting selenium incorporation into food webs, Limnol. Oceanogr., 2004, 49(2), 566–578 CrossRef CAS.
- H. Araie and Y. Shiraiwa, Selenium utilization strategy by microalgae, Molecules, 2009, 14(12), 4880–4891 CrossRef CAS PubMed.
- S. D. Graves, K. Liber, V. Palace, M. Hecker, L. E. Doig and D. M. Janz, Trophic dynamics of selenium in a boreal lake food web, Environ. Pollut., 2021, 280, 116956, DOI:10.1016/j.envpol.2021.116956.
- D. E. Ponton, S. D. Graves, C. Fortin, D. Janz, M. Amyot and M. Schiavon, Selenium interactions with algae: Chemical processes at biological uptake sites, bioaccumulation, and intracellular metabolism, Plants, 2020, 9(4), 528, DOI:10.3390/plants9040528.
- E. Fournier, C. Adam-Guillermin, M. Potin-Gautier and F. Pannier, Selenate bioaccumulation and toxicity in Chlamydomonas reinhardtii: Influence of ambient sulphate ion concentration, Aquat. Toxicol., 2010, 97(1), 51–57 CrossRef CAS.
- R. P. Mason, A. L. Soerensen, B. P. DiMento and P. H. Balcom, The global marine selenium cycle: Insights from measurements and modeling, Global Biogeochem. Cycles, 2018, 32(12), 1720–1737, DOI:10.1029/2018GB006029.
- M. W. Donner, B. Bicalho, T. Noernberg and W. Shotyk, Contemporary and historical atmospheric deposition of arsenic and selenium in the Athabasca bituminous sands region, Environ. Sci. Technol., 2019, 53(23), 14020–14028 CrossRef CAS PubMed.
- K. Myrberg and A. Lehmann, in Preventive Methods for Coastal Protection, Springer, 2013, ch. 2, pp. 31–64 Search PubMed.
- S. Nilsson, BSR INTERREG III B Programme Project Report, International river basins in the Baltic Sea Region, 2006, vol. 14 Search PubMed.
- HELCOM, Baltic Sea Environment Proceedings No. 93, The fourth Baltic Sea pollution load compilation (PLC-4), 2004, p. 189 Search PubMed.
- M. Bernreuther, J. Peters, C. Möllmann, J. Renz, J. Dutz, J.-P. Herrmann and A. Temming, Trophic decoupling of mesozooplankton production and the pelagic planktivores sprat Sprattus sprattus and herring Clupea harengus in the Central Baltic Sea, Mar. Ecol.: Prog. Ser., 2018, 592, 181–196 CrossRef CAS.
- H. Ojaveer, A. Lankov, T. Raid, A. Põllumäe and R. Klais, Selecting for three copepods—feeding of sprat and herring in the Baltic Sea, ICES J. Mar. Sci., 2018, 75(7), 2439–2449 CrossRef.
- US EPA, Aquatic Life Ambient Water Quality Criterion for Selenium–Freshwater (2016), 2016 Search PubMed.
- E. Aro, A review of fish migration patterns in the Baltic, Rapp. P.-V. Reun. - Cons. Int. Explor. Mer, 1989, 190, 72–96 Search PubMed.
- T. Gröhsler, R. Oeberst, M. Schaber, N. Larson and G. Kornilovs, Discrimination of western Baltic spring-spawning and central Baltic herring (Clupea harengus L.) based on growth vs. natural tag information, ICES J. Mar. Sci., 2013, 70(6), 1108–1117 CrossRef.
- M. Rajasilta, J. Hänninen, L. Laaksonen, P. Laine, J.-P. Suomela, I. Vuorinen and K. Mäkinen, Influence of environmental conditions, population density, and prey type on the lipid content in Baltic herring (Clupea harengus membras) from the northern Baltic Sea, Can. J. Fish. Aquat. Sci., 2019, 76(4), 576–585 CrossRef CAS.
- A. L. Soerensen and S. Faxneld, The Swedish National Monitoring Programme for Contaminants in Marine Biota (Until 2019 Year's Data)-Temporal Trends and Spatial Variations. Raport Nr 13:2020, Swedish Museum of Natural History, Sweden, 2020 Search PubMed.
- C. Enhus, E. Boalt and A. Bignert, The Relationship between Mercury and Selenium in Baltic Herring-A Retrospective Study (Report 4:2011), Swedish Museum of Natural History, Sweden, 2011 Search PubMed.
- S. Danielsson, A. Bignert, S. Faxneld, E. Nyberg, M. Andersson, D. Jones, E. Kylberg, J. Strömquist, A.-M. Johansson and P. Hjelmquist, Distribution and Conversions of Metal-And POP Concentrations Among Various Tissues in Herring, Swedish Museum of Natural History, Sweden, 2018 Search PubMed.
- M. Bevelhimer, J. Beauchamp, B. Sample and G. Southworth, Estimation of Whole-Fish Containment Concentrations from Fish Fillet Data, Oak Ridge National Lab.(ORNL), Oak Ridge, TN (United States), 1997 Search PubMed.
- A. Feinberg, T. Sukhodolov, B.-P. Luo, E. Rozanov, L. H. Winkel, T. Peter and A. Stenke, Improved tropospheric and stratospheric sulfur cycle in the aerosol–chemistry–climate model SOCOL-AERv2, Geosci. Model Dev., 2019, 12(9), 3863–3887 CrossRef CAS.
- A. Feinberg, M. Maliki, A. Stenke, B. Sudret, T. Peter and L. H. Winkel, Mapping the drivers of uncertainty in atmospheric selenium deposition with global sensitivity analysis, Atmos. Chem. Phys., 2020, 20(3), 1363–1390 CrossRef CAS.
- A. Feinberg, A. Stenke, T. Peter and L. H. Winkel, Constraining Atmospheric Selenium Emissions Using Observations, Global Modeling, and Bayesian Inference, Environ. Sci. Technol., 2020, 54(12), 7146–7155 CrossRef CAS PubMed.
- A. Kerkweg, J. Buchholz, L. Ganzeveld, A. Pozzer, H. Tost and P. Jöckel, An implementation of the dry removal processes DRY DEPosition and SEDImentation in the Modular Earth Submodel System (MESSy), Atmos. Chem. Phys., 2006, 6(12), 4617–4632 CrossRef CAS.
- A. Kerkweg, J. Buchholz, L. Ganzeveld, A. Pozzer, H. Tost and P. Jöckel, Corrigendum to" Technical Note: An implementation of the dry removal processes DRY DEPosition and SEDImentation in the Modular Earth Submodel System (MESSy)" published in Atmos. Chem. Phys., 6, 4617–4632, 2006, Atmos. Chem. Phys., 2009, 9(24), 9569 CrossRef CAS.
- H. Tost, P. Jöckel, A. Kerkweg, R. Sander and J. Lelieveld, A new comprehensive SCAVenging submodel for global atmospheric chemistry modelling, Atmos. Chem. Phys., 2006, 6(3), 565–574 CrossRef CAS.
- D. P. Dee, S. M. Uppala, A. Simmons, P. Berrisford, P. Poli, S. Kobayashi, U. Andrae, M. Balmaseda, G. Balsamo and d. P. Bauer, The ERA-Interim reanalysis: Configuration and performance of the data assimilation system, Q. J. R. Meteorol. Soc., 2011, 137(656), 553–597 CrossRef.
- R. M. Hoesly, S. J. Smith, L. Feng, Z. Klimont, G. Janssens-Maenhout, T. Pitkanen, J. J. Seibert, L. Vu, R. J. Andres and R. M. Bolt, Historical (1750–2014) anthropogenic emissions of reactive gases and aerosols from the Community Emissions Data System (CEDS), Geosci. Model Dev., 2018, 11(1), 369–408 CrossRef CAS.
- A. Lana, T. Bell, R. Simó, S. Vallina, J. Ballabrera-Poy, A. Kettle, J. Dachs, L. Bopp, E. Saltzman and J. Stefels, An updated climatology of surface dimethlysulfide concentrations and emission fluxes in the global ocean, Global Biogeochem. Cycles, 2011, 25(1), GB1004 CrossRef.
- F. Dentener, S. Kinne, T. Bond, O. Boucher, J. Cofala, S. Generoso, P. Ginoux, S. Gong, J. Hoelzemann and A. Ito, Emissions of primary aerosol and precursor gases in the years 2000 and 1750 prescribed data-sets for AeroCom, Atmos. Chem. Phys., 2006, 6(12), 4321–4344 CrossRef CAS.
- R. Andres and A. Kasgnoc, A time-averaged inventory of subaerial volcanic sulfur emissions, J. Geophys. Res.: Atmos., 1998, 103(D19), 25251–25261 CrossRef CAS.
- SMHI, Normal avrinning och utflöda till havet (normal run-off and discharge to the ocean), https://www.smhi.se/data/hydrologi/vattenforing, accessed August 2021 Search PubMed.
- J. Johansson, Total and regional runoff to the Baltic Sea, Baltic Sea environment fact sheet, http://www.helcom.fi/baltic-sea-trends/environment-fact-sheets/, accessed April 2021 Search PubMed.
- R. Salminen, M. Batista, M. Bidovec, A. Demetriades, B. De Vivo, W. De Vos, M. Duris, A. Gilucis, V. Gregorauskiene, J. Halamic, P. Heitzmann, A. Lima, G. Jordan, G. Klaver, P. Klein, J. Lis, J. Locutura, K. Marisina, A. Mazreku, P. O'Conner, S. A. Olsson, R.-T. Ottesen, V. Petersell, J. Plant, S. Reeder, I. Salpeteur, H. Sanström, U. Siewers, A. Steenfelt and T. Tarvainen, Geochemical Atlas of Europe. Part 1, Background Information, Methodology and Maps, Geological Survey of Finland, Espoo, 2005, http://weppi.gtk.fi/publ/foregsatlas/ForegsData.php Search PubMed.
- R Core Team, R: A Language and Environment for Statistical Computing. R Foundation for Statistical Computing, Vienna, Austria, 2021, https://www.R-project.org/ Search PubMed.
- A. Bignert, F. Riget, B. Braune, P. Outridge and S. Wilson, Recent temporal trend monitoring of mercury in Arctic biota–how powerful are the existing data sets?, J. Environ. Monit., 2004, 6(4), 351–355 RSC.
- L. Polak-Juszczak, Selenium and mercury molar ratios in commercial fish from the Baltic Sea: additional risk assessment criterion for mercury exposure, Food Control, 2015, 50, 881–888 CrossRef CAS.
- M. Arcagni, A. Rizzo, R. Juncos, M. Pavlin, L. M. Campbell, M. A. Arribére, M. Horvat and S. R. Guevara, Mercury and selenium in the food web of Lake Nahuel Huapi, Patagonia, Argentina, Chemosphere, 2017, 166, 163–173 CrossRef CAS PubMed.
- M. Khadra, D. Planas, P. Brodeur and M. Amyot, Mercury and selenium distribution in key tissues and early life stages of Yellow Perch (Perca flavescens), Environ. Pollut., 2019, 254, 112963 CrossRef CAS PubMed.
- A. R. Stewart, F. Feyrer and R. C. Johnson, Resolving selenium exposure risk: Spatial, temporal, and tissue-specific variability of an endemic fish in a large, dynamic estuary, Sci. Total Environ., 2020, 707, 135919 CrossRef CAS PubMed.
- J. Låg and E. Steinnes, Regional distribution of selenium and arsenic in humus layers of Norwegian forest soils, Geoderma, 1978, 20(1), 3–14 CrossRef.
- E. Steinnes and S. Lierhagen, Geographical distribution of trace elements in natural surface soils: Atmospheric influence from natural and anthropogenic sources, Appl. Geochem., 2018, 88, 2–9 CrossRef CAS.
- D. Wang, G. Alfthan, A. Aro, P. Lahermo and P. Väänänen, The impact of selenium fertilisation on the distribution of selenium in rivers in Finland, Agric. Ecosyst. Environ., 1994, 50(2), 133–149 CrossRef CAS.
- Y. O. Hu, B. Karlson, S. Charvet and A. F. Andersson, Diversity of pico-to mesoplankton along the 2000 km salinity gradient of the Baltic Sea, Front. Microbiol., 2016, 7, 679 Search PubMed.
- S. Hajdu, H. Höglander and U. Larsson, Phytoplankton vertical distributions and composition in Baltic Sea cyanobacterial blooms, Harmful Algae, 2007, 6(2), 189–205 CrossRef.
- B. G. Gustafsson, F. Schenk, T. Blenckner, K. Eilola, H. M. Meier, B. Müller-Karulis, T. Neumann, T. Ruoho-Airola, O. P. Savchuk and E. Zorita, Reconstructing the development of Baltic Sea eutrophication 1850–2006, Ambio, 2012, 41(6), 534–548 CrossRef CAS PubMed.
- Z. Al-Hamdani, J. Reker, U. Alanen, J. H. Andersen, J. Bendtsen, U. Bergström, K. Dahl, G. E. Dinesen, A. Erichsen and A. Elhammer, Towards Benthic Marine Landscapes in the Baltic Sea. BALANCE Interim Report #10, Report 8778712033, 2007, available at: http://balance-eu.org/ Search PubMed.
- H. Parkman and H. Hutberg, Occurrence and Effects of Selenium in the Environment - a Literature Review, IVL Swedish Environmental Research Institute, Göteborg, Sweden, 2002 Search PubMed.
- G. Alfthan and A. Aro, in Proceedings Twenty Years of Selenium Fertilization, ed. M. Eurola, Helsinki, Finland, 2005, pp. 33–35 Search PubMed.
- M. Lindell, Metallbudget Och Källfördelning För Vättern, Utvärdering På Landskapsnivå 2010-2012 (Metal Budget and Source Distribution for Vättern, Evaluation at the Landscape Scale 2010-2012), Länsstyrelsen, Jönköping, 2015 Search PubMed.
- M. Remberger, Förekomst Och Omsättning Av Selen I Inlandsvatten, IVL Swedish Environmental Research Institute, Stockholm, Sweden, 1980 Search PubMed.
- O. P. Savchuk, Large-scale nutrient dynamics in the Baltic Sea, 1970–2016, Front. Mar. Sci., 2018, 5, 95 CrossRef.
- A. Åkerblom, M. Lüdtke, N. Lans, L. Linderholm, E. Johansson, M. Lundin Unger, Å. Gunnarsson, A. Dimberg and S. Åkerblom, Wastewater Treatment in Sweden 2018, The Swedish Environmental Protection Agency, Stockholm, Sweden, 2020 Search PubMed.
- G. Schernewski, H. Radtke, R. Hauk, C. Baresel, M. Olshammar, R. Osinski and S. Oberbeckmann, Transport and behavior of microplastics emissions from urban sources in the Baltic Sea, Front. Environ. Sci., 2020, 8, 170 Search PubMed.
- K. C. Rice, T. M. Scanlon, J. A. Lynch and B. J. Cosby, Decreased atmospheric sulfur deposition across the southeastern US: When will watersheds release stored sulfate?, Environ. Sci. Technol., 2014, 48(17), 10071–10078 CrossRef CAS PubMed.
- G. A. Cutter and L. S. Cutter, Selenium biogeochemistry in the San Francisco Bay estuary: changes in water column behavior, Estuar. Coast Shelf Sci., 2004, 61(3), 463–476 CrossRef CAS.
- J. Eriksson, Concentrations of 61 Trace Elements in Sewage Sludge, Farmyard Manure, Mineral Fertiliser, Precipitation and in Oil and Crops, Swedish Environmental Protection Agency Stockholm, Sweden, 2001 Search PubMed.
- B. Dudzińska-Huczuk and J. Bolałek, Particulate selenium in the baltic sea atmosphere, Water, Air, Soil Pollut., 2007, 179(1), 29–41 CrossRef.
Footnote |
| † Electronic supplementary information (ESI) available. See DOI: 10.1039/d1em00418b |
| This journal is © The Royal Society of Chemistry 2022 |