
 Open Access Article
 This Open Access Article is licensed under a
 Creative Commons Attribution 3.0 Unported Licence
A review of PFAS fingerprints in fish from Norwegian freshwater bodies subject to different source inputs†
Håkon A.
Langberg
 *ab,
Sarah E.
Hale
a,
Gijs D.
Breedveld
ace,
Bjørn M.
Jenssen
b and
Morten
Jartun
d
*ab,
Sarah E.
Hale
a,
Gijs D.
Breedveld
ace,
Bjørn M.
Jenssen
b and
Morten
Jartun
d
aEnvironment and Geotechnics, Norwegian Geotechnical Institute (NGI), Oslo, Norway. E-mail: hakon.austad.langberg@ngi.no
bDepartment of Biology, Norwegian University of Science and Technology (NTNU), Trondheim, Norway
cDepartment of Geosciences, University of Oslo, Oslo, Norway
dNorwegian Institute for Water Research (NIVA), Oslo, Norway
eArctic Technology, The University Centre in Svalbard (UNIS), Norway
First published on 26th January 2022
Abstract
The extensive use of per- and polyfluorinated alkyl substances (PFAS) has resulted in many environmental point and diffuse sources. Identifying the source responsible for a pollution hot spot is vital for assessing remediation measures, however, as there are many possible sources of environmental PFAS pollution, this can be challenging. Chemical fingerprinting has been proposed as an approach to identify contamination sources. Here, concentrations and profiles (relative distribution profiles) of routinely targeted PFAS in freshwater fish from eight sites in Norway, representing three different sources: (1) production of paper products, (2) the use of aqueous film forming foams (AFFF), and (3) long-range atmospheric transport, were investigated. The data were retrieved from published studies. Results showed that fingerprinting of PFAS in fish can be used to identify the dominant exposure source(s), and the profiles associated with the different sources were described in detail. Based on the results, the liver was concluded to be better suited for source tracking compared to muscle. PFAS fingerprints originating from AFFF were dominated by perfluorooctanesulfonate (PFOS) and other perfluoroalkanesulfonic acids (PFSA). Fingerprints originating from both long-range atmospheric transport and production of paper products were associated with high percentages of long chained perfluoroalkyl carboxylic acids (PFCA). However, there were differences between the two latter sources with respect to the ∑PFAS concentrations and ratios of specific PFCA pairs (PFUnDA/PFDA and PFTrDA/PFDoDA). Low ∑PFAS concentrations were detected in fish exposed mainly to PFAS via long-range atmospheric transport. In contrast, ∑PFAS concentrations were high and high percentages of PFOS were detected in fish exposed to pollution from production of paper products. The source-specific fingerprints described here can be used for source tracking.
Environmental significanceThis work investigates fingerprints of per- and polyfluorinated alkyl substances (PFAS) in fish from freshwater systems subject to pollution from different sources. Contaminated fish has been shown to be a significant source of PFAS to exposed populations. Identification of the main sources of the pollution is important to direct remediation efforts and hence, to reduce PFAS exposure. We identify specific fingerprints for three source types: (1) aqueous film forming foams (AFFF) for firefighting, (2) production of paper products, and (3) long-range atmospheric transport. This work will aid future source tracking studies. |
Introduction
Per- and polyfluorinated alkyl substances (PFAS) have been used in a vast number of industrial processes and in both industrial and consumer products. In addition to well-known uses including textile impregnation, aqueous film forming firefighting foams (AFFF), and paper products, Glüge et al.1 identified a further 200 use categories for more than 1400 individual PFAS. PFAS are ubiquitous in the environment, and even detected in remote environments such as the Antarctic and Arctic.2–7 Long-range atmospheric transport and subsequent degradation of precursor compounds such as fluorotelomer alcohols (FTOH) into perfluoroalkyl carboxylic acids (PFCA), has been suggested to be one important mechanism for this global distribution.5–8Some PFAS bioaccumulate in organisms and biomagnify in the food chain.9,10 The highest environmental PFAS concentrations have been reported for sites contaminated by point sources, referred to as hot spot areas, such as from the use of AFFF at airports.11,12 As an example, a perfluorooctanesulfonic acid (PFOS) concentration of 1500 μg kg−1 was reported for whole perch (Perca fluviatilis) at Schiphol Amsterdam airport,11 and a ∑PFAS 11 concentration of 330 μg kg−1 (mostly PFOS) was reported for muscle from perch sampled near Stockholm Arlanda airport.12 Elevated human exposure to PFAS is suspected to increase the risk of adverse health effects, including immunotoxicity, dyslipidemia, kidney and testicular cancer, liver damage, decreased fertility, thyroid disruption, and developmental effects.13,14 Depending on the specific population in question, there are several exposure routes that can be considered to be important for PFAS exposure (e.g. drinking water, food contact materials, house dust, meat and egg consumption, etc.). Fish consumption is one of the main exposure routes of PFAS to humans,15,16 and dose-dependent relationships between consumption of fish from hot spot areas and blood plasma or blood serum concentrations have been reported.17,18
Identification and characterisation of hot spot areas and pollution sources are critical to reduce the environmental levels and impact of PFAS on human dietary sources, such as fish, by applying successful remediation approaches.19 Specific sources are believed to have characteristic distributions of individual PFAS, resulting in specific chemical fingerprints. Thus, the comparison of PFAS fingerprints, i.e., concentrations and profiles (composition, expressed as relative distribution profiles of the sum of the targeted PFAS), has been proposed as an approach to identify PFAS contamination sources.19 Source specific fingerprints reflecting different PFAS production histories have previously been reported in surface water from China and Germany.20 Fingerprinting of surface water sampled in the north-east of the United States21 and in human serum22 has been used to identify different sources of PFAS.
Thousands of PFAS are potentially emitted to the environment.23 However, a limited number of PFAS are routinely targeted by analytical methods such as liquid chromatography-tandem mass spectrometry (LC-MS/MS). The reasons for this is a lack of standard methods that can be used to capture all PFAS due to the lack of analytical standards and economic constraints, as more powerful analytical tools such as high resolution mass spectrometry (HRMS) are expensive and not widely available.24,25 The objective of this study was to explore differences in PFAS fingerprints in freshwater fish from Norwegian freshwater bodies subject to different source inputs. Routinely targeted PFAS were focused on to make the study relevant to practitioners (e.g., regulators and problem owners), dealing with PFAS polluted sites. Concentrations and profiles of PFAS in muscle and liver samples from 11 species of freshwater fish from eight different sites were selected as the media to focus on. The data were retrieved from published studies.26–33 Each of these studies reported concentrations in fish from freshwater bodies receiving PFAS from a specific source, and did not perform detailed comparisons of fingerprints related to different source inputs. Each of the eight sites represented one of three source types: (1) production of paper products (2) the use of AFFF, and (3) long-range atmospheric transport. Differences in PFAS profiles depending on source type were investigated using Principal Components Analysis (PCA). The hypothesis was that source-specific PFAS fingerprints are reflected in fish from the impacted area. A few studies have explored differences in PFAS fingerprints in various media depending on sources,20–22 however, this is the first to explore source-specific fingerprints in fish.
Methods
Data collection
Data for fish from freshwater bodies contaminated by AFFF used at Norwegian airports were provided by two Norwegian stakeholders that manage the majority of Norwegian airports (Avinor that manage commercial airports,26–29 and the Norwegian Defence Estates Agency that manage military airports30). These studies,26–30 were data reports in which sampling methods were described and PFAS concentrations in fish sampled near airports were reported and compared to environmental quality standards (EQS). In addition, data from monitoring programs that took place between 2009 and 2019 commissioned by the Norwegian Environment Agency which included PFAS concentrations in freshwater food webs in large Norwegian lakes mainly polluted by long-range atmospheric transport, were used. Yearly reports are prepared, with the latest one being published in 2019.31 Concentrations in biota were reported and time-trends were discussed.31 Indications of decreasing concentrations of some PFAS were reported, however the trends were not statistically significant and it was concluded that continuous monitoring in coming years is necessary in order to evaluate this further.31 Furthermore, data from lake Tyrifjorden, which is polluted by production of PFAS coated paper products,32,33 were included. The source of the PFAS pollution in the lake was investigated and it was concluded that paper production is the main source, which has emitted tons of PFAS to the lake.32 The environmental behaviour of PFAA and precursors in the lake were discussed, and it was concluded that transformation of large hydrophobic precursors in sediments is a source to PFAA in fish.33 Langberg et al. (2021)32 was the only study which discussed PFAS profiles in relation to source. Based on a comparison to literature, it was concluded that PFAS profiles in fish exposed to PFAS arising from the use of AFFF were dominated by PFOS, in addition to the presence of other PFSA, and that this seemed to differ from profiles in fish exposed to PFAS arising from paper industry. However, a detailed comparison of data were not performed.32 All together, these data spanned eight different sites, a geographical distance of 1000 km from 59.39° N to 68.50° N, and covered both urban and wilderness areas (Fig. S1†). The investigated water bodies associated with the sites are described below, and a detailed overview (location, volume, surface area, maximum depth, catchment area, and main contaminant sources) is given in Table S1.†Four of the sites (sites 1–4) were airports where AFFF from firefighting training activities were known to be the main PFAS source: (1) Oslo airport, the main airport in Norway. PFAS contaminated water, mainly from a firefighting training facility (FTF),34 drains into the creek Sogna which further drains into the river Leira. (2) Evenes airport which serves the towns Harstad and Narvik. The data used is from two lakes (lake Lavangsvatnet and lake Langvatnet) that receive PFAS from two FTFs at this airport.18,35 (3) Fagernes airport, Leirin (Fagernes airport) is a small local airport. The data used is from two lakes, lake Kalken and lake Leirin, located in the immediate vicinity of the runway and the FTF. (4) Moss airport, Rygge (Rygge airport) was a civilian airport until it was shut down in 2015. The civilian airport shared facilities with the military airport, Rygge air station, which is still operational. The data used is from the adjacent lake, Vansjø, that receives PFAS contaminated water from the airport.
The remaining four sites (5–8) are large Norwegian lakes: (5) lake Tyrifjorden where a factory producing paper products was identified to be the main PFAS emission source.32 (6) Lake Mjøsa which is the largest lake in Norway and which, in addition to atmospheric long-range transport, is polluted by diffuse PFAS sources including industry, waste water treatment plants (WWTP), and urban runoff.36 (7) Lake Femunden, the third largest lake in Norway. It is situated in a forested area that receives water from a wilderness mountain catchment area. The main PFAS source to lake Femunden is considered to be via long-range atmospheric transport. (8) Lake Randsfjorden, the fourth largest lake in Norway, is located in a rural area and is assumed to receive most of the PFAS via long-range atmospheric transport. However, small contributions from additional rural diffuse sources such as agricultural runoff and waste water runoff cannot be ruled out.
Data from a total of 11 fish species were investigated, with some variation between investigated species and tissue (muscle and/or liver) among the sites (Table S2†). The total amount of data points included in this study was 454 liver samples and 581 muscle samples. The investigated species were arctic Char (Salvelinus alpinus), bream (Abramis brama), brown trout (Salmo trutta), european smelt (Osmerus eperlanus), perch (Perca fluviatilis), pike (Esox lucius), roach (Rutilus rutilus), european chub (Squalius cephalus), vendace (Coregonus albula), whitefish (Coregonus lavaretus), and zander (Sander lucioperca). All animal procedures were performed in accordance with Norwegian regulations. Sampling and immediate killing of wild fish for scientific purposes does not require a special permit according to the Norwegian Animal Welfare Act and the Norwegian regulation concerning the use of animals for scientific purposes.
Chemical analysis
Chemical analyses of the samples from the commercial airports (sites 1–3, Oslo airport; Evenes airport; and Fagernes airport),26–29 as well as the muscle samples from site 4 (Rygge airport),30 were carried out by a commercial accredited laboratory, Eurofins Environment Testing Norway AS according to standard method DIN EN ISO/IEC 17025:2005. Briefly, samples were freeze dried, internal standards were added and extraction was performed using methanol in an ultrasonic bath followed by solvent clean up. Analyses were performed using high-performance liquid chromatography and mass spectrometric detection (HPLC/MS-MS). Laboratory blank samples were run, and blank concentrations were acceptable according to accredited lab procedures.Data for liver samples from site 4 (Rygge airport) as well as all data from sites 5–8 (lake Tyrifjorden, lake Mjøsa, lake Femunden, lake Randsfjorden) were provided by monitoring programs commissioned by the Norwegian Environment Agency (Jartun et al. (2019)31 and previous reports) and previously reported studies for lake Tyrifjorden.32,33 Analyses of these samples were performed by the Norwegian Institute for Water Research (NIVA) following previously described methods.33 Briefly, extraction was performed using acetonitrile and ultrasonication followed by analyses using liquid chromatography quadrupole time-of-flight mass spectrometry (LC-qTOF-MS). Laboratory blank samples were run for each batch of analysed samples. Concentrations in the blank samples were low and consistent, indicating little cross contamination.
Raw data as well as detailed information about the methods, including standards, solvents, and limits of quantifications (LOQ) is given in the ESI.†
Statistics and data treatment
38 PFAS were targeted for analysis (names and abbreviations are shown in Table S3†). However, the number of targeted PFAS varied between sites and sampling years, summarised in Tables S4 and S5† in the ESI. Differences in PFAS profiles (relative distribution profiles) between sites were explored using PCA. For each individual PCA, the PFAS profiles were standardized to have mean zero and standard deviation of one before performing PCA. Differences in PFAS concentrations, percentages, and ratios, as well as differences in PC1 scores were tested using Kruskal–Wallis and Bonferroni correction. In order to make meaningful comparisons, only PFAS targeted in all of the samples in question were included in the PCA. Concentrations below the LOQ were assigned values of half the LOQ when calculating ∑PFAS and comparing concentrations. For PFAS profiles (composition, expressed as relative distribution profiles of the ∑PFAS), concentrations below the LOQ were set to 0 (including in the PCA). This approach was preferred over e.g., using a statistical method to estimate concentrations (in order to explore each sample individually), or e.g., using LOQ/2 (in order to avoid the LOQ concentrations affecting PFAS profiles for samples with low ∑PFAS concentrations to a larger degree compared to samples with high ∑PFAS concentrations – as each PFAS was expressed as a percentage of the ∑PFAS). Concentrations are given on a wet weight basis (w. w.). Averages are presented as arithmetic means with the standard error of the mean (SEM) where appropriate. The level of significance was set to 0.05. Statistical analyses were carried out using R version 3.4.2; R Core Team; Vienna, Austria.37 Details for statistics, including the selection of the sites and PFAS for the PCA, are in the ESI.†Results and discussion
Concentrations of PFAS depending on tissue, source type, and species
![[thin space (1/6-em)]](https://www.rsc.org/images/entities/char_2009.gif) :2 FTS is included in Fig. 1, but because there were a few sites where 8:2 FTS concentrations were not available it was not included in the statistical analysis shown in Table S6.† Differences in muscle concentrations between sites and species are shown in Fig. 2, which shows concentrations of the 14 PFAS which were targeted for most muscle samples (only seven substances, targeted in all samples, were included in the statistical analyses shown in Table S7†). From the figures it is clear that higher concentrations and a greater frequency of concentrations above the LOQ were reported for liver compared to muscle. The differences between liver and muscle are illustrated by the samples from lake Tyrifjorden, for which a direct comparison can be made for seven fish species,33 shown in Fig. S6.† Higher concentrations in liver compared to muscle have been reported in many previous studies.38–41 The reason for this is likely that many PFAS bind to specific proteins such as albumins and therefore mainly accumulate in tissues which are rich in these proteins, such as kidney, blood, and liver.38,39,42 Tissue specific accumulation has previously been reported to vary between substances. For example, FOSA, a precursor to PFOS, has been shown to accumulate in higher concentrations in other tissues (e.g. blood and kidney) compared to the liver, likely due to an efficient biotransformation into PFOS in the liver.43,44 Thus, there are merits associated with using both liver and muscle samples to identify PFAS sources. Owing to the higher concentrations, liver is considered to be a better suited tissue for source tracking purposes as concentrations above the LOQ are needed in order to determine PFAS fingerprints in fish affected by different sources. However, due to its relevance for assessing human dietary PFAS exposure, muscle was the preferred tissue for most of the AFFF impacted sites included in the present work.26–30 Therefore, differences in concentrations and profiles in both liver and muscle were explored for the different sites in the present study.
:2 FTS is included in Fig. 1, but because there were a few sites where 8:2 FTS concentrations were not available it was not included in the statistical analysis shown in Table S6.† Differences in muscle concentrations between sites and species are shown in Fig. 2, which shows concentrations of the 14 PFAS which were targeted for most muscle samples (only seven substances, targeted in all samples, were included in the statistical analyses shown in Table S7†). From the figures it is clear that higher concentrations and a greater frequency of concentrations above the LOQ were reported for liver compared to muscle. The differences between liver and muscle are illustrated by the samples from lake Tyrifjorden, for which a direct comparison can be made for seven fish species,33 shown in Fig. S6.† Higher concentrations in liver compared to muscle have been reported in many previous studies.38–41 The reason for this is likely that many PFAS bind to specific proteins such as albumins and therefore mainly accumulate in tissues which are rich in these proteins, such as kidney, blood, and liver.38,39,42 Tissue specific accumulation has previously been reported to vary between substances. For example, FOSA, a precursor to PFOS, has been shown to accumulate in higher concentrations in other tissues (e.g. blood and kidney) compared to the liver, likely due to an efficient biotransformation into PFOS in the liver.43,44 Thus, there are merits associated with using both liver and muscle samples to identify PFAS sources. Owing to the higher concentrations, liver is considered to be a better suited tissue for source tracking purposes as concentrations above the LOQ are needed in order to determine PFAS fingerprints in fish affected by different sources. However, due to its relevance for assessing human dietary PFAS exposure, muscle was the preferred tissue for most of the AFFF impacted sites included in the present work.26–30 Therefore, differences in concentrations and profiles in both liver and muscle were explored for the different sites in the present study.
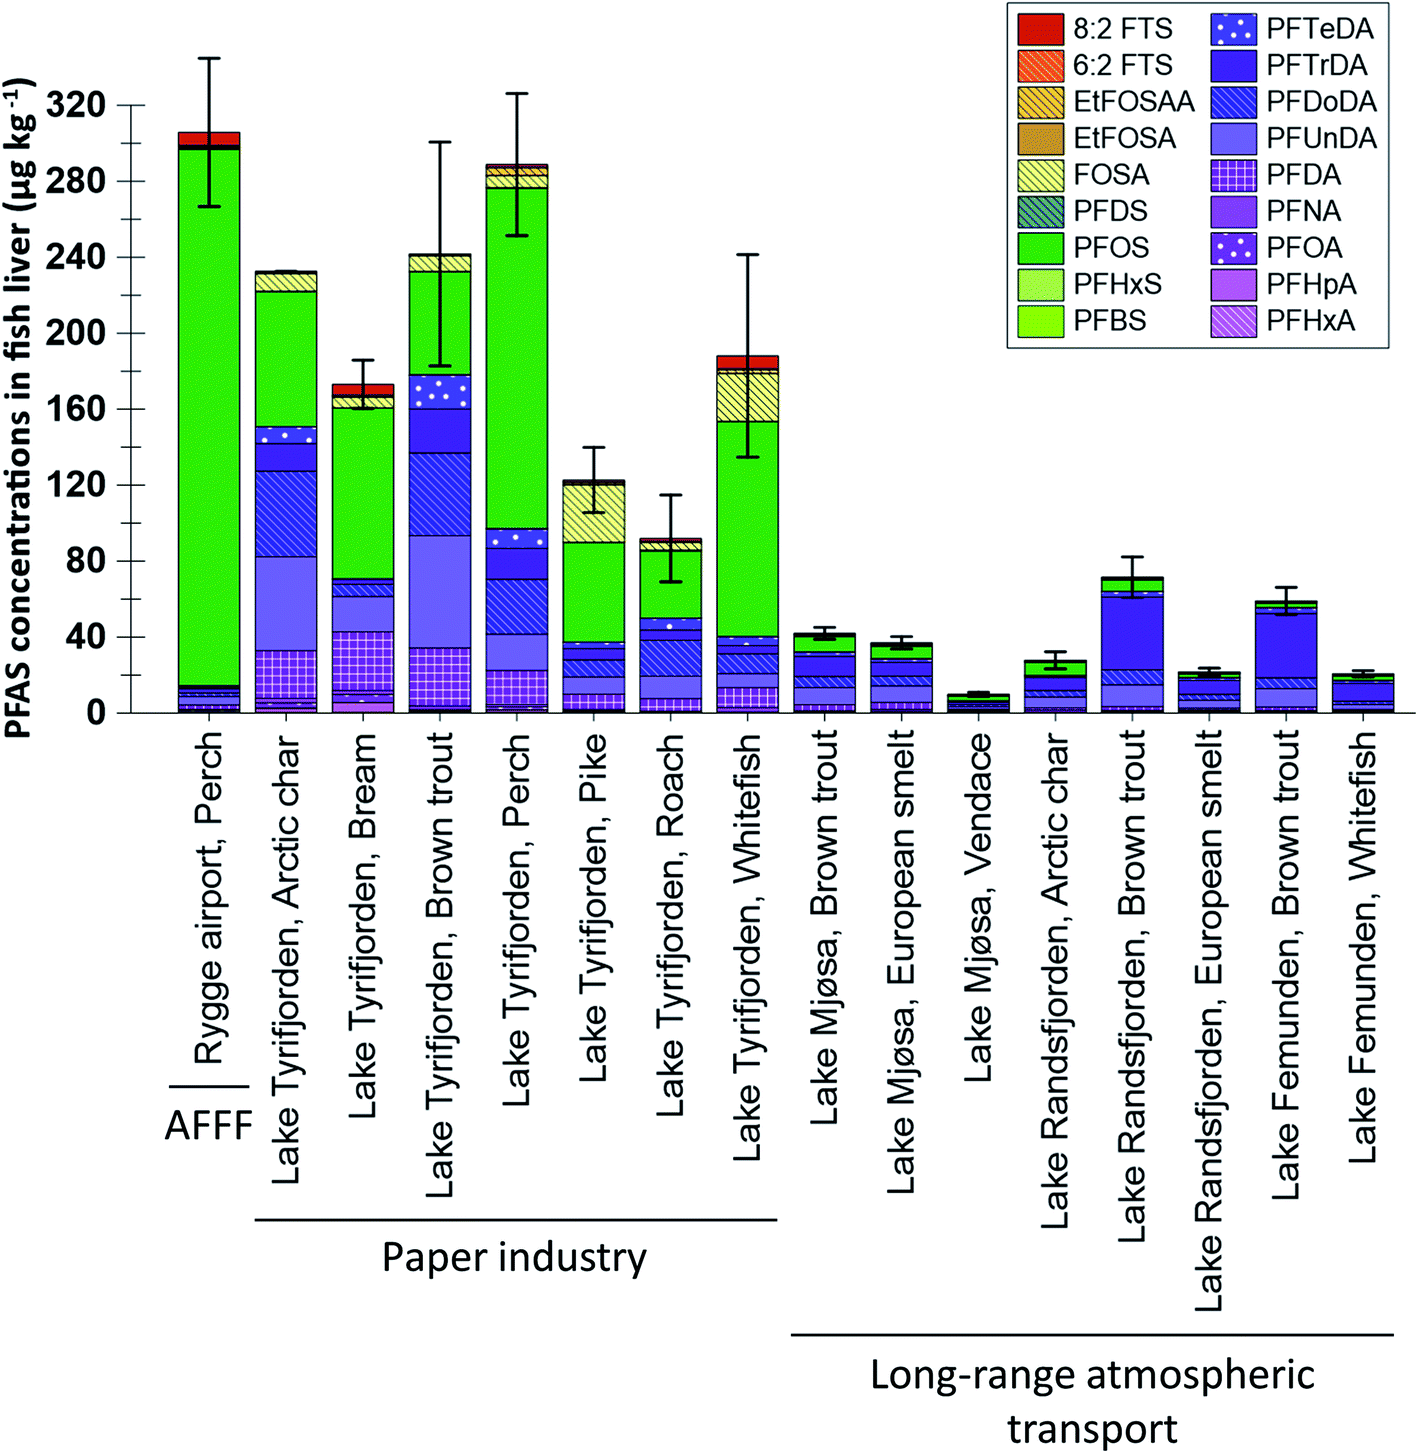 | ||
| Fig. 1 Concentrations of the targeted PFAS (and detected in at least one sample) in fish liver sampled at different sites receiving PFAS input from different sources. Note: 8:2 FTS was not targeted for samples from 2014 in lake Femunden, lake Mjøsa, and lake Randsfjorden. In the figure, PFAS concentrations were set to 0 in samples where they were not targeted. Concentrations below the limit of detection (LOQ) were set to LOQ/2. Lake Mjøsa is expected to be polluted by atmospheric long-range transport and diffuse PFAS sources including industry, waste water treatment plants (WWTP), and urban runoff. | ||
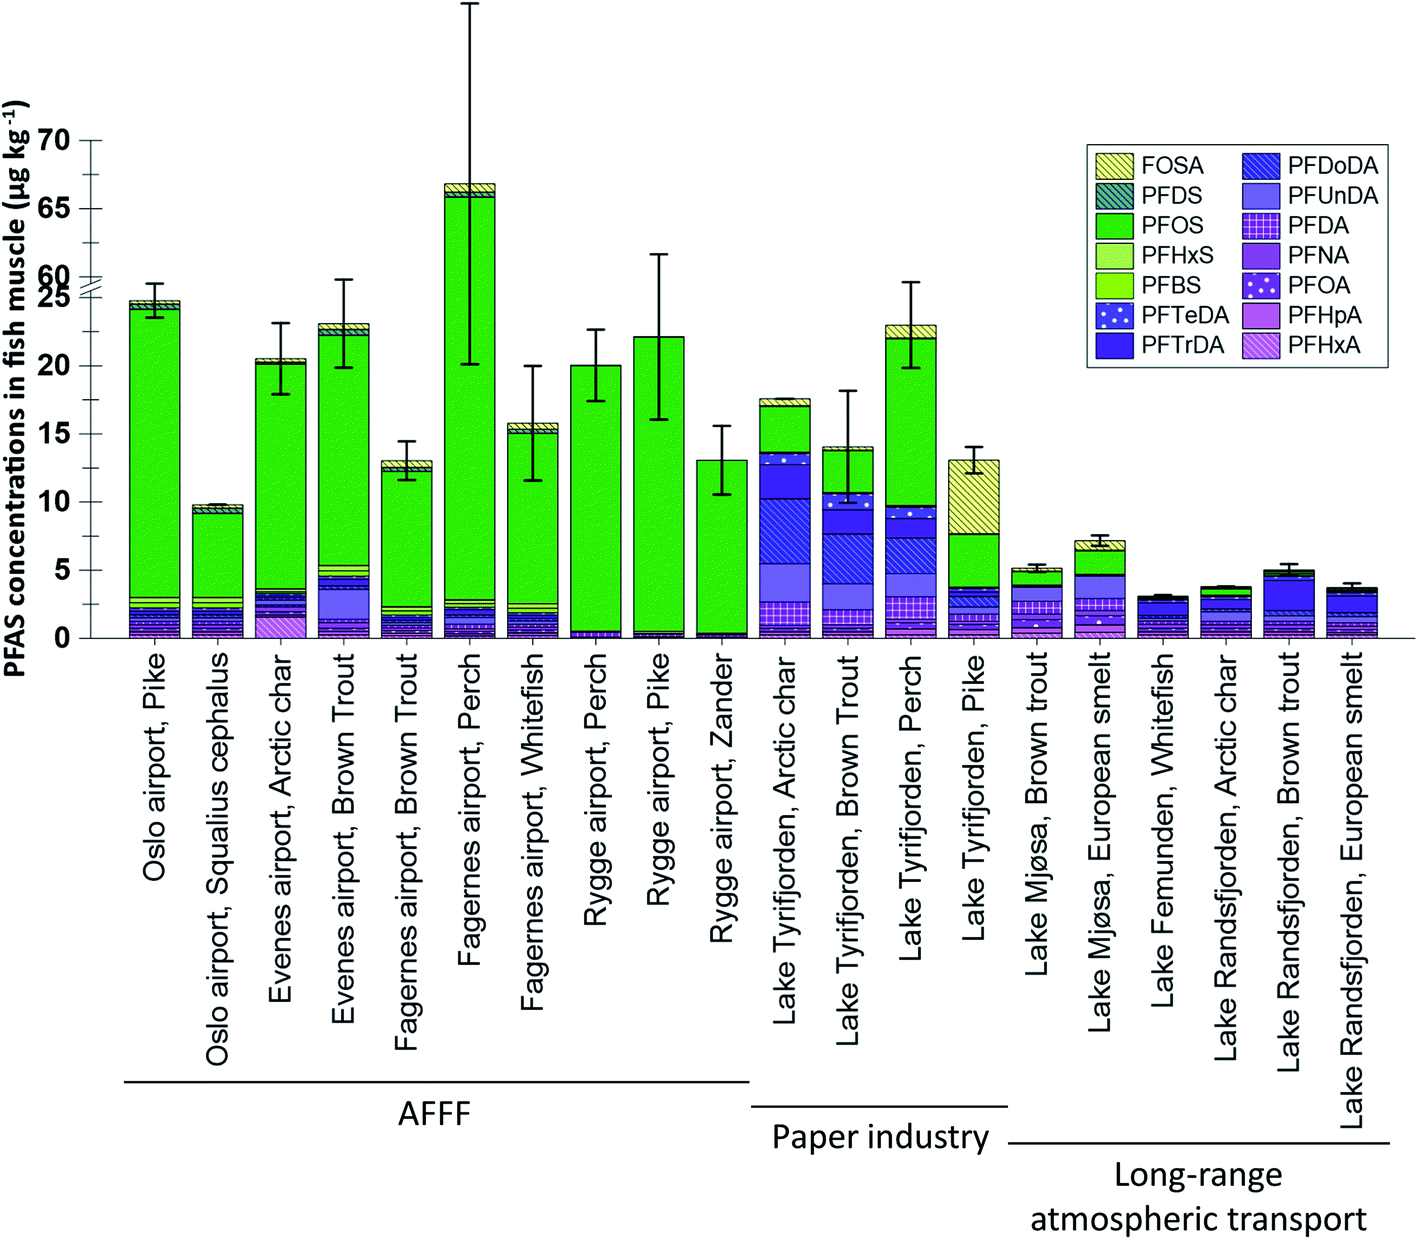 | ||
| Fig. 2 Concentrations of the targeted PFAS (and detected in at least one sample) in muscle samples from fish sampled at different sites receiving PFAS pollution from different sources. Note: PFOA was not targeted in trout sampled in lake Mjøsa in 2016. PFUnDA, PFDoDA, PFTrDA, and PFTeDA were not targeted in samples from lake Mjøsa and Rygge airport. PFDS and FOSA were not targeted in samples from Rygge airport. In the figure, PFAS concentrations were set to 0 in samples where they were not targeted. Concentrations below the limit of detection (LOQ) were set to LOQ/2. There is a break in the Y-axis between 25 and 60 μg kg−1. Lake Mjøsa is expected to be polluted by atmospheric long-range transport and diffuse PFAS sources including industry, waste water treatment plants (WWTP), and urban runoff. | ||
PFAS fingerprints for different source types
As shown in Table S2,† the only tissue where PFAS were targeted in multiple samples at all three source types was brown trout muscle. Thus, a PCA of PFAS profiles in brown trout muscle was used to explore if PFAS fingerprints in fish exposed to each of the three source types differed from each other. A detailed description of the selection of the sites and the individual PFAS are given in the ESI.† The PCA shown in Fig. 3 shows a clear grouping according to the different sites, reflecting distinct differences in PFAS profiles between the sites. However, the first two components only explained 45% of the variation in the data set, reflecting the relatively large variation within each site. Principal component 1 (PC1, X-axis) explained 29% of the variance in the data set. In the loading plot, PFOS was situated on the right-hand side, while the C10–C14 plotted to the left (PFDoDA and PFTeDA furthest to the left). In the score plot, samples from lake Tyrifjorden (paper production) plotted to the far left (i.e., with negative PC1 scores), samples from lake Randsfjorden (long-range atmospheric transport) plotted to the right of samples from lake Tyrifjorden (left side of the plot), and the samples from the AFFF impacted sites (Evenes airport and Fagernes airport) plotted to the right. The separation of the four sites along PC1 was significant (p < 0.05) for Fagernes airport and Evenes airport compared to all sites (also compared to each other), while lake Randsfjorden and lake Tyrifjorden were not significantly different from each other (p > 0.05). There were no clear differences between the locations/sites along PC2, which explained 16% of the variation in the data set.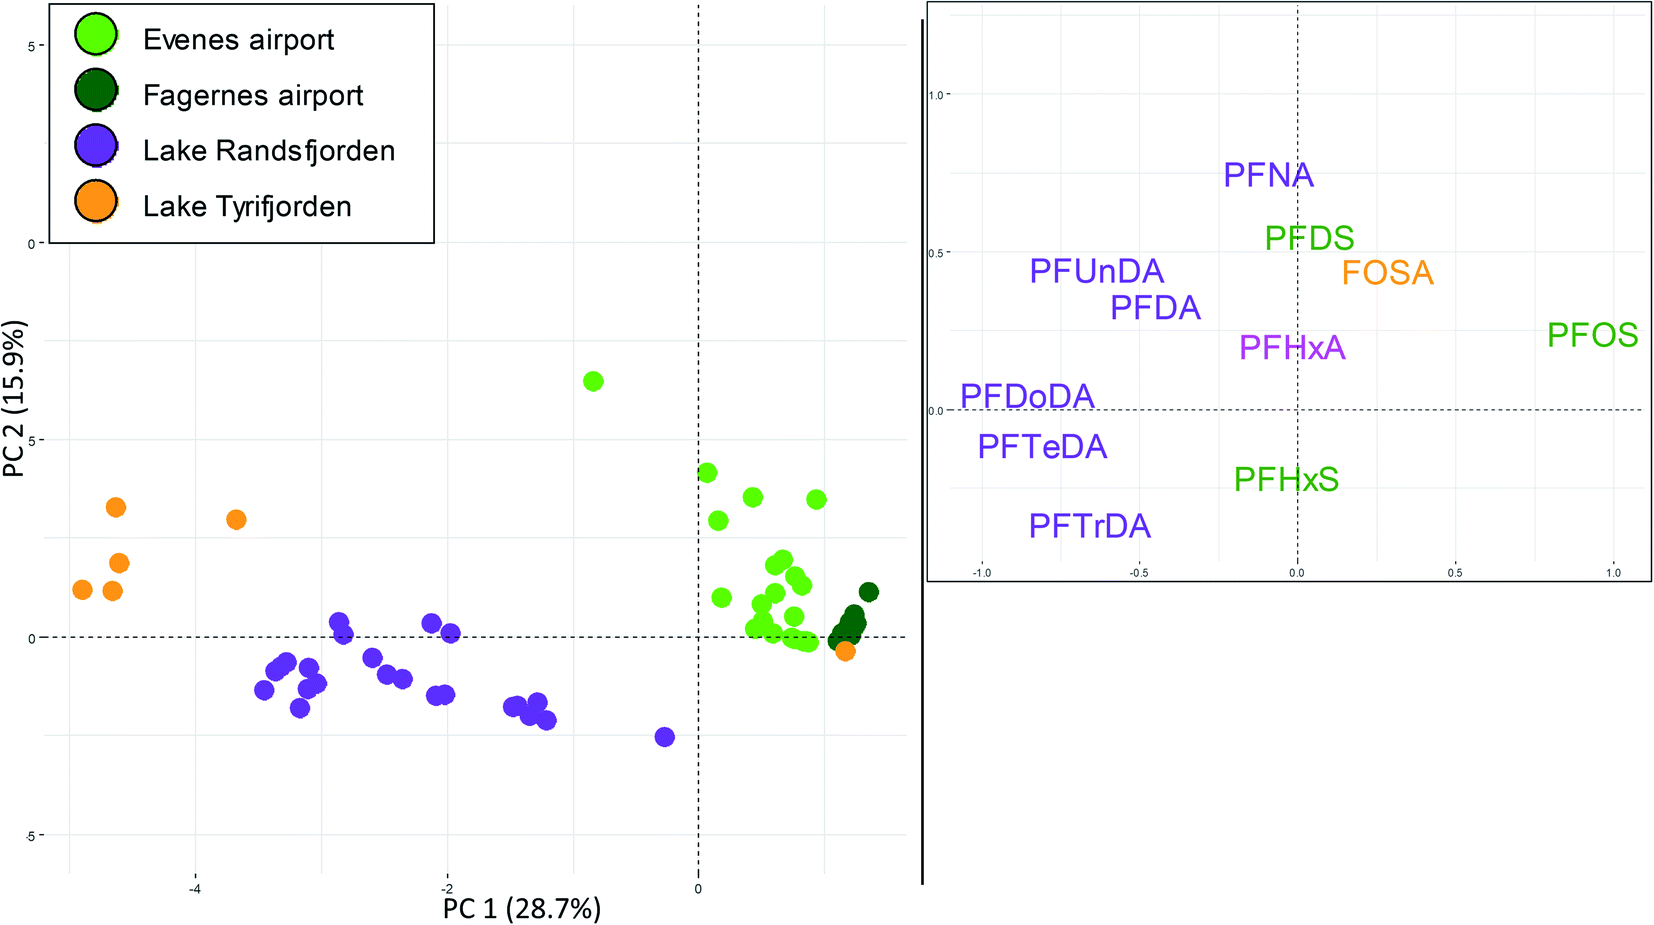 | ||
| Fig. 3 Principal Component Analysis (PCA) for PFAS profiles (relative distribution profiles) in brown trout muscle from two sites affected by AFFF (Evenes airport and Fagernes airport); lake Randsfjorden, which is impacted by long-range atmospheric transport; and lake Tyrifjorden polluted mainly by PFAS from production of paper products. The score plot is shown to the left and the loading plot is shown to the right. In the loading plot, PFCA are coloured purple and pink, PFSA are coloured green, and PFOS precursors (preFOS) are coloured yellow. Only PFAS targeted at all sites and detected above the LOQ in at least one sample were included. Concentrations below the LOQ were treated as 0. | ||
The PCA shows that samples from the AFFF impacted sites (Evenes and Fagernes airports) were dominated by PFOS, and to some extent FOSA, PFDS, PFHxA and PFHxS. PFHxS plotted in the lower part of the plot (i.e., negative PC2 values). In addition to being detected in samples from the AFFF impacted sites, PFHxS was also detected in seven brown trout muscle samples from lake Randsfjorden sampled in 2013 (0.1–1.2 μg kg−1) and in two samples in 2008 (0.1–0.2 μg kg−1), which may indicate a small local source of PFHxS. The presence of PFHxS in fish from lake Randsfjorden is somewhat unexpected as there is no known major local source nearby. The detected PFHxS is likely from a local diffuse source (or several sources), such as agricultural runoff or waste water runoff. The PCA indicates that brown trout muscle samples from lake Tyrifjorden (paper production PFAS point source) and lake Randsfjorden (long-range atmospheric transport) had higher percentages of long chained PFCA compared to the AFFF impacted sites. Thus, the grouping reflects the different PFAS profiles depending on the different sources, and that indicative fingerprints belonging to the specific source types can be identified. There was however one exception to this: one sample from lake Tyrifjorden where PFOS was the only PFAS above the LOQ. In general, concentrations in muscle were relatively low and close to the LOQ (and, as discussed above, liver is considered to be a better suited tissue for source tracking purposes in the present study).
To further explore the differences in PFAS profiles depending on sources, the tissues most relevant for comparison were selected based on the number of samples representing the different source types as shown in Table S2.† In the present study, liver is considered to be better suited for source tracking purposes than muscle tissue. Thus, brown trout liver was selected to explore differences between long-range atmospheric transport and production of paper products, and perch liver was selected to explore differences between the use of AFFF and production of paper products. However, as most samples from the AFFF impacted sites are muscle samples, perch and pike muscle were also used to explore the difference between the use of AFFF and production of paper products.
:2 FTOH is degraded to PFOA (C8) and PFNA (C9), 10:2 FTOH is degraded to PFDA (C10) and PFUnDA (C11), and 12:2 FTOH is degraded to PFDoDA (C12) and PFTrDA (C13)), and that the longer PFCA is more bioaccumulative compared to its shorter homologue (for these PFCA pairs).5,54 Therefore, ratios above one for the PFCA pairs, PFNA/PFOA, PFUnDA/PFDA, and PFTrDA/PFDoDA could indicate contribution from long-range atmospheric transport.
Neutral and ionic PFAS have been monitored in air at rural sampling stations in Norway since 2017.55–57 Results show that concentrations of the long chained PFCA (e.g. PFDoDA and PFTrDA) and their FTOH precursor are low, but that some atmospheric transport of PFCA precursors is occurring.55–57 Atmospheric oxidation of FTOH followed by deposition of PFCA,5 combined with the high bioaccumulation potential of the long chain PFCA7 might explain the detection in fish even if atmospheric concentrations of the suspected precursors are low. In addition, as the air sampling stations are located in rural areas, diffuse local/regional contribution to atmospheric pollution with neutral PFAS from e.g., urban areas could be an additional source to some lakes.
Brown trout livers were sampled from lake Femunden and lake Randsfjorden (considered to be mainly affected by long-range atmospheric transport), lake Mjøsa (long-range atmospheric transport and local diffuse sources), and lake Tyrifjorden (paper production). 14 PFAS were targeted for all sites and found at concentrations above the LOQ (in at least one sample), and these PFAS, as well as the ratios of PFUnDA/PFDA, and PFTrDA/PFDoDA, which may provide information on contribution from local exposure in addition to atmospheric long-range transport, were therefore included in the PCA (Fig. 4). PC1 accounted for 32% of the variance. In the score plot, samples from the two lakes considered to be mainly affected by long-range transport (lake Femunden and lake Randsfjorden) were generally plotted to the left and close to the centre (PC1 scores of −1.7 ± 0.2 and −1.5 ± 0.3, respectively). Individuals from lake Mjøsa were plotted close to the centre and to the right (PC1 scores of 1.6 ± 0.1), while samples from lake Tyrifjorden were plotted to the right (PC1 scores of 4.2 ± 0.5). Samples from lake Tyrifjorden and lake Mjøsa plotted significantly differently along PC1 (significantly different places on the x-axis) compared to all other sites (including each other, p < 0.01, Kruskal–Wallis and Bonferroni correction). Samples from lake Randsfjorden and lake Femunden did not differ significantly to each other along PC1 (p = 1.00). In the loading plot, PFTrDA was plotted to the left together with the PFCA ratios, PFUnDA/PFDA and PFTrDA/PFDoDA, which may indicate that samples with low PC1 scores were less exposed to sources other than long-range atmospheric transport compared to those with high PC1 values. PFDA, PFUnDA, and PFDoDA were plotted to the right along with PFOS and FOSA. The PC2 (Y-axis) explained 15% of the variance. Two individuals from lake Tyrifjorden plotted in the low right corner (marked with red circles in Fig. 4), while one sample from lake Randsfjorden plotted relatively low (marked with a red circle) indicating that these had accumulated, and thus had been exposed to, higher PFHxA, PFHpA, and PFOA concentrations (plotted low on the Y-axis). PFHxA, PFHpA, and PFOA were only detected above the LOQ in these three individuals, and concentrations were close to the LOQ.
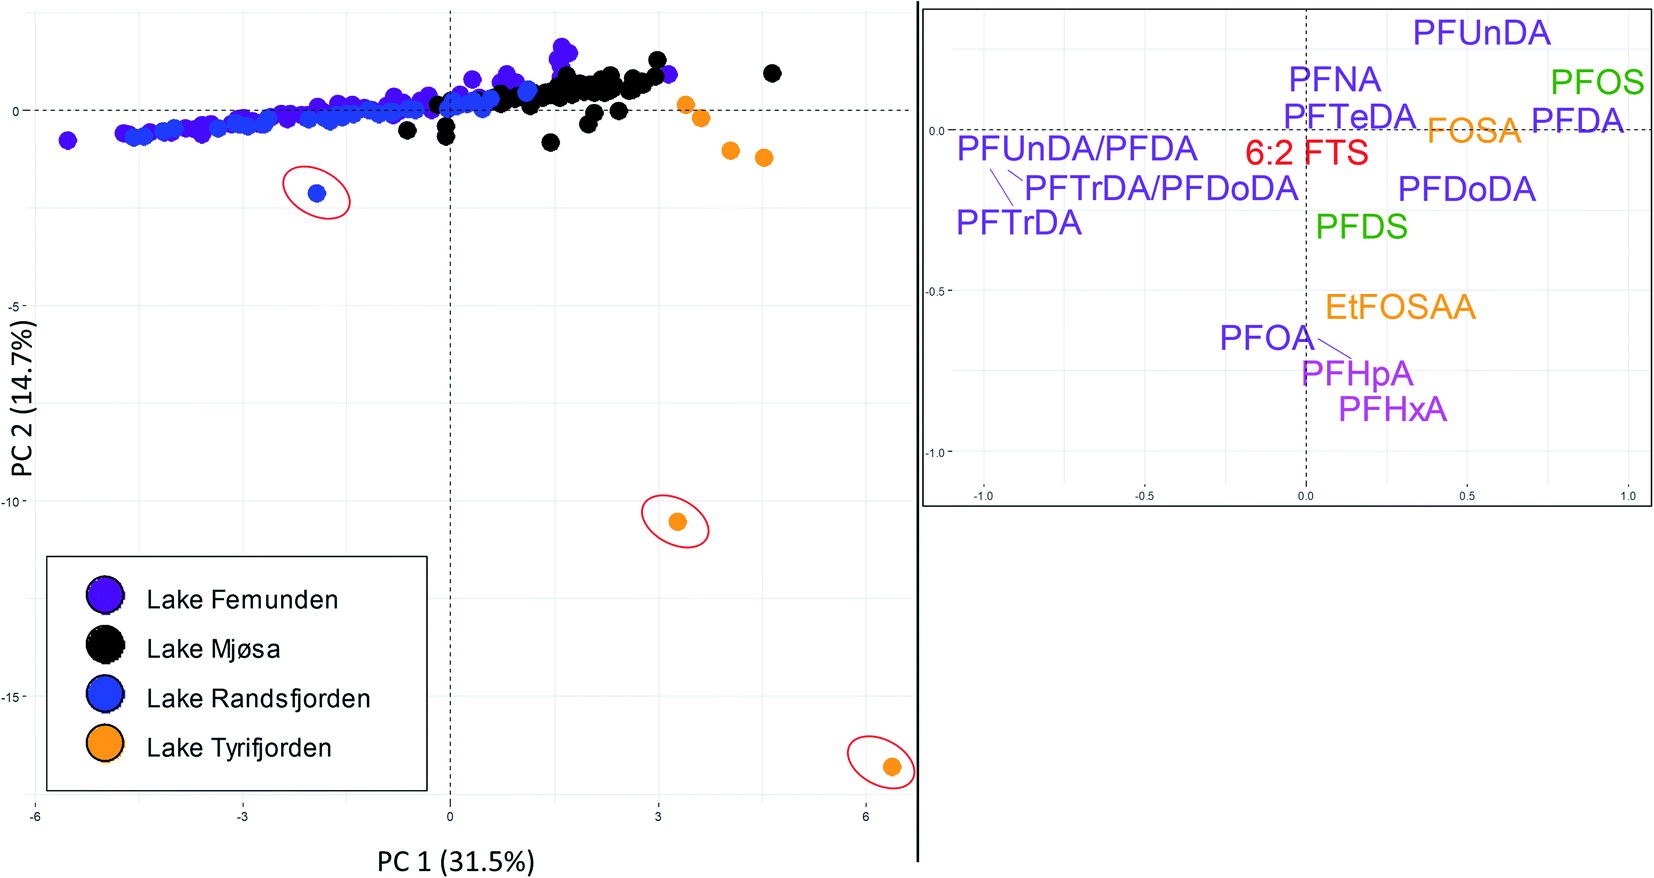 | ||
| Fig. 4 Principal Component Analysis (PCA) for PFAS profiles (relative distribution profiles) in brown trout livers from four large Norwegian lakes: lake Femunden, lake Mjøsa, lake Randsfjorden, and lake Tyrifjorden. The score plot is shown to the left and the loading plot is shown to the right. Only PFAS targeted at all sites and detected above the LOQ in at least one sample were included. Concentrations below the LOQ were treated as 0. Red circles in the score plot indicate the three individuals with PFOA concentrations above the LOQ. | ||
Sites considered to be mainly affected by long-range atmospheric transport plotted to the left of the samples from lake Tyrifjorden reflecting their different PFAS profiles including a higher percentage of PFTrDA, and different ratios of the PFCA pairs indicative of long-range atmospheric transport. Profiles of C8–C13 PFCA in brown trout liver samples from lake Femunden and lake Randsfjorden (Fig. 4) follow the previously reported pattern for biota mainly affected by long-range transport;51–54 PFNA concentrations were higher than PFOA concentrations, PFUnDA concentrations were higher than PFDA concentrations, and concentrations of PFTrDA were higher than concentrations of PFDoDA. The ratios of PFUnDA/PFDA and PFTrDA/PFDoDA were significantly higher in samples from lake Randsfjorden (mean 5.0 and 4.3, respectively) and lake Femunden (mean 4.9 and 4.7, respectively) compared to lake Mjøsa (mean 2.8 and 1.7, respectively) and lake Tyrifjorden (mean 1.8 and 0.7, respectively), shown in Tables S8 and S9† (p < 0.05, Kruskal–Wallis and Bonferroni correction). The clearest difference for these ratios was the relationship between concentrations of PFTrDA and PFDoDA in lake Tyrifjorden (compared to the lakes considered to be mainly affected by long-range atmospheric transport) where PFDoDA concentrations in brown trout livers were on average two times the PFTrDA concentrations.
PFOS accounted for 22% of the ∑PFAS 14 in both samples from lake Mjøsa and lake Tyrifjorden, while the percentages were significantly lower (p < 0.01, Kruskal–Wallis and Bonferroni correction) in lake Randsfjorden (11%) and lake Femunden (7%). In addition, the percentage of PFOS was significantly lower in lake Femunden compared to lake Randsfjorden (p < 0.01). There are no known major local PFAS source in lake Mjøsa. However, fish in lake Mjøsa are considered to receive PFAS from several different local diffuse sources, including urban runoff and effluent from WWTP.36 Landfill leachate and WWTP discharge have previously been reported to be dominated by PFOS and shorter chain length PFAA (or their precursors).58–60 Small contributions of local diffuse sources might also explain the higher percentage of PFOS in lake Randsfjorden compared to lake Femunden. This indicates that increased percentages of PFOS compared to the lakes dominated by long-range atmospheric transport can be interpreted as an indication of contribution from local sources. In accordance with this, samples from lake Mjøsa generally plotted between samples from lake Tyrifjorden and the lakes considered to be mainly affected by long-range atmospheric transport.
In spite of the expected higher inputs from local PFAS sources in lake Mjøsa (based on the known diffuse sources and the higher percentages of PFOS in fish), ∑PFAS concentrations in brown trout from lake Mjøsa (liver ∑PFAS 17: 41.8 μg kg−1, muscle ∑PFAS 7: 3.2 μg kg−1) were lower than or comparable to concentrations in lake Femunden (liver ∑PFAS 17: 58.9 μg kg−1) and lake Randsfjorden (liver ∑PFAS 17: 71.4 μg kg−1, muscle ∑PFAS 7: 1.4 μg kg−1). In addition to PFAS sources, another factor to take into consideration when comparing fish from different lakes are potential differences in diet. For example, brown trout are on top of the food web in both lake Mjøsa and lake Randsfjorden.61 However, the food web in lake Mjøsa consists of more trophic levels compared to lake Randsfjorden,61 thus there are differences in the diet of brown trout in the two lakes. Further, large brown trout in lake Mjøsa are considered to be almost solely pelagic, whereas the brown trout in lake Femunden are more closely linked to the terrestrial food web, e.g. insects, and are on a lower trophic level. Respiratory elimination of ionic and thus more water soluble PFAS, such as PFCA, is less efficient in terrestrial organisms (e.g. insects) than in aquatic organisms.62 Thus, fish largely feeding on terrestrial organisms might be exposed to PFAS to a greater extent compared to fish with a different diet, which might explain why ∑PFAS concentrations are not higher in lake Mjøsa compared to lake Femunden and lake Randsfjorden. Nevertheless, distinct differences in PFAS profiles were shown depending on PFAS source.
Both samples from lakes considered to be mainly affected by long-range atmospheric transport, and samples from lake Tyrifjorden showed high percentages of long chained PFCA, however the relative percentages and the ratios between the studied PFCA pairs differed. Fish mainly affected by long-range atmospheric transport showed high ratios (above one) for PFUnDA/PFDA and PFTrDA/PFDoDA. In addition, samples from lake Tyrifjorden showed higher ∑PFAS 17 concentrations, and higher PFOS and FOSA percentages. Production of paper products is a little explored PFAS point source. Concentrations in fish exposed to this type of point source have only been reported for one identified site, which are the concentrations used in the present study.32,33 A range of other PFAS than those included in the present study, including several precursors to PFAA (e.g. N-ethyl perfluorooctane sulfonamido ethanol (EtFOSE); mono-, di-, and tri-substituted phosphate esters of EtFOSE, referred to as SAmPAP; and fluorotelomer mercaptoalkyl phosphate esters, referred to as FTMAP) have been reported to have been used in the paper industry.63–66 In addition to the PFAS included in the PCA in Fig. 4, elevated concentrations of 10:2 FTS, 12:2 FTS, and 14:2 FTS were reported as well.33 These were not targeted at the other sites investigated in the present study and could therefore not be included in the comparison.
PFAS profiles in pike muscle samples were reported for two AFFF impacted sites (Rygge airport and Oslo airport) and lake Tyrifjorden (production of paper products). Seven PFAS were targeted for all sites and were found at concentrations above the LOQ (in at least one sample), shown in Fig. S5.† Samples from lake Tyrifjorden plotted on the side of the plot associated with PFCA (right side), while samples representing the AFFF source plotted on the side of the plot associated with PFOS (left side). PC1 scores for samples from lake Tyrifjorden differed significantly to scores for samples from Rygge airport (p < 0.01, Kruskal–Wallis and Bonferroni correction).
Perch livers were sampled at both Rygge airport (AFFF source) and lake Tyrifjorden (paper product production source). Concentrations of ∑PFAS 17 were relatively similar between the two sites (299 and 288 μg kg−1 at Rygge airport and lake Tyrifjorden, respectively) however PFAS profiles differed. 16 PFAS were detected in concentrations above the LOQ (in at least one sample) and used in the PCA. As shown in Fig. 5, there were distinct groupings for the 16 PFAS. PC1 (X-axis) explained 36% of the variance. In the score plot, samples from Rygge airport grouped to the right (mean PC1 score of 3.7 ± 0.1) while samples from lake Tyrifjorden plotted close to the centre and to the left (PC1 = −1.3 ± 0.2). The difference was significant (p < 0.01, Kruskal–Wallis and Bonferroni correction). In the loading plot, PFOS and other PFSA (PFHxS, PFDS, and PFDoDS), and the ratios of PFTrDA/PFDoDA and PFUnDA/PFDA plotted to the right. C9–C14 PFCA plotted to the left. PC2 (Y-axis) explained 17% of the variance. In the loading plot, the PFOS precursors (preFOS), EtFOSAA and FOSA, plotted low, while PFHpA, PFOA, 6:2 FTS, and PFHxA plotted high. In the score plot, samples from Rygge airport plotted above, however relatively close to, 0. Samples from lake Tyrifjorden plotted generally below 0, however a few samples plotted very high. Samples from Rygge airport grouped to the right based on their high percentage of PFSA relative to samples from lake Tyrifjorden which have higher percentages of PFCA and preFOS. The higher percentages of PFSA in perch liver samples from Rygge airport echoed the same trend in muscle samples (where samples from sites affected by AFFF sources were dominated by PFSA). The ratios PFTrDA/PFDoDA and PFUnDA/PFDA differed significantly between the two sites (p < 0.01 for both ratios). The PFUnDA/PFDA ratio was 1.1 for lake Tyrifjorden and 1.9 for Rygge airport, while the PFTrDA/PFDoDA ratio was 0.5 for lake Tyrifjorden and 1.3 for Rygge airport. The PFTrDA/PFDoDA ratio reported for perch livers in lake Tyrifjorden (paper production) are different compared to ratios reported for biota affected by PFAS from long-range atmospheric transport (i.e., below 1 for lake Tyrifjorden), indicating a local source to PFCA. For Rygge airport, these ratios are consistent with previously reported patterns associated with long-range transport,51–54 which might indicate that the long chained PFCA reported for fish from Rygge airport is mainly due to long-range atmospheric transport.
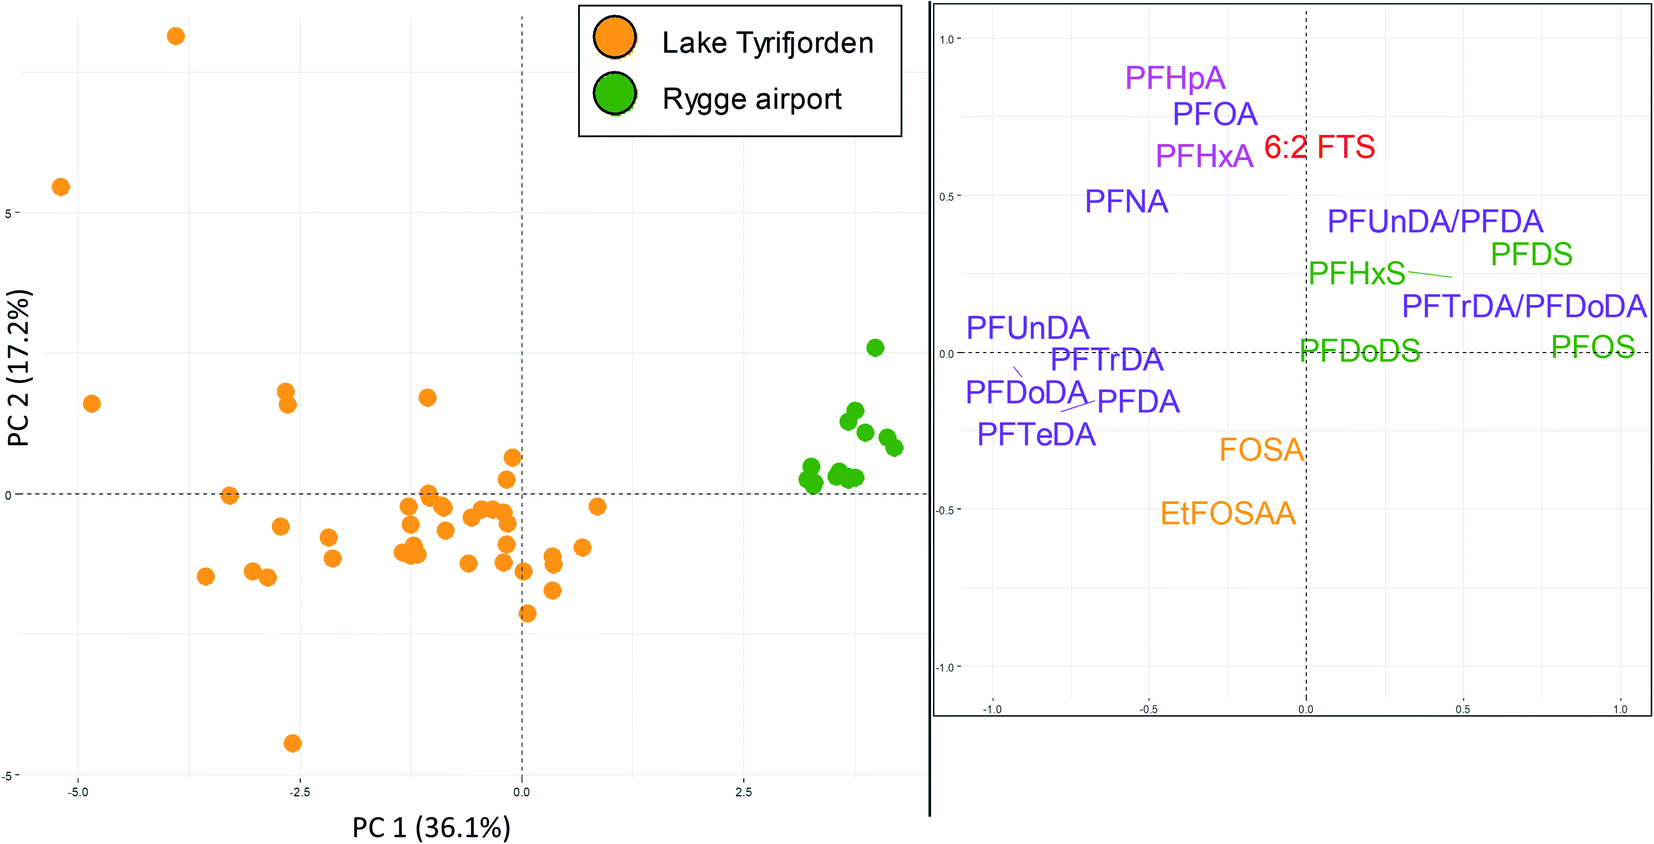 | ||
| Fig. 5 Principal Component Analysis (PCA) for PFAS profiles (relative distribution profiles) in perch livers from two Norwegian lakes, lake Tyrifjorden and lake Vansjø (polluted by Rygge airport). The score plot is shown to the left and the loading plot is shown to the right. Only PFAS targeted in at both sites and detected above the LOQ in at least one sample were included. Concentrations below the LOQ were treated as 0. | ||
The high percentages of PFSA in fish sampled at AFFF impacted sites reflects the dominance of PFSA in AFFF before the phase-out of firefighting foams containing PFOS in Norway in the 2000s.67,68 Such older AFFF have been reported to be dominated by PFOS and some other PFSA.68,69 The PFSA with shorter chain length compared to PFOS, PFHxS and PFHpS, have previously been reported to have smaller bioaccumulation potentials and shorter half-lives in fish.2,38,70,71 However, accumulation of PFHxS in fish has been reported for other AFFF polluted sites.72–75 Therefore, high percentages of PFOS and other PFSA are considered to be indicators of a potential AFFF related PFAS source. Due to their lower bioaccumulation potentials, the presence of PFHxS and possibly PFHpS in biota samples, in addition to high percentages of PFOS and other PFSA could indicate exposure to relatively high concentrations of AFFF related PFAS pollution.
Environmental implications
Distinct differences in PFAS fingerprints in fish were observed depending on PFAS source, indicating that fingerprinting in fish can be used to identify source types. As profiles associated with specific source types need to be identified in order to recognise suspected sources and/or to distinguish between sources, more data is needed in order to identify what could then be considered as standard fingerprints associated with specific source types and environmental conditions other than those explored here. Summaries of the fingerprints for the PFAS sources investigated here are listed below.Long-range atmospheric transport
Higher ∑PFAS concentrations can be expected for sites directly affected by point sources compared to sites affected mainly by long-range atmospheric transport. Fish sampled in the lakes considered to be mainly affected by long-range atmospheric transport had high percentages of long chained PFCA (as percentages of sum of the PFAS reported in this study) compared to the sites affected by the use of AFFF, and high ratios (above one) for PFUnDA/PFDA and PFTrDA/PFDoDA (as discussed above) – in contrast to the site polluted by production of paper products.Production of paper products (point source)
Production of paper products is a little explored PFAS point source and a range of other PFAS than those included in the present study are potential indicators of PFAS pollution from paper industry. Fish from lake Tyrifjorden, showed high percentages of long chained PFCA compared to the AFFF impacted sites (similar to the lakes mainly affected by long-range atmospheric transport). However, concentrations were higher compared to the sites affected by long-range atmospheric transport, and the ratios between the studied PFCA pairs did not follow the same pattern (especially, the percentage of PFDoDA was high). In addition, the percentage of PFOS was high in these samples. Therefore, high percentages of long chained PFCA in combination with different ratios for PFCA pairs and elevated percentages of PFOS are potential indicators of PFAS pollution from the paper industry. However, as this conclusion is based on only one case study site, investigations at other sites polluted by similar industrial activity are needed.Use of AFFF (point source)
High percentages of PFOS and other PFSA are indicators of a potential AFFF source, as these PFSA reflect the dominance of PFSA in AFFF before the phase-out of firefighting foams containing PFOS. The presence of shorter PFSA (compared to PFOS), in addition to high percentages of PFOS indicate exposure to relatively high concentrations of AFFF related PFAS pollution.Conflicts of interest
There are no conflicts to declare.Acknowledgements
The research was funded by the Norwegian Research Council under the MILJØFORSK program for project number 268258/E50.References
- J. Glüge, M. Scheringer, I. Cousins, J. C. DeWitt, G. Goldenman, D. Herzke, R. Lohmann, C. Ng, X. Trier and Z. Wang, An overview of the uses of per- and polyfluoroalkyl substances (PFAS), Environ. Sci.: Processes Impacts, 2020, 1462–1468 Search PubMed.
- G. L. Lescord, K. A. Kidd, A. O. De Silva, M. Williamson, C. Spencer, X. Wang and D. C. G. Muir, Perfluorinated and polyfluorinated compounds in lake food webs from the Canadian High Arctic, Environ. Sci. Technol., 2015, 49, 2694–2702 CrossRef CAS PubMed.
- G. T. Tomy, W. Budakowski, T. Halldorson, P. A. Helm, G. A. Stern, K. Friesen, K. Pepper, S. A. Tittlemier and A. T. Fisk, Fluorinated organic compounds in an Eastern Arctic marine food web, Environ. Sci. Technol., 2004, 38, 6475–6481 CrossRef CAS PubMed.
- K. Gao, X. Miao, J. Fu, Y. Chen, H. Li, W. Pan, J. Fu, Q. Zhang, A. Zhang and G. Jiang, Occurrence and trophic transfer of per- and polyfluoroalkyl substances in an Antarctic ecosystem, Environ. Pollut., 2019, 257, 113383 CrossRef PubMed.
- D. A. Ellis, J. W. Martin, A. O. De Silva, S. A. Mabury, M. D. Hurley, M. P. Sulbaek Andersen and T. J. Wallington, Degradation of fluorotelomer alcohols: A likely atmospheric source of perfluorinated carboxylic acids, Environ. Sci. Technol., 2004, 38, 3316–3321 CrossRef CAS PubMed.
- J. Liu and S. Mejia Avendaño, Microbial degradation of polyfluoroalkyl chemicals in the environment: A review, Environ. Int., 2013, 61, 98–114 CrossRef CAS PubMed.
- M. Houde, A. O. De Silva, D. C. G. Muir and R. J. Letcher, Monitoring of perfluorinated compounds in aquatic biota: An updated review, Environ. Sci. Technol., 2011, 45, 7962–7973 CrossRef CAS PubMed.
- K. Prevedouros, I. T. Cousins, R. C. Buck and S. H. Korzeniowski, Sources, fate and transport of perfluorocarboxylates, Environ. Sci. Technol., 2006, 40, 32–44 CrossRef CAS PubMed.
- R. Grønnestad, B. P. Vázquez, A. Arukwe, V. L. B. Jaspers, B. M. Jenssen, M. Karimi, J. L. Lyche and Å. Krøkje, Levels, patterns, and biomagnification potential of perfluoroalkyl substances in a terrestrial food chain in a Nordic Skiing Area, Environ. Sci. Technol., 2019, 53(22), 13390–13397 CrossRef PubMed.
- C. Simmonet-Laprade, H. Budzinski, M. Babut, K. Le Menach, G. Munoz, M. Lauzent, B. J. D. Ferrari and P. Labadie, Investigation of the spatial variability of poly- and perfluoroalkyl substance trophic magnification in selected riverine ecosystems, Sci. Total Environ., 2019, 686, 393–401 CrossRef CAS PubMed.
- C. J. A. F. Kwadijk, M. Kotterman and A. A. Koelmans, Partitioning of perfluorooctanesulfonate and perfluorohexanesulfonate in the aquatic environment after an accidental release of aqueous film forming foam at Schiphol Amsterdam Airport, Environ. Toxicol. Chem., 2014, 33, 1761–1765 CrossRef CAS PubMed.
- L. Ahrens, K. Norström, T. Viktor, A. P. Cousins and S. Josefsson, Stockholm Arlanda Airport as a source of per- and polyfluoroalkyl substances to water, sediment and fish, Chemosphere, 2015, 129, 33–38 CrossRef CAS PubMed.
- H. K. Knutsen, J. Alexander, L. Barregård, M. Bignami, B. Brüschweiler, S. Ceccatelli, B. Cottrill, M. Dinovi, B. Grasl-Kraupp, C. Hogstrand, L. R. Hoogenboom, C. S. Nebbia, I. P. Oswald, A. Petersen, M. Rose, A. Roudot, T. Schwerdtle, C. Vleminckx, G. Vollmer, H. Wallace, S. De Saeger, G. S. Eriksen, P. Farmer, J. Fremy, Y. Y. Gong, K. Meyer, D. Parent-Massin, H. van Egmond, A. Altieri, P. Colombo, Z. Horváth, S. Levorato and L. Edler, Risk to human health related to the presence of perfluorooctane sulfonic acid and perfluorooctanoic acid in food, EFSA J., 2018, 16 DOI:10.2903/j.efsa.2018.5367.
- C. F. Kwiatkowski, D. Q. Andrews, L. S. Birnbaum, T. A. Bruton, J. C. Dewitt, D. R. U. Knappe, M. V. Maffini, M. F. Miller, K. E. Pelch, A. Reade, A. Soehl, X. Trier, M. Venier, C. C. Wagner, Z. Wang and A. Blum, Scientific basis for managing PFAS as a chemical class, Environ. Sci. Technol. Lett., 2020, 7(8), 532–543 CrossRef CAS PubMed.
- J. L. Domingo and M. Nadal, Per- and polyfluoroalkyl substances (PFASs) in food and human dietary intake: A review of the recent scientific literature, J. Agric. Food Chem., 2017, 65, 533–543 CrossRef CAS PubMed.
- D. Schrenk, M. Bignami, L. Bodin, J. K. Chipman, J. del Mazo, B. Grasl-Kraupp, C. Hogstrand, L. Hoogenboom, J.-C. Leblanc, C. S. Nebbia, E. Nielsen, E. Ntzani, A. Petersen, S. Sand, C. Vleminckx, H. Wallace, L. Barregård, S. Ceccatelli, J. P. Cravedi, T. I. Halldorsson, L. S. Haug, N. Johansson, H. K. Knutsen, M. Rose, A. C. Roudot, H. Van Loveren, G. Vollmer, K. Mackay, F. Riolo and T. Schwerdtle, Risk to human health related to the presence of perfluoroalkyl substances in food, EFSA J., 2020, 18, 6223 Search PubMed.
- J. Hölzer, T. Göen, P. Just, R. Reupert, K. Rauchfuss, M. Kraft, J. Müller and M. Wilhelm, Perfluorinated compounds in fish and blood of anglers at Lake Möhne, Sauerland area, Germany, Environ. Sci. Technol., 2011, 45, 8046–8052 CrossRef PubMed.
- S. Hansen, R. Vestergren, D. Herzke, M. Melhus, A. Evenset, L. Hanssen, M. Brustad and T. M. Sandanger, Exposure to per- and polyfluoroalkyl substances through the consumption of fish from lakes affected by aqueous film-forming foam emissions — A combined epidemiological and exposure modeling approach. The SAMINOR 2 Clinical Study, Environ. Int., 2016, 94, 272–282 CrossRef CAS PubMed.
- L. R. Dorrance, S. Kellogg and A. H. Love, What you should know about per- and polyfluoroalkyl substances (PFAS) for environmental claims, Environ. Claims J., 2017, 29, 290–304 CrossRef.
- H. Joerss, T. R. Schramm, L. Sun, C. Guo, J. Tang and R. Ebinghaus, Per- and polyfluoroalkyl substances in Chinese and German river water – Point source- and country-specific fingerprints including unknown precursors, Environ. Pollut., 2020, 267, 115567 CrossRef CAS.
- X. Zhang, R. Lohmann, C. Dassuncao, X. C. Hu, A. K. Weber, C. D. Vecitis and E. M. Sunderland, Source attribution of poly-and perfluoroalkyl substances (PFASs) in surface waters from Rhode Island and the New York Metropolitan Area, Environ. Sci. Technol. Lett., 2016, 3, 316–321 CrossRef CAS PubMed.
- X. C. Hu, C. Dassuncao, X. Zhang, P. Grandjean, P. Weihe, G. M. Webster, F. Nielsen and E. M. Sunderland, Can profiles of poly- and perfluoroalkyl substances (PFASs) in human serum provide information on major exposure sources?, J. Environ. Health, 2018, 17, 1–15 CrossRef PubMed.
- Z. Wang, J. C. DeWitt, C. P. Higgins and I. T. Cousins, A never-ending story of per-and polyfluoroalkyl substances (PFASs)?, Environ. Sci. Technol., 2017, 51, 2508–2518 CrossRef CAS PubMed.
- C. A. McDonough, J. L. Guelfo and C. P. Higgins, Measuring total PFASs in water: The tradeoff between selectivity and inclusivity, Curr. Opin. Environ. Sci. Health, 2019, 7, 13–18 CrossRef PubMed.
- M. J. Benotti, L. A. Fernandez, G. F. Peaslee, G. S. Douglas, A. D. Uhler and S. Emsbo-Mattingly, A forensic approach for distinguishing PFAS materials, Environ. Forensics, 2020, 1–15 Search PubMed.
- COWI, PFAS i konsumfisk ved Harstad-Narvik lufthavn ENEV. in Report on Behalf of Avinor. Norwegian, 2020 Search PubMed.
- Ø. P. Hveding, V. Kvisle and H. Gregersen, in Prøveinnsamling Av Fisk for Analyse Av PFAS - Fagernes Lufthavn Leirin, Kalken - Våren 2018 - Oppdragsnr.: 5183877 - Dokumentnr.: 01-2018. On Behalf of Avinor. Norwegian, 2018 Search PubMed.
- Ø. P. Hveding, V. Kvisle, H. Gregersen, K. Raamat and E. B. Thorsen, in Prøveinnsamling Av Fisk for Analyse Av PFAS - Fagernes Lufthavn Leirin - Resultatrapport Høsten 2018 - Oppdragsnr.: 5185983 Dokumentnr.: 01-2019. On Behalf of Avinor. Norwegian, 2019 Search PubMed.
- J. Stene, Ø. P. Hveding and K. G. Moe, Undersøkelse Av PFAS I Fisk I Sogna Og Leira - Oslo Lufthavn - Høsten 2018. Avinor Report. In Norwegian, 2019 Search PubMed.
- C. E. Amundsen, T. Joranger and M. Sparrevik, PFAS Ved Rygge Flystasjon - Tiltaksvurderinger 1.Mars 2016 - Forsvarsbygg Rapport 867/2016. Report from Forsvarsbygg. In Norwegian, 2016 Search PubMed.
- M. Jartun, A. Økelsrud, T. Rundberget, E. K. Enge, P. Rostkowski, N. Warner, M. Harju and I. Johansen, Monitoring of Environmental Contaminants in Freshwater Ecosystems 2018 - Occurrence and Biomagnification. Report on behalf of Norwegian Environment Agency, 2019 Search PubMed.
- H. A. Langberg, H. P. H. Arp, G. D. Breedveld, G. A. Slinde, Å. Høiseter, H. M. Grønning, M. Jartun, T. Rundberget, B. M. Jenssen and S. E. Hale, Paper product production identified as the main source of per- and polyfluoroalkyl substances (PFAS) in a Norwegian lake: source and historic emission tracking, Environ. Pollut., 2021, 273, 116259 CrossRef CAS PubMed.
- H. A. Langberg, G. D. Breedveld, G. A. Slinde, H. M. Grønning, Å. Høisæter, M. Jartun, T. Rundberget, B. M. Jenssen and S. E. Hale, Fluorinated precursor compounds in sediments as a Source of perfluorinated alkyl acids (PFAA) to Biota, Environ. Sci. Technol., 2020, 54, 13077–13089 CrossRef CAS PubMed.
- S. E. Hale, H. P. H. Arp, G. A. Slinde, E. J. Wade, K. Bjørseth, G. D. Breedveld, B. F. Straith, K. G. Moe, M. Jartun and Å. Høisæter, Sorbent amendment as a remediation strategy to reduce PFAS mobility and leaching in a contaminated sandy soil from a Norwegian firefighting training facility, Chemosphere, 2017, 171, 9–18 CrossRef CAS PubMed.
- D. Kupryianchyk, S. E. Hale, G. D. Breedveld and G. Cornelissen, Treatment of sites contaminated with perfluorinated compounds using biochar amendment, Chemosphere, 2016, 142, 35–40 CrossRef CAS PubMed.
- L. D. Blytt and P. Stang, in Report 242/2018, Organiske miljøgifter i norsk avløpsslam – Resultater fra undersøkelsen i 2017/18, Norwegian, 2019 Search PubMed.
- R Core Team, 2017.
- S. Falk, K. Failing, S. Georgii, H. Brunn and T. Stahl, Tissue specific uptake and elimination of perfluoroalkyl acids (PFAAs) in adult rainbow trout (Oncorhynchus mykiss) after dietary exposure, Chemosphere, 2015, 129, 150–156 CrossRef CAS PubMed.
- P. D. Jones, W. Hu, W. De Coen, J. L. Newsted and J. P. Giesy, Binding of perfluorinated fatty acids to serum proteins, Environ. Toxicol. Chem., 2003, 22, 2639–2649 CrossRef CAS PubMed.
- J. W. Martin, S. A. Mabury, K. R. Solomon and D. C. G. Muir, Bioconcentration and tissue distribution of perfluorinated acids in rainbow trout (Oncorhynchus mykiss), Environ. Toxicol. Chem., 2003, 22, 196–204 CrossRef CAS PubMed.
- W. Wen, X. Xia, D. Zhou, H. Wang, Y. Zhai, H. Lin, J. Chen and D. Hu, Bioconcentration and tissue distribution of shorter and longer chain perfluoroalkyl acids (PFAAs) in zebrafish (Danio rerio): Effects of perfluorinated carbon chain length and zebrafish protein content, Environ. Pollut., 2019, 249, 277–285 CrossRef CAS PubMed.
- C. A. Ng and K. Hungerbühler, Bioconcentration of perfluorinated alkyl acids: How important is specific binding?, Environ. Sci. Technol., 2013, 47, 7214–7223 CrossRef CAS PubMed.
- M. Chen, L. Zhu, Q. Wang and G. Shan, Tissue distribution and bioaccumulation of legacy and emerging per-and polyfluoroalkyl substances (PFASs) in edible fishes from Taihu Lake, China, Environ. Pollut., 2021, 268, 115887 CrossRef CAS PubMed.
- M. Chen, L. Qiang, X. Pan, S. Fang, Y. Han and L. Zhu, In vivo and in vitro isomer-specific biotransformation of perfluorooctane sulfonamide in common carp (Cyprinus carpio), Environ. Sci. Technol., 2015, 49, 13817–13824 CrossRef CAS PubMed.
- S. Åkerblom, N. Negm, P. Wu, K. Bishop and L. Ahrens, Variation and accumulation patterns of poly- and perfluoroalkyl substances (PFAS) in European perch (Perca fluviatilis) across a gradient of pristine Swedish lakes, Sci. Total Environ., 2017, 599–600, 1685–1692 CrossRef PubMed.
- S. Fang, X. Chen, S. Zhao, Y. Zhang, W. Jiang, L. Yang and L. Zhu, Trophic magnification and isomer fractionation of perfluoroalkyl substances in the food web of Taihu Lake, China, Environ. Sci. Technol., 2014, 48, 2173–2182 CrossRef CAS PubMed.
- J. Xu, C. S. Guo, Y. Zhang and W. Meng, Bioaccumulation and trophic transfer of perfluorinated compounds in a eutrophic freshwater food web, Environ. Pollut., 2014, 184, 254–261 CrossRef CAS PubMed.
- G. Munoz, H. Budzinski, M. Babut, H. Drouineau, M. Lauzent, K. Le Menach, J. Lobry, J. Selleslagh, C. Simonnet-Laprade and P. Labadie, Evidence for the Trophic Transfer of Perfluoroalkylated Substances in a Temperate Macrotidal Estuary, Environ. Sci. Technol., 2017, 51, 8450–8459 CrossRef CAS PubMed.
- C. Simonnet-Laprade, H. Budzinski, K. Maciejewski, K. Le Menach, R. Santos, F. Alliot, A. Goutte and P. Labadie, Biomagnification of perfluoroalkyl acids (PFAAs) in the food web of an urban river: assessment of the trophic transfer of targeted and unknown precursors and implications, Environ. Sci.: Processes Impacts, 2019, 21, 1864–1874 RSC.
- A. M. Becker, S. Gerstmann and H. Frank, Perfluorooctanoic acid and perfluorooctane sulfonate in two fish species collected from the roter main river, Bayreuth, Germany, Bull. Environ. Contam. Toxicol., 2010, 84, 132–135 CrossRef CAS PubMed.
- K. Spaan, C. van Noordenburg, M. Plassmann, L. Schultes, S. D. Shaw, M. Berger, M. Peter Heide-Jørgensen, A. Rosing-Asvid, S. Granquist, R. Dietz, C. Sonne, F. Rigét, A. Roos and J. Benskin, Fluorine mass balance and suspect screening in marine mammals from the Northern Hemisphere, Environ. Sci. Technol., 2020, 54, 4046–4058 CrossRef CAS PubMed.
- R. Bossi, M. Dam and F. F. Rigét, Perfluorinated alkyl substances (PFAS) in terrestrial environments in Greenland and Faroe Islands, Chemosphere, 2015, 129, 164–169 CrossRef CAS PubMed.
- J. W. Martin, M. M. Smithwick, B. M. Braune, P. F. Hoekstra, D. C. G. Muir and S. A. Mabury, Identification of long-chain perfluorinated acids in biota from the Canadian Arctic, Environ. Sci. Technol., 2004, 38, 373–380 CrossRef CAS PubMed.
- S. Shaw, M. L. Berger, D. Brenner, L. Tao, Q. Wu and K. Kannan, Specific accumulation of perfluorochemicals in harbor seals (Phoca vitulina concolor) from the northwest Atlantic, Chemosphere, 2009, 74, 1037–1043 CrossRef CAS PubMed.
- P. Bohlin-Nizzetto, W. Aas and N. A. Warner, Monitoring of environmental contaminants in air and precipitation. Annual Report 2017, Norwegian institute for air research (NILU), 2018 Search PubMed.
- P. Bohlin-Nizzetto, W. Aas and V. Nikiforov, Monitoring of environmental contaminants in air and precipitation. Annual Report 2018, Norwegian institute for air research (NILU), 2019 Search PubMed.
- P. Bohlin-Nizzetto, W. Aas and V. Nikiforov, Monitoring of environmental contaminants in air and precipitation. Annual Report 2019, Norwegian institute for air research (NILU), 2020 Search PubMed.
- H. Knutsen, T. Mæhlum, K. Haarstad, G. A. Slinde and H. P. H. Arp, Leachate emissions of short-and long-chain per-and polyfluoralkyl substances (PFASs) from various Norwegian landfills, Environ. Sci.: Processes Impacts, 2019, 21, 1970–1979 RSC.
- U. Eriksson, P. Haglund and A. Kärrman, Contribution of precursor compounds to the release of per- and polyfluoroalkyl substances (PFASs) from waste water treatment plants (WWTPs), J. Environ. Sci., 2017, 61, 80–90 CrossRef CAS PubMed.
- C. Gallen, G. Eaglesham, D. Drage, T. H. Nguyen and J. F. Mueller, A mass estimate of perfluoroalkyl substance (PFAS) release from Australian wastewater treatment plants, Chemosphere, 2018, 208, 975–983 CrossRef CAS PubMed.
- K. Borgå, E. Fjeld, A. Kierkegaard and M. S. McLachlan, Consistency in trophic magnification factors of cyclic methyl siloxanes in pelagic freshwater food webs leading to brown trout, Environ. Sci. Technol., 2013, 47, 14394–14402 CrossRef.
- B. C. Kelly, M. G. Ikonomou, J. D. Blair, B. Surridge, D. Hoover, R. Grace and F. A. P. C. Gobas, Perfluoroalkyl contaminants in an arctic marine food web: Trophic magnification and wildlife exposure, Environ. Sci. Technol., 2009, 43, 4037–4043 CrossRef CAS PubMed.
- G. W. Olsen, H. Y. Huang, K. J. Helzlsouer, K. J. Hansen, J. L. Butenhoff and J. H. Mandel, Historical comparison of perfluorooctanesulfonate, perfluorooctanoate, and other fluorochemicals in human Blood, Environ. Health Perspect., 2005, 113, 539–545 CrossRef CAS PubMed.
- X. Trier, K. Granby and J. H. Christensen, Polyfluorinated surfactants (PFS) in paper and board coatings for food packaging, Environ. Sci. Pollut. Res., 2011, 18, 1108–1120 CrossRef CAS PubMed.
- X. Trier, C. Taxvig, A. K. Rosenmai and G. A. Pedersen, PFAS in paper and board for food contact - options for risk management of poly- and perfluorinated substances, Nordic Council of Ministers, 2017, vol. 17 Search PubMed.
- H. Lee and S. A. Mabury, A pilot survey of legacy and current commercial fluorinated chemicals in human sera from United States donors in 2009, Environ. Sci. Technol., 2011, 45, 8067–8074 CrossRef CAS PubMed.
- Norwegian Government, Begrensningsdirektivet - PFOS (Directive 2006/122/EC of the European Parliament and of the Council of 12 December 2006 relating to restrictions om the marketing and use of perfluorooctane sulfonates (amending of Council Directive 76/769/EEC), https://www.regjeringen.no/no/sub/eos-notatbasen/notatene/2006/jan/begrensningsdirektivet---pfos/id2431732/, accessed 7 September 2018).
- D. Herzke, E. Olsson and S. Posner, Perfluoroalkyl and polyfluoroalkyl substances (PFASs) in consumer products in Norway - A pilot study, Chemosphere, 2012, 88, 980–987 CrossRef CAS PubMed.
- Å. Høisæter, A. Pfaff and G. D. Breedveld, Leaching and transport of PFAS from aqueous film-forming foam (AFFF) in the unsaturated soil at a firefighting training facility under cold climatic conditions, J. Contam. Hydrol., 2019, 222, 112–122 CrossRef PubMed.
- W. Zhong, L. Zhang, Y. Cui, M. Chen and L. Zhu, Probing mechanisms for bioaccumulation of perfluoroalkyl acids in carp (Cyprinus carpio): Impacts of protein binding affinities and elimination pathways, Sci. Total Environ., 2019, 647, 992–999 CrossRef CAS PubMed.
- P. Labadie and M. Chevreuil, Partitioning behaviour of perfluorinated alkyl contaminants between water, sediment and fish in the Orge River (nearby Paris, France), Environ. Pollut., 2011, 159, 391–397 CrossRef CAS PubMed.
- M. Filipovic, A. Woldegiorgis, K. Norström, M. Bibi, M. Lindberg and A. H. Österås, Historical usage of aqueous film forming foam: A case study of the widespread distribution of perfluoroalkyl acids from a military airport to groundwater, lakes, soils and fish, Chemosphere, 2015, 129, 39–45 CrossRef CAS PubMed.
- H. A. Lanza, R. S. Cochran, J. F. Mudge, A. D. Olson, B. R. Blackwell, J. D. Maul, C. J. Salice and T. A. Anderson, Temporal monitoring of perfluorooctane sulfonate accumulation in aquatic biota downstream of historical aqueous film forming foam use areas, Environ. Toxicol. Chem., 2017, 36, 2022–2029 CrossRef CAS PubMed.
- A. Kärrman, K. Elgh-Dalgren, C. Lafossas and T. Møskeland, Environmental levels and distribution of structural isomers of perfluoroalkyl acids after aqueous fire-fighting foam (AFFF) contamination, Environ. Chem., 2011, 8, 372–380 CrossRef.
- H. A. Langberg, G. Breedveld, H. M. Grønning, M. Kvennås, B. M. Jenssen and S. E. Hale, Bioaccumulation of fluorotelomer sulfonates and perfluoroalkyl acids in marine organisms living in aqueous film forming foam (AFFF) impacted waters, Environ. Sci. Technol., 2019, 53(18), 10951–10960 CrossRef CAS PubMed.
Footnote |
| † Electronic supplementary information (ESI) available. See DOI: 10.1039/d1em00408e |
| This journal is © The Royal Society of Chemistry 2022 |