
 Open Access Article
 This Open Access Article is licensed under a
 Creative Commons Attribution 3.0 Unported Licence
Local manufacturing of perovskite solar cells, a game-changer for low- and lower-middle income countries?†
Bart
Roose
 *a,
Elizabeth M.
Tennyson
bc,
Getnet
Meheretu
de,
Amare
Kassaw
f,
Seifu A.
Tilahun
g,
Lara
Allen
ac and
Samuel D.
Stranks
*ab
*a,
Elizabeth M.
Tennyson
bc,
Getnet
Meheretu
de,
Amare
Kassaw
f,
Seifu A.
Tilahun
g,
Lara
Allen
ac and
Samuel D.
Stranks
*ab
aDepartment of Chemical Engineering and Biotechnology, University of Cambridge, Philippa Fawcett Drive, Cambridge, CB3 0AS, UK. E-mail: br340@cam.ac.uk; sds65@cam.ac.uk
bDepartment of Physics, Cavendish Laboratory, University of Cambridge, 19 JJ Thomson Avenue, Cambridge, CB3 0HE, UK
cCentre for Global Equality, 8C King's Parade, Cambridge, CB2 1SJ, UK
dBahir Dar Energy Center, Bahir Dar Institute of Technology, Bahir Dar University, Bahir Dar, Ethiopia
eDepartment of Physics, College of Science, Bahir Dar University, Bahir Dar, Ethiopia
fFaculty of Electrical and Computer Engineering, Bahir Dar Institute of Technology, Bahir Dar University, Bahir Dar, Ethiopia
gFaculty of Civil and Water Resources Engineering, Bahir Dar Institute of Technology, Bahir Dar University, Bahir Dar, Ethiopia
First published on 27th July 2022
Abstract
Efforts to combat climate change are largely focused on industrialised countries. However, low- and lower-middle income countries (LLMICs) have rapid population growth and a large potential for economic and industrial development. As a result, demand for energy will soar in LLMICs over the coming decades. Here, we consider how local manufacturing of photovoltaics can be an affordable pathway to a clean, sustainable and reliable energy supply for LLMICs. Local manufacturing could be cheaper, generate jobs and provide a stable local market for natural resources. Perovskite solar cells are particularly promising as they are compatible with low-tech processing techniques, making smaller scale manufacturing capacity economically viable. Our findings suggest local manufacturing is economically competitive to importing silicon modules in up to 71 out of 80 LLMICs analysed. Our Case Study of Ethiopia finds that the technological knowledge, raw materials and legislation required for local manufacturing are all present. A cost reduction of ∼10% compared to GW-scale silicon production is sufficient to make local manufacturing economically viable.
Introduction
Before the Industrial Revolution in what are now termed the developed countries, humanity extracted energy almost exclusively from renewable sources such as biomass, manual labour and working animals. These sources have a poor energy density and are effort- and time-intensive, and thus economic growth was marginal. The rising use of coal as an energy source in the 18th century increased the availability of energy and instigated the Industrial Revolution.1 As a result, populations and economies grew rapidly, and gross national product (GDP) per capita and living standards were raised (Fig. 1a).2,3 During the 20th century, coal was supplemented by other fossil fuels such as oil and gas4 and current energy use is 1300 times larger than at the start of the Industrial Revolution;5–7 ∼85% of this energy is derived from fossil fuels.8 In stark contrast to this is the growth within low- and lower-middle income countries (hereafter LLMICs). While populations have grown, energy consumption (and by proxy GDP per capita) has only started to increase in the last 25 years, especially in low-income countries (LICs, Fig. 1b), in stark contrast to growth in the rest of the world and the G7 (Fig. S1, ESI†) during this period. Even in 2016, the per capita energy consumption in LLMICs was largely on pre-industrial levels, and mainly derived from traditional biomass.5–7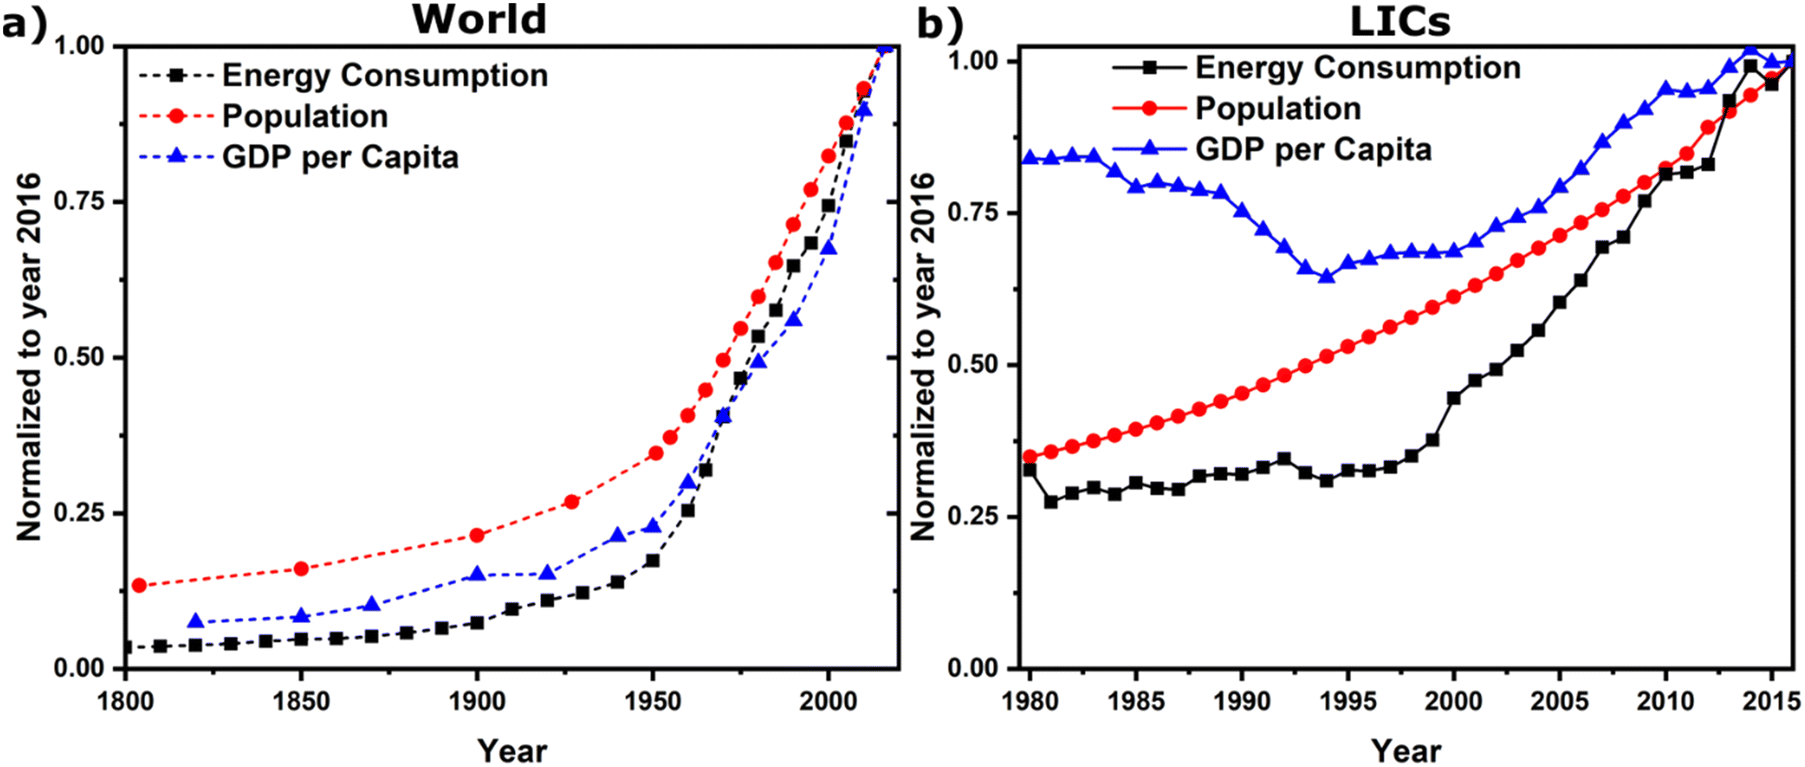 | ||
| Fig. 1 (a) The evolution of global energy consumption, population and GDP per capita for 1800–2016 and (b) in LICs for 1980–2016. Data is normalized to 2016 values and adapted from ref. 2, 3 and 5–7. | ||
From the middle of the 19th century scientific evidence started to indicate that the concentration of carbon dioxide (CO2) in the atmosphere has a profound impact on the climate.9 However, it wasn’t until the 1990s that it was widely accepted that CO2 emitted through burning of fossil fuels was causing rapid climate change, which can have catastrophic effects such as sea level rise and prolonged droughts.10 The Kyoto protocol, which aimed to operationalise the 1992 United Nations Framework Convention on Climate Change, was an early global, coordinated effort to limit emission of CO2 and other greenhouse gases. The Kyoto protocol was adopted in 1997, but did not enter into force until 2005.11 This was followed by the Paris Agreement, drawn up during the 21st session of the Conference of the Parties (COP 21) in 2015, in which 195 countries pledged to further limit CO2 emissions.12 These pledges were further expanded upon in 2021 (COP26 in Glasgow), with the aim of reaching global net zero emissions by 2050, which is crucial in limiting global warming to 1.5 °C.13 An increasing number of signatory countries are also developing Nationally Determined Contributions (NDCs), which are legally binding pledges to reduce greenhouse gas emissions in particular ways.14
Consensus within the scientific community is that climate change is man-made and a significant threat to humanity.12 But how can CO2 emissions into the atmosphere be lowered, or better still, reversed? A first step is to use less energy, for example through better insulation, fuel-efficient and electrified vehicles, more efficient appliances and changing consumption behavior.15 Carbon capture is predicted to play an important role in the future, actively removing CO2 from the atmosphere, but no proposed technology is close to being deployed at scale.16 However, measures to reduce CO2 emissions do not tackle the core of the problem, i.e., as long as fossil fuels are used for energy production, CO2 will be emitted. Alternatives such as geothermal, hydro, wind, and solar power all offer clean and abundant renewable energy. Of these renewable energy sources, solar energy has the biggest potential due to its sheer abundance: every hour the Earth receives solar energy equivalent to the global annual energy demand. By 2050 solar energy is forecasted to be the largest source of energy, accounting for 20% of total energy and 40% of electricity supplied.17,18
Large scale implementation of solar energy has been hampered historically by relatively high production prices and the need for large initial capital investment, both for building production facilities and installation in the field. Many countries are reluctant to make these investments and potentially sacrifice economic prosperity in the effort to reduce CO2 emissions, especially LLMICs, as their contribution to these emissions has so far been relatively small compared to the developed world.19 However, as renewable energy becomes significantly cheaper than fossil fuels, economic pressures will favour low carbon energy sources. In an increasing proportion of the world, solar cells (photovoltaics (PV)) are now cheaper than fossil fuels.20 LLMICs may benefit especially from solar energy as it provides an opportunity to enable rapid economic growth, while maintaining low CO2 emissions. These countries face a task unlike any in human history: increasing prosperity while mitigating environmental impact. However, developing countries can capitalize on their abundant renewable energy resources to design an effective energy transition strategy without having to modify existing and expensive electricity infrastructure.
Opportunities in LLMICs
Currently, the Organisation for Economic Co-operation and Development (OECD) classifies 27 countries as low income and 55 countries as lower-middle income, the majority of these countries are in Africa and South Asia. This classification is based on per capita gross national income (GNI); less than $1045 for LICs and $1045–$4095 for lower-middle income countries (LMICS) in 2020.21 Besides low GNI, LLMICs often have low socio-economic development and are economically vulnerable to external shocks.22 As of 2019, 60% of people living in LICs and 38% of people living in LMICs worked in the agricultural sector, and only 40% of the general population in LICs and 89% in LIMCs had access to electricity.23,24 Per capita energy demand in LLMICs is up to 50 times lower than in developed countries.25 However, with an average economic growth of 4% per year23,24 and an expected population increase from 4 billion today to 4.5 billion in 2030,2 energy demand in LLMICs is anticipated to increase significantly over the next decades. To explore this potential more closely, below we examine in detail the situation of Ethiopia, one of the most populous LICs (see Case Study).As countries have developed historically, they have progressed from traditional biomass to fossil fuels to more advanced energy sources, such as nuclear, hydro, wind and solar energy. It would be an enormous advancement for LLMICs, both economically and environmentally, to leapfrog fossil fuels and move to a low-carbon energy source,26 much like how many of these countries, having limited landline telephone infrastructure, moved directly to mobile phones instead. LLMICs are eager to exploit renewable energy sources, as is evidenced by the collective pledge of the least developed countries (LDCs) to achieve 100% electricity from renewable sources by 2050.27 The LDCs are 46 countries identified by the United Nations based on their socio-economic development and vulnerability to external shocks, of the 46 countries on the list all but one (Tuvalu) are LLMICs. Individual LLMICs, like Ethiopia, have made further individual pledges.14
Fossil fuels are unevenly distributed geographically. For example, less than 2% of proven fossil fuel reserves are located in LDCs and half of the LDCs have no reserves at all, making electricity derived from (imported) fossil fuels relatively expensive.28,29 Solar energy potential on the other hand is evenly distributed around the world and abundant in almost all LLMICs (energy output per area differs only by a factor of 4 between the sunniest and least sunny country in the world).30 Most LLMICs have a higher potential solar power output per module than China (the country with the most total installed PV),31 Germany (most PV per capita)31 and India (cheapest PV, itself a lower middle income country)20 (Fig. 2). Typically, more power generated per module means lower electricity costs. Furthermore, the seasonal dependence of the power output is low in almost all LLMICs, making it a reliable source of energy year-round. This reliability limits the need for costly energy storage and backup power. For rural populations relying on off-grid PV, storage is especially important to provide electricity for lighting at night.32
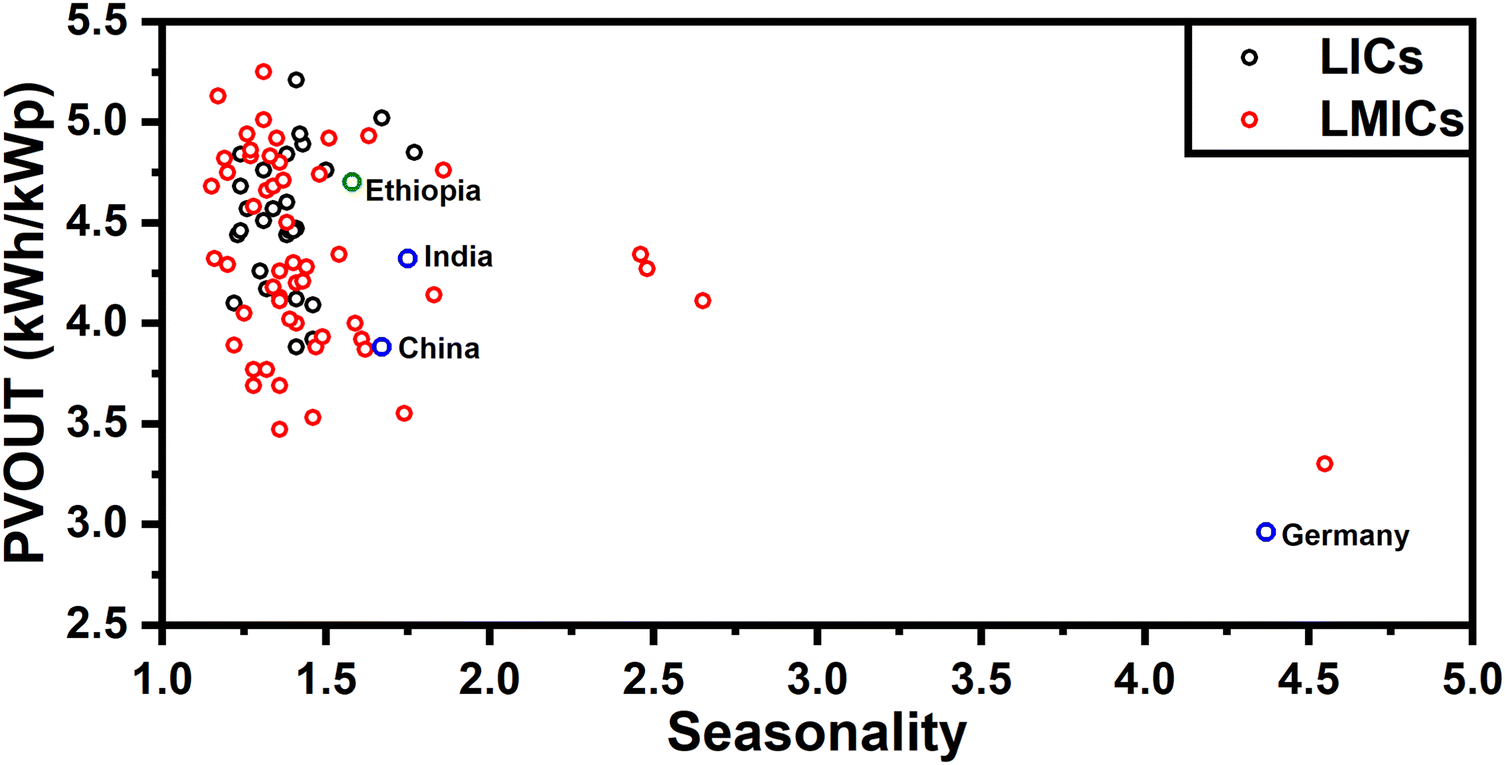 | ||
| Fig. 2 Average practical daily potential power output (PVOUT) and seasonality index (highest monthly PVOUT divided by lowest monthly PVOUT) for LICs (black dots) and LMICs (red dots) compared to China, Germany and India (blue dots), and Ethiopia, the subject of the Case Study (green dot). Data obtained from the “Global Solar Atlas 2.0, a free, web-based application is developed and operated by the company Solargis s.r.o. on behalf of the World Bank Group, utilizing Solargis data, with funding provided by the Energy Sector Management Assistance Program (ESMAP). For additional information: https://globalsolaratlas.info.32 | ||
An advantage of PV is that it is well suited for off-grid power generation that could circumvent the need for a centralised energy infrastructure – infrastructure that would be very costly due to the population distribution in LLMICs. For off-grid application, there would be no need for DC inverters, which can bring the price of PV down. However, the cost of storing electricity is still a big financial hurdle for rural populations in LLMICs and requires further advances.33 Access to electricity has also been demonstrated to have large social and environmental impacts on rural communities, positively impacting health, education of children, and empowering women by helping them to increase their income, social development and health.34,35 PV based systems have also helped increase the productivity of farmers and reduce deforestation.36 Taking these factors into consideration, PV adoption in LLMICs is extremely promising, but will require an alternative adoption approach than developed countries.
Current state of PV adoption
The global PV market has been dominated by silicon-based technologies ever since the first modules became available in the 1950s. However, silicon for PV purposes needs to be extremely pure (>99.9999%), requiring a costly refinement process.37 In addition, expensive materials such as silver and transparent conductive electrodes are used, which has meant that for a long time the cost of energy from PV was significantly more expensive than fossil fuels. Fortunately, due to economies of scale, technological learning in the production supply chain, efficiency improvements and intrinsic material cost reductions, silicon PV now supplies some of the cheapest electricity in history, according to a report by the International Energy Agency.38 Though it must be noted that so far this is only true for large-scale projects with cheap access to capital and exploiting high-quality resources. The solar industry has shown a massive 40% annual growth over the last 10 years, but new innovations are needed to sustain this growth and further reduce costs.39 The electricity network will have to be adapted extensively to accommodate variable renewable energy, and supply reliable power, bringing about additional costs. Recent disruptions to supply chains as a result of the COVID-19 pandemic pose a further challenge, with rising materials, labour and freight costs slowing down implementation.40 The rapid growth of renewable energy is likely to alter the balance of power between states, which could bring about geopolitical decisions that influence the deployment of renewable energy.41 Therefore, clustering PV manufacturing in a few geographical places poses a risk to supply and energy security. Diversifying PV manufacturing geographically will be critical for sustaining deployment rates.The big question for LLMICs is how to exploit PV in a low-cost and targeted fashion. Although solar energy is in abundance, cheap access to capital is an issue,42 and the electricity infrastructure is limited. PV is cheapest when deployed at utility scale, but a well-developed electricity grid with sufficient storage capacity is required to distribute electricity efficiently. In LMICs 89% of the population has access to electricity,24 but in LICs this is only 40%23 and grids are costly to maintain and expand due to low population density and demand.43 Instead, much effort has been dedicated to provide electricity for cooking, heating, lighting and irrigation to rural communities through small-scale solutions. These projects rely heavily on external funding and are still too expensive to be widely adapted by rural communities at cost price.44 However, PV has already shown to be an attractive technology when there is a high return of investment. With the help of PV powered water pumps, farmers can get two or three harvests per year and grow crops in places that were not previously arable.45 It is thus evident that once PV is cost-effective it could revolutionize farming production. One of the most rapidly developing technologies in the PV world is the perovskite solar cell (PSC), which is more versatile than silicon, compatible with low-tech manufacturing processes and can potentially achieve higher efficiencies. Will this help to make low-carbon electricity more widely available in LLMICs?
Perovskite solar cells (PSCs)
Lead halide perovskites possess excellent optoelectronic properties and are relatively easy to process,46 which has allowed PSCs to achieve record efficiencies that are comparable to established silicon technologies within only a decade of their conception.47 The tunability of optoelectronic properties through compositional engineering allows for the fabrication of more efficient multi-junction devices, further bringing down costs. Models predicting the levelised cost of electricity (LCOE) for PSCs (including tandems) vary wildly depending on future efficiency and lifetime, ranging from no difference in price up to a 60% cost reduction compared to silicon.48–50 Although a potential reduction in cost is promising, investors will hesitate to risk investing heavily in an unproven technology, when there is no large advantage over the incumbent technology. Adding to this the fact that import tariffs can make up as much as 40% of retail prices in LLMICs,51 it is unlikely that the cost of PSCs alone will revolutionize the deployment of renewable energy in LLMICs. However, PSCs have another benefit, i.e. their extraordinary ease of processing. PSCs can be processed from solution or vapour using low-tech, high-throughput coating and printing fabrication methods,52 in stark contrast to the high-tech, low-throughput fabrication of silicon. The analysis below will focus on PSCs as they have achieved the highest efficiencies,47 are generally seen as the most disruptive53,54 and are closest to commercialization out of the emerging photovoltaic materials.55 However, several other emerging photovoltaic technologies, such as organic, kesterite and quantum dot solar cells, offer similar advantages in ease of processing, and the analysis below is also largely valid for these technologies. Successful deployment of PSCs could function as a blueprint for the roll-out of other emerging photovoltaic technologies.Local manufacturing
Low-tech processing opens up an interesting possibility for LLMICs: local PV manufacturing. Having a local PV manufacturing industry would have many advantages for LLMICs, such as increasing the competitiveness of the local economy, job generation and reduce vulnerability to external shocks. In addition, local manufacturing would reduce reliance on foreign investment and strengthen national sovereignty and energy security. For silicon, local production has been difficult due to the need for big capital investments to build large manufacturing facilities and the lack of specifically skilled labour required to keep such a facility running.56 Gigawatt (GW)-scale manufacturing is essential for silicon, as module cost decreases significantly with manufacturing capacity as a result of economies of scale.57 A GW-scale PSC factory has been estimated to be 2–3 times cheaper to build than a silicon factory of similar output, requiring a smaller initial capital investment.58–60 Attracting capital is challenging for most LLMICs42 and many rely heavily on official development assistance (ODA) provided by OECD-member governments.21 Private investors avoid risk and prefer to work with administratively efficient host governments that are able to maintain political and economic stability, enforce laws and contracts, but keep interventions into business to a minimum.61GW-scale manufacturing capacity would overshoot demand for solar energy leading up to 2030 in all LICs and 80% of LMICs (Table S2, ESI†). It is therefore important that the cost of local production is significantly lower, to allow smaller scale manufacturing. Local production would reduce manufacturing costs by reducing the amount of money spent on transport and labour. Transport costs depend heavily on the distance between supplier and end-user, both for modules and raw materials, and potential cost reductions are hard to quantify. Labour accounts for an estimated 13% of module cost for a 1 GW manufacturing plant,58 and with the average income being 2.5–40 times lower in LLMICs than in China (the largest producer of silicon modules), an estimated reduction of 8–12% in module cost can be achieved from using local labour.23,24 A further advantage of local energy production would be that import tariffs are avoided, which can make up as much as 40% of retail prices.51 Governments could decide not to impose tariffs on solar panels to aid their rapid implementation, but as import tariffs are an important source of income, this would not necessarily be in a government's interests. In fact, import tariffs are a powerful tool that can be used to protect local industry, and could actually be used by governments to stimulate local production of PSCs.62 Taking these factors into account, our conservative estimates are that local production could lead to a cost reduction between 20% and 40%, as compared to importing modules manufactured in a 1 GW capacity manufacturing facility. For silicon PV, our projections show that a 20% and 40% cost reduction brings the competitive annual manufacturing capacity down from 1 GW to 350 MW and 70 MW, respectively (Fig. 3). These lower capacities would make local production competitive for 30% and 64% of LLMICs, for 20% and 40% cost reduction respectively (Table 1 and Table S2, ESI†). For Ethiopia, for example, with a demand for 285 MW capacity, a cost reduction of 22% is needed to make local production competitive.
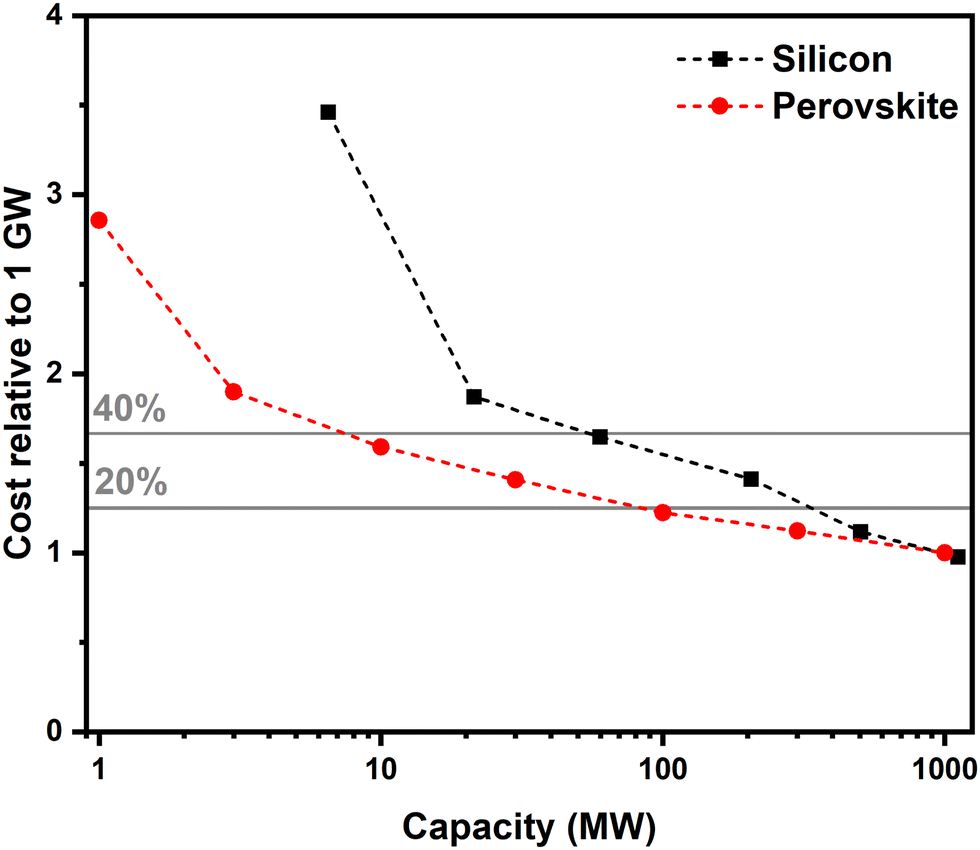 | ||
| Fig. 3 Manufacturing cost of silicon and perovskite solar cells, normalized to 1 GW production capacity, as a function of production capacity. Data has been adapted from ref. 58. Reference lines for 20% and 40% cost reduction are given to illustrate at what production capacity the manufacturing cost would be the same as for 1 GW non-local production capacity. | ||
| Scenario | LLMICs (80 total) | LICs (27 total) | LMICs (53 total) | |||
|---|---|---|---|---|---|---|
| Si PV | PSCs | Si PV | PSCs | Si PV | PSCs | |
| No cost reduction | 11 | 11 | 0 | 0 | 11 | 11 |
| 20% cost reduction | 24 | 47 | 4 | 9 | 20 | 38 |
| 40% cost reduction | 51 | 71 | 12 | 25 | 39 | 46 |
Models show that the cost penalty for reduced production capacity for PSCs is lower than for silicon (Fig. 3).58 For the 20% and 40% cost reduction scenarios, local production of PSCs would be competitive for 90 MW and 7 MW annual manufacturing capacity, respectively, in turn making local production competitive in 59% and 89% LLMICs (Table 1 and Table S2, ESI†). An 11% cost reduction would already be sufficient to make PSC fabrication competitive in Ethiopia. These predictions suggest that local manufacturing is competitive in a larger number of LLMICs and lower cost reduction is required for PSCs than for silicon. The impact is largest for LICs, with local production being competitive for 93% of countries at 40% cost reduction (Table 1). Note that these predictions are purely based on scalability; the potentially lower module cost of PSCs, as predicted by models,48–50 would make local PSC manufacturing even more competitive. These cost reductions could be enhanced further by perovskite tandem solar cells, which promise higher efficiencies with marginal increase of production costs.49
Job generation
Our estimations so far were based on a single manufacturing PSC plant per country, but several smaller plants could still be economically viable (100 MW and 10 MW for 20% and 40% cost reduction, respectively). Smaller plants distributed geographically within a country or region would have the advantage that supply can be increased gradually in response to demand. In addition, more jobs are generated, and local engineering capacity required for repair and maintenance is established, enabling these factories to double as recycling plants.Furthermore, the technological skill level required to run a small-scale PSC factory is less specialized than for silicon. PSC fabrication is compatible with roll-to-roll solution processing, which is often likened to printing newspapers. Increasing engineering skill levels has been identified as an important opportunity for LLMICs to achieve economic and social development.63–65 A number of LLMICs have invested heavily in engineering education,66 but accessible engineering jobs are needed to further develop the sector and prevent a brain-drain.64 PSC fabrication could be a gateway technology to instigate this desired technological leap. Ethiopia, for example, has invested heavily in training engineers, but thousands struggle to find suitable work (see Case Study).67
A hybrid manufacturing strategy has gained traction recently, where silicon wafers are imported, but module assembly takes place locally.68 This approach is less capital intensive, reduces transport costs and import duties and could be an interesting option for LLMICs. Taking this one step further, a perovskite layer could be deposited on top of the silicon wafer during local assembly, resulting in tandem solar cells with increased efficiency at marginal extra costs.49 More detailed studies are necessary to explore further the feasibility of this approach for LLMICs.
Value addition
Another way LLMICs may benefit from local production of PSCs is through value addition. Many LLMICs are rich in minerals soil, and management of natural resources has been highlighted as one of the key pathways to boost economic development and alleviate poverty.69 However, abundance of minerals and natural resources can also be detrimental to development. This phenomenon, often referred to as the ‘resource curse’, is a subject of ongoing debate.70 In any case, because of the volatile global commodities market, generating a steady income from natural resources can be challenging and makes countries vulnerable to external shocks.69 Value addition is an alternative way to increase income by converting ore into more valuable products.71 Not only could this yield a higher value for these raw materials, the resulting revenue stream is also less vulnerable to price fluctuations on the international commodities market. Likewise, import tariffs can be avoided to bring down the price of the end-product for domestic use. The most expensive material costs of PSC modules are the metal frame, transparent conducting oxide coated glass and metal contacts.72 Local sourcing of these components could bring down fabrication costs significantly, and provide a higher value application for raw materials compared to export. For example, Guinea, India and Vietnam have vast aluminium resources. Zambia, Niger, Republic of the Congo, Rwanda, Papua New Guinea, Ghana, Bolivia and Uzbekistan have large precious metal reserves73 and Zambia and Afghanistan have cesium reserves, which finds use in perovskite fabrication.74 In addition, minerals used in the production of glass are some of the most common minerals in the earth's crust and abundant in many countries.75 However, many of these countries currently do not possess the required refining industry to process ore, and whether establishing local refineries at the expected scales is cost-effective will have to be further investigated.Environmental impact
If PSCs are to be widely employed in LLMICs, a significant amount of effort will have to be invested in managing harmful materials (during raw material extraction, fabrication and in the module) and ensuring proper end-of-life measures. If left unchecked, these chemicals could cause significant damage to people and local ecosystems. This section will discuss the environmental challenges for local manufacturing in LLMICs specifically; for a broader perspective of environmental challenges we direct the reader to more detailed life cycle assessments of PSCs found elsewhere.76–79Using local raw materials for the production of PSC modules can have large benefits for LLMICs, but also brings considerably environmental impacts. The mining and refining of tin (used in transparent conducting oxides and electron transporting materials for PSCs) was found to account for more than 50% of environmental factors such as acidification and human toxicity.80,81 Besides regulation waste streams of mining and refining facilities, another option would be to use zinc based materials instead of tin, as zinc mining and refining has a ∼10 times smaller environmental footprint than tin mining and refining.82
Currently, the best PSCs are made using solvents such as N,N-dimethylformamide and chlorobenzene.
Chlorobenzene is predicted to account for 25% of human toxicity in the production of PSC modules, and could account for 30–60% of human toxicity in a PSC manufacturing plant.81,83 As these solvents are harmful to humans, protective measures have to be in place during fabrication to protect workers and prevent solvent release to the environment. Capturing and re-using these solvents has been shown to be more environmentally friendly, but it remains to be seen if this can be done cost-effectively.84 Using non-toxic solvents85 or solvent-free synthesis86 would be another route to solving this problem.
Another potential issue with PSCs is that they contain a water-soluble form of lead, which can leach out if the module is damaged. As lead can pose significant acute and chronic risks to health,87 there is a global call for regulations on the use of lead in products such as petrol and paint.88 The PSC community acknowledged this problem early on and recent developments of lead-scavenging layers coated on the surface of the module have shown promise to mitigate the environmental impact of lead.89 Another option may be lead-free perovskite analogues.90 However, these have not been able to achieve comparable power conversion efficiencies and/or they degrade much faster than their lead-containing counterparts.91 In addition, lead alternatives such as tin or bismuth are not without harm themselves92 and a recent study showed that iodide ions are even more problematic than lead (demonstrated in plants).93 In fact, most LCAs show that lead is not one of the main environmental concerns,80,81 accounting for only 1–5% of toxicity,94,95 and electricity generated from PSCs could reduce lead emissions 2–4 times when compared to fossil fuel derived electricity.76 However, given the attitude of the general public to lead, it is important that lead is dealt with appropriately.
It is often unavoidable to use toxic materials in solar cell technologies (silicon modules use lead-containing solder) and the main focus should therefore be on mitigating any potential exposure. This can be achieved through encapsulation and regulations to guarantee worker and consumer safety, and responsible disposal of toxic waste. Thin film PV made from CdTe absorber layers can be used as an example here, where risks have been managed and controlled successfully for over two decades.96 Health and safety regulations for handling toxic waste (e.g. lead acid battery recycling) have historically been poor in LLMICs.97,98 Without protection for workers or the environment in place, there is a large risk to public health. If PSCs are treated similarly with little to no regulations it would be an enormous health and environmental setback for an already vulnerable demographic. Steps are made in the right direction though,98 such as initiatives by the Ethiopian government to regulate the use of toxic substances (see Case Study).99 A balance might have to be found between the number and geographical spread of local production facilities and the effort to regulate these facilities. It is crucial for LLMICs to take the economics of protective measures into account. The cost to society of injuries, deaths and environmental damage caused by poor protection are much higher than the costs of effective measures and regulations,100 which should be a strong motivation for the governments of these countries to take the necessary steps to protect workers and the environment. Manufacturers must invest in more extensive protective measures, which will inevitably lead to extra costs.101 However, extra costs could be offset by increased productivity by healthier and more satisfied workers.102,103
The biggest risk for release of toxic materials comes at the end-of-life of the module. If the module ends up in landfill, all toxic materials eventually will be released into the environment. This is not a problem exclusive to PSCs, as solder in silicon solar cells contains lead. In addition, the production of terawatt per year quantities of PV is not sustainable for non-circular materials. Therefore, it is important that the module is either refurbished or reused, or its components/raw materials recycled. Studies on silicon modules have shown that reuse is more profitable than component or raw material recycling.104 LLMICs could profit from reuse by buying up less efficient, but cheaper, refurbished modules and using them until they fail. However, this would only shift the recycling challenge geographically and cannot be the final solution. A program could be set up where broken modules are sold and shipped abroad for recycling, or component/material extraction facilities would have to be constructed in LLMICs. However, profit margins on recycled materials are small105 as recycled materials are expected to flood the international market,104 so, with a lack of incentives, modules may still end up in landfill. However, for PSCs it may be profitable and technologically feasible for self-contained cycles to be set up in local markets. Ensuring end-of-life modules still have economic value would be a big step towards preventing them from ending up in landfill.
Module replacement has been suggested as a cost reducing route to implementation for emerging technologies.106 This would be most valuable when non-module costs (such as inverters, switches, support racks and wiring) dominate the system cost, as is expected for PSCs. Continued technological improvement is critical for realizing replacement benefits, which is realistic for PSCs considering they are a relatively novel technology, perovskite tandem solar cells for example are still far from reaching their practical limit.106 Recycling of PSCs are simplified by exploiting the solubility of the active material. Studies have shown that it is possible to revive a degraded PSC by washing away and recovering the active materials, followed by purification and re-deposition.107,108 Recovering organic solvents used during the recycling process is crucial,78 which can reduce environmental impacts by 56 to 68%.109 Much work remains to be done to make these processes industrially viable and PSCs will have to be designed specifically with the aim of making revival possible. The comparatively low-tech processing of PSCs could make small-scale local recycling factories a viable option, further generating jobs and boosting local economies.
Outlook
LLMICs will need cheap and stable (both in a geopolitical and technological sense) energy sources to accommodate rapid economic development for their fast-growing populations. PV is set to play a significant role in providing LLMICs with abundant, reliable, renewable and clean energy, due to the high yield and low seasonal variability of solar energy in these countries. Silicon solar cells currently dominate the PV market and a rapid reduction in costs has made PV more affordable, even in LLMICs when a rapid return of investment can be achieved. PSCs promise to simplify PV manufacturing, allowing for further adoption in LLMICs, with the main benefit being the possibility of local production. For silicon this is more challenging due to the economies of scale required to achieve a competitive cost, large capital investments and the need for highly specialized labour. PSCs can be made affordable in LLMICs at much smaller scales, close to where the modules will be used. This will impact LLMICs directly according to three key development indicators: (i) average gross national income per capita – widespread access to a reliable source of energy will facilitate an increase in production; (ii) human assets – PSCs require a skill level that connects well with existing programs in LLMICs to train qualified engineers, and so PSCs could act as a gateway technology to boost engineering experience and branch out to other sectors; (iii) economic vulnerability – through value addition the economy of LLMICs can be diversified, making them less reliable on the export of commodities. It is thus evident that PSCs have the potential to have a positive impact on the lives of people in LLMICs. However, pressing toxicity issues in both the fabrication process and the end-product will need to be addressed to protect already vulnerable human and ecological communities. Recycling of modules and materials will be critical to minimize costs and maximize sustainability. Compatibility with cradle-to-cradle approaches should not be an afterthought, but an upfront focus of the PSC field.Ethiopia case study
Ethiopia saw a steady increase in population during the last century, increasing from ∼19 million in 1950 to ∼115 million in 2020, and is forecasted to exceed 200 million by 2050.2 GDP per capita started to increase around the year 1995, simultaneously with energy becoming more readily available (Fig. 4a). Nevertheless, 75% of the rural population, which accounts for 80% of the total population, does not have access to electricity, and traditional biomass accounts for 90% of final energy consumption.2,110 The annual per capita energy use (<1 MW h) is amongst the lowest in the world.5 Yet, the Ethiopian government has expressed ambitions to become a middle income country within 20–30 years. It is evident that this will require extensive industrialization, which in turn demands an abundant and reliable supply of energy. As Ethiopia is not an oil producing country, it will need to look to other sources of energy to reach these ambitious goals.111 The implementation of renewable energy sources offers a viable solution to Ethiopia's energy question. Ethiopia's ambitions are illustrated by the country's national energy policy,112 its Nationally Determined Contributions to the Paris Agreement to reduce emissions with 68.8% by 2030,113 and the backing of a joint LDC initiative to generate all electricity from renewable sources by 2050.27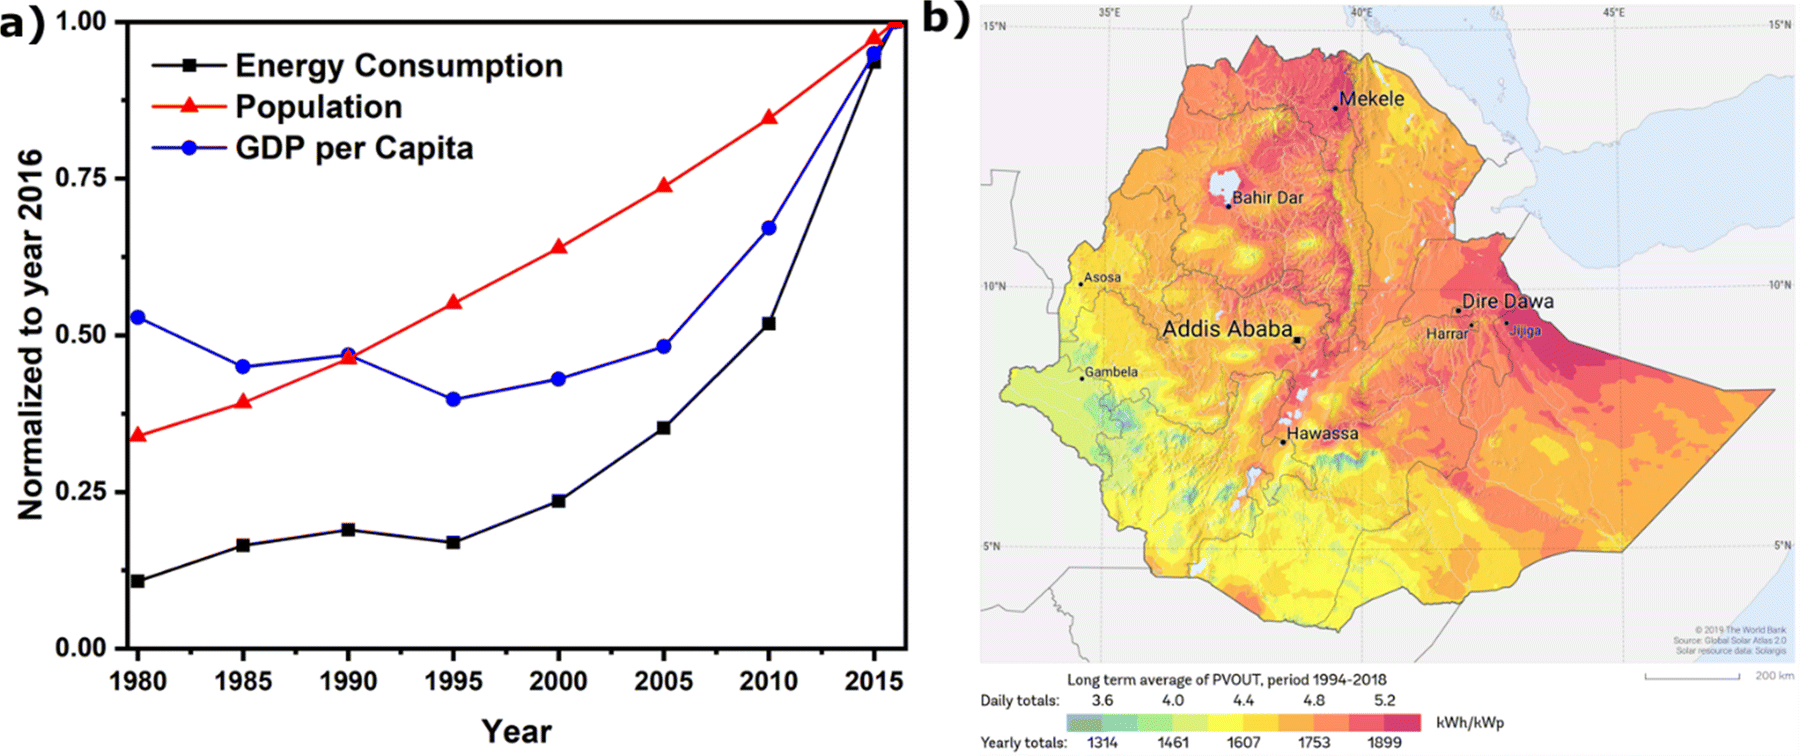 | ||
| Fig. 4 (a) The evolution of energy consumption, population and GDP per capita in Ethiopia for 1980–2016. Data is normalized to 2016 values and adapted from ref. 2, 3 and 5. (b) Long term average PVOUT for Ethiopia, 98% of the country exceeds 4.0 kW h kWp−1, adapted from ref. 32. | ||
Ethiopia has large potential for hydropower, wind and solar energy. Hydropower is currently the main renewable energy source in Ethiopia, harnessing the energy of the many rivers that originate in the Ethiopian highlands. Hydropower also plays an important role in the future energy plans of the Ethiopian government, accounting for more than 50% of the increased generating capacity of renewable energy by 2030, with the completion of the Grand Ethiopian Renaissance Dam.114–116 However, overreliance on a single source of power carries a high risk,110 and a diversified power mix, including storage,117 will be key to achieving reliable electricity.
Solar power is most abundant in the dry season, but, with a seasonality index of 1.58 (country range 1.26–2.18), it is a reliable source of energy all year round. In addition, the photovoltaic power output exceeds 4.0 kW h kWp−1 for 98% of the country (average 4.695 kW h kWp−1), making it an economically viable source of energy for almost the entire country (Fig. 4b).32 The total annual solar energy reserve is estimated to be 2![[thin space (1/6-em)]](https://www.rsc.org/images/entities/char_2009.gif) 000000 TW h.118 Harvesting just 0.005% of this energy would be enough to satisfy fully all electricity demands: (∼7 TW h, note however that today electricity accounts for <10% of total energy consumption, but is expected to be 45% by 2040).5,32,114 With only 0.02 TW h of solar energy generated in 2019,32 it is clear that there is enormous potential for growth of the PV sector. It is estimated 18 TW h will be generated annually by PV in 2040 based on existing policy frameworks and announced policy intentions. A more ambitious number of 41 TW h was estimated for a more progressive energy policy.114 This growth will be achieved largely by improving access to electricity.110,114,119,120 However, progress on off-grid technologies is much slower, which is widely attributed to barriers imposed by import taxes and bureaucracy.119 This threatens to disadvantage disproportionally the inhabitants of rural areas, in particular women, who are usually responsible for household energy provision when the main fuel is biomass. A study among rural women in Ethiopia's Tigray region showed that access to solar power positively impacted income, social development and health.35 Access to electricity in rural areas can thus play an important role in achieving Ethiopia's goal of becoming a middle income country.
000000 TW h.118 Harvesting just 0.005% of this energy would be enough to satisfy fully all electricity demands: (∼7 TW h, note however that today electricity accounts for <10% of total energy consumption, but is expected to be 45% by 2040).5,32,114 With only 0.02 TW h of solar energy generated in 2019,32 it is clear that there is enormous potential for growth of the PV sector. It is estimated 18 TW h will be generated annually by PV in 2040 based on existing policy frameworks and announced policy intentions. A more ambitious number of 41 TW h was estimated for a more progressive energy policy.114 This growth will be achieved largely by improving access to electricity.110,114,119,120 However, progress on off-grid technologies is much slower, which is widely attributed to barriers imposed by import taxes and bureaucracy.119 This threatens to disadvantage disproportionally the inhabitants of rural areas, in particular women, who are usually responsible for household energy provision when the main fuel is biomass. A study among rural women in Ethiopia's Tigray region showed that access to solar power positively impacted income, social development and health.35 Access to electricity in rural areas can thus play an important role in achieving Ethiopia's goal of becoming a middle income country.
The main bottleneck for wide-scale implementation of off-grid solar power is the high costs and bureaucracy associated with importing solar modules.119 A solution to this problem could be local production. As silicon plants need large capital investment and highly specialized labour, local production is considered unviable. However, for alternative technologies, such as PSCs, local production may be cost effective and technologically feasible. Our analysis shows that a cost reduction of ∼11% would make local PSC manufacturing competitive with GW-scale silicon manufacturing (Fig. 3). To establish whether this is also technically feasible for PSCs, we studied the labour requirements for both the 18 and 41 TW h scenarios, where either 20% or 100% of newly installed capacity comes from PSCs (Table S3, ESI†). The largest number of engineers required for these scenarios is ∼10000, which is less than the total number of unemployed engineers (Table S3, ESI†). This means that enough qualified personnel would be available in the years leading up to 2030 to satisfy the demand from the PSC sector fully, even for the most labour-intensive scenario. Job generation may be a strong argument for multiple small plants instead of larger scale facilities. Considering silicon is already an established technology, the 20% scenario is more likely than the 100% scenario. Our analysis shows both 10 MW and 100 MW plants are feasible options based on available labour and population distribution. Policy makers would have to consider whether to prioritise cost, or whether also to factor in considerations relating to regional development.
Ethiopia possesses a range of raw materials that could be used for value addition. Ethiopia has reserves of iron (68.4 million metric tonnes), nickel (17 million metric tonnes) and manganese (0.2 million metric tonnes), which could be used to fabricate stainless steel metal frames. Furthermore, silica sand (3.4 million metric tonnes) and feldspar (500 thousand metric tonnes) can be used to fabricate glass panels, and gold (>200 metric tonnes)121 for metal contacts (cheaper metals, such as silver and copper, have also been found, but exact quantities are unknown).122 Taking this mineral wealth into account, the 10 years development plan published in 2020 recognizes mining as an important focus area, alongside energy and manufacturing. Refining minerals requires large amounts of energy, having access to cheap solar energy could make local refining more viable. There is thus much potential for synergy between the mining sector and PSC fabrication.123 Although ore processing infrastructure in Ethiopia is currently limited, with the presence of a sheet glass factory124 and the first iron ore processing plant scheduled to be operational by 2024,125 the first steps towards local production are being made.
Another important factor in determining the suitability of local PSC fabrication is effective legislation and control of the toxic materials used in fabricating PSCs (such as lead and solvents). This to protect both factory workers during fabrication and consumers when using the PSCs. Worker protection is beneficial for society as a whole,100 but the effect on manufacturing costs depends on an interplay between the costs of safety measures and increased productivity as a result of more motivated workers and less time lost due to health conditions. A survey among Ethiopian manufacturing industry workers revealed that a large majority believed their productivity would be increased by better safety regulations.126 An analysis of livestock markets in Ethiopia's Somali region found a cost-benefit ratio of 1.5 for sanitary regulations compliance costs.127 In 2018 the Ethiopian government published a proclamation recognizing the importance of hazardous material management. The aim is to create a system that controls the generation, storage, treatment, recycling and reuse, transportation, disposal and movement of hazardous material, to prevent harm to human and animal health and the environment.99 If PSC plants follow the rules set out in the proclamation, enforced by regular inspections, exposure of workers to toxic materials would be kept to a minimum during the production and usage stages. Another challenge occurs, however, when the panel needs maintenance or reaches its end of life. To prevent toxic materials from ending up in landfill, an extensive repair and recycling network will have to be set up, with the advantage of creating more high quality jobs. As it has been shown that PSCs can be revived by replacing the light absorbing material,107 end of life modules will still hold significant value for recycling and people could be persuaded to return their modules for financial compensation.
To summarize, local PSC fabrication is promising in Ethiopia as there is enough demand for energy, skilled labour and a sufficient amount of large population centres to facilitate PSC plants. A number of useful minerals are present, and first steps are being taken to process ore locally. Lastly, appropriate legislation is already in place to deal with toxic materials.
Author contributions
Bart Roose: conceptualization, methodology, formal analysis, investigation, writing – original draft. Elizabeth M. Tennyson: conceptualization, writing – original draft. Getnet Meheretu: resources, writing – review & editing. Amare Kassaw: writing – review & editing. Seifu A. Tilahun: writing – review & editing. Lara Allen: conceptualization, writing – review & editing. Samuel D. Stranks: conceptualization, writing – original draft, supervision.Conflicts of interest
S. D. S. is a Co-Founder and Lead Scientific Advisor of Swift Solar.Acknowledgements
The authors acknowledge the Engineering and Physical Sciences Research Council (EPSRC, Grant Numbers EP/T02030X/1 and EP/R023980/1). S. D. S. acknowledges the Royal Society and Tata Group (grant no. UF150033). E. M. T. thanks the European Union’s Horizon 2020 research and innovation programme under the Marie Skłodowska-Curie grant agreement no. 841265. For the purpose of open access, the author has applied a Creative Commons Attribution (CC BY) licence to any Author Accepted Manuscript version arising from this submission.References
- E. A. Wrigley, Philos. Trans. R. Soc., A, 2013, 371, 20110568 CrossRef CAS PubMed.
- United Nations, Department of Economic and Social Affairs, World Population Prospects.
- J. Bolt and J. L. Van Zanden, Maddison Project Database, version 2020.
- C. Zou, Q. Zhao, G. Zhang and B. Xiong, Nat. Gas Ind., 2016, 3, 1–11 Search PubMed.
- https://ourworldindata.org/energy .
- V. Smil, Energy Transitions: Global and National Perspectives, 2017 Search PubMed.
- BP Statistical Review of World Energy, 2019.
- International Energy Agency, World Energy Statistics and Balances.
- J. Tyndall, Philos. Trans. R. Soc. London, 1861, 151, 1–36 CrossRef.
- D. Albritton, B. Bolin, B. Callander, K. Denman, R. Dickinson, L. Gates, H. Grassl, M. Grubb, N. Harris, J. Houghton, P. Jonas, A. Kattenberg, K. Maskell, G. McBean, M. McFarland, G. Meira, J. Melillo, N. Nicholls, L. Ogallo, M. Oppenheimer, M. Prather, B. Santer, D. Schimel, K. Shine, K. Trenberth, R. Warrick, R. Watson and J. Zillman, Climate Change – Technical Summary, 1995.
- https://unfccc.int/kyoto_protocol .
- https://unfccc.int/process-and-meetings/the-paris-agreement/the-paris-agreement .
- https://ukcop26.org/cop26-goals/ .
- https://www4.unfccc.int/sites/ndcstaging/Pages/Home.aspx .
- E. G. Hertwich, S. Ali, L. Ciacci, T. Fishman, N. Heeren, E. Masanet, F. N. Asghari, E. Olivetti, S. Pauliuk, Q. Tu and P. Wolfram, Environ. Res. Lett., 2019, 14, 043004 CrossRef CAS.
- https://www.ipcc.ch/sr15/chapter/chapter-2/ .
- P. Moriarty and D. Honnery, Renew. Sustain. Energy Rev., 2012, 16, 244–252 CrossRef.
- https://www.iea.org/reports/net-zero-by-2050 .
- P. Friedlingstein, M. W. Jones, M. O’Sullivan, R. M. Andrew, D. C. E. Bakker, J. Hauck, C. Le Quéré, G. P. Peters, W. Peters, J. Pongratz, S. Sitch, J. G. Canadell, P. Ciais, R. B. Jackson, S. R. Alin, P. Anthoni, N. R. Bates, M. Becker, N. Bellouin, L. Bopp, T. T. T. Chau, F. Chevallier, L. P. Chini, M. Cronin, K. I. Currie, B. Decharme, L. Djeutchouang, X. Dou, W. Evans, R. A. Feely, L. Feng, T. Gasser, D. Gilfillan, T. Gkritzalis, G. Grassi, L. Gregor, N. Gruber, Ö. Gürses, I. Harris, R. A. Houghton, G. C. Hurtt, Y. Iida, T. Ilyina, I. T. Luijkx, A. K. Jain, S. D. Jones, E. Kato, D. Kennedy, K. Klein Goldewijk, J. Knauer, J. I. Korsbakken, A. Körtzinger, P. Landschützer, S. K. Lauvset, N. Lefèvre, S. Lienert, J. Liu, G. Marland, P. C. McGuire, J. R. Melton, D. R. Munro, J. E. M. S. Nabel, S.-I. Nakaoka, Y. Niwa, T. Ono, D. Pierrot, B. Poulter, G. Rehder, L. Resplandy, E. Robertson, C. Rödenbeck, T. M. Rosan, J. Schwinger, C. Schwingshackl, R. Séférian, A. J. Sutton, C. Sweeney, T. Tanhua, P. P. Tans, H. Tian, B. Tilbrook, F. Tubiello, G. van der Werf, N. Vuichard, C. Wada, R. Wanninkhof, A. Watson, D. Willis, A. J. Wiltshire, W. Yuan, C. Yue, X. Yue, S. Zaehle and J. Zeng, Earth Syst Sci Data Discuss, 2021, 1–191 Search PubMed.
- International Renewable Energy Agency, Renewable Power Generation Costs in 2018, 2019.
- https://www.oecd.org/dac/financing-sustainable-development/development-finance-standards/DAC-List-of-ODA-Recipients-for-reporting-2022-23-flows.pdf .
- https://www.un.org/ohrlls/content/ldc-category .
- https://data.worldbank.org/income-level/low-income .
- https://data.worldbank.org/income-level/lower-middle-income .
- UNCTAD, The Least Developed Countries Report 2017: Transformational Energy Access.
- B. Batinge, J. K. Musango and A. C. Brent, South Afr. J. Ind. Eng., 2017, 28(4), 32–49 Search PubMed.
- LDC Climate Change.
- World Energy Council, World Energy Resources, 2016.
- CIA, The World Factbook.
- https://unctad.org/system/files/official-document/ldcr2017_ch3_en.pdf .
- International Renewable Energy Agency, Renewable Capacity Statistics, 2020.
- ESMAP, Global Photovoltaic Power Potential By Country, World Bank, Washington DC, 2020.
- S. Mandelli, J. Barbieri, R. Mereu and E. Colombo, Renew. Sustain. Energy Rev., 2016, 58, 1621–1646 CrossRef.
- UNCTAD Current Studies on Science, Technology and Innovation, Renewable Energy Technologies for Rural Development.
- G. Gebregiorgis, Int. J. Sociol. Anthropol., 2015, 7, 8–20 CrossRef.
- P. Schmitter, K. Kibret, N. Lefore and J. Barron, Appl. Geogr., 2018, 94, 41–57 CrossRef.
- A. Louwen, W. van Sark, R. Schropp and A. Faaij, Sol. Energy Mater. Sol. Cells, 2016, 147, 295–314 CrossRef CAS.
- International Energy Agency, World Energy Outlook 2020.
- J. J. Berry, J. van de Lagemaat, M. M. Al-Jassim, S. Kurtz, Y. Yan and K. Zhu, ACS Energy Lett., 2017, 2, 2540–2544 CrossRef CAS.
- H. Zhang, J. Yan, Q. Yu, M. Obersteiner, W. Li, J. Chen, Q. Zhang, M. Jiang, F. Wallin, X. Song, J. Wu, X. Wang and R. Shibasaki, Appl. Energy, 2021, 283, 116341 CrossRef CAS.
- IRENA, A New World: The Geopolitics of the Energy Transformation.
- G. Hurley and T. Voituriez, Financing the SDGs in the Least Developed Countries (LDCs), 2016.
- https://www.un.org/ldcportal/energy-access-and-main-challenges-in-the-ldcs/ .
- IRENA/ADFD, Advancing Renewables in Developing Countries.
- J. Rowlatt, What the heroin industry can teach us about solar power, https://www.bbc.co.uk/news/science-environment-53450688.
- H. J. Snaith, J. Phys. Chem. Lett., 2013, 4, 3623–3630 CrossRef CAS.
- https://www.nrel.gov/pv/cell-efficiency.html.
- Z. Song, C. L. McElvany, A. B. Phillips, I. Celik, P. W. Krantz, S. C. Watthage, G. K. Liyanage, D. Apul and M. J. Heben, Energy Environ. Sci., 2017, 10, 1297–1305 RSC.
- Z. Li, Y. Zhao, X. Wang, Y. Sun, Z. Zhao, Y. Li, H. Zhou and Q. Chen, Joule, 2018, 2, 1559–1572 CrossRef CAS.
- S. E. Sofia, H. Wang, A. Bruno, J. L. Cruz-Campa, T. Buonassisi and I. M. Peters, Sustain. Energy Fuels, 2020, 4, 852–862 RSC.
- GOGLA, Industry Opinion on VAT and Import Duty Settings for Off-Grid Lighting Products and Solar Home Systems, 2015.
- Y. Chen, L. Zhang, Y. Zhang, H. Gao and H. Yan, RSC Adv., 2018, 8, 10489–10508 RSC.
- J. Kalkman, A. Merhaba, S. Bose and H. Bradley, Emerging technologies in Solar PV: identifying and cultivating potential winners.
- M. Giannouli, Int. J. Photoenergy, 2021, 2021, 6692858 CrossRef.
- T. D. Siegler, A. Dawson, P. Lobaccaro, D. Ung, M. E. Beck, G. Nilsen and L. L. Tinker, ACS Energy Lett., 2022, 7, 1728–1734 CrossRef CAS.
- M. G. Gebreslassie, Renew. Energy, 2021, 168, 107–118 CrossRef.
- First Solar, 2009 Annual Report.
- I. Mathews, S. Sofia, E. Ma, J. Jean, H. S. Laine, S. C. Siah, T. Buonassisi and I. M. Peters, Joule, 2020, 4, 822–839 CrossRef.
- https://investor.firstsolar.com/news/press-release-details/2021/First-Solar-to-Invest-680m-in-Expanding-American-Solar-Manufacturing-Capacity-by-3.3-GW/default.aspx .
- https://investor.firstsolar.com/news/press-release-details/2019/First-Solar-Becomes-Largest-PV-Module-Manufacturer-in-the-Western-Hemisphere/default.aspx .
- R. Lamech and K. Saeed, What International Investors Look For When Investing In Developing Countries: Results from a Survey of International Investors in the Power Sector, The World Bank, 2013.
- https://penpoin.com/import-tariff/ .
- M. E. Abu-Goukh, G. M. Ibraheem and H. M. E. A. Goukh, 6th Int. Forum Eng. Educ. IFEE 2012, 2013, 102, 421–431 Search PubMed.
- C. S. JHA, Eur. J. Eng. Educ., 1989, 14, 113–119 CrossRef.
- K. P. Acharya and S. Pathak, Front. Res. Metr. Anal, 2019, 4 DOI:10.3389/frma.2019.00003.
- Centre for Economics and Business Research Ltd, Engineering and economic growth: a global view.
- J. Y. Yizengaw, IDS Bull.
- https://www.assemblymag.com/articles/95805-shining-a-new-light-on-solar-module-assembly .
- Managing Natural Resource Wealth Trust Fund/International Monetary Fund, Assisting Resource Rich Countries Mobilise and Manage Their Revenues, 2016.
- M. L. Ross, Annu. Rev. Polit. Sci., 2015, 18, 239–259 CrossRef.
- https://extractiveshub.org/topic/view/id/18/chapterId/518 .
- L. Qiu, S. He, L. K. Ono, S. Liu and Y. Qi, ACS Energy Lett., 2019, 4, 2147–2167 CrossRef CAS.
- Natural Resources and Pro-Poor Growth: The Economics and Politics, DAC Guidelines and Reference Series, OECD Publishing, Paris, OECD, 2009 Search PubMed.
- W. C. Butterman, W. E. Brooks and R. G. Reese, Mineral Commodity Profiles Cesium.
- United States Geological Survey, Mineral Commodity Summaries 2020.
- P. Billen, E. Leccisi, S. Dastidar, S. Li, L. Lobaton, S. Spatari, A. T. Fafarman, V. M. Fthenakis and J. B. Baxter, Energy, 2019, 166, 1089–1096 CrossRef CAS.
- J. M. Kadro and A. Hagfeldt, Joule, 2017, 1, 29–46 CrossRef.
- X. Tian, S. D. Stranks and F. You, Nat. Sustain., 2021, 4, 821–829 CrossRef.
- J. Zhang, N. Chang, C. Fagerholm, M. Qiu, L. Shuai, R. Egan and C. Yuan, Renew. Sustain. Energy Rev., 2022, 158, 112146 CrossRef CAS.
- I. Celik, Z. Song, A. J. Cimaroli, Y. Yan, M. J. Heben and D. Apul, Life Cycle Environ. Ecol. Impact Anal. Sol. Technol., 2016, 156, 157–169 CAS.
- J. Gong, S. B. Darling and F. You, Energy Environ. Sci., 2015, 8, 1953–1968 RSC.
- E. M. Harper, G. Kavlak, L. Burmeister, M. J. Eckelman, S. Erbis, V. Sebastian Espinoza, P. Nuss and T. E. Graedel, J. Ind. Ecol., 2015, 19, 628–644 CrossRef.
- J.-A. Alberola-Borràs, R. Vidal and I. Mora-Seró, Sustain. Energy Fuels, 2018, 2, 1600–1609 RSC.
- R. Vidal, J.-A. Alberola-Borràs, S. N. Habisreutinger, J.-L. Gimeno-Molina, D. T. Moore, T. H. Schloemer, I. Mora-Seró, J. J. Berry and J. M. Luther, Nat. Sustain., 2021, 4, 277–285 CrossRef.
- N. K. Noel, S. N. Habisreutinger, B. Wenger, M. T. Klug, M. T. Hörantner, M. B. Johnston, R. J. Nicholas, D. T. Moore and H. J. Snaith, Energy Env. Sci., 2017, 10, 145–152 RSC.
- Y.-H. Chiang, M. Anaya and S. D. Stranks, ACS Energy Lett., 2020, 5, 2498–2504 CrossRef CAS PubMed.
- A. Babayigit, A. Ethirajan, M. Muller and B. Conings, Nat. Mater., 2016, 15, 247–251 CrossRef CAS PubMed.
- https://www.who.int/news-room/q-a-detail/chemical-safety-lead-and-lead-paint .
- S. Chen, Y. Deng, H. Gu, S. Xu, S. Wang, Z. Yu, V. Blum and J. Huang, Nat. Energy, 2020, 5, 1003–1011 CrossRef.
- N. K. Noel, S. D. Stranks, A. Abate, C. Wehrenfennig, S. Guarnera, A.-A. Haghighirad, A. Sadhanala, G. E. Eperon, S. K. Pathak, M. B. Johnston, A. Petrozza, L. M. Herz and H. J. Snaith, Energy Env. Sci., 2014, 7, 3061–3068 RSC.
- V. Pecunia, L. G. Occhipinti, A. Chakraborty, Y. Pan and Y. Peng, APL Mater., 2020, 8, 100901 CrossRef CAS.
- G. Schileo and G. Grancini, J. Mater. Chem. C, 2021, 9, 67–76 RSC.
- E. M. Hutter, R. Sangster, C. Testerink, B. Ehrler and C. M. M. Gommers, ArXiv201206219 Cond-Matmtrl-Sci.
- J. Zhang, X. Gao, Y. Deng, B. Li and C. Yuan, ChemSusChem, 2015, 8, 3882–3891 CrossRef CAS PubMed.
- N. Espinosa, L. Serrano-Luján, A. Urbina and F. C. Krebs, Sol. Energy Mater. Sol. Cells, 2015, 137, 303–310 CrossRef CAS.
- V. Fthenakis and K. Zweibel, Natl. Cent. Photovolt. Sol. Program Rev. Meet.
- Pure Earth and Green Cross Switzerland, The World's Worst Pollution Problems 2016: The Toxics Beneath Our Feet.
- N. Ferronato and V. Torretta, Int. J. Environ. Res. Public Health, 2019, 16, 1060 CrossRef CAS PubMed.
- Fed. Negarit Gaz., 2018, 58, 10439–10464.
- L. Rosenstock, M. R. Cullen and M. Fingerhut, J. Occup. Environ. Med., 2005, 47, 132–136 CrossRef PubMed.
- L. Li, ILR Rev, 2022, 75, 117–138 CrossRef.
- A. S. Katz, N. P. Pronk, D. McLellan, J. Dennerlein and J. N. Katz, Am. J. Prev. Med., 2019, 57, 487–494 CrossRef PubMed.
- R. Robertson, H. Di, D. Brown and R. Dehejia, Working Conditions, Work Outcomes, and Policy in Asian Developing Countries, 2016.
- M. Tao, V. Fthenakis, B. Ebin, B.-M. Steenari, E. Butler, P. Sinha, R. Corkish, K. Wambach and E. S. Simon, Prog. Photovolt. Res. Appl., 2020, 28, 1077–1088 CrossRef CAS.
- R. Deng, N. L. Chang, Z. Ouyang and C. M. Chong, Renew. Sustain. Energy Rev., 2019, 109, 532–550 CrossRef CAS.
- J. Jean, M. Woodhouse and V. Bulović, Joule, 2019, 3, 2824–2841 CrossRef.
- K. P. Goetz, A. D. Taylor, Y. J. Hofstetter and Y. Vaynzof, ACS Appl. Mater. Interfaces, 2021, 13, 1–17 CrossRef CAS PubMed.
- A. Binek, M. L. Petrus, N. Huber, H. Bristow, Y. Hu, T. Bein and P. Docampo, ACS Appl. Mater. Interfaces, 2016, 8, 12881–12886 CrossRef CAS PubMed.
- G. Rodriguez-Garcia, E. Aydin, S. De Wolf, B. Carlson, J. Kellar and I. Celik, ACS Sustain. Chem. Eng., 2021, 9, 15239–15248 CrossRef CAS.
- A. D. Hailu and D. K. Kumsa, AIMS Energy, 2021, 9, 1–14 CAS.
- Embassy of Japan in Ethiopia, Study on the Energy Sector in Ethiopia, 2008.
- Ethiopia national energy policy (draft), Ministry of water and Energy, Addis Ababa, 2012.
- Federal Democratic Republic of Ethiopia, Updated Nationally Determined Contribution, 2021.
- https://www.iea.org/articles/ethiopia-energy-outlook .
- https://www.theafricareport.com/85672/is-a-war-between-egypt-and-ethiopia-brewing-on-the-nile/ .
- S. Sterl, D. Fadly, S. Liersch, H. Koch and W. Thiery, Nat. Energy, 2021, 6, 407–418 CrossRef.
- F. J. de Sisternes, H. Worley, S. Mueller and T. Jenkin, J. Sustain. Res., 2020, 2, e200002 Search PubMed.
- K. Y. Kebede, T. Mitsufuji and M. T. Islam, 5th Sustain. Future Hum. Secur. SustaiN 2014, 2015, 28, 11–20 Search PubMed.
- A climate for solar power: Solutions for Ethiopia's energy poverty, Climate & Development Knowledge Network, 2017.
- M. Otoo, N. Lefore, P. Schmitter, J. Barron and G. Gebregziabher, Business Model Scenarios and Suitability: Smallholder Solar Pump-based Irrigation in Ethiopia, IWMI, 2018.
- Ministry of Mines and Petroleum, Mining in Ethiopia Investor Guide.
- https://www.altus-strategies.com/news/new-copper-and-gold-exploration-licence-granted-in-ethiopia/ .
- Ethiopia 2030: The Pathway to Prosperity, National Planning and Development Comission.
- https://addisfortune.net/articles/juniper-glass-industries-to-open-factory-in-debra-birhan-at-50m/ .
- https://ethiopianbusinessreview.net/ethiopia-nears-first/ .
- K. Jilcha Sileyew, Saf. Sci., 2020, 132, 104989 CrossRef.
- A. Nin Pratt, P. Bonnet, M. A. Jabbar and C. de Haan, Benefits and costs of complianceof sanitary regulations in livestockmarkets: The case of Rift Valley feverin the Somali Region of Ethiopia, International Livestock Research Institute, 2005 Search PubMed.
Footnote |
| † Electronic supplementary information (ESI) available. See DOI: https://doi.org/10.1039/d2ee01343f |
| This journal is © The Royal Society of Chemistry 2022 |