 Open Access Article
Creative Commons Attribution 3.0 Unported Licence
A comparative analysis of the efficiency, timing, and permanence of CO2 removal pathways†
Solene
Chiquier
 ab,
Piera
Patrizio
ab,
Mai
Bui
ab,
Piera
Patrizio
ab,
Mai
Bui
 ab,
Nixon
Sunny
ab and
Niall
Mac Dowell
*ab
aCentre for Environmental Policy, Imperial College London, UK. E-mail: niall@imperial.ac.uk; Tel: +44 (0)20 7594 9298
bCentre for Process Systems Engineering, Imperial College London, UK
First published on 14th September 2022
Abstract
Carbon dioxide removal (CDR) is essential to deliver the climate objectives of the Paris Agreement. Whilst several CDR pathways have been identified, they vary significantly in terms of CO2 removal efficiency, elapsed time between their deployment and effective CO2 removal, and CO2 removal permanence. All these criteria are critical for the commercial-scale deployment of CDR. In this study, we evaluate a set of archetypal CDR pathways—including afforestation/reforestation (AR), bioenergy with carbon capture and storage (BECCS), biochar, direct air capture of CO2 with storage (DACCS) and enhanced weathering (EW)—through this lens. We present a series of thought experiments, considering different climates and forest types for AR, land types, e.g. impacting biomass yield and (direct and indirect) land use change, and biomass types for BECCS and biochar, capture processes for DACCS, and rock types for EW. Results show that AR can be highly efficient in delivering CDR, up to 95–99% under optimal conditions. However, regional bio-geophysical factors, such as the near-term relatively slow and limited forest growth in cold climates, or the long-term exposure to natural disturbances, e.g. wildfires in warm and dry climates, substantially reduces the overall CO2 removal efficiency of AR. Conversely, BECCS delivers immediate and permanent CDR, but its CO2 removal efficiency can be significantly impacted by any initial carbon debt associated with (direct and indirect) land use change, and thereby significantly delayed. Biochar achieves low CDR efficiency, in the range of 20–39% when it is first integrated with the soil, and that regardless of the biomass feedstock considered. Moreover, its CO2 removal efficiency can decrease to −3 to 5% with time, owing to the decay of biochar. Finally, as for BECCS, DACCS and EW deliver permanent CO2 removal, but their CO2 removal efficiencies are substantially characterized by the energy system within which they are deployed, in the range of −5 to 90% and 17–92%, respectively, if currently deployed. However, the CDR efficiency of EW can increase to 51–92% with time, owing to the carbonation rate of EW.
Broader contextFollowing COP26, carbon dioxide removal (CDR) is increasingly being recognised by national governments and the climate community as an integral part of 2050 net zero strategies. Owing to a combination of inherent characteristics and regional variations, e.g. climates, biomass yields, local energy systems, each CDR pathway is characterized by a distinctive CO2 removal efficiency, timing—required for any pathway to effectively remove the CO2 from the atmosphere, and permanence. With growing public and private efforts directed towards CDR, the competition for natural and financial resources in crucial activities, such as food production, energy supply and emission mitigation, will inevitably increase. As a result, CDR options will inevitably be scrutinized for their potential to deliver sufficient, permanent and timely CO2 removal. To this end, this study presents a comparative analysis of each CDR pathway in terms of their potential climate change mitigation benefits and identifies options that can provide a meaningful contribution towards net-zero carbon emission targets. The findings of this work could potentially guide the strategy for CDR deployment globally. |
1. Introduction
The Paris Agreement aims at keeping global warming to well-below 2 °C and pursuing efforts to limit it to 1.5 °C.1 Owing to the relationship between cumulative anthropogenic CO2 emissions and the increase in global mean temperature,2–4 achieving these climate change mitigation goals requires that global net CO2 emissions be reduced to zero at some point.5–7Since the close of COP26, many national and international governments, including the United Kingdom (UK), the European Union (EU), Japan, and South Korea, have committed to legally-binding 2050 net-zero targets, while others, such as China and India, are set to do so by the second half of this century.8,9
Achieving these goals entails the rapid decarbonization of the energy systems, combined with the scale up of carbon dioxide removal (CDR) technologies to offset residual emissions from hard-to-abate sectors, such as aviation and agriculture. Whilst the role of CDR has been extensively discussed by the international community, explicit CDR targets remain absent from all newly or re-submitted Nationally Determined Contributions (NDCs), with some exceptions related to the agriculture, and the land use, land-use change and forestry (LULUCF) sectors.10,11
Crucially, the reliance on CDR is expected to increase over time, as (a) most governments are not on track with their 2030 and/or long-term NDCs,12 and (b) existing NDCs are insufficient to achieve most recent net zero commitments.8,13 Thus, it will be vital to deploy CDR as efficiently as possible—maximizing CO2 removal with the minimum use of resources. To do so, careful consideration of the time required for CO2 removal to be impactful, i.e., the time lapse between the deployment of any CDR pathway and its effective CO2 removal, and of the time over which it will remain impactful, i.e., permanence, is necessary. Importantly, CO2 removal must be clearly, comprehensively and consistently defined and assessed, as first suggested by Tanzer and Ramirez,14 and further emphasized by Terlouw et al.15
There is a vast range of CDR pathways that can be categorised by Earth system (e.g., land or ocean), storage medium (e.g., geological formations, minerals, vegetation, soils and sediments, or even buildings), but also by removal process (e.g., land-based biological, ocean-based biological, geochemical or chemical). The most prominent are (1) bioenergy with carbon capture and storage (BECCS), (2) direct air capture of CO2 from ambient air by engineered chemical reaction (DACCS), (3) afforestation/reforestation (AR) to fix atmospheric carbon in biomass and soils, (4) enhanced weathering of minerals (EW), and (5) converting biomass to biochar.16,17 Ocean-based biological CDR pathways, e.g. blue carbon or ocean fertilisation, have also received some attention, but their CDR potential remain uncertain or even controversial.16,18 Finally, alternative CDR pathways have also started to be proposed, e.g. CO2 mineralisation or biochar in the cement industry,19–21 with some being at demonstration or even commercialization stage.22,23 However, their technical feasibility and regional/global scale-up potential are still scarcely assessed.24,25 Overall, these pathways all have the potential to generate net negative CO2 emissions, but differ significantly in terms of CO2 removal efficiency, timing, and permanence. In this study, these characteristics are defined as follows:
• CO2 removal efficiency: the fraction of CO2 captured that is permanently removed from the atmosphere, once the GHG emissions arising along the supply chain have been accounted for;
• Timing: the period of time from the deployment of a CDR pathway, e.g. tree planting, or mineral spreading, to its effective CO2 removal impact; and
• Permanence: the potential for CO2 removal to be sustained for a sufficient period of time to deliver climate repair.
Owing to differences across these key characteristics, the CO2 removal potential of different archetypal CDR pathways varies with location and evolves with time. For each archetypal CDR pathway, the CO2 removal potential also varies with the configuration deployed. For example, the CO2 removal potential associated with EW is contingent on the type and particle size of minerals that are applied to soil (i.e., configuration-specific), in addition to other characteristics including soil pH and temperature (i.e., region-specific).26–28 The CO2 removal potential of biochar depends on the biomass feedstock considered, pyrolysis conditions and soil characteristics.29 Finally, Fajardy et al.30 shows that (direct and indirect) land use change, i.e. (I)LUC, can significantly impact the CO2 removal efficiency and time to removal of BECCS.
Timing is particularly crucial in the climate repair impact of different CDR pathways. For instance, in the case of AR, forest sinks require a certain period of time to be established and then saturate within a period of decades to centuries. In the case of EW, the time required for mineral carbonation to proceed to completion can range from a few months to many years, or even decades.31,32 However, quantitative comparisons of the timing of CO2 removal for a comprehensive range of CDR pathways remain a lacuna in the literature.
Permanence has been increasingly discussed in the literature. Herzog et al.33 originally defined an economic framework for valuing temporary sinks and quantified the economic consequences on carbon price and discount rate. More recently, Bednar et al.34 proposed intertemporal instruments to provide the basis for widely applied carbon taxes and emission trading systems to finance a net-negative carbon economy. However, permanence is, overall, considered in isolation, i.e., without making the connection to CO2 removal efficiency or timing. Yet, because (a) CO2 uptakes can be immediate, e.g. for DACCS, or initially slow, e.g. forest growth for AR or carbonation process for EW, (b) CO2 sinks can saturate, e.g. AR, and (c) predictable/unpredictable CO2 releases can occur, e.g. decay process for biochar or natural disturbances for AR, the CO2 removal efficiency of all CDR pathways is inherently intertwined with their timing and permanence.
Moreover, in the IPCC6,35,36 and other carbon accounting frameworks,37,38 there is a convention of equating CO2 removal with a duration greater than 100 years as being permanent. However, from a physical science perspective, CO2 persists in the atmosphere for much longer—on the order of tens of thousands of years.39,40 Thus, removing CO2 over one century is not equivalent to permanent CO2 removal.
Whilst temporary CO2 removal can have some climate repair value when deployed as a mechanism to ‘buy time’ before deploying permanent CO2 removal41—arguably, temporary CO2 removal can limit climate damage by delaying, reducing, and flattening CO2 levels, and temperature overshoots40—this is invariably gambling on the future. If peak warming has occurred by the time of reversal of the temporary CO2 sink, then the temporary CO2 removal has had a positive impact on climate change. However, if peak warming has not yet occurred, or if temperatures have not sufficiently reduced, then the temporary CO2 removal could well have a negative impact, overall increasing the risk of reducing and/or delaying climate change mitigation. Thus, for temporary CO2 removal to be of equivalent climate repair value to permanent CO2 removal, it requires continuous maintenance of that CO2 sink, or subsequent replacement by permanent CO2 removal. This could well be difficult to ensure in practice.
Finally, in any commercial-scale deployment of CDR, there will be a normal commercial imperative to recoup the associated investment as soon as possible. Whilst this is, in principle, feasible with BECCS and DACCS, the same is not true for many alternative CDR pathways, e.g. AR, biochar or EW. There is an important need to (a) understand and make the distinction between the cost of CO2 stored and the cost of CO2 permanently removed, and (b) appropriately value the climate repair benefits of the different CDR pathways, i.e. permanent vs. temporary, and immediate vs. delayed. As the service that should be remunerated is the permanent removal of CO2 from the atmosphere,14,15 it is difficult to imagine ex ante payments where the period between deploying the CDR pathway, e.g. exposing a carbonatable material to the atmosphere for EW, and its impactful removal of CO2, is significant. If nothing else, the monitoring, reporting and verification (MRV) costs associated with understanding the marginal degree of carbonation in any given year could be significant, and possibly prohibitive.
The remainder of this paper is structured as follows. In Section 2, we identify the main sources of CO2 leakage across the CDR value chain of a non-exhaustive set of CDR pathways—AR, BECCS, biochar, DACCS and EW—, and we compare their CDR efficiencies over 100 years. In Section 3, we assess the time required for each CDR pathway to provide CO2 removal beyond the Paris Agreement's 2100 timeframe, i.e. over 1000 years. Finally, we conclude in Section 4.
2. Life cycle CO2 removal efficiency
In this section, we perform a comparative analysis of the CO2 removal efficiency of a non-exhaustive set of CDR pathways,‡ and discuss their key challenges. The aim of this analysis is to provide important insights to policymakers, potential investors, technology developers and purchasers, on the key factors that influence the CO2 removal efficiency of different archetypal CDR pathways. Note that, whilst the key factors that influence the CO2 removal efficiency of each of these CDR pathways are identified here, the amount of associated CO2 emissions is highly region-specific (i.e., climates, bio-geophysical factors, carbon intensity of the energy systems), and configuration-specific (i.e., configurations of the different archetypal CDR pathways deployed). Results should therefore be interpreted as such. Also note that climate change is expected to modify the CO2 removal efficiency of the different archetypal CDR pathways presented here, by disrupting all the systems (e.g., environmental, energy, economic or social) on which our society depends. However, given (1) the urgency to deploy CDR immediately to future scales that will be consistent with the Paris Agreement, and (2) the complexity of climate models, and the difficulty to predict comprehensively and accurately the impacts of climate change on these systems, and subsequently on the CO2 removal efficiency of CDR pathways over time, climate change is, here, not accounted for, although recommended for further research.Here, we define CDR efficiency, ηCDR, considering the amounts of CO2 stored and CO2 leaked over the supply chain via:
 | (1) |
2.1. Afforestation/reforestation (AR)
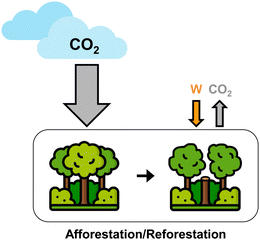
Afforestation/reforestation (AR) (see Fig. 1) can generate net negative CO2 emissions, as growing forests remove CO2 from the atmosphere via photosynthesis and store it in living biomass, dead organic matter, and soils.42,43 Additional CO2 emissions also arise from forestry activities associated with the establishment and the ongoing management of forests. As such, only when the net balance of CO2 emissions by forests is negative—and remains so over time—do forests contribute to mitigating climate change by acting as a CO2 sink.The first challenge with AR is the inherently slow and limited growth of forests. The CO2 sequestration rate of forests increases very slowly initially as the forests are in their establishment phase. Within less than a century, the sequestration rate decreases to zero once the forests finally reach maturity—the CO2 sink of forests is essentially saturated (see SM.2, ESI†). Consequently, the overall CO2 removal potential of AR is inherently constrained by land availability, and extensive land-use competition could be expected with other land-based CDR pathways44,45 and other sectors, e.g. food and bio-fuels.
Forests are also subject to a wide range of anthropogenic disturbances, e.g. harvest or deforestation, and natural disturbances, e.g. wildfires, pests, droughts or windstorms.46–49 Natural disturbances pose the greatest challenge to AR owing their scale and inherent unpredictability.50 Importantly, they are highly climate- and region-specific, and their frequency will increase with climate change.16 In this study, the risk of wildfires is accounted for, used as a proxy for any natural disturbances, and reduces AR's CO2 removal efficiency over time. This is further detailed in SM.2 (ESI†). Note that, recognising the broader range of disturbances of which AR, but also other CDR pathways, are subject to and that are not explicitly evaluated here, a more comprehensive analysis could well be extended to consider other risks, e.g. geo-political.
As shown in Fig. 2, the permanence, and thus efficiency, of CDR delivered by AR, illustrated here for the UK,§ is a strong function of time.41 Importantly, the CO2 removal efficiency of AR is negligibly impacted by forestry activities, even over 1000 years or more. At most, results show that the CO2 emissions associated with the forest establishment reduce the CDR efficiency of AR by 13% if we consider only the first decade. This is because the CO2 sequestration potential of AR is still very low at this stage. Then, over several decades to a millennium, the CO2 emissions associated with forest management activities reduce the CDR efficiency of AR by only 1–3%. Importantly, whilst AR is highly efficient at removing CO2 from the atmosphere—peaking at 99%—it still takes between 50–100 years to reach its maximum CO2 removal potential, which coincides with the saturation of the forest CO2 sink. Forward planning is therefore necessary, as well as sustained management to prevent CO2 from being returned to atmosphere.
 | ||
| Fig. 2 Sankey diagrams showing the CO2 removal efficiency of AR, deployed in 2020, over different periods of time in the UK. | ||
Ultimately, the key factor that reduces the CO2 removal efficiency of AR is the increasing risk of natural CO2 reversal over time—up to 35% over a millennial time period in the UK (see Fig. 2). When the risk of wildfires starts reducing AR's CO2 removal efficiency, and by how much, differ from a climate to another. It is directly related to the probability and severity of wildfires. This is further discussed in Section 3.
Overall, the CO2 removal efficiency of AR, although very high, is only temporary, due to the increasing risk of (natural and anthropogenic) disturbances over the long term. Given the negligible impact of forestry operations on CO2 removal efficiency over time, intensifying the management of forests, as well as monitoring the CO2 sink will contribute to reduce some risks, e.g. wildfires. However, not all natural disturbances can be anticipated and may well be completely unpredictable, e.g. pests or disease. Nor can they be entirely controllable and of minimum impact on the CO2 sink of forests.
This introduces the challenge of managing temporary CO2 sinks, such as with AR, in the long term. If their management in the future is ultimately deemed unfeasible or unnecessary, e.g. investors find it unlikely to be economically and financially viable, or future climate policy focuses primarily on adaptation as opposed to mitigation, this might translate into an effective subsidy for pollution in the near term. Thus, this is essentially a restatement of the “moral hazard” concern, which can only be addressed with rigorous standards for climate repair via CDR, such that the CDR deployed fully compensates for the damage done by the initial emission of CO2 to the atmosphere, and that over timescales consistent with stabilising the Earth's carbon cycle.
2.2. Bioenergy with carbon capture and storage (BECCS)
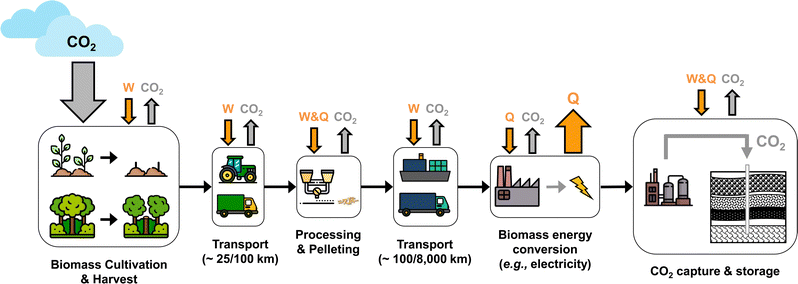
Bioenergy with carbon capture and storage (BECCS) (see Fig. 3) refers to the combination biomass-based energy, with the capture and geological storage of associated CO2 emissions. Upstream CO2 emissions including (I)LUC, biomass cultivation, harvest, processing, and transport, and downstream CO2 emissions associated with the capture, transport and storage of CO2, can be a challenge with BECCS and must be carefully accounted for.Importantly, depending on the BECCS conversion pathway, the percentage of biogenic carbon that is captured and sequestrated can vary significantly.51 This obviously directly impacts CO2 removal efficiency. For example, the conversion of biomass to biofuels via fermentation or gasification processes split the bio-carbon into two portions; process carbon that is available for capture and storage, and product carbon that is ultimately emitted to atmosphere. Biofuels pathways are limited to capture rates of approximately 66–71% in the case of FT biodiesel and bioethanol, respectively,52,53 whereas electricity or hydrogen BECCS pathways typically capture up to 90–95% of the bio-carbon.54–56 Note that algae could also be considered as an alternative biomass feedstock, both for biofuel or electricity BECCS (the latter referred as ABECCS in the literature57). Thus, when considering the optimal use of biomass, one needs to carefully consider which is more important, carbon removal or energy service, with recent work by Fajardy et al.58 implying that the carbon removal service is ultimately most valuable. Hereafter, in this study, we assume BECCS to be a bioelectricity pathway.
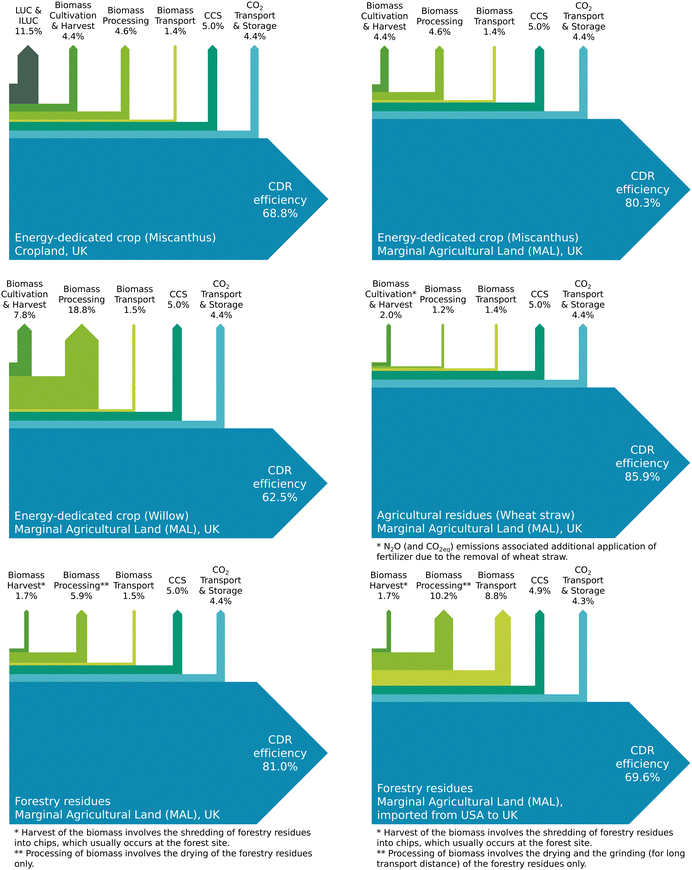
As shown in Fig. 4, the CO2 removal efficiency of BECCS over a 100 year time period ranges between 62.5–86% and varies with the type of land, i.e. (I)LUC, and biomass feedstock considered for bioenergy production, as well as the configuration of the biomass supply chain, i.e. transport distances and mode (road and sea). Usually, upstream activities are responsible for the largest share of CO2 emissions.
The CO2 emissions associated with biomass cultivation and processing reduced CO2 removal efficiency by 3–27%. Owing to the variation in moisture content at harvest and energy required for drying, ligno-cellulosic biomass accounts for a significantly greater release of CO2 than of herbaceous biomass.
Thus, the carbon removal efficiency of BECCS pathways can vary substantially as a function of the biomass source and the impact of (I)LUC, with CDR efficiencies in the approximate range of 69–85%.
2.3. Biochar
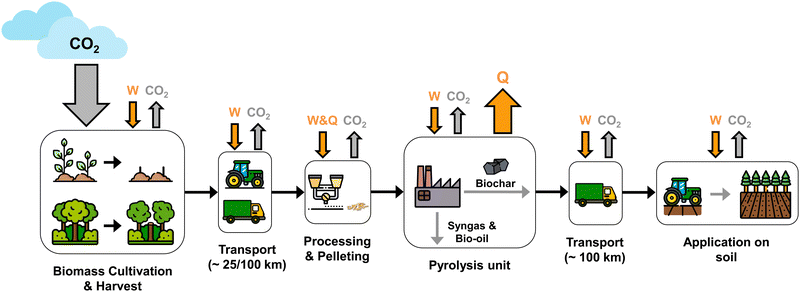
Biochar (Fig. 5) is a recalcitrant, carbon rich material produced via pyrolysis. Once applied on soil, the biochar acts as a soil-amendment additive, with the soil acting as a CO2 sink, thus generating negative CO2 emissions. During the pyrolysis, approximately half of bio-carbon is retained to the solid biochar, while the remaining bio-carbon is emitted as volatile and gaseous organic compounds, i.e. bio-oil and syngas, during pyrolysis.59However, over time, much of the carbon content of the biochar is returned to the atmosphere, with decay rates ranging from a few decades to several centuries.29,59–61 Woolf et al.29 suggested that between 54–84% of the carbon content of biochar is stable over a time period of 100 years, but only 6–35% over 1000 years. The biochar decay rate is a function of both its composition, i.e. the molar hydrogen to organic carbon ratio H/Corg of biochar,29,61,62 and soil characteristics, i.e. soil temperature.29,60 This is discussed further in SM.4 (ESI†). In the UK, the average soil temperature is approximately 11 °C, thereby the permanence of biochar equals to 70% over 100 years and is reduced to 12% over 1000 years.
Finally, the yield of biochar, bio-oil and syngas vary as a function of the pyrolysis process employed. The choice of pyrolysis process also leads to different biochar properties, and thus, different biochar decay rates.29,59 For the purposes of this study, we assume that the process is optimized for higher biochar production, i.e. slow pyrolysis at 350/450 °C (see SM.4, ESI†).
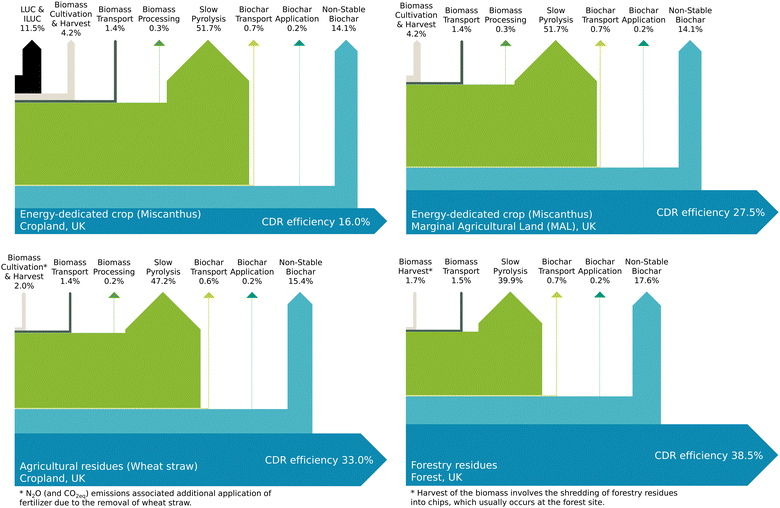
Fig. 6 shows the CO2 removal efficiency of biochar for different types of biomass and land in the UK, deployed in 2020, and over a 100 year time period. The key factor that reduces the CDR efficiency of biochar is the pyrolysis yield, i.e. the mass of biochar produced per unit of dry mass of biomass used as a feedstock. Biochar yield is approximately 40% for slow-pyrolysis.63 Combined with biochar C content ranging between 57–75%,64 this results in approximately 50% of the CO2 being sequestrated in the biochar.
The CO2 emissions associated with the release of labile carbon contained in the biochar also reduce its CO2 removal efficiency by a further 14–18%, based on the UK scenario over 100 years.
Finally, similarly to BECCS, (I)LUC can significantly reduce biochar CDR efficiency by 11.5%, as shown by the Sankey (Fig. 6) for biochar produced from energy-dedicated crops cultivated on existing cropland. Thus, the overall carbon removal efficiency of biochar is observed to be in the range of 16–38% on a centennial timescale, and reduced further to −3 to 5% over a millennium.
2.4. Direct air capture of CO2 with storage (DACCS)
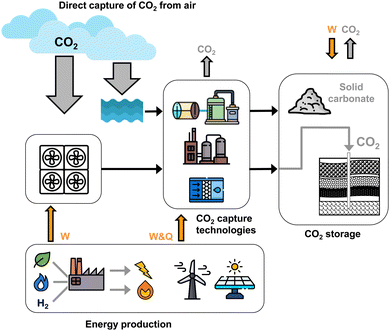
Direct air capture of CO2 with storage (DACCS) refers to technologies that directly separate CO2 from the atmosphere and geologically sequester it, thus generating negative emissions (see Fig. 7).A key challenge with DACCS is the processing of large volumes of diluted CO2 in ambient air, resulting in high energy requirements.65 In particular, due to the large air flows, DACCS requires a significant amount of electricity to run the fans and pumps, as well as the CO2 compression and transportation.66 Thermal energy of various qualities is also required for DAC technologies that involve sorbent regeneration.67,68 Whilst not capturing CO2 from directly from the air, emerging approaches such as seawater mineralisation processes significantly smaller volumes—water contains 150 times more CO2 than air per unit volume—and produces a solid carbonate, thus, avoiding the need for CO2 compression & storage. As carbon depleted seawater is understood to equilibrate with the atmosphere within one year, this can be considered a promising form of indirect air capture.
As shown in Fig. 8, the CDR efficiency of DACCS over a 100 year time period, when assuming its immediate deployment, i.e. the carbon intensity of the current (2020) UK energy system, ranges between 52–80%. It is a function of the electricity and thermal energy requirements, which differ with each type of DAC technology (see SM.5, ESI†). Liquid solvent and solid sorbent DACCS use a combination of heat and electricity, where the use of this energy reduces DACCS's CDR efficiency by 16–19%. The seawater mineralisation DACCS only uses electricity for the electrochemical mineralisation process, which reduces the CDR efficiency of DACCS by 45%. Overall, the decarbonisation of the energy sector will play a significant role in improving the climate repair value of DACCS over the century. Importantly, in the UK, the CO2 leakages associated with the use of energy is within similar range for both liquid solvent and solid sorbent DACCS archetypes. However, the former relies on high-grade heat, so far provided with natural gas, whereas the later relies on low-grade heat only, which can be entirely provided with electricity. Considering the complexity of international geo-political relations, when and if possible, energetic independence should also be taken into consideration.
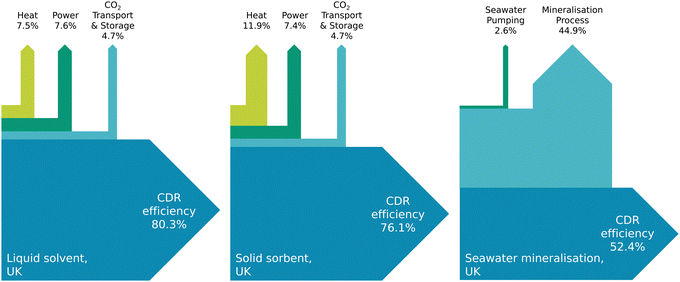 | ||
| Fig. 8 Sankey diagrams showing the CO2 removal efficiency of different DACCS technologies in the UK. Current energy carbon intensities, i.e. electricity and natural gas are considered. Over 100 years, it is assumed that 0.005% of CO2 has leaked from geological CO2 reservoirs.7,57 | ||
2.5. Enhanced weathering (EW)
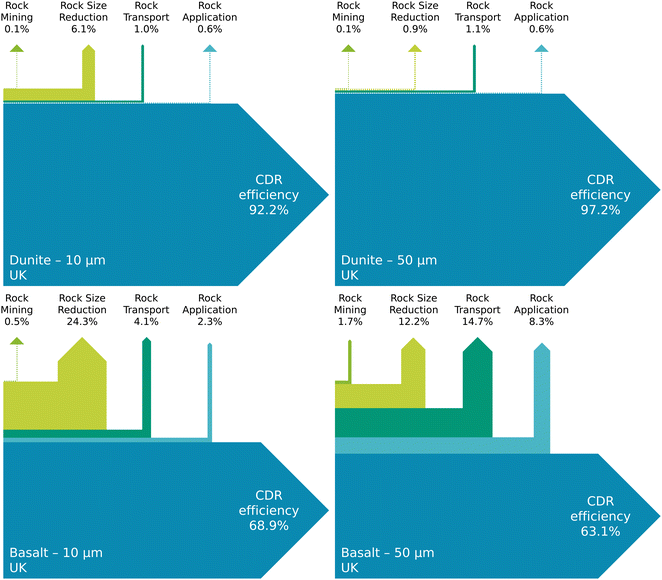
Enhanced weathering (EW) accelerates the natural process of mineral carbonation (see Fig. 9). However, the carbonation process that sequestrates CO2 into the rocks is not immediate, with carbonation rates ranging from a few months to a few decades.26,27,69,70 In this study, we assume that between 21–100% of the rocks used have been weathered in the UK over a 100 year-period, depending on the rock type (basalt or dunite) and particle size in the range of 10 or 50 μm. The carbonation rate of EW is a function of a combination of mineral composition, particle size, and soil temperature and pH. This is discussed further in SM.6 (ESI†).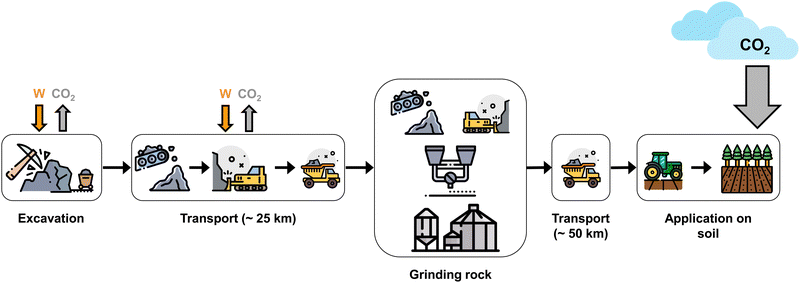 | ||
| Fig. 9 Value chain of enhanced weathering (EW). Rocks are transported over short distances via road (i.e., 100 km) before being applied on soil. | ||
The supply chain is also a key challenge with EW, with CO2 emissions resulting from the excavation of rocks from mineral formations, rock grinding, transport, and the application to the land. Moreover, owing to the limited sequestration potential per unit mass of rock—maximum CO2 sequestration potentials of basalt and dunite rocks are ∼0.2 and ∼0.9 t CO2 per t rock, respectively – very large amount of carbonatable material are required. Consequently, the overall CO2 removal potential of EW is inherently constrained by rock availability and extraction potential.
As illustrated in Fig. 10, the CO2 removal efficiency of EW can decrease by up to 24% owing to carbon leakage during the process of crushing and grinding the rocks. However, as the energy requirements for rock size reduction and the carbonation rate are both a function of the rock type (different mineral compositions) and targeted particle size, there is, in fact, a trade-off between increased CO2 emissions associated with targeting smaller particle sizes and the increased carbonation rate. For a rock size of 10 μm, 77% of the basalt and 100% of the dunite are weathered in the UK over 100 years. If particle size increases to 50 μm, only 21% of basalt and 91% of dunite are weathered over 100 years. Therefore, smaller rock size reaches maximum CO2 sequestration potential faster, thereby increasing CDR efficiency of EW. Conversely, targeting a smaller particle size requires more energy and results in more CO2 emissions, thus reducing EW's CDR efficiency. Producing rock particles of 10 μm consumes about 180 kW h per t rock,26,71 whereas producing 50 μm particles only consumes 25 kW h per t rock. For basalt rocks, results show that smaller 10 μm particles are more efficient than 50 μm (69% versus 63%). In contrast, for dunite rocks, 10 μm particles are less efficient than 50 μm (92% versus 97%), owing to the higher maximum CO2 sequestration potential achieved with dunite rocks.
Finally, whilst it is also possible to use alkaline industrial waste as a feedstock for carbonation processes, it will important to consider potential health and environmental hazards posed by the distribution of this material on the land, e.g. toxicity.72,73 These factors should also be carefully considered when evaluating EW projects as a CDR strategy around the world.
Overall, the CO2 removal efficiency of EW pathways is strongly influenced by the rock type and particle size. Similarly to DACCS, the decarbonisation of the energy sector will play a significant role in improving the climate repair value of EW.
3. Timing & permanence
As discussed in Section 2, the CO2 removal efficiency of different archetypal CDR pathways can vary significantly with location, configurations, and importantly with time. In this section, the CO2 removal efficiency of each archetypal pathway is illustrated over a 1000 year time period, so that to assess the impact of time. Here, we use 5 archetypal regions/climates to illustrate location-specific effects, e.g. climates, bio-geophysical factors or carbon intensity of the energy systems:• Brazil (Rio de Janeiro) – tropical rainforests;
• China (Shaanxi) – temperate mountain systems (not far from the green belt);
• EU (UK) – temperate oceanic and boreal coniferous forests;
• India (Madhya Pradesh) – tropical shrubland (20% of the country); and
• USA (Louisiana) – subtropical humid forests.
3.1. Afforestation/reforestation (AR)
Fig. 11 shows the evolution of AR's CO2 removal efficiency over 1000 years for different climates and regions (i.e. for different risks of wildfires). An important metric is the carbon break-even time—the time it takes for AR to capture enough atmospheric CO2 to compensate for the CO2 emissions associated with forest establishment and management operations, and achieve net CO2 removal from the atmosphere. As can be observed, AR's carbon break-even time is around 5 years in all climates and regions. Similarly, AR's CO2 removal efficiency increases to more than 95% in less than 30 years across all climates and regions. Therefore, although AR is highly efficient to generate negative CO2 emissions, it is not immediate due to the time required for forests to grow.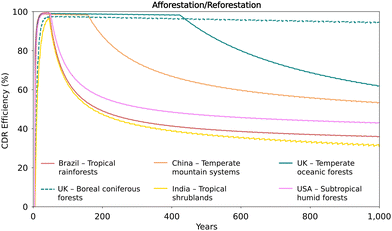 | ||
| Fig. 11 Evolution of the CO2 removal efficiency of AR over 1000 years for different climates and regions. | ||
Moreover, in the long term (>100 years), the increasing risk of wildfires reduces the CO2 removal efficiency of AR. Results show that the warmer the climate, the greater the rate of reduction of AR CO2 removal efficiency. Further, forests in dryer climates are observed to have reduced CO2 sequestration potential are (see SM.2, ESI†). For example, Brazil and India are both tropical climates, but Brazil is mainly dominated by rainforests, which is typically more humid than the shrublands which dominate India. The maximum CO2 sequestration potential of AR is around 710 t CO2 per ha in Brazil and 170 t CO2 per ha in India. Therefore, although CDR efficiencies of AR start decreasing at the same time and rate for both Brazil and India, Brazil is more efficient to generate CO2 removal than India over a 1000 year time period (36% versus 31%). Conversely, in boreal coniferous forests, such as in the North of the UK, the risk of wildfire is negligible owing to relatively low temperatures and humidity typically associated with the boreal climate.
However, it is also important to note that the CDR potential of AR also decreases with colder climates. For instance, the maximum CO2 sequestration potential of boreal forests in the UK is only around 120 t CO2 per ha, which is 5.7 times less than that of Brazilian rainforests. Furthermore, AR in boreal climates can potentially increase local warming, due to albedo effects, which could offset any temperature decrease achieved from carbon sequestration.74 Thus, all these factors should be carefully considered when evaluating AR projects as part of a climate repair strategy around the world.
3.2. Bioenergy with carbon capture and storage (BECCS)
Due to the inherent reliability of geological reservoirs,75 BECCS is considered a permanent CO2 sink. In the near-term (Fig. 12), its CO2 removal efficiency is mainly a function of bio-geophysical factors, i.e. the type of land and biomass used for bioenergy (see Section 2.2). Since forestry or agricultural residues have no (I)LUC effects (see SM.2, ESI†), BECCS using these feedstocks has an immediate and constant CDR efficiency of 81–87%, which is in line with observations in Fig. 4.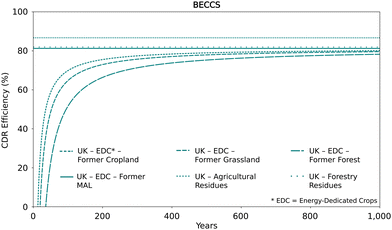 | ||
| Fig. 12 Evolution of the CO2 removal efficiency of BECCS over 1000 years for different types of biomass feedstock and land. | ||
However, for feedstocks grown on former cropland, grassland or forest, the carbon debt initiated by land conversion for biomass production, i.e. (I)LUC, needs to be paid off before the BECCS pathway can generate net negative CO2 emissions.30 This carbon break-even time depends on the type of land that has been converted.76–78 As shown in Fig. 12, payback periods range from 14 to 36 years for former cropland, or natural forest, respectively, resulting in CO2 removal efficiencies ranging between 52% to 70% over the first 100 years, compared to 78–80% over 1000 years. Thus, the socio-economic viability of BECCS pathways as a CDR strategy using biomass associated with substantial (I)LUC is highly dubious.
3.3. Biochar
Fig. 13 shows the evolution of biochar's CDR efficiency over a 1000 year time period for different types of biomass feedstocks and different regions. As explained in Section 2, the pyrolysis yield (40% in the case of slow pyrolysis) has a major impact on the CDR efficiency of biochar, which ranges between 19–38% over 100 years, depending on the type of biomass feedstock used. However, due to the decay of biochar over time, this range reduces to below 5% over a millennium. In tropical climates, such as Brazil, where biochar's decay rates are accelerated owing to higher soil temperatures (see SM.4, ESI†), the CO2 emissions resulting from the biochar supply chain exceed the amount of CO2 sequestrated in the biochar after a period of about 550 years. Thus, the overall CDR efficiency of biochar becomes negative, i.e. the pathway emits more CO2 into the atmosphere than the amount removed. Thus, the viability of biochar-based CDR pathways is even more dubious than that of BECCS. Given their potential competition for land and biomass feedstock, and considering the impact of time on long-term permanence, BECCS pathways are more efficient than biochar pathways.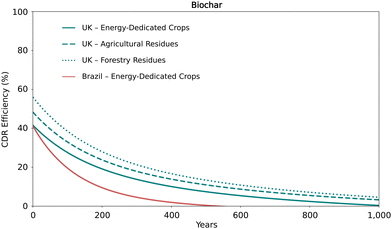 | ||
| Fig. 13 Evolution of the CO2 removal efficiency of biochar over 1000 years for different types of biomass feedstock in different regions. | ||
3.4. Direct air capture of CO2 with storage (DACCS)
Similarly to BECCS, DACCS is a permanent CDR pathway. However, the CDR efficiency of DACCS is significantly influenced by the carbon intensity of the energy used, which varies with DAC technology and region. Solid sorbent and liquid solvent DACCS use heat and electricity, whereas seawater mineralisation DACCS only utilises electricity. As the current CO2 emissions intensities of the heat supply and electricity grid vary with region, the CDR efficiency of DACCS differs for each country and technology type, as shown in Fig. 14.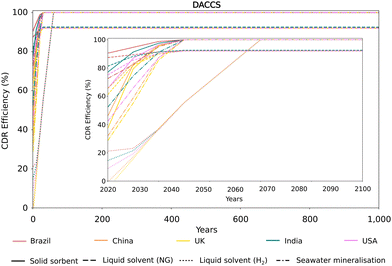 | ||
| Fig. 14 Evolution of the CO2 removal efficiency of DACCS over 1000 years for different regions and DACCS archetypes. | ||
Importantly, the CDR efficiency of DACCS increases as these energy systems decarbonise over time. The CO2 emissions intensity of electricity is assumed here to reduce to net zero by 2050, following the trajectory of the IPCC P2 illustrative option79 (see SM.1, ESI†). For solid sorbent and seawater mineralisation DACCS pathways, the increase in CDR efficiency is directly proportional to the rate of decarbonisation of the electricity grid. Particularly, when zero carbon energy is available, the seawater mineralisation option achieves a CDR efficiency of 100% owing to the direct formation of a solid carbonate, which avoids leakage of CO2.
The CO2 emissions intensity of heat is another important factor, as shown for liquid solvent DACCS pathways using natural gas and hydrogen. If we assume that natural gas steam methane reforming (SMR) in combination with CCS will be the least-cost option for low carbon hydrogen in the near term, and account for the upstream carbon leakage associated with this option,80 the liquid solvent hydrogen-based DACCS has the lowest CDR efficiency for the first 50 years. But as this carbon leakage is reduced to zero over time, the CDR efficiency of this pathway increases. Once the broader energy system is fully decarbonised, all DACCS are observed to reach a CDR efficiency of approximately 100% (assuming 0.005% CO2 leakage during transport and storage over a 100 year period75).
Thus, the climate repair value of DACCS, via CDR, will disproportionally increase relative to the other CDR pathways as time goes by. Similarly, the near-term value of DACCS (and other) CDR options which is powered by zero carbon power, e.g. nuclear or renewable energy, is also significant.
3.5. Enhanced weathering (EW)
As shown in Fig. 15, owing to the time between producing carbonatable materials, i.e. when energy is used and carbon emitted, and effectively removing CO2 from the atmosphere, the CDR efficiency of EW steadily increases over time until its maximum CO2 sequestration potential is reached. As rocks increasingly weather over time, the negative CO2 emissions generated by EW is permanent.28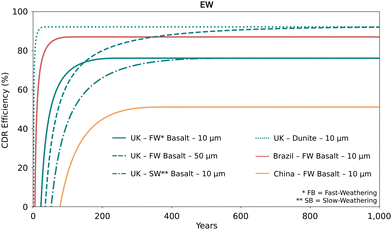 | ||
| Fig. 15 Evolution of the CO2 removal efficiency of EW over 1000 years for different alkaline rock characteristics (i.e., type, composition, or size) and different regions. | ||
The maximum and long-term CDR efficiency of EW results from a combination of factors, including: the rock type-specific CO2 sequestration potential, the energy use of alongside the rocks supply chain, particularly for grinding, and associated CO2 emissions (e.g., 10 μm rather than 50 μm), and the carbon intensity of the region of deployment (e.g. the carbon intensity of the energy mix is lower in Brazil and higher in China). Therefore, over a period of 1000 years, once the rocks are fully weathered, the maximum CDR efficiency of EW can range between 51% and 92%.
However, in the near-term, the carbon break-even time of EW can range between 5–77 years, depending on the carbon intensity of the energy used for the supply chain and the type of rock. For example, it only takes 5 years for fast-weathering basalt deployed in Brazil to become carbon negative, whereas it takes 77 years in China, owing to China's highly carbon intensive energy mix. In the UK, it only takes a few months for dunite to provide CDR, whereas slow- and fast-weathering basalts will take up to 35 and 52 years, respectively.
4. Discussion & conclusion
Large-scale CDR will be indispensable in delivering the 1.5–2 °C objectives of the Paris Agreement, as well as in achieving intermediate net-zero targets. Owing to the intrinsic characteristics and differences of CDR pathways, the degree to which they can deliver permanent CDR in a time and resource efficient way vary significantly.We find that AR can be highly efficient to remove CO2 from the atmosphere (up to 95–99%)—the CO2 leakage associated with the establishment and the ongoing management of forests is negligible in comparison to the CO2 sequestration potential of AR, and that even over millennial time period. However, similarly to other nature-based solutions, e.g. peatland conservation/restoration or agroforestry, the CO2 removal potential, and thus carbon removal efficiency, of AR increases very slowly owing to the time that forests require to grow before any CO2 removal is achieved, and is saturated once forests reach maturity. Moreover, owing to the increasing risk of unpredictable natural and anthropogenic disturbances, e.g. weather events such as wildfires or deforestation, the permanence of AR's CO2 removal decreases with time, hence concurrently reducing CO2 removal efficiency of AR.
Conversely, BECCS, biochar or EW rely on more sophisticated supply chains than AR, resulting in potentially substantial CO2 leakage, and therefore reducing their CO2 removal efficiencies. Biochar is found to be highly inefficient owing to the low pyrolysis yield for biochar, resulting in almost half of the biogenic CO2 being emitted back into the atmosphere. Although biochar can provide immediate CDR, its CO2 removal efficiency decreases within decades or centuries due to its decay rate and can ultimately have a negative impact on the climate.
We find that BECCS is more efficient at removing CO2 from the atmosphere than biochar, owing to its higher CO2 capture rate and high permanence of the CO2 stored in geological reservoirs. However, both BECCS and biochar are subject to potential (I)LUC effects, which can delay CDR by a few years to a few decades.
Similarly to BECCS, both DACCS and EW deliver permanent CDR, with DACCS storing in geological reservoirs, and EW in rocks. However, for both pathways, we find that the CO2 removal efficiency is greatly reduced by the carbon intensity of the energy used for either sorbent regeneration/seawater mineralisation in the case of DACCS, and for crushing and grinding rocks in the case of EW. EW's CO2 removal efficiency increases within months to decades owing to its carbonation rate and can ultimately have a positive impact on the climate. This is summarised in Table 1.
| CDR pathway | CO2 removal efficiency | Timing | Permanence | ||
|---|---|---|---|---|---|
| Over 100 years | Over 1000 years | (Is CDR efficient? Why?) | (Is CDR immediate? If not, why?) | (Is CDR permanent? If not, why?) | |
| a Considering current and future decarbonised energy systems. | |||||
| AR | 63–99% | 31–95% | Very high | Decades | Very low |
| Forest establishment & management has a negligible impact on CDR efficiency | Forest growth takes time | Owing to the risk of natural disturbances, such as wildfires or weather events | |||
| BECCS | 52–87% | 78–87% | Moderate to high | Immediate to decades | High/very high |
| Biomass supply chain emissions | (I)LUC change effects | Permanent CO2 storage in geological reservoirs | |||
| Biochar | 20–39% | −3 to 5% | Low | Immediate | Low/very low |
| Pyrolysis (conditions with low biochar yield), biomass supply chain emissions | The carbon of biochar is relatively stable and sequestered in soil | Decay rate of biochar reduces stored carbon over time | |||
| DACCSa | −5 to 90% (92–100%) | −5 to 90% (92–100%) | Moderate to high | Immediate | Very high |
| CO2 intensity of the energy consumed | CO2 capture from the air/ocean | Permanent CO2 storage in geological reservoirs | |||
| EW | 17–92% | 51–92% | Moderate to high | Immediate to decades | High/very high |
| Rock supply chain emissions | Carbonation rate (residence time) | Chemical reactions permanently store carbon in rock minerals | |||
Thus, whilst the importance CO2 removal in meeting the Paris Agreement's objectives remains unchallenged, the role and value of each individual CDR pathway in contributing durably and in a time- and resource-efficient manner to these objectives will be observed to vary substantially with the bio-geophysical, broader energy system, and socio-political contexts within which it will be deployed across the world.
Author contributions
N. M. D. and S. C. conceived the study; S. C. carried out the calculations, designed the figures and led the writing; with P. P., M. B., N. S. and N. M. D. contributing to the text.Conflicts of interest
There are no conflicts to declare.Acknowledgements
S. C. and N. S. would like to acknowledge funding from the European Union's Horizon 2020 research and innovation programme under grant agreement no. 869192. P. P. acknowledges support received by the CO2RE Hub, funded by the Natural Environment Research Council (Grant Ref: NE/V013106/1). M. B. would like to acknowledge funding from the Research Councils UK (RCUK) under grants NE/P019900/1 (Comparative assessment and region-specific optimisation of GGR) and EP/T033940/1 (Multiphysics and multiscale modelling for safe and feasible CO2 capture and storage). N. S. also acknowledges funding from the European Commission under Project No. 271498 in the Horizon 2020 program, ACT Grant Agreement No. 691712.References
- United Nations Framework Convention on Climate Change (UNFCCC), Adoption of the Paris Agreement, Paris, 2015.
- A. H. MacDougall and P. Friedlingstein, J. Clim., 2015, 28, 4217–4230 CrossRef.
- H. D. Matthews, N. P. Gillett, P. A. Stott and K. Zickfeld, Nature, 2009, 459, 829–832 CrossRef CAS PubMed.
- K. Zickfeld, M. Eby, H. Damon Matthews and A. J. Weaver, Proc. Natl. Acad. Sci. U. S. A., 2009, 106, 16129–16134 CrossRef CAS.
- J. Rogelj, A. Popp, K. V. Calvin, G. Luderer, J. Emmerling, D. Gernaat, S. Fujimori, J. Strefler, T. Hasegawa, G. Marangoni, V. Krey, E. Kriegler, K. Riahi, D. P. Van Vuuren, J. Doelman, L. Drouet, J. Edmonds, O. Fricko, M. Harmsen, P. Havlík, F. Humpenöder, E. Stehfest and M. Tavoni, Nat. Clim. Change, 2018, 8, 325–332 CrossRef CAS.
- Intergovernmental Panel on Climate Change, Global Warming of 1.5 °C. An IPCC Special Report on the impacts of global warming of 1.5 °C above pre-industrial levels and related global greenhouse gas emission pathways, in the context of strengthening the global response to the threat of climate change, Press, 2018 Search PubMed.
- D. Huppmann, J. Rogelj, E. Kriegler, V. Krey and K. Riahi, Nat. Clim. Change, 2018, 8, 1027–1030 CrossRef.
- Climate Analytics and New Climate Institute, Glasgow's 2030 credibility gap: net zero's lip service to climate action - Warming Projections Global Update, 2021.
- United Nations Framework Convention on Climate Change (UNFCCC), Nationally determined contributions under the Paris Agreement, Glasgow, 2021.
- S. L. Lewis, C. E. Wheeler, E. T. A. Mitchard and A. Koch, Nat., 2019, 568, 25–28 CrossRef CAS.
- L. and D. (FELD) A. T. The Food and Land Use (FOLU) Coalition and the Food, Environment, From Global Commitments to National Action: A Closer Look at Nationally Determined Contributions from a Food and Land Perspective, 2021.
- Climate Analytics and New Climate Institute, Countries|Climate Action Tracker, https://climateactiontracker.org/countries/, (accessed 10 February 2022).
- A. Geiges, A. Nauels, P. Yanguas Parra, M. Andrijevic, W. Hare, P. Pfleiderer, M. Schaeffer and C. F. Schleussner, Earth Syst. Dyn., 2020, 11, 697–708 CrossRef.
- S. E. Tanzer and A. Ramirez, Energy Environ. Sci., 2019, 0–16 Search PubMed.
- T. Terlouw, C. Bauer, L. Rosa and M. Mazzotti, Energy Environ. Sci., 2021, 14, 1701–1721 RSC.
- S. Fuss, W. F. Lamb, M. W. Callaghan, J. Hilaire, F. Creutzig, T. Amann, T. Beringer, W. De Oliveira Garcia, J. Hartmann, T. Khanna, G. Luderer, G. F. Nemet, J. Rogelj, P. Smith, J. V. Vicente, J. Wilcox, M. Del Mar Zamora Dominguez and J. C. Minx, Environ. Res. Lett., 2018, 13, 063002 CrossRef.
- G. F. Nemet, M. W. Callaghan, F. Creutzig, S. Fuss, J. Hartmann, J. Hilaire, W. F. Lamb, J. C. Minx, S. Rogers and P. Smith, Environ. Res. Lett., 2018, 13, 063003 CrossRef.
- A. Strong, S. Chisholm, C. Miller and J. Cullen, Nat., 2009, 461, 347–348 CrossRef CAS.
- L. Rosa, V. Becattini, P. Gabrielli, A. Andreotti and M. Mazzotti, Resour., Conserv. Recycl., 2022, 184, 106436 CrossRef CAS.
- H. Ostovari, L. Müller, F. Mayer and A. Bardow, J. Cleaner Prod., 2022, 360, 131750 CrossRef CAS.
- S. Gupta, H. W. Kua and C. Y. Low, Cem. Concr. Compos., 2018, 87, 110–129 CrossRef CAS.
- CarbonCure's Sustainable Concrete Solution - Concrete Technology Reducing Carbon Impact, https://www.carboncure.com/, (accessed 30 June 2022).
- Biocrete – a carbon negative concrete - Snøhetta, https://snohetta.com/project/558-biocrete-a-carbon-negative-concrete, (accessed 30 June 2022).
- T. Strunge, P. Renforth and M. Van der Spek, Commun. Earth Environ., 2022, 3, 1–14 CrossRef.
- M. Legan, A. Ž. Gotvajn and K. Zupan, J. Environ. Manage., 2022, 309, 114704 CrossRef CAS PubMed.
- P. Renforth, Int. J. Greenhouse Gas Control, 2012, 10, 229–243 CrossRef CAS.
- L. L. Taylor, J. Quirk, R. M. S. Thorley, P. A. Kharecha, J. Hansen, A. Ridgwell, M. R. Lomas, S. A. Banwart and D. J. Beerling, Nat. Clim. Change, 2016, 6, 402–406 CrossRef CAS.
- D. J. Beerling, E. P. Kantzas, M. R. Lomas, P. Wade, R. M. Eufrasio, P. Renforth, B. Sarkar, M. G. Andrews, R. H. James, C. R. Pearce, J. F. Mercure, H. Pollitt, P. B. Holden, N. R. Edwards, M. Khanna, L. Koh, S. Quegan, N. F. Pidgeon, I. A. Janssens, J. Hansen and S. A. Banwart, Nature, 2020, 583, 242–248 CrossRef CAS PubMed.
- D. Woolf, J. Lehmann, S. Ogle, A. W. Kishimoto-Mo, B. McConkey and J. Baldock, Environ. Sci. Technol., 2021, 55, 14795–14805 CrossRef CAS PubMed.
- M. Fajardy and N. Mac Dowell, Energy Environ. Sci., 2017, 10, 1389–1426 RSC.
- S. Fuss, W. F. Lamb, M. W. Callaghan, J. Hilaire, F. Creutzig, T. Amann, T. Beringer, W. de Oliveira Garcia, J. Hartmann, T. Khanna, G. Luderer, G. F. Nemet, J. Rogelj, P. Smith, J. L. V. Vicente, J. Wilcox, M. del Mar Zamora Dominguez and J. C. Minx, Environ. Res. Lett., 2018, 13, 063002 CrossRef.
- P. Smith, R. S. Haszeldine and S. M. Smith, Environ. Sci.: Processes Impacts, 2016, 18, 1400–1405 RSC.
- H. Herzog, K. Caldeira and J. Reilly, Clim. Change, 2003, 59, 293–310 CrossRef CAS.
- J. Bednar, M. Obersteiner, A. Baklanov, M. Thomson, F. Wagner, O. Geden, M. Allen and J. W. Hall, Nature, 2021, 596, 377–383 CrossRef CAS PubMed.
- Intergovernmental Panel on Climate Change, Climate Change 2014: Mitigation of Climate Change. Contribution of Working Group III to the Fifth Assessment Report of the Intergovernmental Panel on Climate Change, Cambridge University Press, 2014 Search PubMed.
- Intergovernmental Panel on Climate Change, Climate Change 2021: The Physical Science Basis. Contribution of Working Group I to the Sixth Assessment Report of the Intergovernmental Panel on Climate Change, Cambridge, 2021 Search PubMed.
- Z. Parisa, M. Nova and G. Vermeer, Forests and Carbon A Guide for Buyers and Policymakers, 2020 Search PubMed.
- C. Ebert, S. Osman, H. Raven, J. Remucal, S. Wescott and B. Zavariz, Soil Enrichment Protocol, 2020 Search PubMed.
- D. Archer, J. Geophys. Res., C: Oceans Atmos., 2005, 110, 1–6 CrossRef.
- A. Lyngfelt, D. J. A. Johansson and E. Lindeberg, Int. J. Greenhouse Gas Control, 2019, 87, 27–33 CrossRef CAS.
- V. Scott, R. S. Haszeldine, S. F. B. Tett and A. Oschlies, Nat. Clim. Change, 2015, 5, 419–423 CrossRef CAS.
- S. Chiquier and N. Mac Dowell, Greenhouse Gas Removal Technologies - Energy and Environment Series, Royal Society of Chemistry, 2022 Search PubMed.
- H. Aalde, P. Gonzalez, M. Gytarsky, T. Krug, W. A. Kurz, S. Ogle, J. Raison, D. Schoene, N. H. Ravindranath, N. G. Elhassan, L. S. Heath, N. Higuchi, S. Kainja, M. Matsumoto, M. J. S. Sánchez and Z. Somogyi, Agriculture, Forestry and Other Land Use – IPCC Guidelines for National Greenhouse Gas Inventories, 2006, vol. 4 Search PubMed.
- P. Smith, P. J. Gregory, D. van Vuuren, M. Obersteiner, P. Havlík, M. Rounsevell, J. Woods, E. Stehfest and J. Bellarby, Philos. Trans. R. Soc., B, 2010, 365, 2941–2957 CrossRef PubMed.
- T. W. R. Powell and T. M. Lenton, Energy Environ. Sci., 2012, 5, 8116–8133 RSC.
- W. R. L. Anderegg, A. T. Trugman, G. Badgley, C. M. Anderson, A. Bartuska, P. Ciais, D. Cullenward, C. B. Field, J. Freeman, S. J. Goetz, J. A. Hicke, D. Huntzinger, R. B. Jackson, J. Nickerson, S. Pacala and J. T. Randerson, Climate-driven risks to the climate mitigation potential of forests, Science, 2020, 368, 1327 CrossRef.
- I. Thompson, B. Mackey, S. McNulty and A. Mosseler, Forest Resilience, Biodiversity, and Climate Change: a synthesis of the biodiversity/resilience/stability relationship in forest ecosystems, 2009 Search PubMed.
- W. M. Hammond, A. P. Williams, J. T. Abatzoglou, H. D. Adams, T. Klein, R. López, C. Sáenz-Romero, H. Hartmann, D. D. Breshears and C. D. Allen, Nat. Commun., 2022, 13, 1–11. Search PubMed.
- N. G. Ulanova, For. Ecol. Manage., 2000, 135, 155–167 CrossRef.
- C. S. Galik and R. B. Jackson, For. Ecol. Manage., 2009, 257, 2209–2216 CrossRef.
- M. Fajardy and N. Mac Dowell, Greenhouse Gas Removal Technologies - Energy and Environment Series, Royal Society of Chemistry, 2022 Search PubMed.
- IEAGHG, Biorefineries with CCS, 2021.
- P. Patrizio, M. Fajardy, M. Bui and N. Mac Dowell, iScience, 2021, 24, 102765 CrossRef CAS PubMed.
- M. Bui, D. Zhang, M. Fajardy and N. Mac Dowell, Int. J. Hydrogen Energy, 2021, 46, 15298–15321 CrossRef CAS.
- L. Rosa, D. L. Sanchez and M. Mazzotti, Energy Environ. Sci., 2021, 14, 3086–3097 RSC.
- L. Rosa and M. Mazzotti, Renewable Sustainable Energy Rev., 2022, 157, 112123 CrossRef CAS.
- C. M. Beal, I. Archibald, M. E. Huntley, C. H. Greene and Z. I. Johnson, Earth's Future, 2018, 6, 524–542 CrossRef CAS.
- M. Fajardy, J. Morris, A. Gurgel, H. Herzog, N. Mac Dowell and S. Paltsev, Global Environ. Change, 2021, 68, 102262 CrossRef.
- A. Cowie, D. Woolf, J. Gaunt, M. Brandão, R. Anaya, D. Rosa and A. Cowie, Biochar. Environ. Manage., 2019, 795–826 Search PubMed.
- Y. Fang, B. Singh, B. P. Singh and E. Krull, Eur. J. Soil Sci., 2014, 65, 60–71 CrossRef CAS.
- J. Wang, Z. Xiong and Y. Kuzyakov, GCB Bioenergy, 2016, 8, 512–523 CrossRef CAS.
- S. Bakshi, C. Banik and D. A. Laird, Sci. Rep., 2020, 10, 13082 CrossRef CAS PubMed.
- A. Tisserant and F. Cherubini, Land, 2019, 8, 179 CrossRef.
- D. Woolf, J. E. Amonette, F. A. Street-Perrott, J. Lehmann and S. Joseph, Nat. Commun., 2010, 1, 56 CrossRef PubMed.
- K. Z. House, A. C. Baclig, M. Ranjan, E. A. van Nierop, J. Wilcox and H. J. Herzog, Proc. Natl. Acad. Sci. U. S. A., 2011, 108, 20428–20433 CrossRef CAS PubMed.
- R. Socolow, M. Desmond, R. Aines, J. Blackstock, O. Bolland, T. Kaarsberg, N. Lewis, M. Mazzotti, A. Pfeffer, K. Sawyer, J. Siirola, B. Smit and J. Wilcox, Direct Air Capture of CO2 with Chemicals: A Technology Assessment for the APS Panel on Public Affairs, 2011 Search PubMed.
- M. Fasihi, O. Efimova and C. Breyer, J. Cleaner Prod., 2019, 224, 957–980 CrossRef CAS.
- D. W. Keith, G. Holmes, D. St. Angelo and K. Heidel, Joule, 2018, 2, 1573–1594 CrossRef CAS.
- J. Strefler, T. Amann, N. Bauer, E. Kriegler and J. Hartmann, Environ. Res. Lett., 2018, 13, 034010 CrossRef.
- D. J. Beerling, E. P. Kantzas, M. R. Lomas, P. Wade, R. M. Eufrasio, P. Renforth, B. Sarkar, M. G. Andrews, R. H. James, C. R. Pearce, J. F. Mercure, H. Pollitt, P. B. Holden, N. R. Edwards, M. Khanna, L. Koh, S. Quegan, N. F. Pidgeon, I. A. Janssens, J. Hansen and S. A. Banwart, Nature, 2020, 583, 242–248 CrossRef CAS PubMed.
- S. J. T. Hangx and C. J. Spiers, Int. J. Greenhouse Gas Control, 2009, 3, 757–767 CrossRef CAS.
- P. Renforth, Nat. Commun., 2019, 10, 1401 CrossRef PubMed.
- L. T. Bach, S. J. Gill, R. E. M. Rickaby, S. Gore and P. Renforth, Front. Clim., 2019, 1, 7 CrossRef.
- R. M. Bright, K. Zhao, R. B. Jackson and F. Cherubini, Global Change Biol., 2015, 21, 3246–3266 CrossRef.
- J. Alcalde, S. Flude, M. Wilkinson, G. Johnson, K. Edlmann, C. E. Bond, V. Scott, S. M. V. Gilfillan, X. Ogaya and R. S. Haszeldine, Nat. Commun., 2018, 9, 2201 CrossRef PubMed.
- J. Fargione, J. Hill, D. Tilman, S. Polasky and P. Hawthorne, Science, 2008, 319, 1235–1238 CrossRef CAS.
- R. J. Plevin, M. O’Hare, A. D. Jones, M. S. Torn and H. K. Gibbs, Environ. Sci. Technol., 2010, 44, 8015–8021 CrossRef CAS PubMed.
- K. P. Overmars, E. Stehfest, J. P. M. Ros and A. G. Prins, Environ. Sci. Policy, 2011, 14, 248–257 CrossRef CAS.
- D. Huppmann, J. Rogelj, E. Kriegler, V. Krey and K. Riahi, Nat. Clim. Change, 2018, 8, 1027–1030 CrossRef.
- N. Mac Dowell, N. Sunny, N. Brandon, H. Herzog, A. Y. Ku, W. Maas, A. Ramirez, D. M. Reiner, G. N. Sant and N. Shah, Joule, 2021, 5, 2524–2529 CrossRef CAS.
- FAO, Global Ecological Zones for FAO Forest Reporting: 2010 Update, Rome, 2011.
- FOREST EUROPE, State of Europe's Forests, 2020.
Footnotes |
| † Electronic supplementary information (ESI) available. See DOI: https://doi.org/10.1039/d2ee01021f |
| ‡ Whilst this study focuses on 5 archetypal CDR pathways, it is important to note that the concept of CDR efficiency introduced here can be, in principle, applied to any other CDR pathway, subject to sufficient data availability. |
| § In the UK, temperate oceanic forests are predominant—88% of the land cover81—with 49% broadleaves and 51% conifers.82 |
| This journal is © The Royal Society of Chemistry 2022 |

