 Open Access Article
Creative Commons Attribution 3.0 Unported Licence
Accelerating net zero from the perspective of optimizing a carbon capture and utilization system†
Zhimian Hao a,
Magda H. Barecka
 b and
Alexei A. Lapkin
 *ab
*ab
aDepartment of Chemical Engineering and Biotechnology, University of Cambridge, Cambridge CB3 0AS, UK. E-mail: aal35@cam.ac.uk
bCambridge Centre for Advanced Research and Education in Singapore Ltd, 1 Create Way, CREATE Tower #05-05, 138602, Singapore
First published on 30th March 2022
Abstract
Net zero requires an accelerated transition from fossil fuels to renewables. Carbon capture and utilization (CCU) can be an effective intermediate solution for the decarbonization of fossil fuels. However, many research works contain renewables in the design of CCU systems, which may mislead stakeholders regarding the hotspots of CCU systems. Herein, this work builds a CCU system with no renewables involved, and evaluates its greenhouse gas (GHG) emissions based on the life cycle assessment with a cradle-to-gate boundary. To pursue the best system performance, an optimization framework is established to digitalize and optimize the CCU system regarding GHG emissions reduction. The optimized CCU can reduce GHG emissions by 13% compared with the conventional process. Heating is identified as the most significant contributor to GHG emissions, accounting for 60%. Electrifying heating fully using low-carbon electricity can further reduce GHG emissions by 47%, but such extreme conditions will significantly sacrifice the economic benefit. By contrast, the multi-objective optimization can show how the decisions can affect the balance between GHG emissions and profit. Furthermore, this work discusses the dual effect of carbon pricing on the CCU system – raising the cost of raw materials and utilities, but also gaining credits when emissions are reduced in producing valued products.
Broader contextFossil fuels are essential to supply the global energy demand but cause remarkable CO2 emissions. Carbon capture and utilization (CCU) can be an effective technology to decarbonize the fossil fuel-based heavy industry, e.g., power stations. In many systems proposed for CCU, further conversion of captured CO2 to valued chemicals (utilization) requires extensive input of hydrogen or energy, which are assumed to be generated using surplus renewable electricity. Such an assumption might be challenging to realize in the near future and makes the evaluation of CCU over-optimistic. Herein, this work focuses on a ‘worst condition’ (no renewables involved) and shows how optimization can be applied to explore the maximum potential of CCU regarding environmental and economic aspects. Furthermore, the influence of carbon pricing on the deployment of CCU is also discussed. |
1. Introduction
To limit global warming to 1.5–2 °C above pre-industrial levels, over 130 countries have pledged to cut the greenhouse gas (GHG) emissions to nearly zero (or ‘net zero’) by the mid 21st century.1 Net zero requires a complete upgrading for the current energy system, since approx. 75% of GHG emissions result from today's energy sector.2 Fossil fuels are essential to supply approx. 80% of today's worldwide energy demand, and they are projected to play an indispensable role in an immediate timeframe.2 Carbon capture is reported as both an effective and scalable technology to decarbonize the fossil fuel-based energy sectors.3 Further conversion of captured CO2 to high-value products (or ‘utilization’) requires an excessive amount of energy to break its chemical bonds, because CO2 is thermodynamically highly stable. If the energy source is purely fossil fuels, carbon capture and utilization (CCU) is reported to cause more emissions than unabated fossil fuels.4–6 To address this challenge, it has been proposed to apply renewable energy to power the carbon utilization, thus forming ‘power-to-X’ (power refers to solar or wind renewable energy source; X refers to fuels or chemicals, such as methanol, H2, gasoline and polymers).4,5,7–13 However, it is complex to immediately scale up these systems due to two facts: (1) a prerequisite is the access to cheap renewable energy, which requires a considerably higher renewable power capacity than todays’ installations for wind turbines and solar photovoltaics;14 (2) the intermittent renewable electricity requires either cheap battery systems or the feasibility for dynamic operation of the utilization processes.8,11 Furthermore, several studies on hybrid systems, i.e. [CCU + renewable H2/electricity], lead to a conclusion that the inclusion of renewable energy sources is indispensable to achieve emissions reduction,4,5 and also the cost of the renewables is considered to be the limiting factor for the economic feasibility of hybrid systems.4,6,15 We anticipate that the involvement of renewables might underestimate the potential of CCU and mislead stakeholders in identifying the hotspot for CCU.We therefore sought to investigate whether CCU can be viable without the input of renewables. To answer this question, we created a hypothetical industrial park, where power plants are integrated with CCU, but no renewables are involved in the initial design. Following this, optimization is applied to explore the maximum potential of CCU regarding the environmental and economic aspects. The proposed strategy is inspired by the net-zero trends and prior works on CCU studies, which will be expanded in this section.
1.1 ‘Big picture’ – some trends urged by net zero
Transition to net zero requires drastic changes across multiple energy sectors, which is difficult to realize in a short period of time.16 From the existing to stricter schemes, the International Energy Agency (IEA) presents three scenarios2 for the prediction of global energy transition through 2050, as shown in Fig. 1.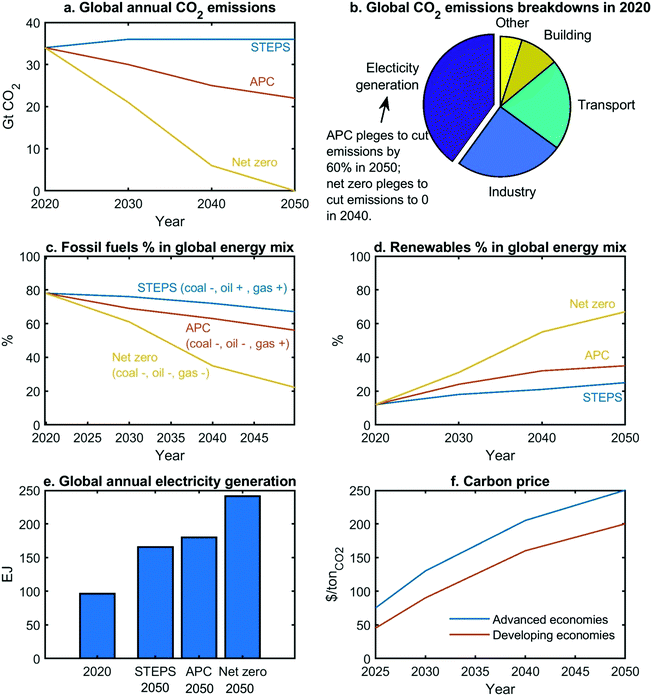 | ||
| Fig. 1 Three scenarios for energy transition, predicted by IEA.2 STEPS only considers the existing policies, which can control the temperature increase by 2.7 °C in 2100; (2) APC assumes that all the pledged targets will become policies, which can control the temperature increase by 2.1 °C in 2100; (3) net-zero case, corresponds to the temperature increase by 1.5 °C in 2050. (Note: this net-zero case scenario is proposed by IEA, but is not the only scenario path to achieve net-zero emissions). | ||
Some key points are as follows:
(1) The electricity (generation) sector produces nearly 40% of emissions in 2020 (Fig. 1b).2
(2) The reliance on fossil fuels will decline to 67–22% in 2050 (Fig. 1c) but not disappear, because fossil fuels are required to produce carbon-embodied products (e.g., certain polymers),2 which cannot be easily replaced by bio-materials based products.
(3) Even if fossil fuels decline to 22%, the potential market of carbon capture is enormous, because around half of fossil fuels are required to equip with carbon capture (4 Gt CO2 captured in 2035, while 7.6 Gt captured in 2050).2
(4) The renewable share will grow to 25–67% in 2050 (Fig. 1d).2
(5) Electrification will be the trend across all sectors.2 Electricity generation will increase by 70–150% (Fig. 1e), which lays the foundation for electrification. Regarding the supply of heating utility, fossil fuels should gradually be substituted with low-carbon electricity.2
(6) A significant growth in carbon price should be introduced to regulate the GHG emissions (Fig. 1f).2
Therefore, reducing the power plant emissions is paramount under the net-zero framework. Fossil fuels will continue to play an indispensable role through 2050, while the growth rate of renewables will be subject to a high degree of uncertainty depending on the extent of policy support. As such, there is a need for innovation that supports a stepwise transition from the current fossil-fuels based energy production to the renewable-based future. Hence, [fossil fuels + carbon capture] may be a good intermediate solution to renewables. Additionally, we can consider electrification to enhance CCU as well as the influence of carbon price.
1.2 Prior works on CCU
‘Capture’ systems described in the literature usually refer to carbon capture, utilization and storage (CCUS). Carbon capture involves capturing CO2 from heavy industries, such as power stations, fertilizer production sites, cement factories, steel plants, or directly from the air.3 CO2 storage refers to the captured CO2 being compressed and injected into the underground for permanent storage.3 CO2 utilization converts the captured CO2 to valued products, e.g., fuels and polymers.3 Depending on storage or utilization, the CCUS is divided into CCS (carbon capture and storage) and CCU (carbon capture and utilization).17 CCS deals with the endpoint of CO2, which can directly benefit climate change mitigation17 but might deliver limited financial returns depending on the local policies.18 By contrast, CCU regards CO2 as a carbon source for further conversion to valued products, which can be highly profitable, as far as the deployed conversion methods are efficient and associated with low GHG emissions.17 Hence, CCU is a complex system that requires a techno-economic evaluation at a regional scale,17e.g., an industrial park.There are various pathways for either capture or utilization. Extensive studies have been done to optimize individual sub-systems of CCU, e.g., pressure swing adsorption (PSA),19–22 and monoethanolamine (MEA) for CO2 capture,23,24 methanol synthesis11,15,25 or Fischer–Tropsch26,27 for subsequent utilization. However, the performance of these sub-systems depends on each other, and thus individual optimal solutions cannot simultaneously co-exist. When optimizing a sub-system before extending to the whole CCU system, we can only expect to obtain a sub-optimal solution. In a recent review paper, Dieterich et al. also pointed out that the studies on the interaction between CCU sub-systems are still scarce.8 Inspiringly, Roh et al. optimized a whole CCU system, where MEA is taken as the only CO2 capture technology, and the 15 utilization pathways co-exist to satisfy market demands.5 In Roh's work, the competitive interactions among different sub-systems are considered, but the complexity/non-linearity for individual sub-systems is neglected.5 To manipulate both high-level system variables and sub-system variables, a more robust method is superstructure optimization,28 but this method leads to complex formulations and difficult-to-solve MINLP problems.29 An alternative solution is surrogate-based optimization, where sub-systems can be represented by cheap-to-evaluate surrogates29 (surrogates are developed by regression to build a direct relationship between process inputs and outputs.30). Still, most prior works limit the surrogate-based optimization to a CCU sub-system (either capture21,22,31–33 or utilization15,25).
Overall, previous works neither delivered a convincing evaluation of an impact of a CCU system in energy transition, nor addressed the complexity of optimizing a CCU system composed of different carbon capture and utilization technologies. To address both challenges, this work focuses on an overseen scenario: CCU plants without renewable energy input considered in the initial design, and we develop a surrogate-based optimization methodology to assess its maximum potential regarding emissions reduction and economic gain. Carbon pricing is included in the economic calculation to predict the future potential of this CCU system.
The remaining sections are structured as follows. Section 2 describes an industrial park where natural gas power plants are integrated with CCU. Section 3 illustrates the digitalization and optimization framework for the whole CCU system. Section 4 presents the single-objective optimization of maximizing the GHG reduction; this is set up to evaluate whether CCU can reduce CO2 effectively, as well as to validate the overall optimization framework. Following this, multi-objective optimization is applied to the whole system concerning GHG reduction and economic gain in Section 5. Section 6 introduces carbon pricing within the economic evaluation. The final section presents conclusions and outlooks.
2. Problem statement: an industrial park of power stations integrated with CCU
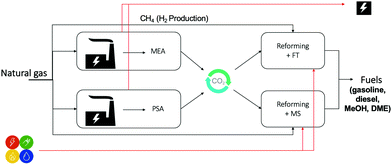
To explore the potential for decarbonization of energy and chemicals manufacturing by means of CCU, we sought to investigate all feasible process configurations that include well-understood, scalable process options for capture and utilization sections. We illustrate this approach with a case study of a hypothetical industrial park, which is powered by natural gas, and delivers electricity and liquid fuels as the main products. In the reference case, where no carbon capture is deployed, all CO2 emissions arising from electricity production are vented to the atmosphere. In the case of integration of CCU, these CO2 emissions will be captured and converted to fuels, thus reducing the input of petrochemical resources to the chemical synthesis and consequently decreasing the carbon footprint of the industrial park. The industrial park is presumed to contain two natural gas combined cycle (NGCC) power plants. One NGCC is equipped with an MEA absorber (MEA is the most commercialized option, and the other amine solvents can be alternatives due to their low energy requirement34); while the other is coupled with a PSA, to capture CO2. The CO2 fraction of flue gas is concentrated from ∼4% to ∼90% by MEA and PSA, respectively. Following this, with the co-feed of NG and steam, the concentrated CO2 is reformed to syngas, which is further converted to fuels, being reviewed as one of the most promising product types for carbon utilization.17,35 Among different liquid fuels used on large-scales, methanol, gasoline, and diesel are reported to be crucial for the transport sector, because of their high energy density,8 and convenient handling. Hence, we focused on Fischer–Tropsch (FT) and methanol synthesis (MS) to manufacture fuel products (gasoline, diesel, and methanol). Overall, the proposed industrial park can be compatible with the existing industry in: (1) the upstream – by decarbonizing the electricity sector, and (2) the downstream – by supplying fuels to the transport sector (Fig. 2).The model of the industrial park is based on the following assumptions:
(1) The CO2 captured by PSA is assumed to be temporarily stored in a collection hub, where CO2 is well mixed before utilization. As such, the PSA performance under the cyclic steady state32 can be equivalent to the steady-state. Additionally, the time scale of a PSA cycle (∼10 min)36 is much shorter than the start-up of chemical plants (∼days).37 Therefore, the overall system can be considered to operate under a steady-state condition.
(2) This PSA system contains two 4-step PSA processes in series to gradually improve the purity of CO2 and guarantee the final purity is over 90% (Section S1.3, ESI†).
(3) An NGCC power plant is closely connected to a capture process, forming a sub-system.
(4) The captured CO2 is mixed and then re-distributed to the downstream utilization pathways. The optimal ratio of CO![[thin space (1/6-em)]](https://www.rsc.org/images/entities/char_2009.gif) :
:![[thin space (1/6-em)]](https://www.rsc.org/images/entities/char_2009.gif) H2 is slightly different between FT
H2 is slightly different between FT  and MS
  . This is because CO2 can be a carbon source in MS (CO2 is active on MS catalysts38,39), while CO2 is inactive on FT catalysts.40,41 Hence, CO2 is distributed before reforming, which adjusts the CO/H2 for FT and MS, respectively.
(5) Combined reforming is considered: dry reforming is considered to convert CO2 to syngas, while steam reforming is also involved in adjusting the ratio between CO and H2 in the final syngas. Both reforming processes can be assumed to achieve equilibrium.42,43
(6) A reforming process is closely connected to FT or MS, thus resulting in a single sub-system.
(7) The heating utility can be replaced with low-carbon electricity for a flexible design for utility supply.
3. Optimization framework
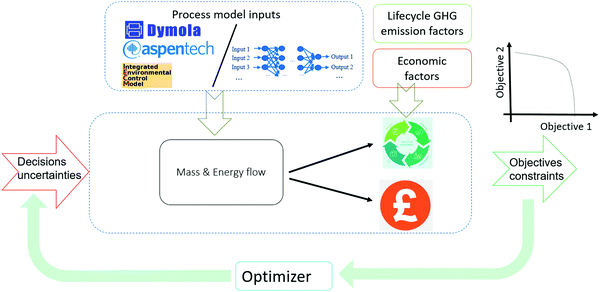
The scope of the optimization framework is designed around the entire industrial park, containing four sub-systems, i.e. [NGCC + MEA], [NGCC + PSA], [Reforming + FT] and [Reforming + MS]. To determine an optimal configuration, models of sub-systems are necessary. The current industrial practice involves the application of tailored simulators for specific systems (e.g. Dymola for dynamic process modeling, Aspen for reactors and separation units). We anticipated that it might be insightful to search a global decision space by simultaneously optimizing all sub-systems, ideally from a level of a higher interactive platform. To achieve this goal, as well as improve the computational efficiency of the complex optimization task, we digitalized the sub-systems using surrogates and proposed a three-level framework as shown in Fig. 3. This work mainly considers Artificial Neural Networks (ANNs) as surrogates, because ANNs are claimed to be universal approximators.44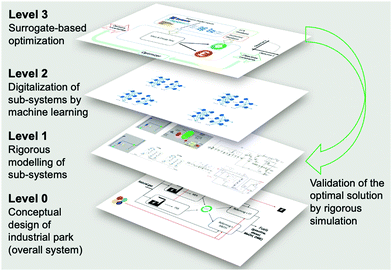 | ||
| Fig. 3 Three-level approach for the optimization of complex processes, illustrated by the case study of decarbonization of an integrated industrial park. | ||
In Level 1, the sub-systems are modelled in different dedicated simulators. The two NGCC power plants are represented in Integrated Environmental Control Model (IECM).45 MEA absorption is also modelled in IECM. The PSA is modelled in Dymola, which is a mature and broadly deployed tool for modelling dynamic processes.46 A reforming section integrated with FT/MS is modelled in Aspen Plus. The detailed information for modeling of the individual sub-systems and technical flowsheets are given in Section S1 of ESI.†
In Level 2, ANN-based surrogates are established to replace the rigorous simulations for sub-systems for the overall optimization goal. Each sub-system can have one or two surrogates. For example, the [Reforming + FT] sub-system contains only one surrogate, while the [NGCC + PSA] sub-system contains two surrogates for the two PSA in series. The detailed methodology for surrogate construction can be referred to in our prior work, where we present how to build surrogates for the PSA and [reforming + FT].47 The paramount step to generate surrogates is identifying the essential input/output variables, which is closely related to the optimization of the whole CCU system. To identify input/output variables for individual surrogates, we use a top-down systems thinking approach: (1) the decision variables and optimization objectives are the key input/output variables of the whole CCU system; the input should also include uncertainties, e.g., concertation of methane in NG or carbon price; (2) the input/output variables of the whole CCU system determine those for the sub-systems, which are referred to in Section S2 in the ESI;† (3) the input/output variables of a sub-system determine those for surrogates (Section S3, ESI†). Table 1 summarizes the decision variables considered. The design space of the decision variables is randomly sampled to generate sufficient input values, which are sent to the simulators in Level 1 for the corresponding output via rigorous simulations. Eventually, the obtained input/output data points can be used to train ANN-based surrogates.
| Design variables | Unit | [LB,UB] | Definition | |
|---|---|---|---|---|
| MEA | r CO2 | — | [0.60, 0.95]48 | Recovery rate of CO2 |
| 1st PSA | P L1 | bar | [0.005, 0.05]20 | Low-pressure setpoint |
| P I1 | bar | [0.07, 0.5]20 | Intermediate-pressure setpoint | |
| v feed1 | m s−1 | [0.1, 2]20 | Velocity of inlet flow | |
| t ads1 | s | [20, 100]20 | Duration of adsorption | |
| t bd1 | s | [30, 200]20 | Duration of blowdown | |
| t evac1 | s | [30, 200]20 | Duration of evacuation | |
| 2nd PSA | P L2 | bar | [0.005, 0.05]20 | Low-pressure setpoint |
| P I2 | bar | [0.07, 0.5]20 | Intermediate-pressure setpoint | |
| v feed2 | m s−1 | [0.1, 2]20 | Velocity of inlet flow | |
| t ads2 | s | [20, 100]20 | Duration of adsorption | |
| t bd2 | s | [30, 200]20 | Duration of blowdown | |
| t evac2 | s | [30, 200]20 | Duration of evacuation | |
| CO2 to FT | z FT | — | [0.025, 0.975] | Splitting between FT and MS |
| FT | T FT | °C | [215, 265]26 | Reaction temperature for FT |
| P FT | bar | [15,50]49,50 | Reaction pressure for FT | |
| trayFT | — | [45, 65] | Tray no. of distillation column | |
| T ref1 | °C | [750, 1000]51 | Reformer temperature | |
| P ref1 | bar | [3, 7]51 | Reformer pressure | |
| S purge | — | [0.001, 0.2] | Fraction for purge (recycle) | |
| ReFT | — | [0.01,0.99] | Fraction for FT (reformer) | |
| MS | F NG/FCO | — | [2, 3.7] | Ratio of NG over CO2 |
| T MS | °C | [180, 220]52 | Reaction temperature for MS | |
| P MS | bar | [50, 80]52 | Reaction pressure for MS | |
| TrayMS | — | [45, 65]53 | Tray no. of distillation column | |
| T ref2 | °C | [800, 1000]51 | Reformer temperature | |
| P ref2 | bar | [3, 7]51 | Reformer pressure | |
| Heating utility | Fracfuelele-CCS | — | [0, 1] | Fraction of fuel heating substituted by CCS electricity |
| Fracsteamele-CCS | — | [0, 1] | Fraction of steam heating substituted by CCS electricity |
In Level 3, surrogate-based optimization is performed, as illustrated in Fig. 4. We deploy a simulation-based optimization approach, where simulation is executed within the optimizer. Level 1 and Level 2 offer process model inputs to one simulation platform, where decision variables and process uncertainties are used to run the overall flowsheet simulation. Subsequently, lifecycle GHG emission factors (Table S3, ESI†) and economic factors (Table S4, ESI†) are considered within the mass and energy balances calculated in the overall flowsheet simulation, thus resulting in the objective values. The optimizer varies the values of decision variables and improves the objectives iteratively. After the surrogate-based optimization is completed, we use the obtained values for the decision variables to perform rigorous simulations for individual sub-systems, to validate the optimal solution.
4. Single-objective optimization regarding lifecycle GHG emissions reduction
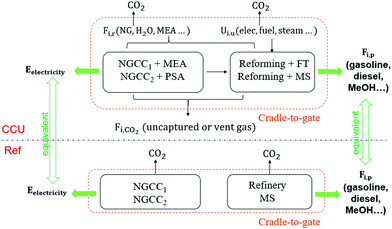
The optimization framework described above was applied to assess the potential of CCU to solely reduce GHG emissions (i.e., in the absence of renewable sources of energy). Here we only consider the GHG emission reduction as the objective of the optimization.The GHG emissions are evaluated based on the life cycle assessment (LCA) with a cradle-to-gate boundary. We seek to compare the overall emissions from the reference process (described in Section 2: Problem statement) to emissions of the system with CCU. For a meaningful comparison, we evaluate multiple process configurations where both the reference process and the CCU system yield exactly the same amount of electricity and fuels (defined as the system expansion strategy54), as shown in Fig. 5. More detailed information for the system boundary and the system expansion strategy can be referred to Section S4.1 and S4.2 (ESI†).
Based on the mass and energy balances derived from process models and lifecycle GHG emission factors (Table S3, ESI†), the GHG reduction is calculated in eqn (1)–(3) (further details are given in Section S4 in the ESI†).
 | (1) |
 | (2) |
 | (3) |
The optimization is formulated as follows,
 | (4) |
| s.t.LB ≤ θ ≤ UB | (5) |
Genetic algorithm (GA) is used as the optimizer, and the progress of the optimization towards reaching the maximum reduction of GHG emissions is illustrated in Fig. 6. The mean objective value is the average objective value of populations at every iteration. In the initial generations, the mean objective value is negative, which indicates CCU can even cause more GHG emissions than the reference system. We terminate the optimizer after 50 iterations, where the mean objective value is closed to the best objective. Herein, we approximate the found values for decision variables as the optimal operating condition, as shown in Table S5 (ESI†). Under this condition, rigorous simulation is performed and yields a similar objective value as the simulation by surrogates.
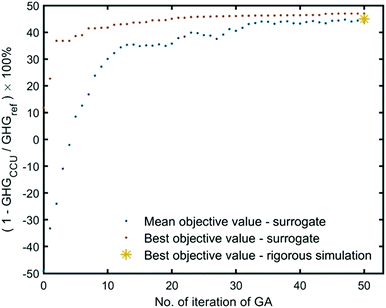 | ||
| Fig. 6 The optimization progress for GHG reduction in the industrial park, for single-objective optimization (GHG reduction). | ||
We tested the surrogate performance in our recent publication, which shows that most of the surrogate outputs have relative errors smaller than 5% (some are even smaller than 1%).47 The accuracy of surrogates is good enough to evaluate the mass and energy flows. Furthermore, we find that surrogate simulation for GHG emissions of sub-systems is very close to rigorous simulation results under both initial (random guess) and optimal operating conditions (Fig. S10, ESI†). In fact, the surrogate does not have to be highly accurate. The crucial point is to find the improvement direction for decision variables. The surrogate is used as the function evaluation within the optimization iterations and to guide the improvement direction at a reduced computational cost.
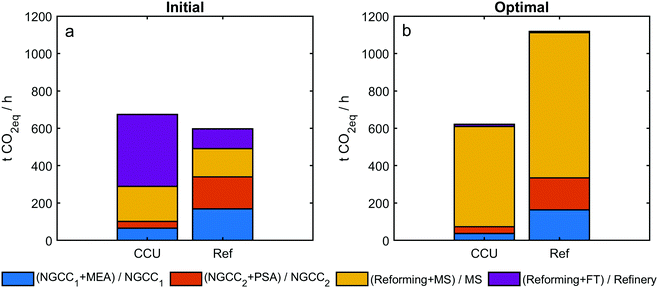
The GHG emissions of sub-systems are presented in Fig. 7. Under a random (initial) system configuration, CCU deployment results in more life cycle GHG emissions than the reference system, used to generate the same amount of electricity and products. This is because, within the initially evaluated process configuration, CO2-based reforming requires extensive energy input, which can lead to more emissions if no appropriate operating conditions are set. For example, emissions from [Reforming + FT] is almost triple of that from the refinery in the reference system (Fig. 7a). Under the optimal operating condition, GA recommends to produce methanol instead of gasoline (thus, emissions from [Reforming + FT] become negligible). This is probably because CO2 cannot be converted in the FT path,40,41 while CO2 can be well utilized in MS.8,38,39
Furthermore, the optimization algorithm is capable of distinguishing between the choice of MEA from PSA unit operations, even though this is not evident from the system-level data. The use of carbon capture leads to two effects on the 500 MW NGCC plants: lowering the emissions but shrinking the net electricity output. As shown in Table 2, PSA has fewer emissions than MEA; 20% electricity loss is seen for the deployment of MEA, while 16% electricity loss for PSA. Hence, PSA has an advantage over MEA regarding GHG emissions reduction and energy saving. However, this advantage is negligible when referring to GHG emissions in the whole CCU system because more emissions are caused by the utilization paths than the capture paths (Fig. 7b).
| Emissions [ton CO2 per h] | Net electricity output [MW] | ||
|---|---|---|---|
| CCU | [NGCC1 + MEA] | 37.17 | 400 |
| [NGCC2 + PSA] | 36.66 | 418 | |
| Reference | [NGCC1] | 163.50 | 400 |
| [NGCC2] | 170.80 | 418 |
GA suggested the optimal operating conditions as listed in Table S5 (ESI†). To maximize the GHG reduction, the requirements for sub-systems are as follows:
(1) MEA: high recovery rate is preferred.
(2) PSA: in the 1st PSA, the PL1 should be low enough to enhance capture capacity, while this requirement is not strict for the 2nd PSA. Long evacuation is preferred for two PSA columns, and thus sufficient time is allocated to recover the captured CO2.
(3) MS is favoured over FT.
(4) Heating tends to be fully substituted by low-carbon electricity.
(5) In the reforming process, the ratio of NG/CO2 is suggested to approach the upper bound, meaning that sufficient NG is required to substantially convert CO2 to CO in the reforming section.
While determining the optimal conditions, GA tends to replace fossil fuel-based heating with low-carbon electricity generated from sources deploying carbon capture and storage. However, we anticipate that there might exist several techno-economic limitations towards a complete substitution of heating by decarbonized electricity sources. Hence, we performed a set of scenario analyses for the heating substitution regarding the upper bound for substituting heating utility is set as 0, 25%, 50%, 100%. The optimization is performed respectively for them (for optimization progresses refer to Fig. S11 (ESI†) and for optimal operating conditions to Table S6, ESI†). After optimization, the GHG emissions can be reduced, ranging from 13% to 47%, while all the substitution percentages to low-carbon electricity tend to approach the upper bounds (Table 3).
| Max substitution [%] | 0 | 25 | 50 | 100 |
| GHG reduction [%] | 13.0 | 19.8 | 30.5 | 47.0 |
| Fuel sub [%] | 0 | 24.9 | 49.8 | 99.7 |
| Steam sub [%] | 0 | 22.3 | 49.6 | 95.6 |
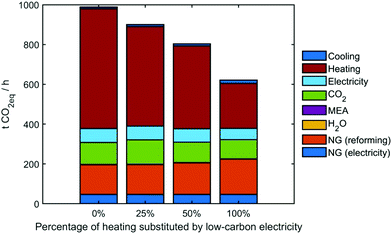
Fig. 8 shows the breakdowns of sources for GHG emissions in the industrial park. The largest source is heating, followed by NG, CO2 emissions via vent gas and electricity, etc. When increasing the heating substitution from 0% to 100%, the GHG emissions can be reduced by 40%. By contrast, GHG emissions are negligible for the cooling, process water and MEA. Yet, even for 100% heating substitution by CCS-electricity, we can see that heating still holds the most considerable contribution to GHG emissions.
5. Multi-objective optimization regarding lifecycle GHG emissions and economic gain
Upon exploring the capability of CCU to decarbonize the NG-based power plants and fuels production, we sought to include the economic into the optimization framework. The economic evaluation is under the following assumptions:(1) The cost calculation considers the operational cost only, since the technology readiness level of CCU is relatively low and its capital cost cannot be quantified accurately.5
(2) This industrial park is operated in the EU. Economic assessment is based on the prices data for materials/utilities in the first half of 2021. No carbon tax is assumed at this stage of analysis.
Based on the mass and energy flow from process models and economic factors (Table S3, ESI†), the profit of the CCU system is calculated following eqn (6).
 | (6) |
The formulation of relevant equations and economic data can be found in Section S5 in the ESI.† The optimization is formulated as follows,
 | (7) |
| s.t.LB ≤ θ ≤ UB | (8) |
To solve it, we use the non-dominated sorting genetic algorithm-II (NSGA-II), a stochastic optimization algorithm that approximates the Pareto front. Pareto front offers a set of trade-off solutions, where one objective cannot be improved without worsening the other one.
5.1 Pareto front
Surrogate-based optimization yields the optimal values for decision variables (Fig. S12 and S13, ESI†). Based on these optimal decisions, rigorous simulations are performed to calculate the two objectives. As shown in Fig. 9, when we set the GHG emissions reduction objective to a high value at 42%, the profit is even negative; yet pursuing a high profit (>3.8 × 10⁵ $ per h) can make the CCU system release even more emissions than conventional processes.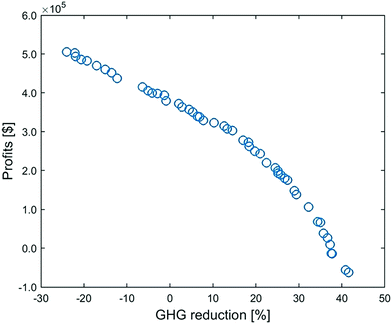 | ||
| Fig. 9 Multi-objective optimization of the CCU system: Pareto front between profit and GHG emissions reduction. | ||
To better understand the trade-off between the two objectives, we refer to the economic breakdowns of several Pareto points, which are selected based on GHG emissions reduction at −24%, 0%, 15%, 30% and 42%. As shown in Fig. 10, improving GHG emissions reduction leads to a gradual growth of utility costs and dropping revenue. Table 4 indicates that the increasing utility cost is caused by the rising percentage of heating electrification, because the energy price of low-carbon heating can be over four times that of fuel or steam (Fig. S14, ESI†). Meanwhile, the shift from FT to MS can further promote the GHG emissions reduction but sacrifice the economic revenue, because the market price of methanol is much lower than FT fuels – gasoline/diesel (Table S4, ESI†).
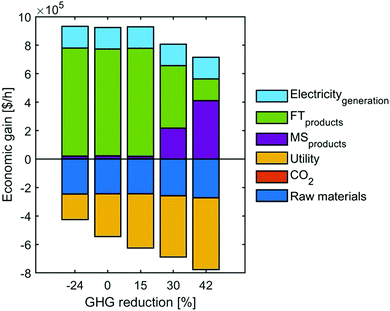 | ||
| Fig. 10 The breakdowns of economic gain in several Pareto front points (selected based on GHG emissions reduction at −24%, 0%, 15%, 30% and 42%). | ||
| Clarification: zFT: split of CO2 to FT. 1-zFT: split of CO2 to MS. Fracfuelele-CCS: fraction of fuel heating substituted by CCS heating. Fracsteamele-CCS: fraction of steam heating substituted by CCS. | |||||
|---|---|---|---|---|---|
| GHG reduction | −24% | 0 | 15% | 30% | 42% |
| Profit [$ per h] | 5.06 × 10⁵ | 3.80 × 10⁵ | 3.03 × 10⁵ | 1.19 × 10⁵ | −6.20 × 10⁴ |
| z FT | 0.963 | 0.958 | 0.963 | 0.565 | 0.195 |
| Fracfuelele-CCS | 0.047 | 0.579 | 0.933 | 0.965 | 0.984 |
| Fracsteamele-CCS | 0.631 | 0.754 | 0.843 | 0.940 | 0.997 |
5.2 Optimal values for the decision variables
When referring to the optimal values for the decision variables, multi-objective optimization can recommend the operating conditions for individual processes. As shown in Fig. S12 and S13 (ESI†), each subplot refers to one decision variable, while each circle in a subplot corresponds to one solution found by NSGA-II (corresponding to a point in Pareto front in Fig. 9).Table 5 compares the suggested operating conditions by single-objective optimization and multi-objective optimization. On the one hand, both suggest some similar operating conditions. For example, MEA is recommended to approach the upper bound in both cases. On the other hand, two types of optimization differ on some operating conditions: single-objective optimization suggests some extreme conditions (approach either lower or upper bound of decision variables). In contrast, multi-objective optimization offers more moderate operating conditions. For example, single-objective optimization selects the lowest PL (corresponding to the best recovery for CO2 but also the highest energy consumption20) for the PSA system; also, MS is chosen as the main CO2 utilization pathway. By contrast, multi-objective optimization determines a relatively low value for PL and recommends to mix FT with MS in the utilization pathways. This is because the multi-objective optimization delivers more practical solutions, where GHG emissions reduction should be balanced with the economic aspects.
| Suggested operating conditions (θ) by | Decision index | ||
|---|---|---|---|
| Single-objective optimization GA (Table S5, ESI) | Multi-objective optimization NSGA-II (Fig. S12 and S13, ESI) | ||
| MEA | High recovery rate | High recovery rate | (1) |
| 1st PSA | PL approaches the lowest | PL is relatively low | (1–7) |
| Long adsorption | Long adsorption | ||
| Short desorption for N2 | Long desorption for N2 | ||
| Long desorption for CO2 | Long desorption for CO2 | ||
| 2nd PSA | PL approaches the lowest | PL is relatively low | (8–13) |
| Long desorption for CO2 | Long desorption for CO2 | ||
| Utilization pathways | MS is favored over FT. | FT is favored over MS sometimes | (14) |
| FT and MS co-exist sometimes | |||
| FT | (not important, because FT is not selected) | (important, because FT is selected as a key utilization path) | (15–21) |
| FT 248 °C, 26 bar | FT 244–246 °C, 28 bar | ||
| Distillation 62 trays | Distillation 55–57 trays | ||
| Reformer 876 °C, 5.0 bar | Reformer 947–950 °C, 4.2–4.5 bar | ||
| Purge % at 4.5% | Purge % at 4.4 – 7.2% | ||
| More recycle to FT section | More (> 80%) recycle to reforming | ||
| MS | NG/CO2 = 3.5. | NG/CO2 = 3.6–3.7 | (22–27) |
| MS reactor inlet 204 °C. | MS reactor inlet 196–198 °C | ||
| MS reactor inlet 70 bar | MS reactor inlet 66 bar | ||
| Distillation 46 trays | Distillation 55 trays | ||
| Reformer 933 °C, 6.2 bar | Reformer 863–881 °C, 5.6–5.7 bar | ||
| Heating | Fuel-gas heating is fully substituted by low-carbon elec. | Fuel-gas heating is partially substituted by low-carbon elec. | (28–29) |
| Steam-based heating is fully substituted by low-carbon elec. | Steam-based heating is over 60% substituted by low-carbon elec. | ||
NSGA-II is a stochastic optimization technique, so the found solution theoretically cannot guarantee the optimality unless infinite iterations are performed. To check whether the best solutions found in our case are robust or not, we evaluate extreme scenarios: (1) the selection of utilization pathways – fully employing either FT or MS (Fig. S15, ESI†); (2) the heating is fully substituted by low-carbon electricity (Fig. S16, ESI†). Neither way delivers a better solution than the solution found by NSGA-II. This is because such extreme scenarios can only bring in minor improvement on one objective, but dramatically sacrifices the other objective compared to the original solution found by NSGA-II.
In brief, multi-objective optimization can recommend moderate operating conditions for the industrial park. Relating the Pareto front to decision variables can offer an insight into how environmental and economic aspects are affected by operating conditions. Specifically, utilization to gasoline/diesel (FT path) can bring in more economic benefits, while utilization to methanol (MS path) and electrifying heating is more environmental-friendly. By contrast, the extreme operating conditions tend to significantly sacrifice either economic or environmental aspects.
The initial focus of this work is to scrutinize the potential for carbon reduction by the simultaneous optimization of the entire industrial park, and thus we focus on a scenario where there exists a high local demand for the CCU products, therefore there are no market-related constraints on how much CCU products can be generated. Nevertheless, the developed methodology does allow us to consider market capacity as an optimization constraint. In the future, we will consider the connection to the supply chain for products and the local demand for CCU products, then the actual flowrate of CCU products, transportation/distribution and the size of the industrial park will be taken into account.
Furthermore, there are many uncertainties involved in this proposed industrial park. In the initial conceptual process design, our work does not consider size/dimension of plants, which allow for more design flexibility for the future and must be carefully evaluated in the next stage – a more robust process design. We assume that reforming can achieve the equilibrium at the different high temperatures, but the conversion efficiencies may not be ideal in practice, especially when coke formation and catalyst deactivation occur. The location of hypothetical industrial park is also essential, because the location choice can affect (1) the compositions of natural gas, which then influence the overall mass balance; (2) prices of raw materials, utilities and products. Additionally, the economic evaluation is subject to external factors, e.g., market dynamics. All these factors can contribute to the deviation of an LCA-Economic trade-off curve. A more robust method can be optimization under uncertainty, where the uncertainties are incorporated into the objective function.
6. Influence of carbon pricing
Lastly, we sought to examine the influence of carbon pricing on the CCU system. IEA reports that carbon price will significantly increase up to 250 $ per ton-CO2 by 2050 for advanced economies.2 As predicted by Nicholson et al., the rising carbon prices can raise the energy cost55 as a result of an extra financial constraint for the utility emissions, which can be roughly assessed by multiplying the emission factors by the carbon price (eqn (9)). In this work, the carbon price is implemented in the form of carbon tax. We embedded different strategies for carbon tax deployment and assumed that carbon pricing is imposed both on emissions resulting from both utility usage, and also, on the life-cycle emissions from the carbon-based raw materials and products.The economic factors contain therefore two parts: original prices and carbon tax as follows,
| βu = βu,0 + αu·γCO2 | (9) |
| βr = βr,0 + αr·γCO2 | (10) |
| βp = βp,0 + αp·γCO2 | (11) |
Based on the optimization results for decision variables at no carbon price, the profits are re-calculated under other carbon prices (no further optimization is performed here, so it is not appropriate to use the term ‘Pareto front’. The phrase, ‘trade-off’ curve, is used in this section). Fig. 11 presents the change in the trade-off curves for the carbon price ranging from 0 to 250 $ per ton-CO2. With the increase of carbon price, the profit shifts to different directions depending on the GHG reduction. At a low GHG reduction, the profit drops with the carbon tax increase; at a high GHG reduction, the trend is reversed.
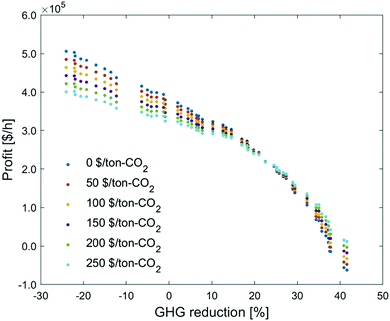 | ||
| Fig. 11 Influence of carbon price on the trade-off curve between profit and GHG emissions reduction. | ||
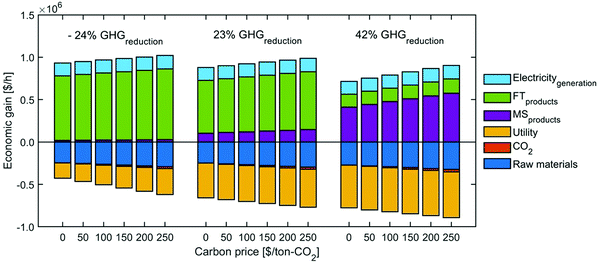
To investigate why the trade-off curve shifts to different directions, we pick the points at −24%, 23% and 42% of GHG emissions reduction, under which we investigate their economic breakdowns (Fig. 12). We can find carbon tax has dual effects on this CCU system. On the one hand, the process cost increases with carbon tax. This is because the CCU plant is still associated with emissions from raw materials, utilities and unreacted CO2 emissions, so the cost of these emissions is consequently increased. On the other hand, the revenue from fuel products rises with the growth of carbon tax, as the carbon tax increases the price of fuel products, which brings in extra credits to the CCU system. MS can reduce more GHG emissions and the credit for methanol is larger than FT products. Hence, the revenue increase in methanol is much more significant than that in FT products, which reflects that raising carbon tax brings in more revenue at 42% GHG reduction than that at −24% GHG emissions reduction.
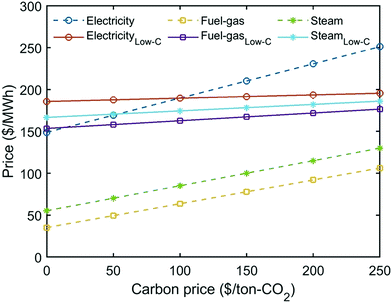
Additionally, carbon price imposes a higher penalty to the utilities with higher emissions. As shown in Fig. 13, the cost of utilities with direct emissions increases faster than the low-carbon utilities. This explains why the utility cost at −24% GHG emissions reduction, when the percentage of heating electrification is very low (Table 4), grows significantly with the increase of carbon tax (Fig. 12). By contrast, heating is almost fully substituted by low-carbon electricity at 42% GHG reduction, so the growing carbon tax does not notably change the utility cost.
Overall, at a higher GHG emissions reduction, the carbon tax promotes a higher growth rate for credit gain and a lower growth rate for the penalty. By contrast, a lower GHG emissions reduction has an inverse trend. As such, increasing carbon tax brings the trade-off curves in an intersection at 23% GHG reduction, where the growth rate of cost is equivalent to that of product revenue. Notably, we analyzed here only the profit from the CCU system, without considering how its economic performance would compare to a direct-emission system, which will become significantly less economic under the increasing carbon tax scenario.
7. Conclusions and recommendations for future research
The optimization framework presented in this work allows for optimization of complex problems with conflicting objectives, as illustrated with the case of the CCU system (the proposed industrial park). To determine its best performance regarding environmental and economic aspects, we developed an optimization framework, where the industrial park is fully digitalized by ANN-based surrogates and simultaneously optimized in a cost-efficient manner. As such, the nonlinearity of sub-systems and the interaction between sub-systems are well considered during the optimization iterations. By scrutinizing the interactions between different unit operations proposed for carbon capture and utilization sections, optimization enables us to determine a process configuration allowing for substantial reduction of CO2 emissions (−13%). Importantly, the proposed decarbonization strategy does not rely on deployment of renewable energy sources hence offers a solution which is not dependent on the growth of renewables sectors. Through comparing the emissions from sub-systems under the optimal solution, we found that the GHG emissions in utilization dominate the whole CCU system, so optimizing the utilization paths can be more rewarding than the capture paths. This finding benefits from optimizing the sub-systems simultaneously. The GHG emissions breakdowns indicate that heating is the most significant contributor to GHG emissions of the whole system, accounting for 60%. Electrifying heating fully by CCS electricity and fully producing methanol in the utilization pathways can reduce GHG emissions by 47% compared to the conventional process. Still, such extreme conditions will significantly sacrifice the economic benefit. By contrast, multi-objective optimization suggests that the production of mixed methanol/gasoline/diesel and partial electrification of heating can achieve a better trade-off between GHG reduction and economic profit.This work also discusses the dual effect of the carbon price on this CCU system. On the one hand, carbon pricing puts an extra cost on the raw materials and utilities. On the other hand, the carbon tax can also bring in a ‘credit’ effect when reducing GHG emissions in fuels production. The effect of carbon taxes on the techno-economic performance of CCU is therefore complex to predict, and consequently the optimization approach proposed here can be a useful tool to determine the optimal solution under different scenarios of carbon prices.
Additionally, this work suggests the heating electrification can be an alternative to renewable H2 to make the CCU more competitive regarding the environmental aspect, while developing affordable low-carbon heating technologies10,56–59 can enhance the economic viability.
The proposed method demonstrates that digitalization and optimization are powerful tools to explore the potential of CCU. We anticipate that the availability of tools, which can generate precise process estimates under a low computational cost, can support decision-making in comparing numerous technologies. Specifically, the scope of this work is [gas + CCUS], which integrates the gas-fired power plants with CCU, as well as the heating utility partially substituted by CCS electricity. eqn (12) and random simulations can deliver a rough range of emission factor of [Gas + CCUS], see the red column in Fig. 14. Single-objective optimization can reach the lower bound for the emission factor, while multi-objective optimization tends to slightly increase the emissions while improving other objectives, such as the economic aspect. The developed optimization framework can also be generalized to other feedstocks, e.g., coal. By our flexible methodology, we can easily add an additional model/surrogates describing flue gas pre-treatment unit operations for the removal of NOx, SOx gases and flying ashes, as typically required at coal-fired plants; more attention is required to consider the influence of the gas impurities (e.g., sulphur impurities can deactivate the FT catalysts60) on the utilization pathways, leading to different catalyst kinetics and process models/surrogates. Furthermore, Fig. 14 lists the emission factors of several power generation technologies,61 and specific attention should be given to renewables with the potential to form new low-carbon pathways. In the long term, the industrial park should gradually introduce more renewable energy inputs, novel unit operations and increasing electrification, in order to enhance the decarbonization capacity in the supply, process and demand aspects; in larger scope, net zero needs various low-carbon pathways: while the developed [digitalization and optimization] framework is employed to exploit their decarbonization performances, the overall progress of net zero will be accelerated.
 | (12) |
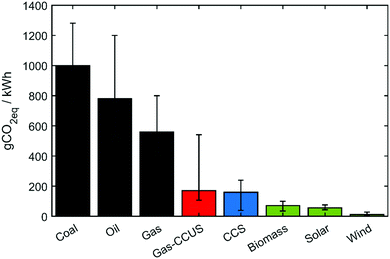 | ||
| Fig. 14 Lifecycle GHG emission factors of various power generation technologies. The scope of this work is [Gas-CCUS], and its emission factor is calculated as eqn (12). Other values can be found in Weisser.61 | ||
Nomenclature
| CCUS | Carbon capture, utilization and storage |
| CCU | Carbon capture and utilization |
| CCS | Carbon capture and storage |
| GHG | Greenhouse gas |
| NGCC | Natural gas combined cycle power plant |
| NGCC-CCS | Natural gas power plant equipped with CCS |
| Low-carbon electricity | Specifically refer to the electricity from NGCC-CCS in this work. |
| MEA | Monoethanolamine |
| PSA | Pressure swing adsorption |
| FT | Fischer–Tropsch |
| MS | Methanol synthesis |
| GHGCCU | GHG emissions of the whole CCU system (the industrial park) |
| GHGref | GHG emissions of the reference system (no capture, refinery, MS) |
| F | Mass flow, ton per h |
| α | Lifecycle GHG emission factors, tonCO2eq per ton |
| U | Consumption of utility u in sub-system i, GJ h−1 |
| β | Economic factors $ per ton |
| γ CO2 | Carbon price,$ per tonCO2 |
| GA | Genetic algorithm |
| NSGA-II | Non-dominated sorting genetic algorithm-II |
| Subscript | |
| i | Notation for sub-systems |
| r | Notation for raw materials (natural gas, process water, MEA, etc.) |
| u | Notation for utilities (steam, fuel gas, electricity, cooling, etc.) |
| p | Notation for products (gasoline, diesel, methanol, etc.) |
Conflicts of interest
There are no conflicts to declare.Acknowledgements
The authors declare no competing financial interest. ZH is thankful for the fruitful discussions with Dr Roh Kosan (Chungnam National University) regarding the LCA analysis on CCU, with Prof. Johan Grievink (TU Delft) regarding the steady-state approximation for CCU. ZH acknowledges financial support from the Chinese Scholarship Council and Cambridge Trust. ZH's final-year PhD was funded by the Sustainable Reaction Engineering research group of Prof. Lapkin. AAL and MHB acknowledges funding from the National Research Foundation (NRF), Prime Minister's Office, Singapore under its Campus for Research Excellence and Technological Enterprise (CREATE) program as a part of the Cambridge Centre for Advanced Research and Education in Singapore Ltd (CARES).References
- United Nations, The Global Coalition for Net-zero Emissions is Growing, https://www.un.org/en/climatechange/net-zero-coalition), accessed: 2021-12-10.
- International Energy Agency, Net Zero by 2050:A Roadmap for the Global Energy Sector, 2021.
- M. Bui, C. S. Adjiman, A. Bardow, E. J. Anthony, A. Boston, S. Brown, P. S. Fennell, S. Fuss, A. Galindo, L. A. Hackett, J. P. Hallett, H. J. Herzog, G. Jackson, J. Kemper, S. Krevor, G. C. Maitland, M. Matuszewski, I. S. Metcalfe, C. Petit, G. Puxty, J. Reimer, D. M. Reiner, E. S. Rubin, S. A. Scott, N. Shah, B. Smit, J. P. M. Trusler, P. Webley, J. Wilcox and N. Mac Dowell, Energy Environ. Sci., 2018, 11, 1062–1176 RSC.
- J. Burre, D. Bongartz, S. Deutz, C. Mebrahtu, O. Osterthun, R. Sun, S. Völker, A. Bardow, J. Klankermayer, R. Palkovits and A. Mitsos,, Energy Environ. Sci., 2021, 14, 3686–3699 RSC.
- K. Roh, A. S. Al-Hunaidy, H. Imran and J. H. Lee, AIChE J., 2019, 65, e16580 CrossRef.
- K. Roh, R. Frauzem, T. B. H. Nguyen, R. Gani and J. H. Lee, Comput. Chem. Eng., 2016, 91, 407–421 CrossRef CAS.
- B. Rego de Vasconcelos and J.-M. Lavoie, Front. Chem., 2019, 7, 392 CrossRef CAS PubMed.
- V. Dieterich, A. Buttler, A. Hanel, H. Spliethoff and S. Fendt, Energy Environ. Sci., 2020, 13, 3207–3252 RSC.
- M. H. Barecka, J. W. Ager and A. A. Lapkin, Energy Environ. Sci., 2021, 14, 1530–1543 RSC.
- A. Sternberg and A. Bardow, Energy Environ. Sci., 2015, 8, 389–400 RSC.
- C. Chen and A. Yang, Energy Convers. Manage., 2021, 228, 113673 CrossRef CAS.
- Siemens Energy, Power-to-X: The crucial business on the way to a carbon-free world,https://www.siemens-energy.com/global/en/offerings/technical-papers/download-power-to-x.html, accessed: 2021-11-10.
- VoltaChem, Power-to-Fuels, https://www.voltachem.com/applications/power-to-fuels, accessed: 2021-11-10.
- N. M. Haegel, R. Margolis, T. Buonassisi, D. Feldman, A. Froitzheim, R. Garabedian, M. Green, S. Glunz, H.-M. Henning, B. Holder, I. Kaizuka, B. Kroposki, K. Matsubara, S. Niki, K. Sakurai, R. A. Schindler, W. Tumas, E. R. Weber, G. Wilson, M. Woodhouse and S. Kurtz, Science, 2017, 356, 141–143 CrossRef CAS PubMed.
- A. González-Garay, M. S. Frei, A. Al-Qahtani, C. Mondelli, G. Guillén-Gosálbez and J. Pérez-Ramírez, Energy Environ. Sci., 2019, 12, 3425–3436 RSC.
- J. Deutch, Joule, 2020, 4, 2237–2240 CrossRef PubMed.
- T. Bruhn, H. Naims and B. Olfe-Kräutlein, Environ. Sci. Policy, 2016, 60, 38–43 CrossRef CAS.
- A. Zapantis, A. Townsend and D. RassoolThought Leadership Report.Global CCS Institute (GCCSI), 2019.
- H. A. Balogun, D. Bahamon, S. AlMenhali, L. F. Vega and A. Alhajaj, Energy Environ. Sci., 2021, 14, 6360–6380 RSC.
- R. Haghpanah, A. Majumder, R. Nilam, A. Rajendran, S. Farooq, I. A. Karimi and M. Amanullah, Ind. Eng. Chem. Res., 2013, 52, 4249–4265 CrossRef CAS.
- Z. Hao, A. Caspari, A. M. Schweidtmann, Y. Vaupel, A. A. Lapkin and A. Mhamdi, Chem. Eng. J., 2021, 423, 130248 CrossRef CAS.
- S. G. Subraveti, Z. K. Li, V. Prasad and A. Rajendran, Ind. Eng. Chem. Res., 2019, 58, 20412–20422 CrossRef CAS.
- M. M. F. Hasan, R. C. Baliban, J. A. Elia and C. A. Floudas, Ind. Eng. Chem. Res., 2012, 51, 15642–15664 CrossRef CAS.
- W. Chung and J. H. Lee, Ind. Eng. Chem. Res., 2020, 59, 18951–18964 CrossRef CAS.
- A. Gonzalez-Garay and G. Guillen-Gosalbez, Chem. Eng. Res. Des., 2018, 137, 246–264 CrossRef CAS.
- Y. H. Kim, K.-W. Jun, H. Joo, C. Han and I. K. Song, Chem. Eng. J., 2009, 155, 427–432 CrossRef CAS.
- C. Zhang, K.-W. Jun, K.-S. Ha, Y.-J. Lee and S. C. Kang, Environ. Sci. Technol., 2014, 48, 8251–8257 CrossRef CAS PubMed.
- L. T. Biegler and I. E. Grossmann, Comput. Chem. Eng., 2004, 28, 1169–1192 CrossRef CAS.
- C. A. Henao and C. T. Maravelias, AIChE J., 2011, 57, 1216–1232 CrossRef CAS.
- K. McBride and K. Sundmacher, Chem. Ing. Tech., 2019, 91, 228–239 CrossRef CAS.
- D. C. Miller, D. Agarwal, D. Bhattacharyya, J. Boverhof, Y.-W. Cheah, Y. Chen, J. Eslick, J. Leek, J. Ma, P. Mahapatra, B. Ng, N. V. Sahinidis, C. Tong and S. E. Zitney, in Computer Aided Chemical Engineering, ed. Z. Kravanja and M. Bogataj, Elsevier, 2016, vol. 38, pp. 2391–2396 Search PubMed.
- A. Agarwal, L. T. Biegler and S. E. Zitney, Ind. Eng. Chem. Res., 2009, 48, 2327–2343 CrossRef CAS.
- K. T. Leperi, D. Yancy-Caballero, R. Q. Snurr and F. You, Ind. Eng. Chem. Res., 2019, 58, 18241–18252 CrossRef CAS.
- R. F. Zheng, D. Barpaga, P. M. Mathias, D. Malhotra, P. K. Koech, Y. Jiang, M. Bhakta, M. Lail, A. V. Rayer, G. A. Whyatt, C. J. Freeman, A. J. Zwoster, K. K. Weitz and D. J. Heldebrant, Energy Environ. Sci., 2020, 13, 4106–4113 RSC.
- Global CCS Institute, Accelerating the Uptake of CCS: Industrial Use of Captured Carbon Dioxide, 2011.
- C. A. Grande, ISRN Chem. Eng., 2012, 982934 Search PubMed.
- C. C. S. Reddy, in Chemical Process Retrofitting and Revamping, 2016, pp. 19–56 Search PubMed.
- G. H. Graaf, E. J. Stamhuis and A. A. C. M. Beenackers, Chem. Eng. Sci., 1988, 43, 3185–3195 CrossRef CAS.
- K. M. V. Bussche and G. F. Froment, J. Catal., 1996, 161, 1–10 CrossRef.
- P. Kaiser, R. B. Unde, C. Kern and A. Jess, Chem. Ing. Tech., 2013, 85, 489–499 CrossRef CAS.
- C. G. Visconti, L. Lietti, E. Tronconi, P. Forzatti, R. Zennaro and E. Finocchio, Appl. Catal., A, 2009, 355, 61–68 CrossRef CAS.
- J. Baltrusaitis and W. L. Luyben, ACS Sustainable Chem. Eng., 2015, 3, 2100–2111 CrossRef CAS.
- Y. Lim, C.-J. Lee, Y. S. Jeong, I. H. Song, C. J. Lee and C. Han, Ind. Eng. Chem. Res., 2012, 51, 4982–4989 CrossRef CAS.
- K. Hornik, M. Stinchcombe and H. White, Neural Networks, 1989, 2, 359–366 CrossRef.
- IECM, Integrated Environmental Control Model (IECM) Version 11.4 (Carnegie Mellon University), https://www.cmu.edu/epp/iecm/index.html, accessed: 2020-08-01.
- Dymola. This software is currently maintained and distributed by Dassault Systems. https://www.3ds.com/products-services/catia/products/dymola/.
- Z. Hao, C. Zhang and A. A. Lapkin, AIChE J., 2021, e17616 Search PubMed.
- P. Brandl, M. Bui, J. P. Hallett and N. Mac Dowell, Int. J. Greenhouse Gas Control, 2021, 105, 103239 CrossRef CAS.
- B. Bao, M. M. El-Halwagi and N. O. Elbashir, Fuel Process. Technol., 2010, 91, 703–713 CrossRef CAS.
- S. A. Al-Sobhi, A. Elkamel, F. S. Erenay and M. A. Shaik, Energies, 2018, 11, 362 CrossRef.
- K.-S. Ha, J. W. Bae, K.-J. Woo and K.-W. Jun, Environ. Sci. Technol., 2010, 44, 1412–1417 CrossRef CAS PubMed.
- A. A. Kiss, J. J. Pragt, H. J. Vos, G. Bargeman and M. T. de Groot, Chem. Eng. J., 2016, 284, 260–269 CrossRef CAS.
- AspenTech, Aspen Plus Methanol Synthesis Model, 2018. The methanol synthesis model can be downloaded from esupport.aspentech.com. Alternatively, for Aspen Plus V11 and higher version, the model file can be accessed in C:\Program Files\AspenTech\Aspen Plus Vxx.x\GUI\Examples\Bulk Chemical\Methanol.
- A. Zimmermann, L. Müller, Y. Wang, T. Langhorst, J. Wunderlich, A. Marxen, K. Armstrong, G. Buchner, A. Kätelhön and M. Bachmann, Techno-Economic Assessment & Life Cycle Assessment Guidelines for CO2 Utilization (Version 1.1), 2020 Search PubMed.
- M. Nicholson, T. Biegler and B. W. Brook, Energy, 2011, 36, 305–313 CrossRef.
- E. J. Sheu, E. M. A. Mokheimer and A. F. Ghoniem, Int. J. Hydrogen Energy, 2015, 40, 12929–12955 CrossRef CAS.
- Y. Sun, T. Ritchie, S. S. Hla, S. McEvoy, W. Stein and J. H. Edwards, J. Nat. Gas Chem., 2011, 20, 568–576 CrossRef CAS.
- H. Von Storch, S. Becker-Hardt and C. Sattler, Energies, 2018, 11, 2537 CrossRef.
- Z. Li, Q. Lin, M. Li, J. Cao, F. Liu, H. Pan, Z. Wang and S. Kawi, Renewable Sustainable Energy Rev., 2020, 134, 110312 CrossRef CAS.
- A. S. Bambal, V. S. Guggilla, E. L. Kugler, T. H. Gardner and D. B. Dadyburjor, Ind. Eng. Chem. Res., 2014, 53, 5846–5857 CrossRef CAS.
- D. Weisser, Energy, 2007, 32, 1543–1559 CrossRef CAS.
Footnote |
| † Electronic supplementary information (ESI) available. See DOI: https://doi.org/10.1039/d1ee03923g |
| This journal is © The Royal Society of Chemistry 2022 |

