
 Open Access Article
 This Open Access Article is licensed under a
 Creative Commons Attribution 3.0 Unported Licence
Identification and manipulation of dynamic active site deficiency-induced competing reactions in electrocatalytic oxidation processes†
Runjia
Lin
 a,
Liqun
Kang
b,
Tianqi
Zhao
a,
Jianrui
Feng
c,
Veronica
Celorrio
d,
Guohui
Zhang
e,
Giannantonio
Cibin
d,
Anthony
Kucernak
e,
Dan J. L.
Brett
b,
Furio
Corà
a,
Ivan P.
Parkin
a and
Guanjie
He
*abf
a,
Liqun
Kang
b,
Tianqi
Zhao
a,
Jianrui
Feng
c,
Veronica
Celorrio
d,
Guohui
Zhang
e,
Giannantonio
Cibin
d,
Anthony
Kucernak
e,
Dan J. L.
Brett
b,
Furio
Corà
a,
Ivan P.
Parkin
a and
Guanjie
He
*abf
aChristopher Ingold Laboratory, Department of Chemistry, University College London, 20 Gordon Street, London WC1H 0AJ, UK. E-mail: g.he@ucl.ac.uk
bDepartment of Chemical Engineering, University College London (UCL), London, WC1E 7JE, UK
cKey Laboratory of Advanced Energy Materials Chemistry (Ministry of Education) and the Tianjin Key Lab and Molecule-based Material Chemistry, College of Chemistry, Nankai University, Tianjin 300071, China
dDiamond Light Source Ltd, Diamond House, Harwell Campus, Didcot, OX11 0DE, UK
eDepartment of Chemistry, Imperial College London, South Kensington Campus, London SW7 2AZ, UK
fSchool of Chemistry, University of Lincoln, Brayford Pool, Lincoln, LN6 7TS, UK
First published on 21st March 2022
Abstract
Electrocatalytic organic compound oxidation reactions (OCORs) have been intensively studied for energy and environmentally benign applications. However, relatively little effort has been devoted to developing a fundamental understanding of OCORs, including the detailed competition with side reactions and activity limitations, thus inhibiting the rational design of high-performance electrocatalysts. Herein, by taking the NiWO4-catalysed urea oxidation reaction (UOR) in aqueous media as an example, the competition between the OCOR and the oxygen evolution reaction (OER) within a wide potential range is examined. It is shown that the root of the competition can be ascribed to insufficient surface concentration of dynamic Ni3+, an active site shared by both the UOR and OER. A similar phenomenon is observed in other OCOR electrocatalysts and systems. To address the issue, a “controllable reconstruction of pseudo-crystalline bimetal oxides” design strategy is proposed to maximise the dynamic Ni3+ population and manipulate the competition between the UOR and the OER. The optimised electrocatalyst delivers best-in-class performance and an ∼10-fold increase in current density at 1.6 V versus the reversible hydrogen electrode for alkaline urea electrolysis compared to those of the pristine materials.
Broader contextElectrocatalytic oxidation processes such as the oxygen evolution reaction (OER) are particularly critical for harvesting and utilising renewable energy. Despite enormous efforts, the inherently sluggish OER raises concerns towards the industrialization of electrochemical-based technologies. Electrocatalytic organic compound oxidation reactions (OCORs) have been intensively studied due to their lower overpotentials and capability to decompose organic pollutants. Though significant efforts have been made for advancing the performance (onset potential and oxidation current) of OCORs, understanding of their mechanism is still limited. Importantly, a majority of OCORs share the potential window and/or catalyst design principles with the OER, which will result in a detrimental competition. Here, we discover the existence of a competition between the urea oxidation reaction (UOR) and the OER which gives rise to a current cut-off during electrocatalytic process governed by NiWO4-based catalysts. Through experiments, computational calculations and operando observations, the low concentration of dynamic Ni3+ is identified as the root cause. A controllable pre-activation approach is proposed to create abundant, recyclable and dynamic active sites, and dislocate the potential window of the UOR/OER by modifying the binding strengths of the reaction intermediates. Consequently, the UOR/OER performance saturation can be avoided, leading to an increased UOR performance. Furthermore, similar phenomena were observed in methanol and ethanol oxidation reactions. |
Introduction
Promoting the transition of global energy consumption from fossil fuels to a renewable energy-dominated pattern requires replacing traditional fuel utilisation devices with novel energy storage and conversion technologies.1–3 The development of advanced electrocatalytic oxidation processes is particularly critical for improving the utilization of renewable energy.4,5 The most widely investigated anodic reaction is the oxygen evolution reaction (OER). Despite enormous efforts, the inherently sluggish OER kinetics requires excessive overpotentials to drive water electrolysers for hydrogen production.6 In addition, the low economic value of O2 compared to that of H2 limits the overall benefit of the water splitting process. To address these issues, organic compound oxidation reactions (OCORs), such as urea, methanol and ethanol oxidation reactions (UOR, MOR, and EOR), that require lower overpotentials and are competent to break down organic pollutants from agricultural/industrial/domestic/aerospace wastes, have been proposed and have achieved considerable progress in terms of electrocatalyst design.7,8 Though several thought-provoking studies have expanded the discussion of OCORs beyond the comparison of current densities and onset potentials to mechanistic studies (i.e. reaction products and rate-limiting step),9–12 the understanding of reaction selectivity, dynamic active sites/catalyst interfaces and activity limitations is still unclear and requires further comprehensive exploration. Importantly, a majority of OCORs share the potential window and/or catalyst design principles with the OER, which may result in a detrimental competition. Exploring detailed catalytic mechanisms of OCORs, especially when the applied potential is in the conventional OER zone, can open the possibility of rational and efficient design of new anodic reaction electrocatalysts.The conventional electrocatalyst design strategy established on the assumption of a static electrolyte/electrode interface has recently been challenged by the discovery of materials reconstruction phenomena under operating conditions.13–15 In particular, it has been found that many metal oxide/perovskite electrocatalysts undergo a surface self-reconstruction from oxides to (oxy)hydroxides after an electrochemical treatment, wherein their catalytical activities can be boosted.16–18 However, considering the irreversibility of the surface oxyhydroxylation process (since the reconstruction can only be induced at particular circumstances, for example, leaching of metals from specific sites of the catalyst lattice structures),16 the enhanced activity, which is enabled by the oxyhydroxidized surface, is more like “a flash in the pan” when it comes to high-valence active site-consuming electrocatalytic reactions (i.e. UOR).19 Developing “renewable” high-valence species, for instance, dynamic active centres that can be “recycled” via redox reactions, is of great importance for advanced electro–oxidation processes.
Here, by correlating the dynamic phenomena between the catalytic activity and real-time product generation rate of alkaline urea electrolysis on well-designed NiWO4-tannic acid (TA) catalysts, we discover the presence of a detrimental competition between the UOR and the OER, which is responsible for a drop in the potential–current relationship within the competition zone. Operando X-ray spectroscopic investigations and theoretical simulations identify that low concentration of dynamic Ni3+ is the root cause of the detrimental OER/UOR competition. A controllable pre-activation approach is proposed consisting of electrochemical leaching of tungstate species from pseudo-crystalline NiWO4-TA hybrids to enhance (near)surface-exposed Ni active sites with excellent structural and chemical flexibility, eventually promoting the in situ formation of abundant active Ni3+ surface species. Computational calculations suggest that these dynamic Ni3+ centres decrease the UOR onset potential but increase the OER onset potential compared with that of the conventional Ni–oxyhydroxide surface. In the modified electrocatalysts, the UOR is no longer limited by the competitive OER regardless of the applied potential, which leads to a nearly 10-fold performance improvement in current density at 1.6 V vs. the reversible hydrogen electrode (RHE) over its pristine counterpart. Further experimental results suggest that the UOR/OER competition and its corresponding solutions apply to the MOR and a broad sphere of other electrocatalytic systems beyond the OCORs.
Results
Identification of the UOR/OER competition
A series of NiWO4-based catalysts were prepared; their structural, morphological and chemical information was evaluated by X-ray diffraction (XRD, ESI,† Fig. S1a), transmission electron microscopy (TEM, ESI,† Fig. S1b-i), X-ray photoelectron spectroscopy (XPS, ESI,† Fig. S2) and X-ray absorption fine structure (XAFS) spectroscopy (ESI,† Fig. S3 and S4), respectively. As pseudo-crystalized NiWO4 nanoparticles grown over TA-derived hydrochar frameworks (denoted as NiWO4-TA) showed the best electrochemical response (ESI,† Fig. S5), the dynamic electrocatalytic activity–selectivity trend for alkaline urea electrolysis was first established on this material and the results are summarised in Fig. 1.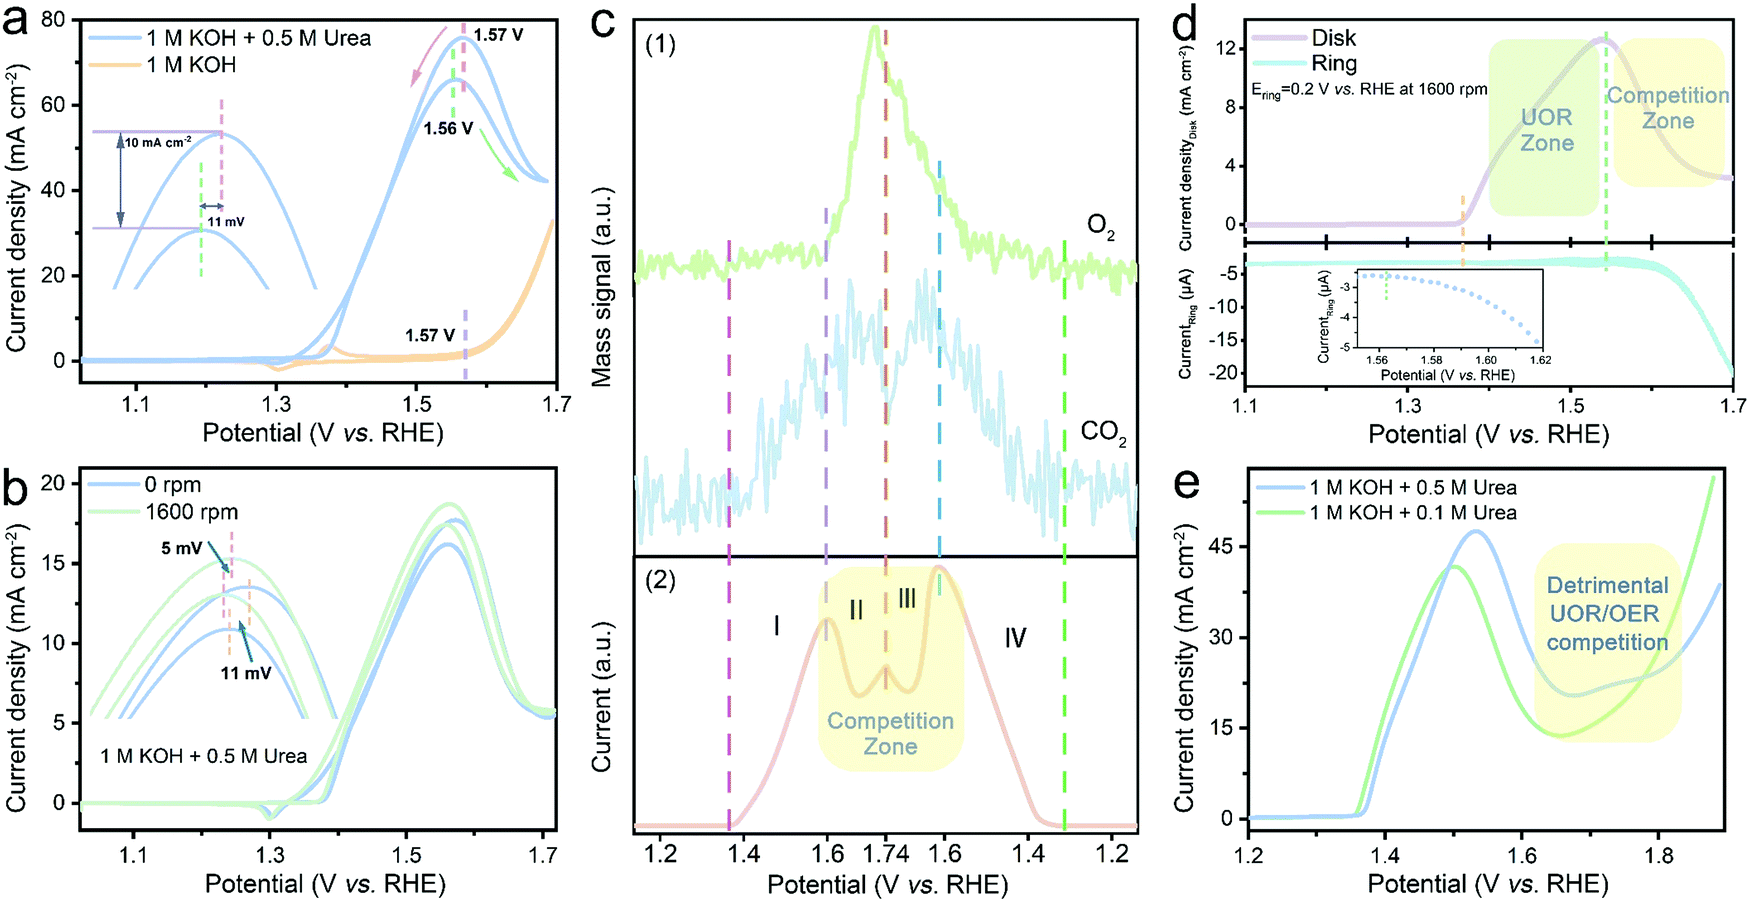 | ||
| Fig. 1 UOR/OER competition identification based on the electro-oxidation performance of the NiWO4-TA catalyst. (a) CV scan in 1 M KOH aqueous electrolyte with (blue) and without (orange) 0.5 M urea. (b) Comparison of the polarisation curves recorded in 1 M KOH + 0.5 M urea at 0 (blue) and 1600 (green) rpm, respectively. (c) (1) Operando monitoring of the representative gaseous products of OER (O2) and UOR (CO2) by RTMS and (2) the corresponding electrochemical data acquired in 1 M KOH + 0.5 M urea (scan rate: 10 mV s−1, without iR correction). (d) In situ evaluation of O2 production using RRDE, the inset is the enlarged Edisk–Icurrent plot near the boundary of UOR and competition zone (disk current was collected by linear sweep voltammetry (LSV) in 1 M KOH + 0.5 M urea electrolyte at 5 mV s−1, further information is available in the ESI,† Fig. S10). (e) LSV curves obtained in 1 M KOH with different concentrations of urea. | ||
Fig. 1a shows the electrocatalytic performance of NiWO4-TA evaluated in 1 M KOH with and without 0.5 M urea. The electro–oxidation of urea begins at ∼1.37 V vs. RHE, beyond which the oxidation current increases with the applied voltage (in the low-potential region). Surprisingly, two neighbouring ‘anodic peaks’, which are centred at ∼1.56 V vs. RHE, appear sequentially in the forward and backward scans. Accordingly, the electrolysis does not show a conventional positively-correlated potential–current relationship, thus even exhibiting inferior performance in the high-potential region. The unclear but detrimental ‘anodic peaks’ were first attributed to the redox chemistry of the catalyst; nevertheless, only a Ni2+/Ni3+ redox pair at ∼1.36 V vs. RHE can be identified in the cyclic voltammetry (CV) plot obtained in 1 M KOH, which disproves the self-oxidation of the catalysts.
Interestingly, the “anodic peaks” can also be observed when cycling NiWO4-TA in 1 M KOH in the presence of other organic compounds, for instance, methanol (ESI,† Fig. S6) and ethanol (ESI,† Fig. S7), revealing that they are most likely the consequence of OCORs. Previous reports suggest that limited mass transfer of chemical species by diffusion to the electrode could cause reactant depletion/product accumulation, thus leading to a current cut-off at a certain voltage (i.e. polarisation curves of fuel cell systems).20,21 To study the effect of mass transfer, the polarisation tests under different rotation rates of 0 and 1600 rpm were performed in 1 M KOH + 0.5 M urea (Fig. 1b and ESI,† Fig. S8); the CVs exhibit no dependence on rotation rates evidencing that the oxidation reaction is not mass transfer limited.
It is noteworthy that the ‘anodic peaks’, regardless of the test conditions, consistently appear near the onset of the OER (dashed purple lines in Fig. 1a and ESI,† Fig. S6–S8), indicating the possible existence of a competition between OCORs and OER which may trigger the undesired overall activity decay in the OER zone. Real-time mass spectrometry (RTMS) was employed to uncover the dynamic relationship of the OER and the UOR as a function of applied potential by monitoring the real-time intensity of their representative gaseous products O2 and CO2 (further information on the cell employed is available in the ESI,† Fig. S9).22 Different regions are identified, labelled as I–IV in Fig. 1c; in the region I up to 1.6 V vs. RHE, the CO2 partial pressure increases with the oxidation current and the applied voltage, while the O2 signal remains flat, suggesting that the UOR is the dominant reaction in the low-potential region. As the applied potential increases above 1.6 V (region II), an O2 intensity surge, together with a sudden drop of CO2 intensity and overall current drop, occurs simultaneously; this provides evidence for the as-proposed OER/UOR competition. The variation of gas composition and oxidation current in the sequential reverse scan (region III and IV) shows a similar pattern to that in the forward scan (region I and II), confirming that the ‘anodic peaks’ come from the UOR/OER competition. The same conclusion can be reached from the dynamic overall activity (Fig. 1d upper panel) and O2 generation rate (lower panel) evaluated using the rotation ring-disk electrode (RRDE) system. No O2 can be detected by the ring electrode prior to the emergence of the ‘anodic peak’; the in situ collection of disk-generated O2 by the ring electrode begins at ∼1.56 V vs. RHE (the inset in Fig. 1d) where the activity cut-off takes place (∼1.55 V vs. RHE), which agrees with the RTMS results.
To manipulate the kinetics of the OER and the UOR and adjust their competing pattern, electrochemical tests were performed in electrolytes containing various concentrations of the reactants (ESI,† Note 1). Fig. S11 and S12 in the ESI† reveal that a higher OH− concentration leads not only to more vigorous UOR and OER kinetics but also higher UOR/OER competition. Similarly, as demonstrated in Fig. 1e, the increase of urea concentration leads to a more sluggish electrochemical response in the competition zone, suggesting that the mitigation of the UOR/OER competition cannot be accomplished via a straightforward reactant concentration manipulation strategy. The results presented above clearly show that the OER is a strong competitor of the UOR under a wide range of conditions. This competition likely leads to a deterioration of performance of the overall catalytic system. Although the impact of the OER in OCOR electrolysis has been mentioned in previous reports,23–25 a comprehensive explanation of the origin of the detrimental competition and a feasible resolution are still uncharted which demands further investigation.
Correlating dynamic Ni active sites with UOR/OER competition
The next step attempted to explore and resolve the origin of the UOR/OER competition and advance the catalyst design. As can be inferred from Fig. 2a, the electrochemical behaviour of the NiWO4-TA catalyst, specifically its Ni2+/Ni3+ transition peak and OER activity, evolves dramatically after CV cycling in 1 M KOH. The urea electrolysis performance improves in tandem with electrochemical aging, evidenced by the UOR onset shifting to lower potentials and dramatically enhanced oxidation current densities (Fig. 2b). More interestingly, there is no current collapse noticed in LSVs of the extensively-cycled samples (NiWO4–TA200![[thin space (1/6-em)]](https://www.rsc.org/images/entities/char_2009.gif) or950), highlighting a profoundly transformed OER–UOR interrelationship occurring on the aged electrocatalyst. It is worth mentioning that the urea electrolysis activity of NiWO4–TAx stabilises as the number of CV cycles (x) exceeds 950 (ESI,† Fig. S13). A similar trend can also be observed for other as-synthesised NiWO4-based catalysts but with different evolution momentum due to the variation in crystallinity which will be discussed in detail later (ESI,† Fig. S46–S54).
or950), highlighting a profoundly transformed OER–UOR interrelationship occurring on the aged electrocatalyst. It is worth mentioning that the urea electrolysis activity of NiWO4–TAx stabilises as the number of CV cycles (x) exceeds 950 (ESI,† Fig. S13). A similar trend can also be observed for other as-synthesised NiWO4-based catalysts but with different evolution momentum due to the variation in crystallinity which will be discussed in detail later (ESI,† Fig. S46–S54).
 | ||
| Fig. 2 Root cause identification and resolution exploration for UOR/OER competition. (a and b) LSVs of NiWO4–TAx (x represents the number of CV cycle treatment conducted in 1 M KOH before the water or urea electrolysis test) evaluated in (a) 1 M KOH and (b) 1 M KOH + 0.5 M urea. (c) (1) Operando monitoring of the representative gaseous products of the NiWO4–TA950-catalysed OER (O2) and UOR (CO2) by RTMS and (2) the corresponding electrochemical data acquired in 1 M KOH + 0.5 M urea (scan rate: 10 mV s−1, without iR correction). (d) Comparison of the adsorption chemistry of urea and *OH over the NiOOH (001) surface at different applied potentials and free energy diagram of the OER over the NiOOH (001) surface at potentials of 0 (purple), 0.404 V (green) and 0.87 V (pink) vs. normal hydrogen electrode (NHE). | ||
According to previous literature trace amount of Fe ions in the electrolyte could participate in the surface reconstruction of (oxy)hydroxide materials, which consequently influenced the catalytic behaviour.26,27 To explore this possibility, a control experiment was conducted and the results shown in Fig. S14, ESI† suggest that the influence from trace Fe ions (in the electrolyte) can be ignored in this work. The disappearance of the current collapse phenomenon was then assigned to the ever-increasing OER activity that is eventually capable of compensating the UOR current cut-off. However, as shown in Fig. S15 ESI,† the current density difference between the urea and water electrolysis systems widens with the pre-activation degree of the catalysts, which rules out the role of OER activity increase as a cause for the disappearance of the current cut-off. Considering the pronounced electrochemical behaviour transformation of NiWO4–TA950 compared to that of NiWO4–TAPristine, it is important to unravel an updated UOR–OER relationship to explain the quasi-exponential LSV curve of urea electrolysis (Fig. 2b). RTMS was performed, and the outcome is displayed in Fig. 2c. Surprisingly, the partial pressure of CO2 shows a direct correlation with the applied potential throughout the scan, which differs greatly from the results shown in Fig. 1c for the pristine catalyst. In addition, the detection of O2 at high potential confirms the contribution of the OER to the overall oxidation current. The CO2/O2 intensity variation observed for NiWO4–TA950 allows us to emphasize two important features of the activated catalyst: first, the UOR escapes the influence of the OER, thus avoiding the current collapse; second, the UOR and OER coexist rather than being mutually exclusive.
To explain the evolved UOR/OER relationship, attention was then directed to the in situ Ni chemistry of NiWO4–TAx. As presented in Fig. S16, ESI,† a clear enhancement of the redox peak at ∼1.34 V vs. RHE assigned to Ni2+/3+ oxidation upon cycling can be witnessed. This indicates an increased concentration of redox-active Ni (that is referred to as dynamic Ni3+), which is a cause for the enhanced activity. In other words, the root of the UOR/OER saturation can be attributed to the insufficient concentration of dynamic Ni3+ active sites. To establish a comprehensive understanding of the relationship between Ni3+, UOR and OER, density functional theory (DFT) calculations were carried out to determine the adsorption energy of several key UOR/OER intermediates on NiOOH whose (001) plane is regarded as a representative Ni3+-rich model for catalytic studies (even though calculations on NiWO4 performed here indicated that the actual dynamic Ni coordination in our pristine/aged catalysts may be more complex).28,29 As illustrated in Fig. 2d and in the ESI,† Note S2, Fig. S17, the adsorption energy of urea on NiOOH is calculated to be −0.49 eV which is much lower than that of *OH under moderate bias. Accordingly, the influence of the OER on the oxidation of urea by Ni3+ is negligible. However, as the applied potential further increases, *OH gradually takes a more favourable position over urea in terms of occupying Ni3+ sites, resulting in a Ni3+ ‘crisis’ for UOR. The Ni3+ deficiency problem is further exacerbated by the sluggish OER kinetics, especially the elementary step (*OH → *O). In other words, *OH effectively ‘poisons’ the Ni3+ active sites by preferentially absorbing but slowly reacting with them. Subsequently, a UOR current cut-off occurs due to the limited number of Ni3+ sites left available for urea molecules. On the other hand, the saturation of redox-active Ni at the basis of the UOR/OER competition can be avoided, should the concentration of dynamic Ni3+ be increased.
Operando measurement of the Ni oxidation state
To verify the role of Ni3+ in the OER and the UOR, operando X-ray absorption near edge structure (XANES) measurements were performed (further information on the experiment setup is available in Fig. S18, ESI†). As presented in Fig. 3a and Fig. S19a, ESI,† during the OER of aged electrodes in KOH, accumulation of Ni3+ becomes noticeable from ∼1.45 V vs. RHE in the anodic scan, and the Ni3+ concentration remains high (∼20%) at higher applied voltages. The positive Ni3+ composition-applied potential relationship suggests the formation rate of high valence Ni is higher than its consumption rate (by the OER). The accumulated Ni3+ sites can be classified into two categories: those occupied by OER intermediates, and those that remain unoccupied. In the presence of urea, the latter Ni3+ sites are able to catalyse the UOR, thus preventing the current collapse in the OER zone. According to Fig. 3b and Fig. S19b, ESI,† the signal of Ni3+ species is nearly negligible throughout the entire urea electrolysis scan, indicating the consumption of the ‘free’ Ni3+ by the UOR. Contrarily, owing to its inactive Ni redox chemistry, only a trace amount of Ni3+ can be found during the OER of the pristine catalyst (ESI,† Fig. S20a and S21a). Accordingly, a limited amount of unoccupied Ni3+ is available for the UOR, leading to the current collapse (ESI,† Fig. S20b and S21b). The observed operando XANES results validate the hypothesis that dynamic Ni3+ species are shared active sites for both OER and UOR and their deficiency causes the observed OER/UOR competition. It is noteworthy that no noticeable change can be found in the W L3-edge XANES spectra for both pristine and aged electrodes during either water or urea oxidation electrolysis (ESI,† Fig. S22 and S23) which suggests that W retains the original W6+ in the octahedral WO6 coordination structure in the bulk structure throughout the electrocatalytic cycle.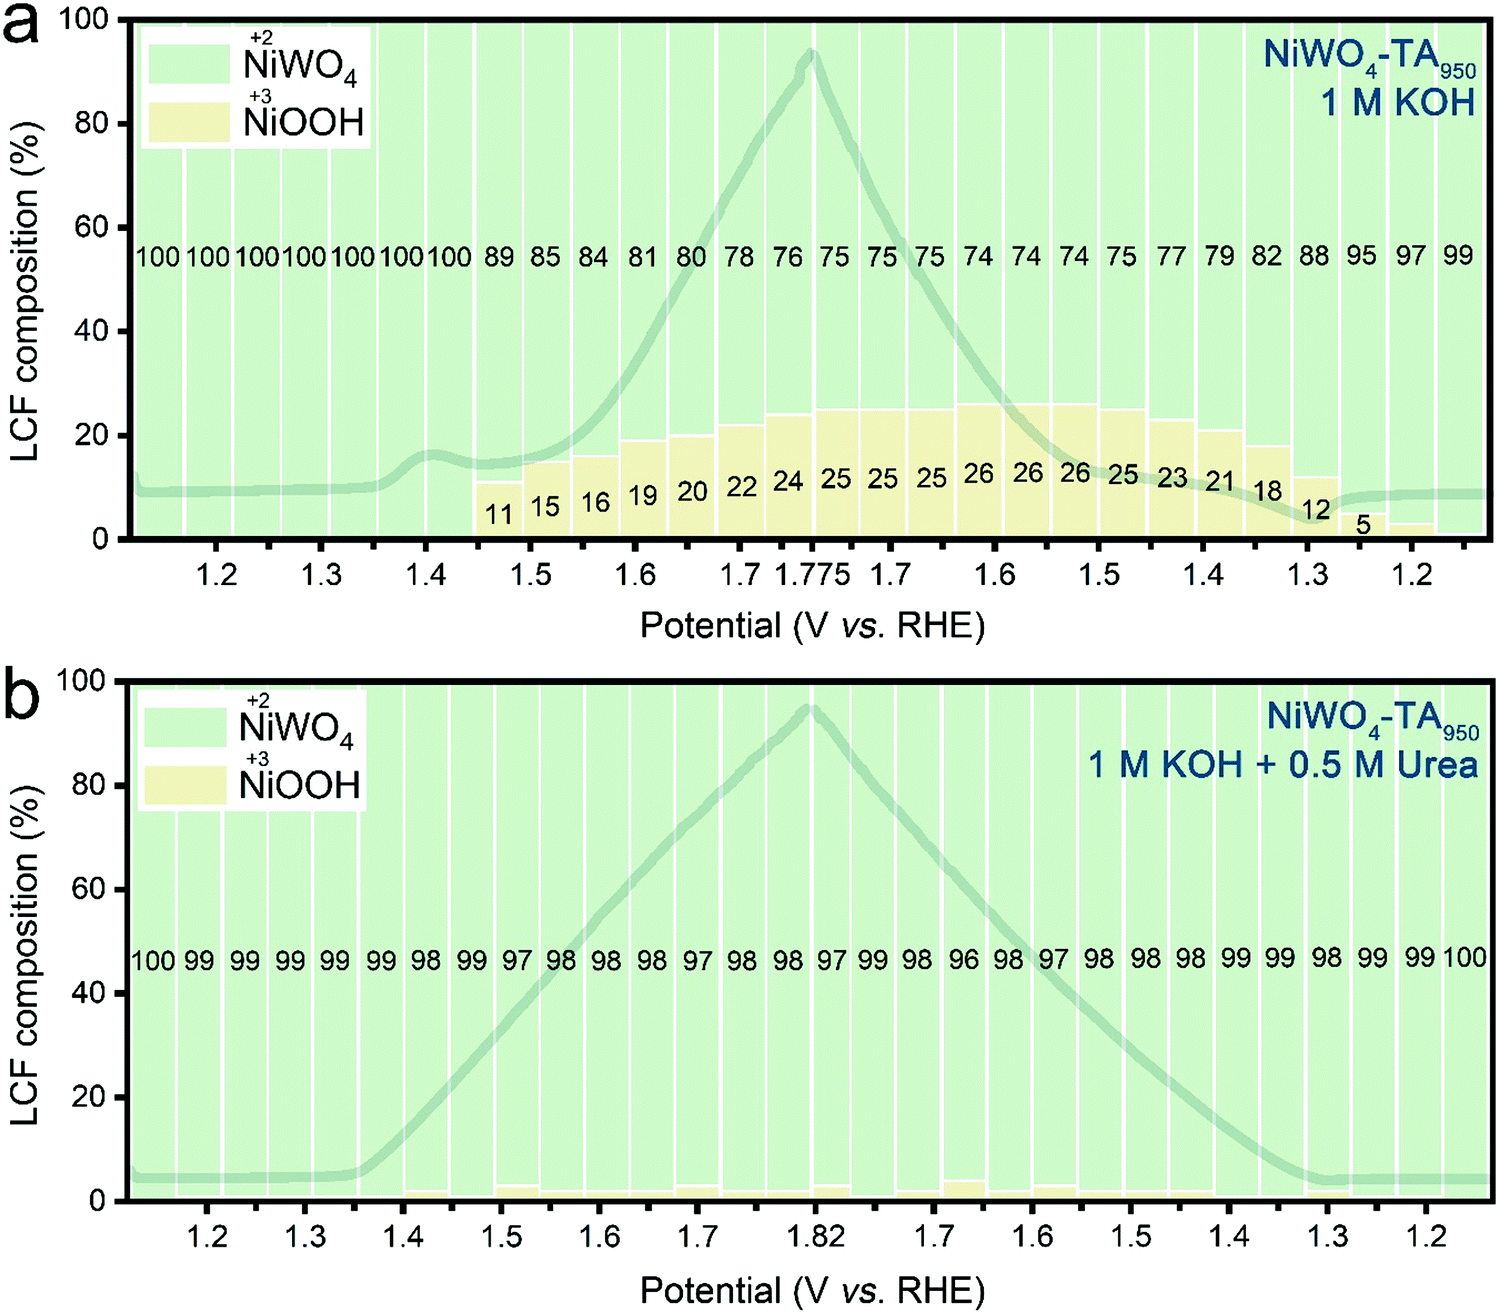 | ||
| Fig. 3 Operando monitoring of the Ni oxidation state of NiWO4–TA950 during water and urea electrolysis. Linear combination fitting (LCF) results of Ni K-edge XANES spectra of NiWO4–TA950 under operando conditions in (a) 1 M KOH and (b) 1 M KOH + 0.5 M urea. The dark lines in the background are the corresponding LSVs without iR correction. | ||
Due to flexible Ni chemistry, NiWO4–TA950 exhibits an ultra-high urea electrolytic activity (∼10 times higher current density compared to commercial RuPt/C at 1.6 V vs. RHE), favourable kinetics (a low Tafel slope of 26.4 mV dec−1) and outstanding urea utilization capability (ESI,† Fig. S24 and S25). More importantly, our findings are also applicable to methanol electrolysis and ethanol electrolysis (ESI,† Fig. S26 and S27) and could be extended to improve the activity and selectivity of other heterogeneous catalytic processes.
Identification of morphological and coordination chemistry alteration upon cycling
To support the rational design strategy of new anode catalysts, it is vital to unravel the reasons that lead to the enhanced population of dynamic Ni3+ active sites in NiWO4–TA950. Earlier studies suggest that Ni-based (hydro)oxide might undergo an irreversible surface amorphization into Ni3+-rich oxyhydroxides under alkaline conditions, thus exhibiting enhanced activities. To examine changes in the morphology of the aged catalyst, high-angle annular dark-field scanning transmission electron microscopy (HAADF-STEM) was performed. As confirmed by the amorphous phase highlighted in the green dot area in Fig. 4a, an oxyhydroxide layer forms after electrochemical treatment,16,30,31 revealing that NiOOH is likely to be one of the sources of Ni3+. However, electrochemical data displayed in Fig. S28, ESI,† suggests that the contribution of surface oxyhydroxide species to the overall activity of the reconstructed catalyst is almost negligible and non-renewable. It is worth mentioning that surface reconstruction generally takes place only in the first few CV cycles which can be proved by the gradually weakened pseudocapacitive behaviour (ESI,† Fig. S29). However, our observation suggests that no obvious catalytic behaviour alterations of NiWO4–TA can be witnessed until at least dozens or even hundreds of CV cycles have been conducted, indicating the reconstructed NiOOH layer is not a major Ni3+ contributor. It has been recently reported that electrochemical leaching of metal species from bulk structures could create pores and boost the electrochemical surface area (ECSA) of the electrode, thus improving the catalytic performance.32,33 The selective leaching of one element in multicomponent oxides can also alter the surface composition and chemistry. To detect any possible metal leaching, inductively coupled plasma-atomic emission spectroscopy (ICP-AES) measurements were performed on the electrolyte upon cycling (ESI,† Fig. S30) and demonstrated constant leaching of W cations while the release of Ni cations into solution was negligible. In addition, ex situ energy dispersive X-ray spectroscopy (EDS) and XPS results show a reduction in W population in aged samples (Fig. 4b and ESI,† Fig. S31, S32) which agree with the ICP-AES result. The ECSA of the aged catalyst shows a considerable increase (ESI,† Fig. S33 and S34e) which might eventually lead to its more vigorous Ni redox peaks. In other words, the flexible Ni chemistry of the aged samples can be attributed to their enlarged ECSA which accordingly provides more active sites. However, the as-discussed ECSA-enlarging hypothesis is not able to explain the gradually increased dynamic Ni3+ formation ability per ECSA (denoted as MPENi) for NiWO4-TAx catalysts (ESI,† Fig. S34f) as MPENi is mainly governed by the active site type and density on the electrode rather than its ECSA, hence should remain stable. Therefore, the most decisive reason behind the enhanced Ni redox chemistry still remains unclear with no convincing explanation from previous studies.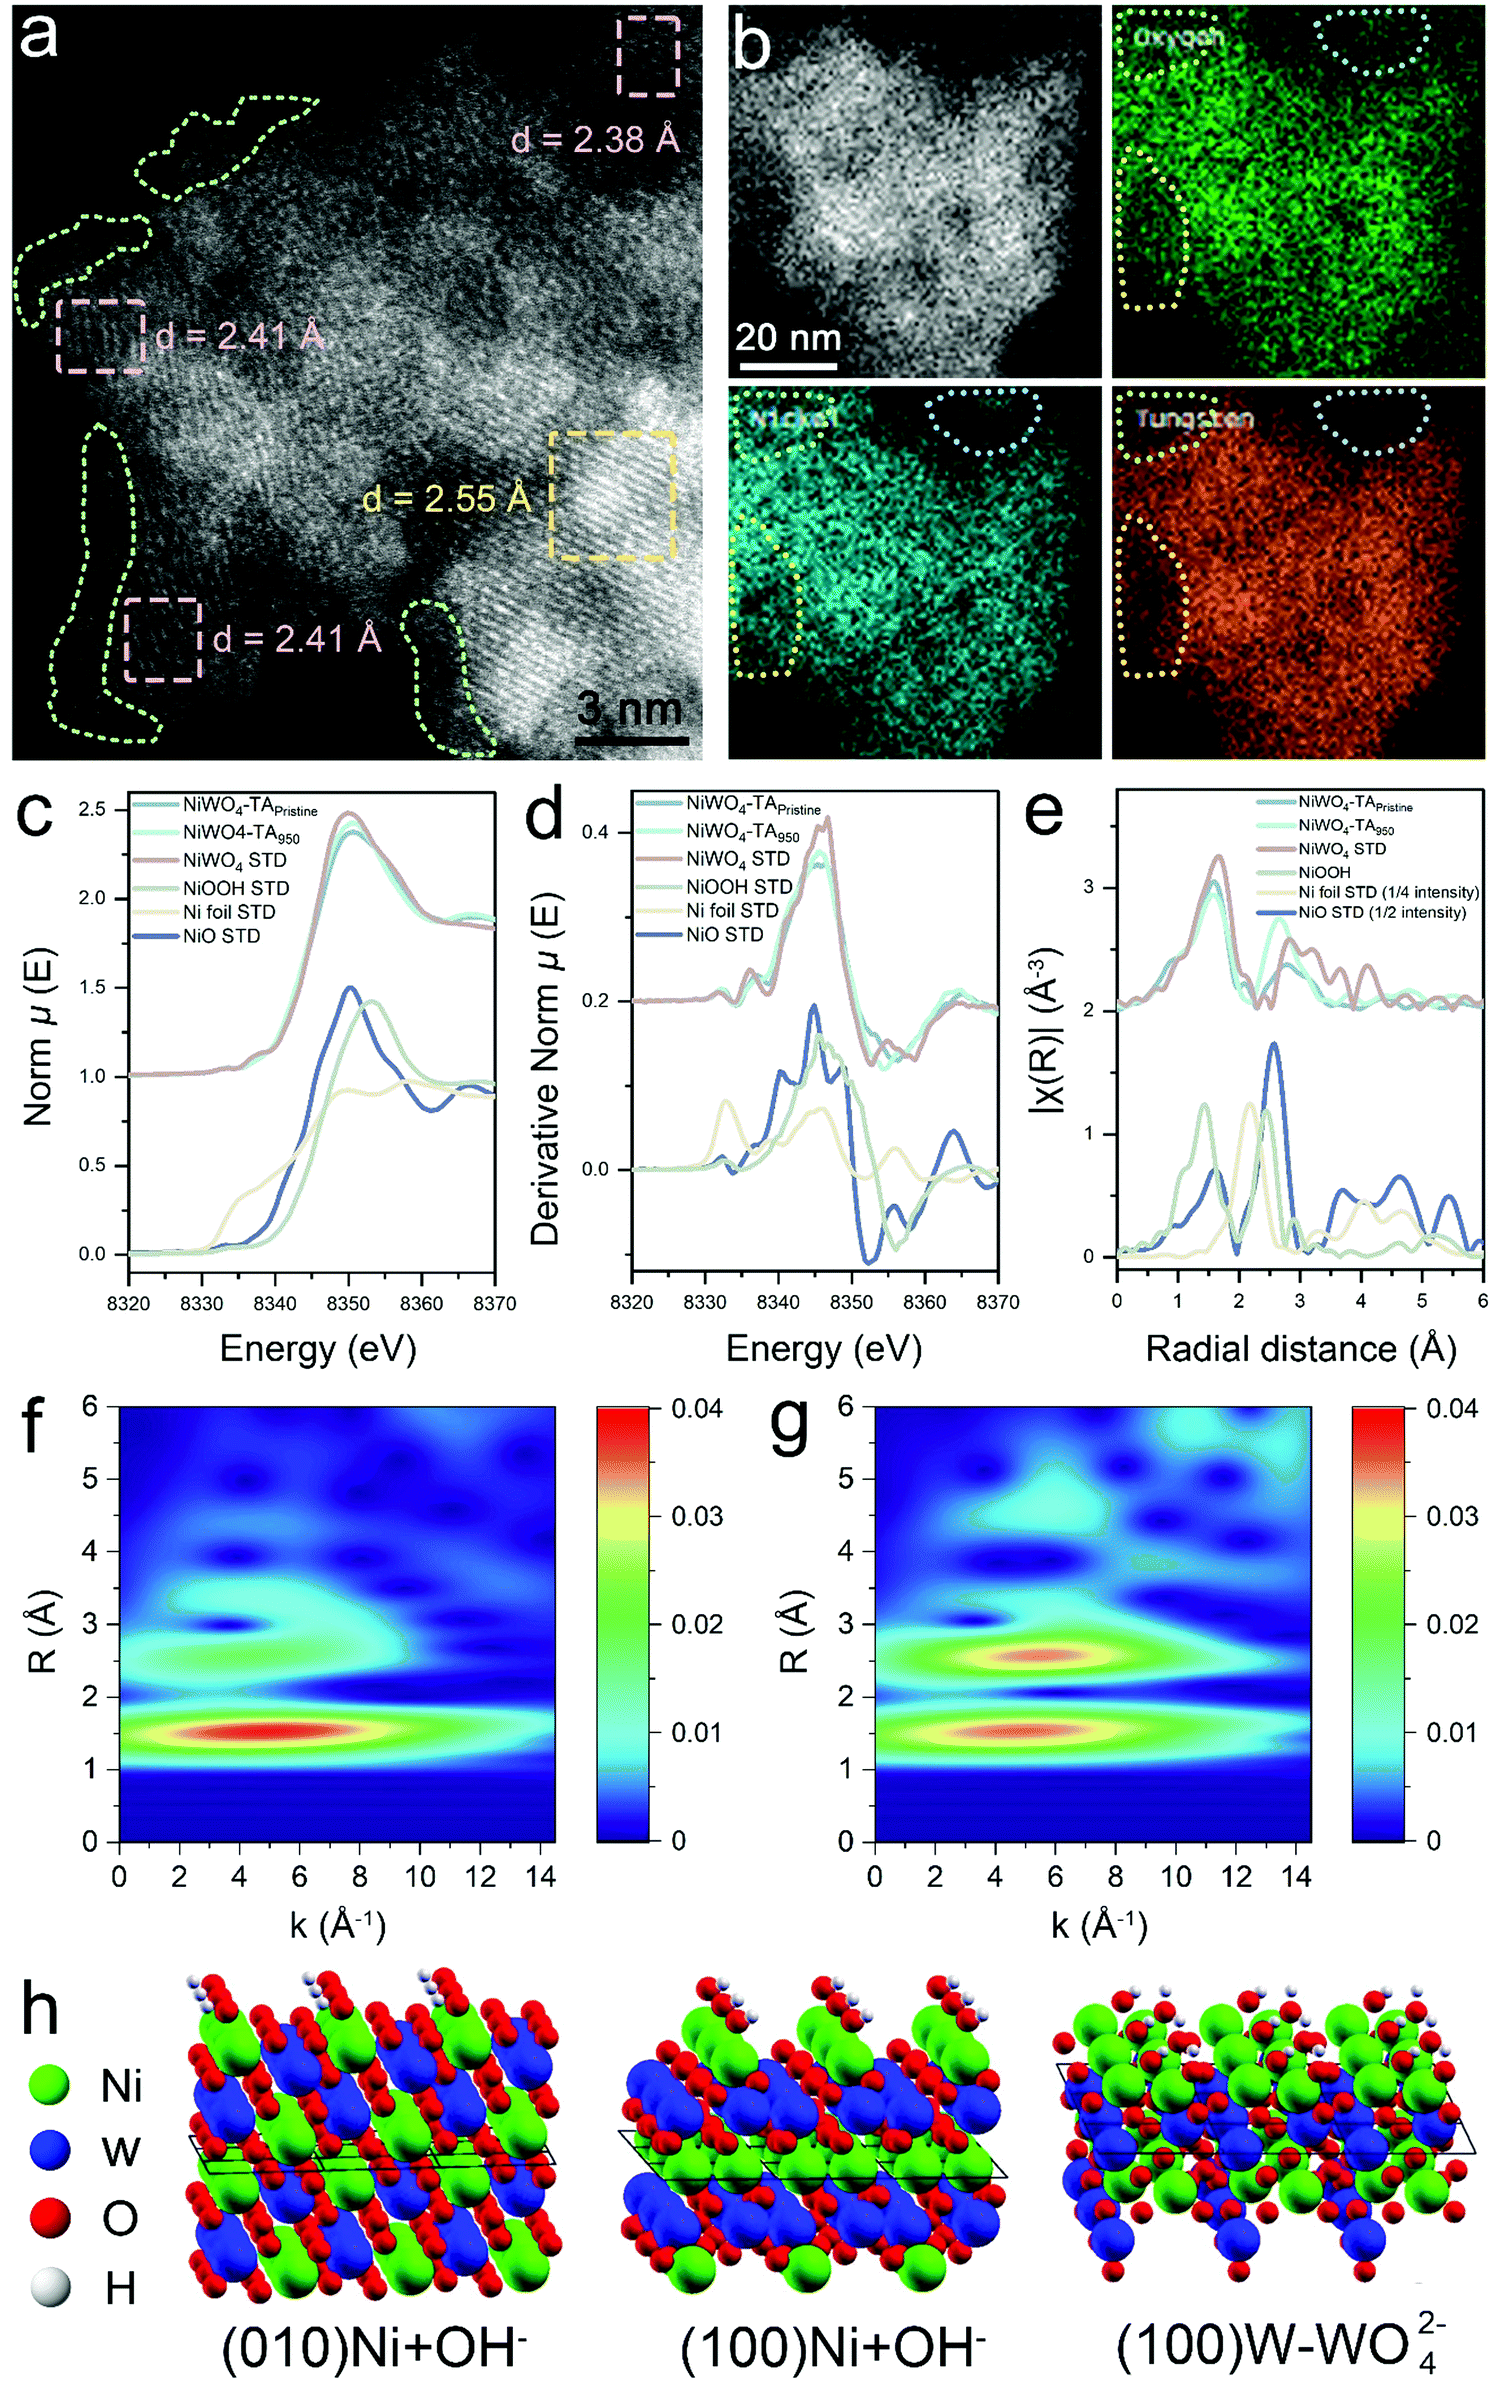 | ||
| Fig. 4 Clarification of the morphological and coordination chemistry evolution after cycling. (a) HAADF-STEM image and (b) EDS mapping of NiWO4–TA950. Ni K-edge (c) XANES, (d) derivative XANES and (e) k2-weighted R-space EXAFS of NiWO4–TApristine, NiWO4–TA950, commercial NiWO4, commercial NiO, commercial NiOOH and commercial Ni foil. (f and g) Ni K-edge k2-weighted wavelet transform-extended X-ray absorption fine structure spectra of (f) NiWO4-TAPristine and (g) NiWO4-TA950. (h) Optimised Ni-terminated (010) and (100) surfaces with OH− adsorption, and NiWO-W (100) surface obtained by WO42− leaching from the W-terminated (100) surface. | ||
To evaluate the precise morphological and coordination chemistry changes between the pristine and cycled NiWO4-TA catalyst, ex situ EXAFS was performed. As shown in Fig. 4c–g and Fig. S35, ESI,† the coordination environment of Ni has changed significantly after cycling, with nearly the same first shell coordination but a much stronger second shell coordination. Further fitting results confirmed that Ni maintained its 6-O coordination in the first shell after activation, but the second shell Ni–W coordination number (C.N.) decreased from 4.0 to 2.7 while the Ni–Ni C.N. increased from 2.0 to 4.9. This is the direct evidence of aggregation of Ni species or formation of a Ni-rich phase. Such a reconstructed phase whose interplane spacing greatly differs from that of the pristine NiWO4 (002) plane, can be identified in the STEM image in Fig. 4a (highlighted as a pink dot area). However, negligible changes can be observed in the W L3-edge EXAFS spectra of pristine and activated NiWO4, even in the wavelet transform-extended X-ray absorption fine structure (WT-EXAFS) (ESI,† Fig. S36 and S37), indicating that W in the bulk structure of the activated sample retains its original structure as in the pristine sample (highlighted as a yellow dot area in Fig. 4a). Density of states analysis shown in Fig. S38, ESI,† indicates a higher degree of electron delocalisation in the cycled sample. Based on our experimental observations, it is believed that the formed Ni-rich phase outer layer is responsible for the flexible Ni chemistry of NiWO4–TA950. Moreover, the amorphous oxyhydroxide surface layer promotes interphase ion transport (ESI,† Fig. S39), and the enlarged ECSA also contribute to the enhanced catalytic performance of the reconstructed catalyst. Control experiments suggest this unique structure cannot be created without the leaching of W (ESI,† Fig. S40).
To elucidate the W leaching and formation of Ni-rich phases, further DFT calculations were performed on NiWO4 surfaces (ESI,† Note 3). Calculated surface energies indicate that a W rich termination is stable over Ni exposed ones for (100) and (010) surfaces in vacuum, representative of the pristine catalyst (ESI,† Fig. S41). In contact with the highly alkaline 1 M KOH electrolyte, oxidation of the surface Ni2+ to Ni3+ and concurrent adsorption of one additional hydroxide ion was calculated as exothermic, leading to oxidized Ni3+(OH) surfaces being the stable terminations of the catalyst (Fig. 4h). W leaching as tungstate ions (WO42−) from the W-terminated (100) face in an alkaline environment, yielding new Ni(OH) terminations (denoted as the NiWO-W (100) surface, ESI,† Fig. S42), was predicted to be endothermic, but facilitated by the high hydration energy of the doubly negative tungstate ions. Leaching may therefore be expected to occur as a slow, irreversible process. Should all surface Ni be oxidized to the 3+ state and hydroxylated, the surface formation energy for both (010) and (100) surfaces is calculated as negative, suggesting that additional surfaces are generated and the exposed surface area increases upon cycling. Such a process, although energetically feasible is likely to require high activation barriers, hence a large number of CV cycles are needed for it to take place, consistent with the experimental observations. It is worth pointing out that W species, regardless of being leached or preserved, remain at the 6+ oxidation state throughout the cycling process (ESI,† Fig. S43). Assuming the dynamic Ni3+ active site in the near-surface region of the activated sample under operation conditions possesses similar coordination to its hydroxidized outer layer structure under static conditions (considering that the adsorption of additional hydroxide ions is the most reasonable explanation for the evolution of the reconstructed near-surface Ni(II)-rich structure to a dynamic Ni(III)-based coordination even though redox chemistry on the near-surface region may be more complex), we then evaluated the adsorption chemistry of the key UOR/OER intermediates on the NiWO-W (100) surface (ESI,† Fig. S44). Similar to the results obtained on the NiOOH (001) surface (Fig. 2d), urea dominates the NiWO-W (100) surface under moderate bias while *OH gradually takes lead in occupying the reconstructed surface with the increase in the applied potential. The UOR process is thermodynamically favourable on both surfaces (ESI,† Fig. S45). It is worth mentioning that the NiWO-W (100) surface exhibits a much lower urea adsorption energy (−1.12 eV) and a higher OER onset (0.991 V vs. NHE) compared to those of the NiOOH (001) surface (Gad = −0.49 eV, Uonset = 0.87 V vs. NHE). In other words, the NiWO-W (100) surface better dislocates the potential window of the UOR and the OER than the NiOOH (001) surface, thus mitigating the possibility of the saturation of redox-active Ni by the OER and the UOR. Though complete suppression of the OER at the high-potential region has still not been accomplished due to the adsorptive nature of OH* (at the high-potential region, as confirmed by the simulation results in this work and previous literature25), the postponed OER and advanced UOR on the NiWO-W (100) surface open the possibility of dislocating the UOR/OER by tuning the electronic structures of the catalysts, accordingly modifying the binding strengths of the reaction intermediates.
Control of W leaching kinetics
It is worth mentioning that these series of NiWO4 materials exhibit different W leaching kinetics which can possibly be ascribed to the variation of their crystallinities. As shown in Fig. S46–S51, ESI,† the materials with higher crystallinity exhibit a more sluggish and limited leaching process, pointing to the hypothesis that crystallinity and W leaching kinetics show a negative correlation. Moreover, it is believed that the leaching of W could be accelerated if an electrically conductive and large-surface-area substrate is employed to support the bimetal oxides (ESI,† Fig. S52–S54). The metal leaching chemistry is also related to crystal water,33 leaching agent type (ESI,† Fig. S55) and, possibly, many other factors (ESI,† Note 4). Though enormous experimental efforts were made to explore metal leaching chemistry, controllable experimental and data-driven theoretical studies are needed to achieve a more comprehensive understanding. Based on our as-proposed theories, we offer a concept of reconstructable bi- or multi-component oxide catalyst which can be applied to boost the catalytic activities beyond Ni-catalysed OCORs (ESI,† Fig. S56).With all the advantages of the catalyst design presented, the practical application potential of NiWO4–TA950 as an efficient anode of a urea electrolyser was evaluated in a two-electrode configuration. The device shows superior performance and stability to most of the previously reported electrolysers (ESI,† Fig. S57, S58 and Table S4). Furthermore, we developed a NiWO4–TA950@Pt/C urine electrolyser that successfully decomposed urea while producing H2, providing an environmentally- and eco-friendly strategy for H2 production (ESI,† Fig. S57, S59 and S60).
Conclusions
In summary, by establishing the dynamic activity–product relationship for alkaline urea electrolysis, for the first time, the unclear and detrimental competition between the OER and the UOR was identified. Operando observations and computational studies attributed the performance saturation of the OER and the UOR to the insufficiency of dynamic Ni3+ active sites. To boost the dynamic Ni3+ population, thus avoiding the OER/UOR performance saturation, a controllable pre-activation approach was presented that considers the electrochemical leaching of tungstate species from pseudo-crystalline NiWO4–TA for the construction of a unique structure with an oxyhydroxide surface layer for better interphase ion transport, a Ni-rich phase for greater redox flexibility, and an intact NiWO4 bulk for mechanical support. The mechanism of the W leaching-induced reconstruction process was observed and elucidated. Further experimental observations suggested that W leaching kinetics can be controlled by manipulating the crystallinity and supporting substrate of the pre-catalyst. With all these observations, we then proposed a concept of reconstructable bi- or multi-component oxide catalysts which can be applied to boost the catalytic activities beyond the Ni-catalysed UOR. In the future, the identification of the OER/OCOR competition and the design of reconstructable metal oxide catalysts can lead to the discovery of new dynamic active site-dominated structure–performance relationship in heterogeneous catalytic systems.Methods
Chemicals
Nickel(II) chloride hexahydrate (NiCl2·6H2O, ≥98%), cobalt(II) chloride hexahydrate (CoCl2·6H2O, 98%), sodium tungstate dihydrate (Na2WO4·2H2O, ≥99%), nickel(II) oxide powder (NiO, 99.8% trace metals basis), tannic acid (ACS reagent), urea (99.0–100.5%), poly(ethylene glycol)-8000 (BioUltra), absolute ethanol (99.8%) and Nafion 117 containing solution (∼5%) were purchased from Sigma Aldrich. Potassium hydroxide (KOH, 85%) was purchased from Fisher Scientific. Hydrophilic carbon paper (TGP-H-060) was purchased from Toray.Synthesis of NiWO4, NiWO4-TA, CoWO4-PEG, NiWO4–TA@500 and NiWO4–TA@700
NiWO4–TA was prepared by a one-step hydrothermal method. 0.237 g of NiCl2·6H2O, 0.329 g of Na2WO4·2H2O and 0.118 g of TA were first dissolved in 45 mL of Milli-Q deionized (DI) water (18.2 MΩ cm) + 15 mL of ethanol. After stirring at room temperature for 30 min, the precursor solution was then transferred to a Teflon-lined stainless-steel autoclave (100 mL) and heated at 160 °C for 12 h. The resultant was centrifuged with water three times (4500 rpm, 10 min) and finally freeze-dried. NiWO4 was manufactured following the same procedures without the addition of TA. CoWO4-PEG was synthesized in a similar way to NiWO4-TA except for different metal and carbon precursors (0.237 g of CoCl2·6H2O instead of NiCl2·6H2O, and 0.118 g of PEG instead of TA). NiWO4-TA@500 and NiWO4–TA@700 were obtained by annealing NiWO4–TA under a N2 atmosphere at 500 and 700 °C, respectively for 2 h at a ramp rate of 10 °C min−1.Pristine electrode preparation and electrochemical activation
To prepare electrodes for catalysis study, 8 mg of the as-synthesized catalyst was first dispersed in 1 mL of solution that contained 660 μL of DI water, 320 μL of ethanol and 20 μL of 5% Nafion solution. After tip sonication for 5 min, 500 μL of the ink was dropped onto a carbon paper (mass loading ∼8 mg cm−2). Electrochemical pre-treatment was performed by CV cycling the as-prepared anodes between 0 and 0.7 V vs. Ag/AgCl in 1 M KOH for various cycles.Electrochemical measurements
Electrochemical measurements were performed using a VSP Biologic potentiostat. Electrochemical tests were carried out using a three-electrode method (unless specified). A graphite rod and saturated Ag/AgCl electrode were used as the counter and reference electrodes, respectively. The as-manufactured pristine/activated electrode was used as the working electrode unless specified. For measurements performed in the RRDE system, the working electrode was prepared as follows. 1 mg of the catalyst was first dispersed in 125 μL of the solution that contained 122.5 μL of ethanol and 2.5 μL of 5% Nafion solution. After tip sonication for 5 min, 25 μL of the ink was dropped onto the disk of a glassy carbon (disk, 0.2475 cm2)–Au (ring) electrode. LSV and CV were performed at a scan rate of 20 mV s−1 unless specified. All potentials were converted to the RHE scale and iR-corrected (90%) by the resistance of the electrolyte unless specified. Conversion between the potentials vs. RHE and vs. saturated Ag/AgCl was performed using the following equation: E(vs. RHE) = E(vs. Ag/AgCl) + EAg/AgCl(vs. standard hydrogen electrode (SHE)) + 0.059 × pH. At 25 °C, EAg/AgCl (vs. SHE) = 0.197 V vs. SHE. Current densities for all electrochemical measurements were normalized to the geometric surface area of the corresponding current collector used for their respective electrochemical measurement. Electrochemical impedance spectra were recorded at open-circuit voltage under 10 mV of amplitude from 100 kHz to 0.1 Hz.Physicochemical characterization
The XRD patterns were obtained using a STOE SEIFERT diffractometer with a Mo X-ray radiation source. The HAADF-STEM and EDS analyses were performed using a JEOL JEM ARM200F microscope. The XPS measurements were performed using a Thermo scientific K-alpha photoelectron spectrometer. Data processing of XPS results were achieved by Casa XPS with calibration of adventitious carbon binding energy at 284.8 eV. The ICP-AES test was conducted using an ICP-AES instrument (ICPE-9820, SHIMADZU). The RTMS measurements were performed by connecting the gas outlet of the reaction cell (shown in ESI,† Fig. S9) with a quadrupole mass spectrometer (QGA, Hiden Analytical). An electron energy of 70 eV was used for the ionization of the product species, with an emission current of 100 μA. A flow of Ar was used as the carrier gas.X-ray absorption spectroscopy
The XANES and XAFS spectra were collected at room temperature at the Diamond Light Source B18 beamline. Measurements of Ni K-edge and W L3-edge XAFS were carried out using a QEXAFS setup with a fast-scanning Si(111) double crystal monochromator and a Cr-coated branch of collimating and focusing mirrors. The energy ranges for Ni K-edge XAFS and W L3-edge XAFS were 8133–9183 eV and 10007–11034 eV, respectively. Measurements of all ex situ samples were performed in both transmission mode and fluorescence mode, while in situ experiments were performed only in the fluorescence mode. Self-absorption was evaluated by comparing the fluorescence signal to the transmission signal for both fresh and activated catalysts. For the operando experiment, the time resolution is about 150 seconds per spectrum (kmax = 16, energy step = 0.3 eV). XAFS spectra were analysed using Demeter software package34 (including Athena and Artemis software, version 0.9.26) and xraylarch35 (version 0.9.49) using Python 3.8. Athena software was used for data extraction and XANES analysis of ex situ samples. Background subtraction, normalisation and forward Fourier transform of XAFS spectra of operando samples are directly processed by xraylarch using the same parameters obtained from a previous Athena project. Linear combination fitting of Ni K-edge XANES spectra was performed by xraylarch using NiOOH and NiWO4 standard material as reference spectra. In addition, Artemis software was used to fit the k2-weighted EXAFS data. The amplitude reduction factors S02 were calculated to be 0.80 and 0.87 for Ni K-edge and W L3-edge based on EXAFS analysis of Ni and W foils, respectively, and they are used as fixed parameters in EXAFS analysis.
Computational methods
Calculations of adsorption energy and free energy diagram were performed within the framework of DFT using the Vienna ab initio simulation package (VASP) code. Projected augmented wave (PAW) was used for depicting ion–electron interactions.36 The electronic structures were treated by using the Perdew–Burke–Ernzerhof (PBE) form of the generalized gradient approximation (GGA).37 Plane wave basis was used with a kinetic cutoff energy of 400 eV. The Monkhorst–Pack meshes of 3 × 3 × 1 were used for k point-sampling in the Brillouin zone.38 The optimization calculation finished when the force acting on the atom is smaller than 0.05eV Å−1. During the DFT calculations, the model of NiOOH was built by two O–Ni–O layers of NiOOH (001). More information on the construction of the NiWO–W (100) surface is provided in Note S3, ESI.† The generated heterostructure was separated by a 15 Å vacuum layer along the z axis. The formula of adsorption energy (Ead) calculation is as follows: Ead = Esystem − Esubstrate − Eabsorbate, where Esystem, Esubstrate, and Eadsorbate represent the total energies of the adsorption system, substrate, and adsorbate respectively. The free energy diagram was calculated by a method reported in a previous study.39 The electrochemical process of the oxygen evolution reaction in alkaline media can be divided into four one-electron reactions as follows: * + 4OH− → *OH + 3OH− + e− → *O + H2O + 2OH− + 2e− → *OOH + H2O + OH− + 3e− → * + 2H2O + O2 + 4e−, in which * represents an active catalytic site. The Gibbs free energy of each states is calculated using the equation: G = E + ZPE– TS – eU, in which G, E, ZPE, S and U represent Gibbs free energy, DFT-based thermal energy, zero-point energy, entropy and applied potential (vs. NHE). The energy of OH− can be calculated using the equation: G(OH−) = G(H2O) − G(H+) = G(H2O) – (1/2G(H2) − RTln10 × pH), in which R is the ideal gas constant, T is the temperature in Kelvin and pH is assumed to be 14. In this regard, the free energy change of the total reaction (4OH− → 2H2O + O2 + 4e−) is calculated to be 0.404 eV, which is different from that of the acidic OER (2H2O → O2 + 4H+ + 4e−, ΔG = 1.23 eV).Simulation of the W leaching mechanism was performed by utilizing CRYSTAL17.40 The basis set was downloaded from CRYSTAL website (http://www.crystal.unito.it/basis-sets.php). All electron basis set were used for Ni (Ni_86-411(41d)G_towler_1992) and O (O_8-411(1d)G_baranek_2013_BaTiO3). Effective core pseudopotentials were used in the W basis set (W_cora_1996). The exchange–correlation functional was chosen as PBE0 (including 25% Hartree–Fock exchange). The k-mesh was set to be 8 × 8 × 8. The ferromagnetic (FM) and non-magnetic (NM) phases of NiWO4 were optimised by keeping all the crystal symmetry. The crystal structure of NiWO4 were obtained from Crystallography Open Database (http://www.crystallography.net, ID: 8103678), with the space group P12/c1 and cell parameters of a = 4.5992 Å, b = 5.6606 Å, c = 4.9068 Å, and β = 90.3. Please see the ESI,† (Note S3) for more details.
Author contributions
R. L. and G. H. conceived the project and designed the experiments; R. L. synthesized the materials and performed characterisation and electrocatalytic studies; L. K., V. C. and G. C. carried out spectroscopy studies and analysed the data; T. Z., J. F. and F. C. performed DFT calculations; G. Z. and A. K. performed the MS experiment; I. P. supported with XPS and XRD characterisation; G. H. directed the project; D. B., F. C. and G. H. supervised the project; R. L., L. K., T. Z., J. F. and G. H. wrote the manuscript and all authors revised the manuscript.Conflicts of interest
There are no conflicts to declare.Acknowledgements
We acknowledge Engineering and Physical Sciences Research Council (EP/V027433/1; EP/L015862/1), and Royal Academy of Engineering under the Senior Research Fellowships scheme (Brett) for funding support. We acknowledge the B18 beamline (session ID SP25410), E01 and E02 beamline (session ID MG29207) of electron Physics Science Imaging Centre (ePSIC) in Diamond Light Source (DLS) for the allocated experiment sessions. R. Lin would like to thank the University College London for UCL Graduate Research Scholarships and UCL Overseas Research Scholarships. The authors thank Dr Siyu Zhao for the useful contribution during the revision process.References
- Q. Wang, M. Nakabayashi, T. Hisatomi, S. Sun, S. Akiyama, Z. Wang, Z. Pan, X. Xiao, T. Watanabe, T. Yamada, N. Shibata, T. Takata and K. Domen, Nat. Mater., 2019, 18, 827–832 CrossRef CAS PubMed.
- S. T. Thompson and D. Papageorgopoulos, Nat. Catal., 2019, 2, 558–561 CrossRef CAS.
- S. Zhao, J. Berry-Gair, W. Li, G. Guan, M. Yang, J. Li, F. Lai, F. Corà, K. Holt, D. J. L. Brett, G. He and I. P. Parkin, Adv. Sci., 2020, 7, 1903674 CrossRef CAS PubMed.
- D. Y. Chung, P. P. Lopes, P. Farinazzo, B. D. Martins, H. He, T. Kawaguchi, P. Zapol, H. You, D. Tripkovic, D. Strmcnik, Y. Zhu, S. Seifert, S. Lee, V. R. Stamenkovic and N. M. Markovic, Nat. Energy, 2020, 5, 222–230 CrossRef.
- S. Song, J. Zhou, X. Su, Y. Wang, J. Li, L. Zhang, G. Xiao, C. Guan, R. Liu, S. Chen, H.-J. Lin, S. Zhang and J.-Q. Wang, Energy Environ. Sci., 2018, 11, 2945–2953 RSC.
- H. Dotan, A. Landman, S. W. Sheehan, K. D. Malviya, G. E. Shter, D. A. Grave, Z. Arzi, N. Yehudai, M. Halabi, N. Gal, N. Hadari, C. Cohen, A. Rothschild and G. S. Grader, Nat. Energy, 2019, 4, 786–795 CrossRef CAS.
- X. Cui, P. Xiao, J. Wang, M. Zhou, W. Guo, Y. Yang, Y. He, Z. Wang, Y. Yang, Y. Zhang and Z. Lin, Angew. Chem., Int. Ed., 2017, 56, 4488–4493 CrossRef CAS PubMed.
- M. Song, Z. Zhang, Q. Li, W. Jin, Z. Wu, G. Fu and X. Liu, J. Mater. Chem. A, 2019, 7, 3697–3703 RSC.
- L. Zhang, L. Wang, H. Lin, Y. Liu, J. Ye, Y. Wen, A. Chen, L. Wang, F. Ni, Z. Zhou, S. Sun, Y. Li, B. Zhang and H. Peng, Angew. Chem., Int. Ed., 2019, 58, 16820–16825 CrossRef CAS PubMed.
- W. Chen, L. Xu, X. Zhu, Y.-C. Huang, W. Zhou, D. Wang, Y. Zhou, S. Du, Q. Li, C. Xie, L. Tao, C.-L. Dong, J. Liu, Y. Wang, R. Chen, H. Su, C. Chen, Y. Zou, Y. Li, Q. Liu and S. Wang, Angew. Chem., Int. Ed., 2021, 60, 7297–7307 CrossRef CAS PubMed.
- S.-K. Geng, Y. Zheng, S.-Q. Li, H. Su, X. Zhao, J. Hu, H.-B. Shu, M. Jaroniec, P. Chen, Q.-H. Liu and S.-Z. Qiao, Nat. Energy, 2021, 6, 904–912 CrossRef CAS.
- J. Li, J. Li, T. Liu, L. Chen, Y. Li, H. Wang, X. Chen, M. Gong, Z.-P. Liu and X. Yang, Angew. Chem., Int. Ed., 2021, 60, 26656–26662 CrossRef CAS PubMed.
- J. Suntivich, K. J. May, H. A. Gasteiger, J. B. Goodenough and Y. Shao-Horn, Science, 2011, 334, 1383–1385 CrossRef CAS PubMed.
- M. Bajdich, M. García-Mota, A. Vojvodic, J. K. Nørskov and A. T. Bell, J. Am. Chem. Soc., 2013, 135, 13521–13530 CrossRef CAS PubMed.
- N. Zhang, X. Feng, D. Rao, X. Deng, L. Cai, B. Qiu, R. Long, Y. Xiong, Y. Lu and Y. Chai, Nat. Commun., 2020, 11, 4066 CrossRef CAS PubMed.
- T. Wu, S. Sun, J. Song, S. Xi, Y. Du, B. Chen, W. A. Sasangka, H. Liao, C. L. Gan, G. G. Scherer, L. Zeng, H. Wang, H. Li, A. Grimaud and Z. J. Xu, Nat. Catal., 2019, 2, 763–772 CrossRef CAS.
- H. Huang, C. Yu, H. Huang, C. Zhao, B. Qiu, X. Yao, S. Li, X. Han, W. Guo, L. Dai and J. Qiu, Nano Energy, 2019, 58, 778–785 CrossRef CAS.
- B. Zhang, K. Jiang, H. Wang and S. Hu, Nano Lett., 2019, 19, 530–537 CrossRef CAS PubMed.
- R. P. Forslund, J. T. Mefford, W. G. Hardin, C. T. Alexander, K. P. Johnston and K. J. Stevenson, ACS Catal., 2016, 6, 5044–5051 CrossRef CAS.
- Z. Jiang, W. Sun, H. Shang, W. Chen, T. Sun, H. Li, J. Dong, J. Zhou, Z. Li, Y. Wang, R. Cao, R. Sarangi, Z. Yang, D. Wang, J. Zhang and Y. Li, Energy Environ. Sci., 2019, 12, 3508–3514 RSC.
- Z. Qiao, S. Hwang, X. Li, C. Wang, W. Samarakoon, S. Karakalos, D. Li, M. Chen, Y. He, M. Wang, Z. Liu, G. Wang, H. Zhou, Z. Feng, D. Su, J. S. Spendelow and G. Wu, Energy Environ. Sci., 2019, 12, 2830–2841 RSC.
- G. Zhang and A. Kucernak, ACS Catal., 2020, 10, 9684–9693 CrossRef CAS.
- D. Chen and S. D. Minteer, J. Power Sources, 2015, 284, 27–37 CrossRef CAS.
- M. Bernicke, E. Ortel, T. Reier, A. Bergmann, J. Ferreira de Araujo, P. Strasser and R. Kraehnert, ChemSusChem, 2015, 8, 1908–1915 CrossRef CAS PubMed.
- H. B. Tao, Y. Xu, X. Huang, J. Chen, L. Pei, J. Zhang, J. G. Chen and B. Liu, Joule, 2019, 3, 1498–1509 CrossRef CAS.
- J. Wang, L. Gan, W. Zhang, Y. Peng, H. Yu, Q. Yan, X. Xia and X. Wang, Sci. Adv., 2018, 4, eaap7970 CrossRef PubMed.
- Z.-F. Huang, J. Song, Y. Du, S. Xi, S. Dou, J. M. V. Nsanzimana, C. Wang, Z. J. Xu and X. Wang, Nat. Energy, 2019, 4, 329–338 CrossRef CAS.
- M. Steimecke, G. Seiffarth, C. Schneemann, F. Oehler, S. Förster and M. Bron, ACS Catal., 2020, 10, 3595–3603 CrossRef CAS.
- H.-Y. Wang, Y.-Y. Hsu, R. Chen, T.-S. Chan, H. M. Chen and B. Liu, Adv. Energy Mater., 2015, 5, 1500091 CrossRef.
- G. Karkera, T. Sarkar, M. D. Bharadwaj and A. S. Prakash, ChemCatChem, 2017, 9, 3681–3690 CrossRef CAS.
- L. Wang, Y. Zhu, Y. Wen, S. Li, C. Cui, F. Ni, Y. Liu, H. Lin, Y. Li, H. Peng and B. Zhang, Angew. Chem., Int. Ed., 2021, 60, 10577–10582 CrossRef CAS PubMed.
- S. Anantharaj, H. Sugime and S. Noda, ACS Appl. Energy Mater., 2020, 3, 12596–12606 CrossRef CAS.
- X. Liu, J. Meng, K. Ni, R. Guo, F. Xia, J. Xie, X. Li, B. Wen, P. Wu, M. Li, J. Wu, X. Wu, L. Mai and D. Zhao, Cell Rep. Phys. Sci., 2020, 1, 100241 CrossRef.
- B. Ravel and M. Newville, J. Synchrotron Radiat., 2005, 12, 537–541 CrossRef CAS PubMed.
- M. Newville, J. Phys.: Conf. Ser., 2013, 430, 012007 CrossRef CAS.
- P. E. Blöchl, Phys. Rev. B: Condens. Matter Mater. Phys., 1994, 50, 17953–17979 CrossRef PubMed.
- J. P. Perdew, K. Burke and M. Ernzerhof, Phys. Rev. Lett., 1996, 77, 3865–3868 CrossRef CAS PubMed.
- H. J. Monkhorst and J. D. Pack, Phys. Rev. B: Solid State, 1976, 13, 5188–5192 CrossRef.
- J. K. Nørskov, J. Rossmeisl, A. Logadottir, L. Lindqvist, J. R. Kitchin, T. Bligaard and H. Jónsson, J. Phys. Chem. B, 2004, 108, 17886–17892 CrossRef.
- R. Dovesi, A. Erba, R. Orlando, C. M. Zicovich-Wilson, B. Civalleri, L. Maschio, M. Rérat, S. Casassa, J. Baima, S. Salustro and B. Kirtman, Wiley Interdiscip. Rev.: Comput. Mol. Sci., 2018, 8, e1360 Search PubMed.
Footnote |
| † Electronic supplementary information (ESI) available. See DOI: 10.1039/d1ee03522c |
| This journal is © The Royal Society of Chemistry 2022 |