
A CO2 utilization framework for liquid fuels and chemical production: techno-economic and environmental analysis†
Thai Ngan
Do‡
 ,
Chanhee
You‡
and
Jiyong
Kim
*
,
Chanhee
You‡
and
Jiyong
Kim
*
School of Chemical Engineering, Sungkyungkwan University, 16419, Republic of Korea. E-mail: jiyongkim@skku.edu
First published on 27th November 2021
Abstract
In this work, we developed a framework for CO2 capture and utilization for energy products (CCU4E) and examined techno-economic and environmental performance in different scenarios. The framework includes process synthesis and design, process simulation, and modeling toward the technical, economic, and environmental performance of the CO2-to-fuel pathway. Based on the 72 CO2-to-fuel pathways examined, we discussed the trade-off between economic output (via the unit production cost of fuels) and environmental impact (via net CO2 equivalent emissions). In addition, an optimization model was used to identify the optimal pathway and the decision to use conventional (black) or renewable (green) hydrogen in different scenarios. An extended sensitivity analysis was performed to understand the important role of H2 in the mitigation of CO2eq and its economic potential, globally and locally, as well as the prospect of future CO2-based fuels. This study provides practical decision-making strategies to major carbon-emitting countries to make decisions on using domestic resources to balance economics and environmental protection in the CCU4E framework. The green hydrogen price is revealed as the key factor in future CCU4E by allowing a huge reduction in CO2eq emissions at a more stable and lower price.
Broader contextCarbon capture and utilization (CCU) received worldwide attention owing to its potential to mitigate CO2 emissions that contribute to climate change and for the potential generation of high-value chemicals and fuels that lessen the burden on conventional resources. Carbon capture and utilization for energy products (CCU4E) offers several potential benefits in climate change mitigation, energy security, and sustainability. Although advances in fundamental research have shown a high potential for CCU4E framework implementation, realistic strategies to demonstrate CCU4E in global and local applications are still unclear; for example, which pathway from CO2 capture to what mix of products through what types of conversion technologies makes CO2-based fuels economically and/or environmentally viable. Accordingly, to quicken the implementation of a competitive, practical CCU4E framework, we developed a system-level methodology for synthesis and evaluation of a wide range of CCU4E pathways. In this work, 72 CO2-to-fuel pathways were assessed using process systems engineering (PSE)-centric techniques such as process simulation, techno-economic evaluation, environmental impact analysis, and optimization. In addition, an extended sensitivity analysis provides a suite of strategic solutions to establish a commercially viable CCU4E framework using domestic hydrogen, from current and future perspectives. |
1. Introduction
Global warming is a critical issue facing humankind owing to the continued increase in CO2 emissions.1,2 The Intergovernmental Panel on Climate Change emphasized the role of limiting global temperature rise to less than 1.5 °C; the governments worldwide and independent investigators have been researching and taking actions for reducing CO2 emissions.3 Carbon capture, storage, and utilization are recognized as important methods to mitigate climate change.4,5 Referring to a number of technologies that store CO2 underground, carbon capture and storage (CCS) technologies are currently commercially available but are still limited in storage capacity.6–8 A parallel development is carbon capture and utilization (CCU) technologies, in which CO2 is a key carbon source for synthesizing high-value materials, chemicals, and fuels.8,9 CO2-based chemicals and fuels have received worldwide attention because they not only mitigate CO2 emissions but also decrease the dependency of the chemical industry on conventional, fossil-fuel sources and share the burden on fossil fuels.10The supply and use of captured CO2 in 2020 and the potential for 2030 were estimated and are presented in Fig. 1. Note that the potential supply and future demand of CO2 are not readily available, so they are estimated and provided within an order of magnitude (Section S1 in the ESI†).6,11,12 The global consumption of CO2 is currently estimated to be 110 Mtpa (2020), excluding the large volume of CO2 generated and consumed on site in urea manufacturing.11 About 80 Mtpa CO2 is estimated for use in enhanced oil recovery (EOR), whereas the remaining is used in the food and beverage industry, fabrication of metals, and other applications. In 2030, a huge potential will be found for captured CO2 from large point source emissions at different concentrations, depending on CO2 capture costs, as estimated and reported in ref. 13. Meanwhile, only a small portion of CO2 has been industrially used in existing technologies, considering the growth of existing technologies to 2030, at around 200 Mtpa.11 To lessen the imbalance in CO2 supply and demand, several existing and emerging technologies have been considered to use CO2 that is sequestered underground and utilized as a feedstock for materials, chemicals, and fuels.
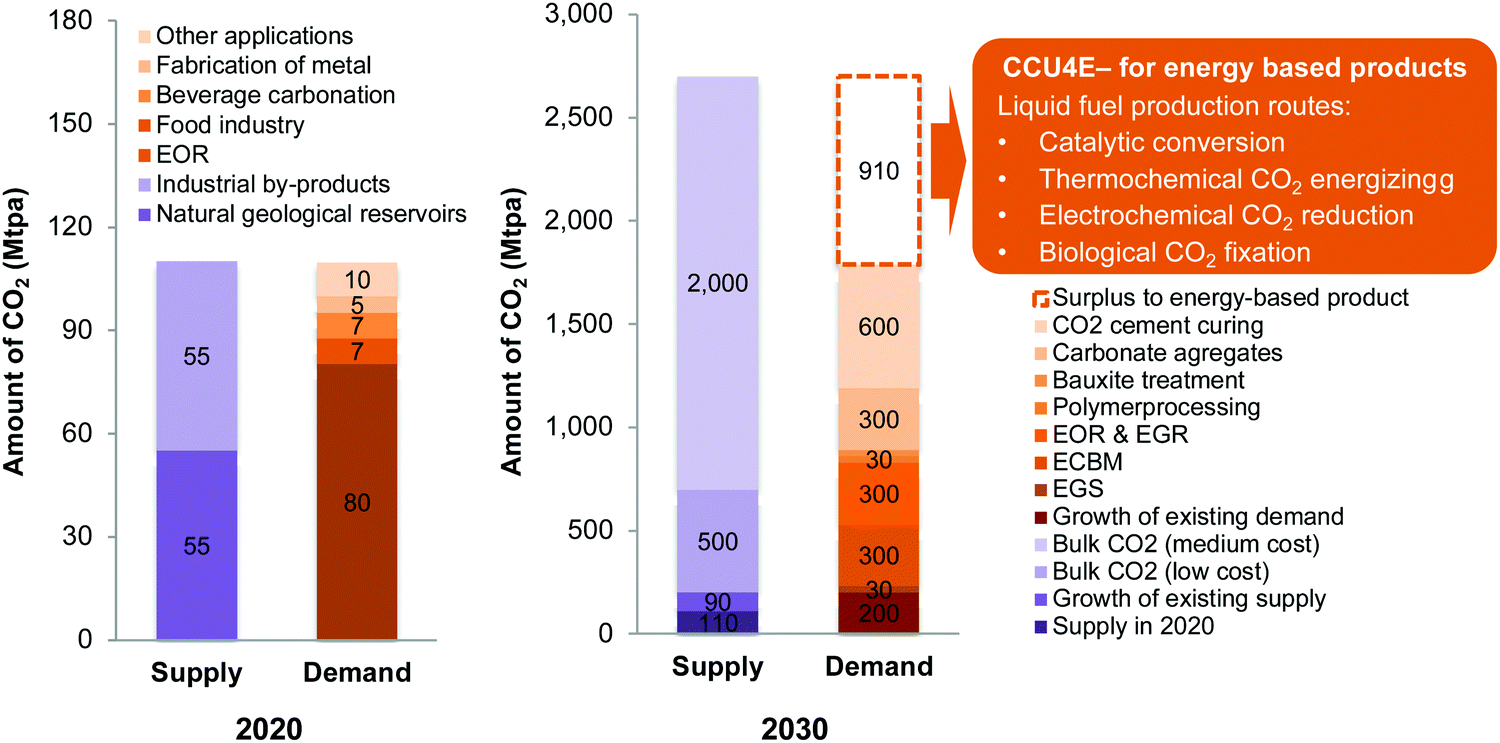 | ||
| Fig. 1 Estimated demand and supply of CO2 and potential technologies for CO2 utilization. Abbreviations: CCU4E: carbon capture and utilization for energy products, EOR: enhanced oil recovery, EGR: enhanced gas recovery, ECBM: enhanced coal-bed methane recovery, EGS: enhanced geothermal systems. | ||
As one of the most mature sequestration technologies, EOR injects CO2 into reservoirs to extract additional oil, based on the theory of its miscibility.14 EOR stores a large volume of CO2 in reservoirs and boosts oil revenue. Similarly, enhanced gas recovery (EGR) injects and stores CO2 in gas reservoirs by physical replacement of natural gas. However, EGR is an immature technology compared to EOR due to its limited technical and economic benefits.15 In our estimation, EGR is considered part of EOR, making the total storage up to 300 Mtpa. Another potential sequestration activity is enhanced coal-bed methane recovery (ECBM), in which coal adsorbs CO2 and displaces methane. ECBM has been economically developed in large coal reserves. A small volume of CO2 is used in enhanced geothermal systems (EGS) as a working fluid for heat recovery from the reservoir. These sequestration technologies are currently commercially available technologies but are still limited in terms of the storage capacity.6 Furthermore, CO2 can be used for non-energy products or materials such as polymer, carbonate, or aggregate materials to safely store and capture CO2 without intensive monitoring or environmental risk of CO2 leakage.16–18 For example, in polymer processing, CO2 is fed together with the traditional feedstock to synthesize polycarbonate (e.g., polyethylene carbonate, polypropylene carbonate) and stored in these polymer materials. Other CO2-based materials such as carbonate, aggregate, or precast cement demonstrate huge potential for CO2 use. In alumina extraction from bauxite, the mineral-containing residue is treated by CO2 to form aggregate materials for construction. Carbonate mineralization of natural alkalis or alkaline oxides (e.g., MgO, CaO) can also provide carbonate materials for construction and mine reclamation. Using CO2 in the precast concrete curing process can also achieve economic benefits by reducing energy and water consumption.15,19,20
Although a high rate of CO2 sequestration underground and utilization for CO2-based materials has been assumed in our estimates, a large potential surplus of CO2 for CO2-based fuels or energy products has a vast demand. CCU for chemicals and fuels can achieve indirect mitigation of CO2 emissions by using CO2 as a raw material, replacing the use of fossil fuels, and enabling various industries to depend less on fossil resources.15 The potential surplus and increased demand have driven more efforts to develop CO2 capture and utilization technology for energy-based products (CCU4E). Plentiful research has been found on catalytic CO2 conversion, thermochemical CO2 energizing, electrochemical CO2 reduction, and biological CO2 fixation to high-value chemicals and fuels.10,21–24 While some researchers focus on developing high-performance catalysts or materials,25–31 others work on process design, operation optimization and control, techno-economic analysis, or life cycle assessment.32–34 Among CO2 utilization technologies, catalytic CO2 conversion is a mature technology for fuel production.35 In combination with H2, CO2 can be directly converted to fuel via CO2 hydrogenation or converted to CO in a reverse water–gas shift (RWGS) reaction and subsequent fuel synthesis. Many published studies have been found on catalyst development, process design, process control, techno-economic analysis and life cycle assessment. For example, the technical, economic, and environmental performance of methanol production via CO2 use has been examined on a molecular-to-planet scale.32 Dieterich and colleagues reviewed the state-of-the-art of synthetic technologies for various liquid fuels (e.g., methanol, dimethyl ether, or Fischer–Tropsch fuels), in which its barriers to commercial viability were discussed.36 Moreover, Do and Kim studied direct and indirect catalytic conversion routes of CO2 into methanol, Fischer–Tropsch fuels, and other hydrocarbon equivalents.37–39 Another utilization technology, thermochemical energizing, splits CO2 into CO at a very high temperature in centralized solar energy. The important device in this technology is a counter-rotating-ring receiver/reactor/recuperator (CR5) developed by Sandia National Laboratory.40 Several studies on process development, techno-economic analysis, and environmental assessment for solar-based fuel are available in the literature.37,39,41 These solar-to-petrol approaches are reasonably promising, but they have been limited by high land requirements, unstable solar irradiation, and challenges to developing new materials with higher solar-to-chemical conversion efficiency. Recently, electrochemical CO2 reduction received significant interest as a CO2 mitigation pathway, especially in combination with renewable electricity.42,43 Using electrical current, CO2 is reduced into different chemicals, which exhibit different thermodynamic cell potentials, in cathodes over electrocatalysts. CO has been attractive in electrochemical CO2 reduction, as CO can enhance the further conversion into many fuels such as Fischer–Tropsch fuels, gasoline and diesel equivalents, or alcohols. Lowering the cost of renewable electricity or renewable H2 for CO2 use is the main economic challenge to electrochemical CO2 reduction technology.44–46 Another potential CO2 utilization is biological fixation using microalgae. Using sunlight, algae absorb CO2 and other nutrients to form a high-lipid-content biomass.22 Further oil extraction and refining processes are necessary to obtain hydrocarbon-equivalent end products. Although biological CO2 fixation can minimize heat and electricity consumption, commercial viability is limited due to high land requirements and unstable resource management (e.g., sunlight, algae growth).47 Because CO2-to-fuel technologies exhibit opportunities and challenges, uncertainties about techno-economic performance and environmental impact within various technological routes as well as production routes preferred for desired fuels are present in a specific scenario.
In this study, we developed a framework for CCU4E and examined the techno-economic and environmental performance of CO2-to-fuel pathways with different conventional and renewable resource inputs. The general status of CCU, potential CO2 use for energy products, and methodologies are described in Sections 1 and 2. The technology overview for CCU4E and the framework generation of several CO2-to-fuel pathways to a wide range of fuels is discussed in Section 3. Process simulations of CO2-to-fuel pathways were developed, and mass and energy balances were obtained for further analysis (Section 4). Techno-economic analysis (e.g., unit production cost) and environmental performance (e.g., net CO2 emission) analysis were performed for the CO2-to-fuel pathways. Moreover, optimal fuel pathways and key findings for commercially viable CO2-based fuel were identified (Section 5). In Section 6, sensitivity analysis was performed for different sources of H2, different locations, and changes over time (projected to 2030).
2. Problem statement and methodology
2.1 Problem statement
The industrial use of CO2, in this work, was classified into three main categories of CCS, carbon capture and utilization for non-energy products (CCU4NE), and for energy products (CCU4E), as shown in Fig. 2. While CCS sequesters CO2 underground and CCU4NE directly captures and stores CO2 in materials, CCU4E can indirectly mitigate CO2 emissions via the use of CO2 feedstock for fuel products and by replacing fossil fuels.15 This work examines CCU4E that might mitigate CO2 emission and lessen the burden on conventional energy. In CCU4E, a variety of fuels have been considered for production from captured CO2 (e.g., methanol, ethanol, formic acid, dimethyl ether, gasoline, and diesel boiling-range equivalent) via many technological routes (e.g., catalytic conversion, thermochemical energizing, electrochemical reduction, biological fixation).23,48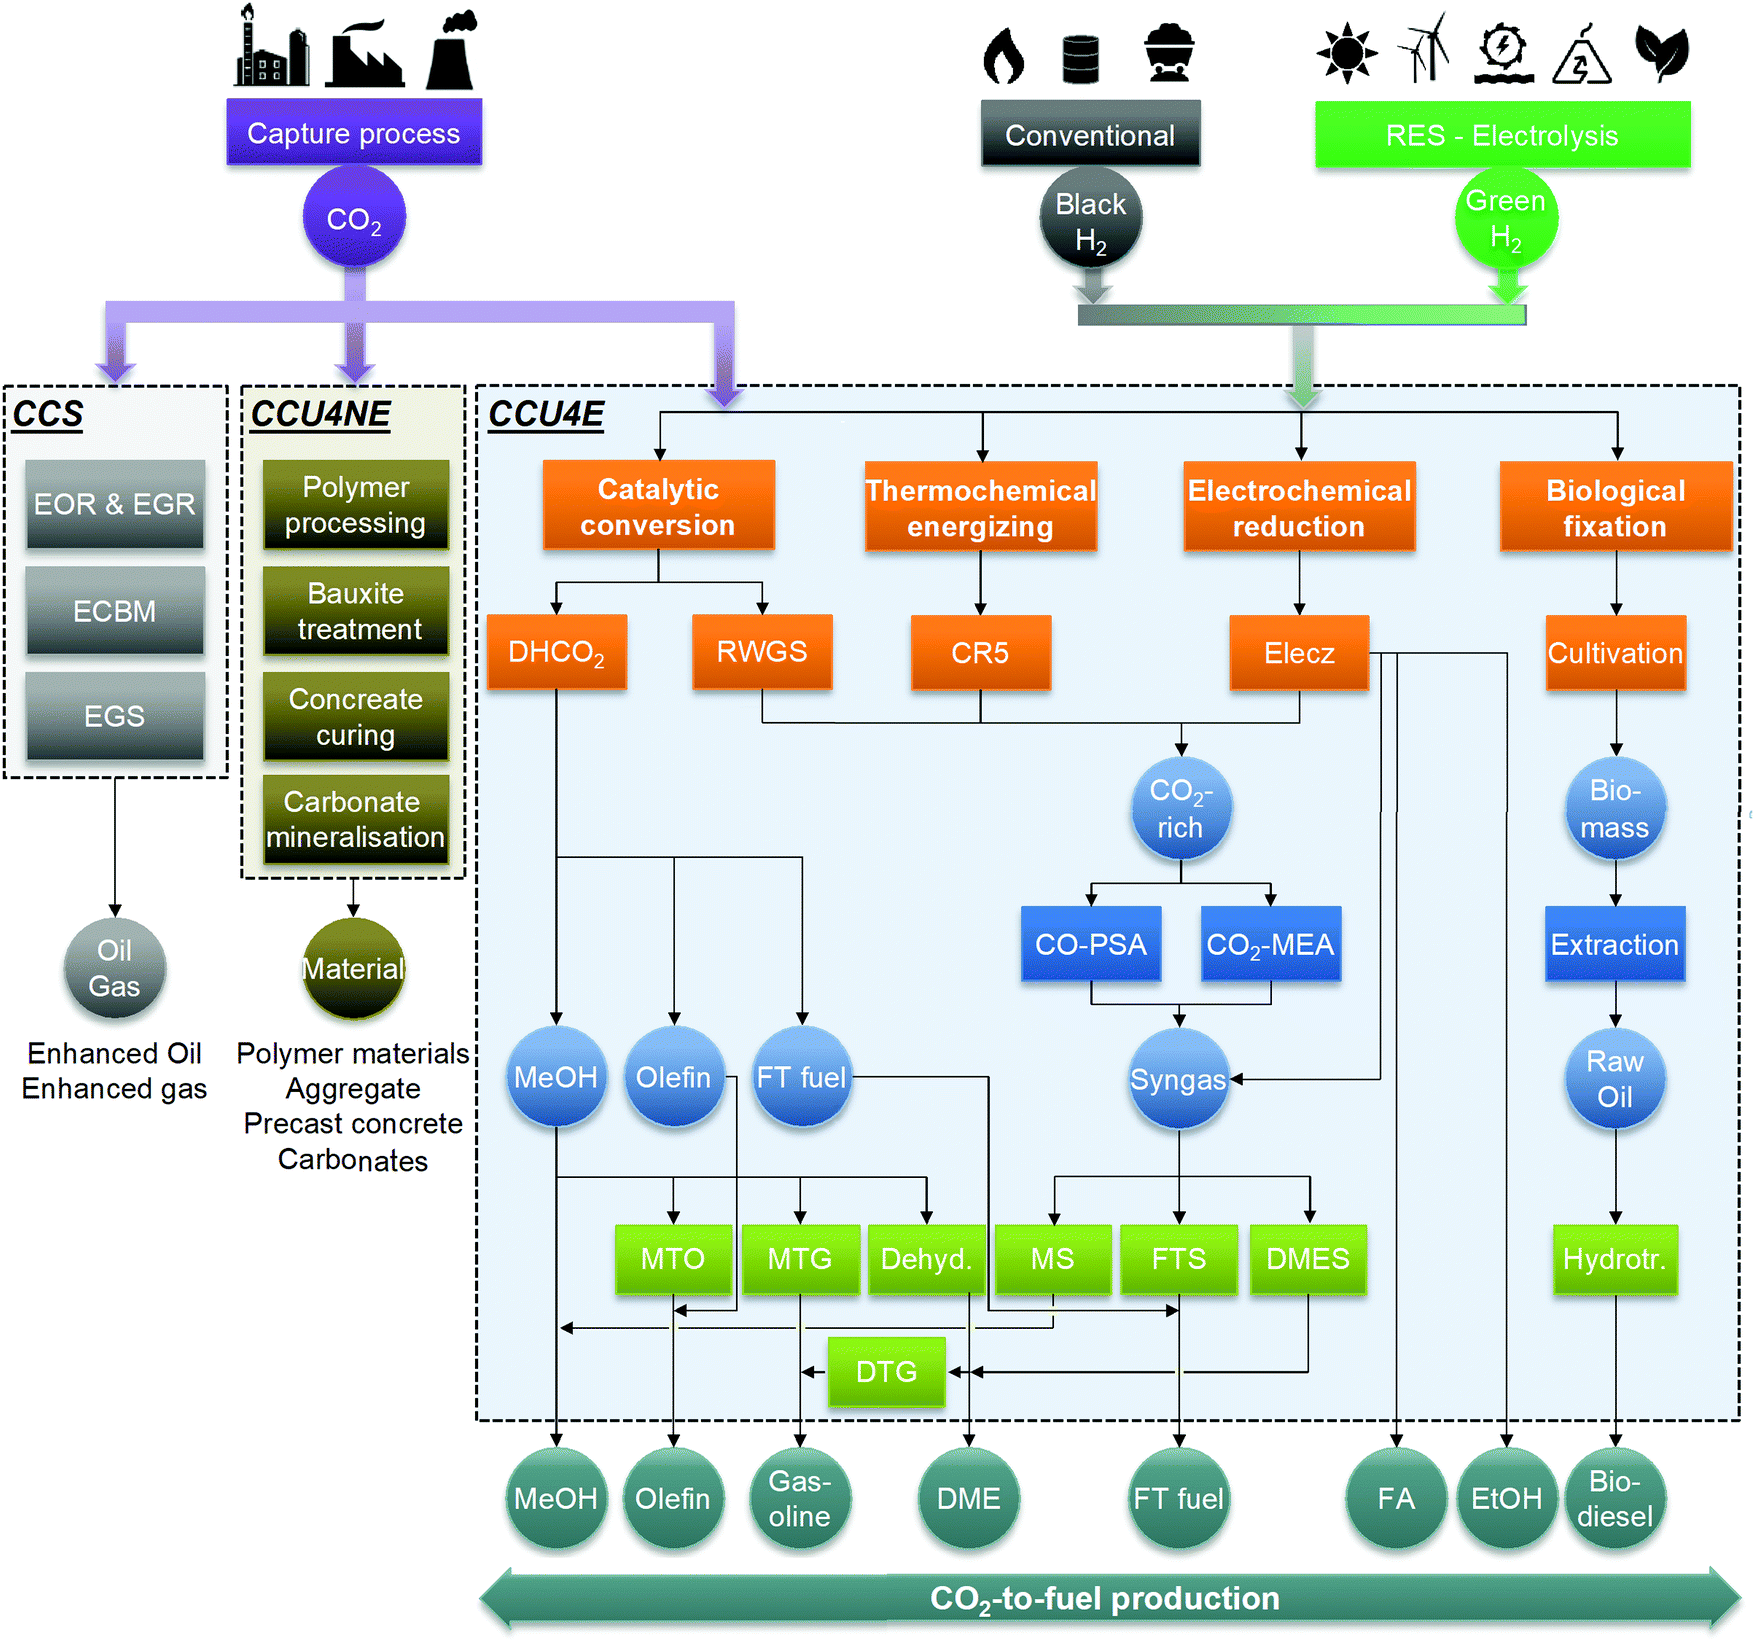 | ||
| Fig. 2 Industrial use of captured CO2. Abbreviations: CCS: carbon capture and sequestration, CCU4NE: carbon capture and utilization to non-energy products, CCU4E: carbon capture and utilization for energy products, EOR: enhanced oil recovery, EGR: enhanced gas recovery, ECBM: enhanced coal-bed methane recovery, EGS: enhanced geothermal systems, RES: renewable energy sources, DHCO2: direct hydrogenation of CO2, RWSG: reverse water–gas shift, CR5: counter-rotating-ring receiver/reactor/recuperator, Elecz: electrolyzer, CO–PSA: CO pressure swing adsorption, CO2–MEA: CO2 absorption by monoethanolamine, MS: methanol synthesis, FTS: Fischer–Tropsch synthesis, DMES: dimethyl ether synthesis, MTO: methanol-to-olefin, MTG: methanol-to-gasoline, Dehydr.: dehydration, DTG: DME-to-gasoline synthesis, Hydrotr.: hydrotreating. | ||
In CO2 utilization to fuel products, CO2 is generally an energy carrier, while the primary energy input is from renewable or low emission sources.15 Activating negative emissions to achieve climate targets is possible.49 In energy transformation, renewable energy can be introduced into the fuel products via a direct route, a two-step conversion route (renewable sources – renewable electricity) or a three-step conversion route (renewable sources – renewable electricity – renewable H2).25 For instance, thermochemical CO2 energizing and biological CO2 fixation directly use renewable energy (e.g., solar), while electrochemical reduction follows a two-step route using renewable electricity to yield the desired products. Catalytic CO2 conversion, as well as the upgrading and separation processes, uses renewable H2 and/or renewable electricity for their operation (two- and three-step routes). Renewable H2 (or green H2) and renewable utility (or green utility) can enable ecofriendliness, but it limits the economic viability. Conversely, the use of conventional resources can lead to more economic opportunities but introduce a certain emission inventory into the environment. A trade-off is always present between economic and environmental impacts when using cheap and dirty conventional sources or expensive and clean renewable sources.
Furthermore, among the complex CCU4E frameworks, the requirements of additional H2, utilities, and other inputs in specific CO2-to-fuel pathways, as well as those inputs’ costs and CO2 equivalent (CO2eq) emissions, are different, which results in different economic and environmental performances of the processes. Therefore, the selection of an optimal CO2-to-fuel pathway for each fuel type might differ in specific scenarios. For more understanding of CO2 utilization for energy products, we examined the techno-economic (e.g., unit production cost) and environmental performance (e.g., net CO2 emission) of the fuel production pathways using black and green H2, globally and locally, performed sensitivity analyses in different scenarios, and predicted short-term trends in green CO2-based fuel prices.
2.2 Methodology
This study analyzes the techno-economic and environmental performance of CO2-to-fuel pathways under different uses of black and green H2. The proposed work involves the following steps:• Step 1: Set up the problems of CCU4E using conventional, renewable resources (e.g., H2 and utilities).
• Step 2: Preliminary screening of CO2 utilization technologies and fuel production pathways and generation of the CCU4E superstructure. The superstructure includes 72 CO2-to-fuel pathways for 7 fuels.
• Step 3: Development of process simulations for CO2-to-fuel pathways and data estimation to further evaluate technical, economic, and environmental performance. The mass balance and energy balance were obtained from simulation modeling. Sizing and costing were also estimated.
• Step 4: Techno-economic analysis and environmental performance determination with black or green H2 use, mainly via unit production cost (UPC) and net CO2eq emission (NCE). Identification of the optimal CO2-to-fuel pathways and the major cost drivers.
• Step 5: Sensitivity analysis on CO2-based fuel UPC and NCE with different scenarios of H2 varying by sources and location (e.g., global and regional renewable sources and resource prices). Projection of future trends on CO2-based fuel prices.
3. Superstructure of carbon capture and utilization for energy products
3.1 Compounds
In this study, compounds in the CCU4E superstructure are classified into four categories: feedstock, intermediate, by-product, and final product. Captured CO2 feedstock was fed into the CCU4E superstructure for various intermediates and products, which differ in composition corresponding with the technology in which they are produced. Through preliminary screening, eight final products were selected: methanol (MeOH), ethanol (EtOH), formic acid (FA), dimethyl ether (DME), olefin, gasoline, Fischer–Tropsch (FT) fuel, and biodiesel. The intermediates could be either CO2-rich gas, syngas, microalgal biomass, or raw products (raw MeOH, raw FT, raw DME, raw olefin, raw FA, raw EtOH) that were further processed by the upgrading conversion or separation and purification.3.2 Technologies
Because many CO2 utilization technologies are available in the literature, this study considered four main technologies: catalytic conversion, thermochemical energizing, electrochemical reduction, and biological fixation. In some cases, further conversions are considered to produce or improve the desired fuel quality. We classified these as the upgrading technology such as dehydration, methanol-to-olefin, or methanol-to-gasoline. Separation and purification technologies included flash/distillation, chemical absorption, adsorption, and membranes.Reverse water–gas shift (RWGS). This technology converts CO2 and H2 into CO and H2O, as expressed in eqn (1), in the presence of a Cu/ZnO/Al2O3 catalyst in a reactor.50,51 The mixture of CO, CO2, and H2 gases can be further processed (e.g., gas component separation) or mixed with additional H2 to produce syngas at the optimal stoichiometric number, SN = (H2 + CO2)/(CO2 + CO), for fuel synthesis (e.g., methanol synthesis, Fischer–Tropsch synthesis, or dimethyl ether synthesis).
| CO2 + H2 ↔ CO + H2O | (1) |
Methanol synthesis (MS). This is a commercial technology that produces MeOH from syngas. In this work, a Cu/ZnO/Al2O3 catalyst was used to synthesize MeOH at about 150 °C and 50 bar.41,52 The reaction equations are as follows:
| CO + 2H2 → CH3OH | (2) |
| CO2 + H2 ↔ CO + H2O | (3) |
| CO2 + 3H2 → CH3OH + H2O | (4) |
Fischer–Tropsch synthesis (FTS). This technology produces liquid hydrocarbons (e.g., gasoline, diesel, and aviation fuels) from synthetic gas. FTS is the most widely used synthesis technology for hydrocarbon production. A simplified reaction is expressed as eqn (5); the detailed reaction mechanism is discussed in the ESI† and elsewhere.53
| nCO + 2nH2 → −(CH2)n− + nH2O | (5) |
Dimethyl ether synthesis (DMES). DME that is synthesized using syngas can be used as a fuel additive by blending with diesel or as a household fuel due to its high cetane number and its similar properties to liquified petroleum gas.54,55 A bifunctional catalyst of CuO/ZnO/Al2O3 and γ-Al2O355 was used to promote the following four reactions:
| CO + 2H2 → CH3OH | (6) |
| CO2 + 3H2 → CH3OH | (7) |
| CO2 + H2 ↔ CO + H2O | (8) |
| CH3OH ↔ CH3OCH3 + H2O | (9) |
Direct hydrogenation of CO2. This technology directly synthesizes fuels from CO2 and H2 in a single reactor, in which a two-step process of RWGS to CO and subsequent CO hydrogenation proceeds.56 MeOH, FT fuel, and olefin (e.g., C2–C4 hydrocarbon) are also considered to be produced via direct hydrogenation in this study. In direct CO2 hydrogenation to MeOH (DH–M), a catalyst of fibrous Cu/Zn/Al/Zr was used.37,57 The process involves three equilibrium reactions, similar to MS reactions, but it considers CO2 and H2 as feedstocks. Similarly, direct hydrogenation to FT fuel (DH-FT) or olefin (DH-O) reactions also occur in a series of RWGS to CO and hydrogenation to hydrocarbon, as presented in eqn (10)–(12). A DH-FT reactor contains an Fe-based catalyst at 300 °C and 25 bar58,59 for long-chain hydrocarbons, while DH-O uses Fe-K/γ-Al2O3 as the catalyst and operates at 300 °C and 10 bar for light hydrocarbons.37,60
| CO2 + H2 ↔ CO + H2O | (10) |
| nCO + 2nH2↔ –(CH2)n– + nH2O | (11) |
| nCO2 + 3nH2↔ –(CH2)n– + 2nH2O | (12) |
| MOx → MOx−δ + δ/2O2 | (13) |
| MOx−δ + δCO2 → δCO + MOx | (14) |
Because thermochemical CO2 energizing is used to produce CO2-based fuels, further conversion and separation processes are needed. Re-energized CO mixes with H2 to produce synthetic gas for further synthesis of fuels (e.g., MS, FTS, DMES).
| [a]CO2 + [b]nutrients + sunlight → [c]O2+ biomass | (15) |
Dehydration of methanol to DME (Dehydr.). As a building block in the chemical industry, MeOH can be converted into other chemicals and fuels via dehydration. Herein, the reaction takes place on a γ-Al2O3 catalyst at 250 °C and 10 bar,55,68 as expressed in eqn (16).
| 2CH3OH ↔ CH3OCH3 + H2O | (16) |
Methanol-to-gasoline (MTG)/methanol-to-olefin (MTO). MTG/MTO processes are important industrial processes that convert methanol into hydrocarbons. In MTG, MeOH is first equilibrium-dehydrated to DME over an HSZM-5 catalyst, and then it is converted to C2–C5 olefin and C5–C10 hydrocarbon at 300–400 °C.69 The conversion of MeOH to gasoline is expressed as eqn (17). MTO prefers the catalyst SAPO-34, compared to ZSM-5, for a higher yield of light olefins (C2–C4 hydrocarbons).70,71 The MTO reactions are presented in eqn (18).
 | (17) |
| nCH3OH → CnH2n + nH2O, n = 2, 3, 4 | (18) |
Dimethyl ether-to-gasoline (DTG). In DTG, DME is converted into a range of hydrocarbons promoted by zeolite, as expressed in eqn (19). The output hydrocarbons include light gas (C2–C4 hydrocarbons) as byproducts, and the main products of gasoline-range hydrocarbons72,73 are further separated using cryogenic distillation (e.g., debutanizer column).
| CH3OCH3 ↔ 2 –(CH2)– + H2O | (19) |
Distillation. Distillation separates a liquid mixture based on boiling temperatures. Equipment generally includes a column, a reboiler, a condenser, and a reflux drum. The liquid mixture is preheated and fed into the column, in which the reboiler continuously supplies heat to vaporize some components in a mixture. The vapor is cooled and condensed when passing through the condenser located on the top of the column. Part of the condensed liquid is recycled, and vaporization and condensation are repeated for higher purity, while the remainder is withdrawn. The operation of the distillation column differs in input mixture, desired recovery, and purity of liquids.
Chemical absorption. This study considered CO2 absorption using monoethanolamine (CO2–MEA) for separating CO2 from other gas species. For instance, the CO2/CO/H2 gas mixture from RWGS can be treated by CO2–MEA to adjust the ideal SN value for further fuel synthesis. The chemical absorption of CO2 in the amine solvent occurs in an absorber, while CO2 is recovered (reverse reaction) in a stripping column.74 The reactions are as follows:
| CO2 + RNH2 ↔ RNH2+COO− | (20) |
| RNH2+CO2− + RNH2 ↔ RNHCOO− + RNH3+ | (21) |
Adsorption. In this study, pressure swing adsorption (PSA) separates H2 and CO from other species at high pressure. The mixture is first pressurized and introduced to a column filled with adsorbent materials. The targeted gas species are adsorbed, while others pass through the column. Generally, a PSA system includes two or more adsorbers to ensure continuous operation during depressurization and regeneration to atmospheric pressure. The sorbent materials vary according to the targeted gas species. In this study, 5A zeolite is used for H2–PSA,38,75 while CO–PSA uses Cu–Cu+/θ-Al2O3.76
Membrane. A membrane allows some species to permeate, while others are retained. The cut-point of two fractions depends on the membrane material and gas species. This study uses a cellulose acetate (CA) membrane to separate both CO2 and H2 from a mixture of light hydrocarbons, especially in direct CO2 hydrogenation to olefins or light hydrocarbons. The membrane mechanism and permeability of species can be found elsewhere.38,77
Extraction. Extraction dissolves and extracts lipid compounds from algal biomass using a solvent. The algal biomass is first flocculated with chitosan, concentrated, and mechanically treated to disrupt the cells. Then, the raw oil is dissolved in the extracting solvent of butanol.47
3.3 Superstructure generation
Based on an extensive literature search for CO2 utilization technologies and possible production pathways to fuels, the CCU4E superstructure was developed by interconnecting multiple carbon conversion techniques, as presented in Fig. 3. A CO2-based fuel production pathway is a series of technologies, starting from catalytic conversion, thermochemical energizing, electrochemical reduction, and biological fixation, followed by upgrading processes or separation and purification for the desired fuels. In a complex CCU4E network, some fuels can be either final products or intermediates for further conversion(s). For instance, methanol is produced from direct catalytic CO2 hydrogenation or the methanol synthesis of syngas (e.g., CO via RWGS and extra outsourcing H2) and then supplied to the market as an end product. In other pathways, methanol can be further converted to other fuels such as dimethyl ether, olefin, and gasoline via the upgrading process of dehydration, MTO, or MTG. Notably, each technology consists of various operating instruments for its operation purpose (e.g., reaction kinetic expressions, temperature, pressure, etc.) which is described in detail in Section S2 in the ESI.† | ||
| Fig. 3 CCU4E superstructure with a simplified process flow diagram of technologies. Abbreviations: RWGS: reverse water–gas shift, DH-M: direct CO2 hydrogenation to methanol, DH-FT: direct CO2 hydrogenation to Fischer–Tropsch fuel, DH-O: direct CO2 hydrogenation to light olefin, CR5: thermochemical splitting via a counter-rotating-ring receiver/reactor/recuperator, Elecz-S: electrochemical reduction to syngas, Elecz.Et: electrochemical reduction to ethanol, Elecz.FA: electrochemical reduction to formic acid, C&H: algae cultivation and harvesting. MS: methanol synthesis, FTS: Fischer–Tropsch synthesis, DMES: dimethyl ether synthesis, Dehydr.: dehydration of methanol to dimethyl ether, MTO: methanol-to-olefin, MTG: methanol-to-gasoline, DTG: DME-to-gasoline synthesis, Hydrotr.: hydrotreating, COPSA: CO pressure swing adsorption, CO2MEA: CO2 absorption by monoethanolamine, Extract.: lipid production and extraction, SEP-M, SEP-D, SEP-FT, SEP-O, SEP-FA, SEP-ET: separation and purification for methanol, dimethyl ether, Fischer–Tropsch fuel, olefin, formic acid, and ethanol, respectively. | ||
4. Process simulation and parameter estimation
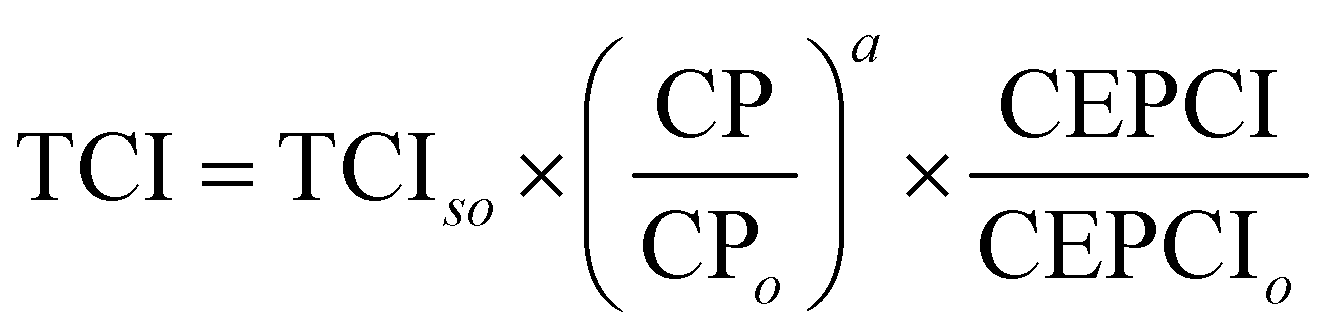
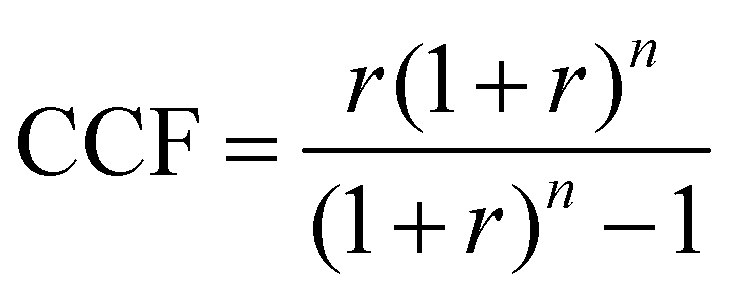
Based on the generated CCU4E framework and the literature, we developed a process simulation for each technology and further for each CO2-to-fuel process. Herein, a unit plant for CO2-to-fuel is assumed to operate with 3.1 Mtpa of CO2 feedstock, which is captured from the flue gas of a 500 MW coal-powered electric utility.46 Note that each technology consists of various operating instruments for its operation purpose. For example, catalytic conversion includes a main reactor, a compressor, a heater/cooler for adjusting pressure and temperature, a mixer, a splitter, and a vapor–liquid separator for recycling. The unit process configurations, specifications, and operating conditions are further discussed and provided in Section S2 in the ESI.† Among the possible pathways in CCU4E, we simulated 72 processes of CO2-to-fuels. The integration of technologies for each CO2-to-fuel pathway (from CO2 feedstock to final fuel products) is summarized in Table S4.3 in the ESI.† Note that biological CO2 fixation using algae, which is mentioned in Section 3, was excluded from further analysis due to its high sensitivity to regional and temporal environments: for instance, unpredictable production rate by unstable sunlight availability, uncertain operations by changeable algae growth rate, and different land requirements and yield expectation according to cultivation types (e.g., open raceway pond or bioreactor).For techno-economic and environmental analysis, the UPC and NCE were examined for each CO2-to-fuel pathway. Here, sizing data (e.g., mass flow, energy flow) and costing data (e.g., capacity cost and operating cost) of unit processes were obtained from process simulations for further technical performance (e.g., production yield, utility consumption), environmental performance (e.g., direct and indirect CO2-eq emission), and economic evaluation (e.g., production price), as presented in Table S4.3 in the ESI.† In the UPC calculation, the total production cost (TPC) was first estimated from annualized capital investment cost (ACC) and operating cost (OC). Total capital investment (TCI) comprises direct costs (equipment purchase and installation, piping, and instrumentation) and indirect costs (engineering and construction costs, along with contingent costs). For most unit processes, TCI was obtained and estimated based on equipment purchase costs from the Aspen Process Economic Analyzer.78 Otherwise, some TCI was estimated using a power-law expression for the capacity ratio considering the time-value adjustment expressed in eqn (22). Then, ACC was calculated based on TCI, as expressed in eqn (23), with the capital charge factor (CCF) formulated as in eqn (24).
 | (22) |
| ACC = TCI × CCF | (23) |
 | (24) |
The OC consists of fixed operating cost (FOC) and variable operating cost (VOC). The FOC includes labor, plant overhead, operating charge, maintenance, and general and administrative costs, which is presented as a percent of capital costs, set here as 5.1%.81 The VOC includes the costs of raw materials (e.g., captured CO2, H2, and H2O) and utilities (e.g., electricity, heat, and cooling), which are calculated based on the consumed amount (as obtained and presented in Table S4.3 in ESI†) and unit prices (assumed and provided in Table S3.1 in the ESI†). Finally, TPC is the sum of ACC and OC, as given in eqn (25):
| TPC = ACC + OC | (25) |
 | (26) |
In this study, an environmental evaluation was performed in terms of NCE, and that is the amount of CO2eq that the fuel process emits into the environment. A positive NCE indicates that the CO2-to-fuel processes do not perfectly mitigate emissions, which means emitting CO2eq into the environment. A negative NCE, which indicates environmental friendliness, shows the potential of using CO2 as a feedstock for energy-based products (reducing CO2eq). In this case, the CO2-to-fuel process reduces the CO2eq emission not only in its production stage but also by replacing the use of fossil fuels with CO2-based fuels. The NCE calculation from the CO2eq metrics of raw material inventories (RMI), direct emissions from plant operations (DCE), and indirect emissions (ICE) corresponds to utility use, as formulated in eqn (27). The CO2eq inventory of materials, utilities, and fuels are provided in Table S3.2 in the ESI.†
| NCE = RMI + DCE + ICE | (27) |
5. Techno-economic and environmental evaluation results
To evaluate the economic feasibility and environmental impacts, we conducted techno-economic and environmental analyses of 72 CCU4E processes. The technical and environmental metrics obtained from the Aspen simulation are summarized in Table S4.3 in the ESI.† Moreover, the parameters and assumptions used for economic and environmental analyses, such as the unit price of materials, utility, and CO2eq inventory, are provided in Section S3 in the ESI.† Here, the baseline for all processes is assumed to use green H2 at 4.4 $ per kg. The UPC and NCE of CO2-based fuels and their distributions are presented in Fig. 4. Here, the pathways were classified according to CO2 utilization technology and fuel products, and the distributions of UPC and NCE were analyzed according to the products. The catalytic conversion pathways commonly exhibit lower UPCs and lower NCEs. Catalytic CO2 conversion pathways produce CO2-based fuels at lower UPCs (ranging from 4.3 to 15.0 $ per GGE) compared to thermochemical energizing (7.8–48.3 $ per GGE) or electrochemical reduction (5.8–53.1 $ per GGE). MeOH, olefin, DME, and gasoline were distributed at 10 $ per GGE lower than FT fuels, FA, or EtOH. Interestingly, olefin via pathway #43 was the cheapest product among the CO2-based fuels of over 72 production pathways. For the environmental impacts of individual pathways, some for MeOH and olefin exhibit potentially highly negative NCEs (reduced CO2eq during its operation), as shown by the high density on the right-hand side of the graph in Fig. 4. For example, pathway #49, via thermochemical energizing of CO2 to gasoline, exhibited the most negative NCE at −6.1 kgCO2eq per GGE of gasoline. This pathway can reduce 6.1 kg CO2eq emissions when producing 1 GGE of gasoline. | ||
| Fig. 4 The UPC and NCE distribution of CO2-based fuels from 72 CCU4E pathways (baseline). | ||
In CCU4E, CO2-to-fuel pathways differ in the CO2 utilization approach (e.g., different types and required amounts of input materials and utilities) to various targeted products that result in a diversity of produced fuel UPC or NCE. Identifying the key factors of UPC and NCE is important for further efforts to lowering the production costs of sustainable CO2-based fuels in the 72 CCU4E pathways. Here, UPC is broken down into ACC, OC (e.g., CO2 and H2 feedstock and utility), and FOC. The NCE includes the CO2eq emission of feed, indirect emission from utility consumption, and direct emission during process operation, as shown in Fig. 5. For fuel production via catalytic CO2 conversion technology, H2 cost is the major contributor to UPC. Otherwise, ACC is the dominant cost component in fuel UPC via thermochemical energizing, which is primarily due to the high capital cost of thermochemical splitting (e.g., CR5) for collecting and concentrating the heat source and for the direct conversion of thermal energy into chemical energy (e.g., splitting CO2 into CO under high-temperature conditions). For electrochemical CO2 reduction processes, ACC (mainly by the expensive electrolyzer), H2 cost (for further fuel synthesis), and utility cost (electricity) presented relatively similar contributions to UPC, except the direct reduction of CO2 to FA (#71) and EtOH (#72), which do not use H2 as a feedstock. Generally, CO2-based fuels via CCU4E were produced at a two to three times higher price, compared to market prices. The most economical pathways for fuels were determined for the catalytic CO2 conversion approach, MeOH via pathway #10 (5.4 $ per GGE), FT fuel via #17 (6.6 $ per GGE), DME via #27 (5.8 $ per GGE), olefin via #43 (4.3 $ per GGE), and gasoline via #54 (5.4 $ per GGE). Otherwise, FA and EtOH were expensively produced via pathway #71 (at 27.0 $ per GGE) and #72 (53.1 $ per GGE), respectively, and those using electrochemical reduction of CO2, even though the major cost driver of utility (i.e., electricity) was assumed to be supplied from cheap sources (i.e., electrical grid).
 | ||
| Fig. 5 The UPC and NCE breakdowns of CO2-based fuels from 72 CCU4E pathways (baseline). | ||
In the NCE breakdown, the CO2eq inventory of CO2 feedstock is considered as a negative metric because CCU4E uses captured CO2 as a feedstock (reducing CO2eq emission); meanwhile, that of renewable/green H2 feedstock was assumed and recorded at zero. The positive CO2eq metric (emitted CO2eq) of indirect emission by using conventional/black utility is much higher than direct emission from the process, especially in electrochemical reduction pathways that required large amounts of electricity. Here, the most economical pathways for MeOH, FT, DME, olefin, and gasoline were identified as effective mitigation of CO2eq with a negative NCE; meanwhile, those for FA and EtOH were inefficient for CO2eq mitigation through CCU4E in this study. As it is targeted to reduce CO2eq and use CO2 for producing fuel products, the CO2-to-fuel pathways with economic potential (e.g., lower UPC) and ecofriendliness (e.g., negative or lower NCE) were further examined for each fuel type. Particularly, MeOH, FT, DME, olefin, and gasoline, which were primarily produced via catalytic conversion, were examined in a further sensitivity analysis to lower the UPC and reduce the NCE, mainly focusing on the effect of the key factor, H2.
6. Sensitivity analysis
6.1 Economic and environmental impact of different hydrogen sources
As pointed out in Section 5, the optimal CO2-to-fuel pathways (among various pathways in the CCU4E superstructure) using green and clean H2 (at 4.4 $ per kg and zero emissions) could reduce a huge CO2eq emission but result in a high fuel UPC. The H2 feedstock cost was also determined as the largest contribution to the UPC at 70–80%. Hence, cheaper fuels are expected to be produced by using cheaper H2, such as from natural gas/shale gas via reforming, coal gasification, and other conventional sources. In these cases, using H2 (here called black H2) resulted in a certain CO2eq emission that might result in a worse fuel NCE. Fig. 6 (a) and (b) presents the trade-off between economic and environmental benefits when using black H2 and green H2. The optimal UPC and NCE of each CO2-based fuel were estimated with the current values for global black H2 (2.7 $ per kg, 3.5 kgCO2eq per kg) and green H2 (4.4 $ per kg, no emission). Consequently, using black H2 resulted in a lower UPC than that in the case of green H2, but it is still far higher than the market price. Moreover, some pathways cannot ensure the environmental target, such as FT fuel and DME that emit CO2eq (NCE > 0); meanwhile, using green H2 could reduce at least 1 kgCO2eq per GGE (of FT fuel, #17) and up to 5.2 kgCO2eq per GGE (of gasoline, #54). | ||
| Fig. 6 (a) UPC and (b) NCE of CO2-based fuels using current black H2 and green H2, and (c) identification of optimal CO2-to-fuel pathways corresponding to H2 price. | ||
It is clear that CO2-based fuels are now far more expensive than market prices, but definitely eco-friendly compared to business-as-usual fuels (which emit CO2eq when producing and using), and the H2 feedstock price is the key finding for lower fuel UPC values. To achieve the target of producing CO2-based fuels, which reduce CO2eq at reasonable prices during the transition phase before the successful and economical use of sustainable fuels, the cleaner and cheaper H2 is further examined, and the fuel's UPC and NCE were examined in the use of different H2 markets (location) and technology development for H2 production varying by time.
6.2 Optimal pathways according to hydrogen price variation
Because green H2 makes CO2-to-fuel pathways environmentally friendly, more effort is required to lower fuel UPC values. Here, fuel UPC values were examined and estimated according to the H2 price, here ranging from 0 $ per kg to 14 $ per kg, as presented in Fig. 6(c). Note that the presented UPC of each fuel is the lowest value identified from the various pathways in the CCU4E superstructure, which is a so-called optimal pathway. The optimal pathways, which could be changed within an examined H2 price, were identified via an optimization model designed to minimize fuel UPC, as given in eqn (27), in which the sets of equality (h(x, y) = 0) and inequality (g(x, y) ≤ 0) constraints were set, and the operation variables (x, y ∈ Rn) were determined for the minimum fuel UPC within the constraint boundaries. See Section S5 in the ESI† for a detailed optimization model. | (28) |
As shown in Fig. 6(c), a straight line means only one pathway was selected to produce fuels within the examined H2 price (e.g., FT fuel, olefin, gasoline); meanwhile, an angled line indicates that the optimal fuel's pathway changed according to H2 price (e.g., MeOH, DME). Particularly, the optimal pathway for each fuel was determined:
• MeOH: Pathway #10 (catalytic direct CO2 hydrogenation to MeOH) if the H2 price is below 9.23 $ per kg; and Pathway #9 (electrochemical CO2 reduction to CO → CO2MEA → MeOH synthesis) if the H2 price is higher than 9.23 $ per kg.
• FT fuel: Pathway #17 (catalytic direct CO2 hydrogenation to FT fuel).
• DME: Pathway #27 (catalytic direct CO2 hydrogenation to MeOH → dehydration of MeOH to DME) if the H2 price is below 4.83 $ per kg; and Pathway #28 (catalytic RWGS → COPSA → DME synthesis → separation) if the H2 price is higher than 4.28 $ per kg.
• Olefin: Pathway #43 (catalytic direct CO2 hydrogenation to MeOH → methanol-to-olefin).
• Gasoline: Pathway #54 (catalytic direct CO2 hydrogenation to MeOH → MTG).
6.3 CCU4E strategy in different countries
As discussed in Section 6.1, black H2 or green H2 is the most critical decision for balancing economic outputs and CO2eq mitigation. Depending on the country's resources, different decisions can be made about using different H2 sources in combination with CO2 utilization for fuel products. Here, we examined CCU4E in terms of fuel UPC and NCE when using black and green H2 in the top six countries by share of global CO2 emissions: China, the United States, Europe, India, Japan, and Korea (Tables S6.1–S6.3 in the ESI†).82 Notably, black H2 was assumed to be produced from natural gas reforming integrated with a carbon capture unit,83 which resulted in the same CO2eq inventory at 3.5 kg CO2eq per kg H2 (due to the same technology), but it varied by cost based on natural gas price. China, India, Japan, and Korea share the same Asian natural gas market84 which resulted in the same price for black H2; meanwhile, the US and EU have their own market.85,86 Green H2 was assumed to be produced via water electrolysis driven by renewable electricity (e.g., mainly solar-based or wind-based energy), and it varied by local renewable electricity price. The hydrogen price and CO2eq inventory of each country are presented in Fig. 7(a), while fuel UPC and NCE are presented in Fig. 7(b)–(f). For most countries, CO2-based olefin was the most efficient in mitigating CO2eq at a lower UPC and a negative NCE (the smallest filled area in the spider plots). In contrast, CO2-based FT fuel was an inefficient product with a higher UPC compared to others, and it emitted CO2eq (big area in the radar chart), evenly using green and clean H2. China and India, which demonstrate a high potential for green energy and green H2, can achieve a lower price for CO2-based fuels using green H2. The United States obtained a relatively low UPC in both cases, especially in the use of black H2, due to its large natural gas potential.85 Korea and Japan's green H2 prices were far higher than black H2 prices, resulting in high UPC for green fuels; however, black H2 was still expensive for CO2-based fuels via CCU4E. Hence, a sensitivity analysis of a specific country's scenarios could provide different sustainable decisions to use black or green H2 in CO2 utilization for fuels, depending on the country's target/policy for economic output or environmental impact, or a balance of both issues.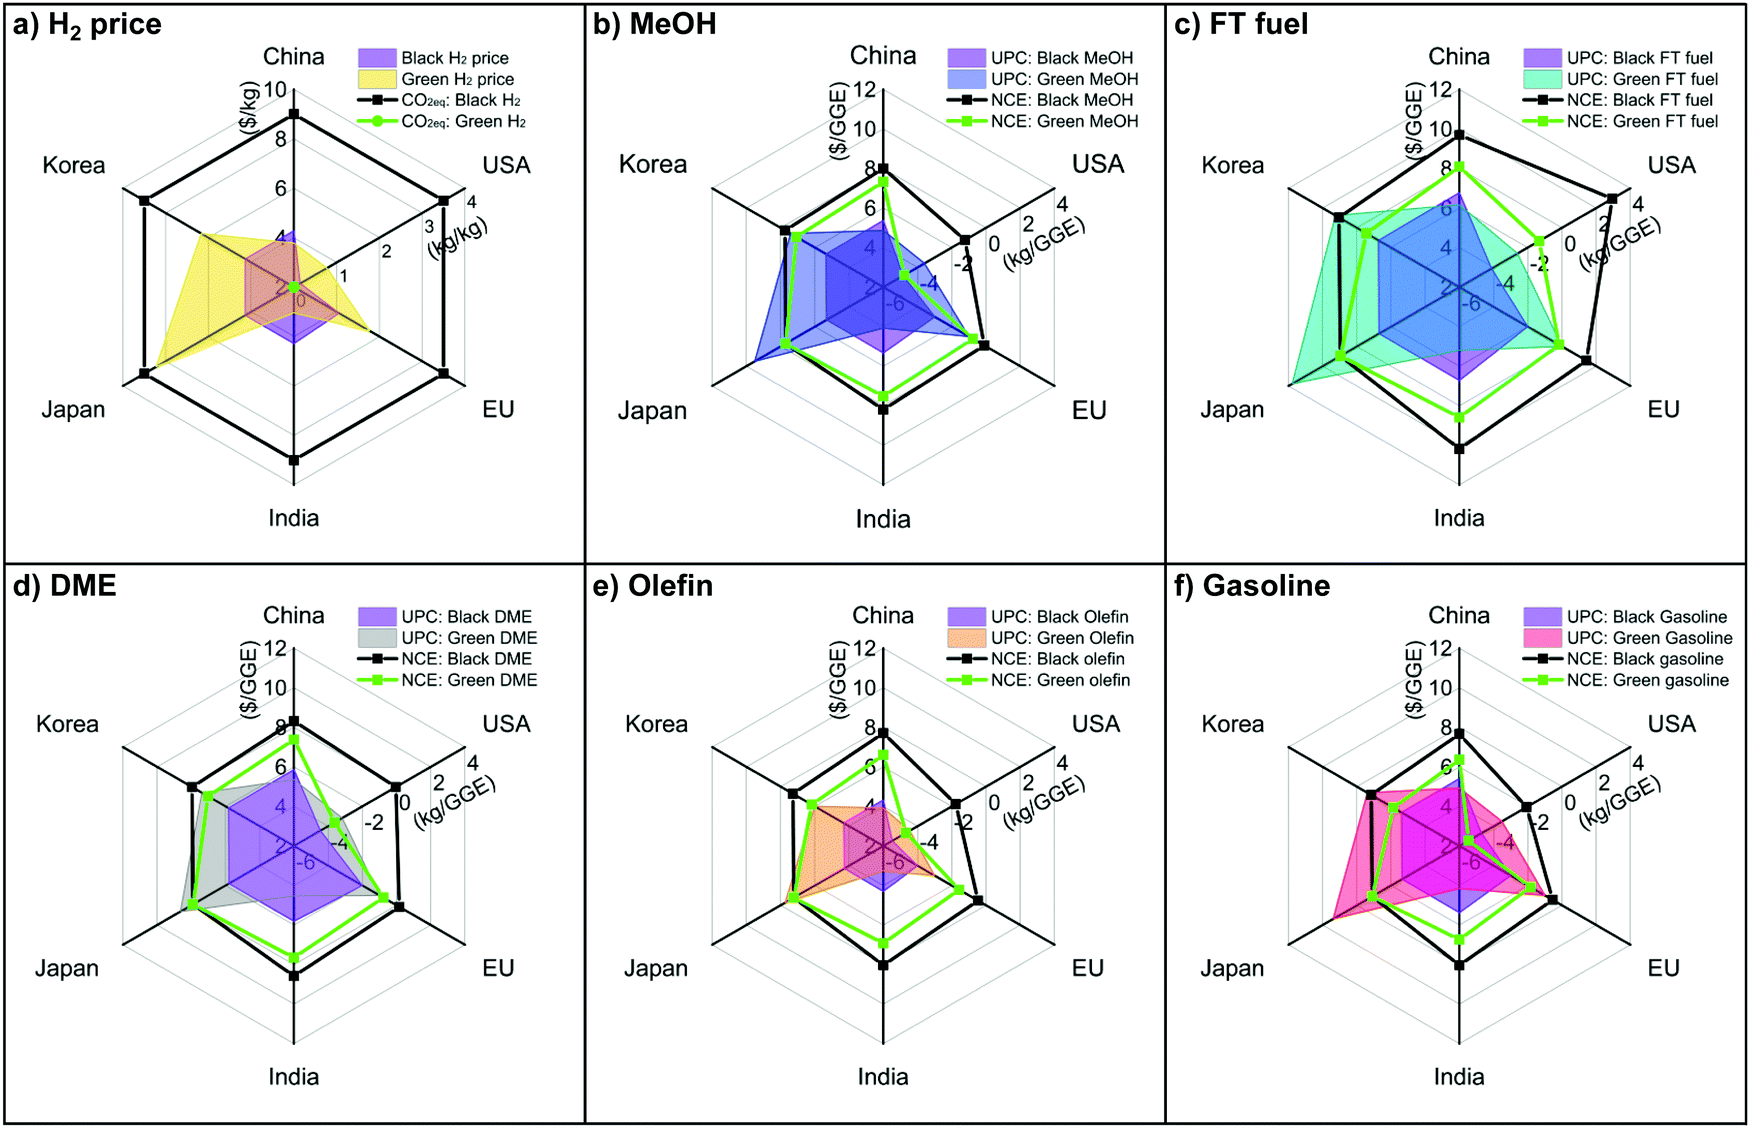 | ||
| Fig. 7 UPCs and NCEs of CO2-based fuels with black H2 and green H2 for the top countries producing CO2eq emissions. | ||
6.4 CCU4E strategy in a future hydrogen market
CCU4E was analyzed in the short-term future of 2020–2030, in which the green fuel UPC was estimated and considered as a function of green H2 price. The unit price of global black and green H2 was estimated and further adopted to analyze the techno-economic and environmental impacts of CCU4E. Similar to local black H2, global black H2 was assumed to be produced via methane steam reforming integrated with carbon capture, and its unit price is estimated based on the global natural gas market.84–87 The green H2 price was estimated based on the price of green electricity type (e.g., solar-based, wind-based, bioenergy) and technology development of water electrolyzers (e.g., alkaline – ALK, proton exchange membrane – PEM, solid oxide electrolyzer cell – SOEC). Here, we also considered the potential development of electrolyzers with a higher efficiency and a lower capital cost, resulting in lower green H2 prices.88–91 The estimation for H2 prices and economic parameters are detailed in Section S7 in the ESI.†Fig. 8(a) summarizes the projected global black and green H2 prices from 2020 to 2030. The black H2 price was estimated to slightly increase due to estimated higher natural gas prices.85,86,92 Meanwhile, green H2 is predicted to be cheaper, and the gap between it and various other renewable sources will narrow, with some approaching the cost of black H2 in 2030. This reduction is due to worldwide efforts to develop the technology on renewable electricity as well as renewable H2. The current global price of green H2 ranges from 3 to 15 $ per kg, which is much higher than that of black H2 at 2.0–4.5 $ per kg. However, the estimated future price range of both black and green H2 will approach 2.0–6.0 $ per kg in 2030. It is clear that green H2 exhibits economic potential for use in CCU4E.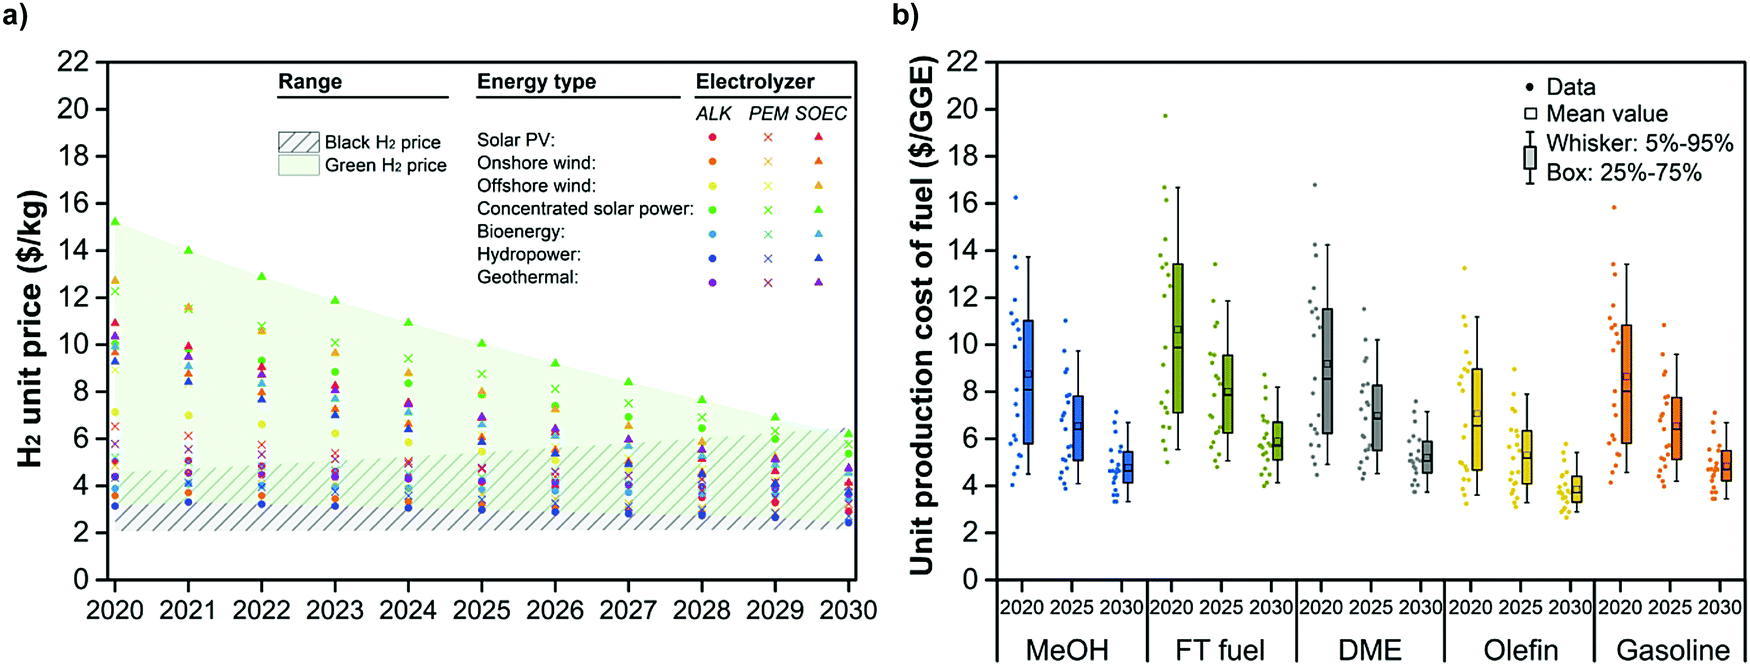 | ||
| Fig. 8 The future price of (a) black H2 and green H2, and (b) green fuel UPCs. | ||
Green fuel UPCs using green H2 were estimated for 2020, 2025, and 2030, as presented in Fig. 8(b). Green fuel UPCs decreased and narrowed during the examined period. This is due to the large effect of H2 price on fuels’ UPC, which corresponded to the H2 price trend, indicating the potential of lower prices for green H2 in the future for huge CO2eq reductions. This potential provides insights to utilize CO2 for fuels effectively. For example, suppose that green H2 is obtained from the most common technology of water alkaline electrolysis using solar and wind electricity due to the major contribution of solar-based and wind-based energy over the other renewable energy. In that case, the green H2 price will be around 2.4–2.9 $ per kg in 2030 (Table S7.5 in the ESI†). At this point, CCU4E prefers green H2 utilization with a lower UPC (e.g., 3.3 $ per GGE for green MeOH) to black H2 utilization with higher black fuel prices (e.g., 4.9 $ per GGE for black MeOH) (see Table S7.7 in the ESI†).
This work provided insights into black/green H2 and their effects on CO2 capture and utilization for energy products. Policymakers and stakeholders must consider the different H2 strategies for mitigating CO2eq in fuels, depending on the preference for eco-friendly or economic results.
7. Conclusions
This study aimed to develop a framework for CCU4E and examine techno-economic and environmental performances in different scenarios using conventional (black) and renewable (green) H2. The framework is based on a technology superstructure, which includes 72 CO2-to-fuel pathways through catalytic conversion, thermochemical energizing, and electrochemical reduction of CO2 to produce different fuel products (e.g., MeOH, FT fuel, DME, olefin, and gasoline). A process simulation for each CO2-to-fuel pathway was developed, and the techno-economic and environmental metrics were obtained for further analysis. The unit production costs and net CO2eq emissions were examined to evaluate the economic feasibility and environmental impact of different H2 sources. Currently, catalytic CO2 conversion exhibits lower fuels’ UPCs at higher CO2eq reduction potentials compared to other approaches, in which CO2-based MeOH (at 3.6 $ per GGE), olefin (at 2.9 $ per GGE), and gasoline (at 3.7 $ per GGE) are eco-friendly products with a negative NCE (reduced CO2eq emission) even when using black H2. In the future, using CO2 and green H2 for energy products with a huge reduction in CO2eq emissions at a lower price will be potentially possible, when green H2 prices are expected to decrease.This study revealed that in most CO2-to-fuel pathways the H2 price is the predominant cost in the fuels’ UPC. In other words, the energy cost associated with upcycling CO2 into high-calorific fuels is the largest cost-driver. Hence, securing low-cost and scalable hydrogen at which CO2 is converted into the final product is a crucial consideration. For instance, this study provided a suite of strategic solutions for various countries to use domestic black and green H2 in the CCU4E framework, to support countries in balancing economics and environmental protection.
Conflicts of interest
There are no conflicts to declare.Acknowledgements
This work was supported by the “Next Generation Carbon Upcycling Project” (Project No. 2017M1A2A2043137) through the National Research Foundation (NRF) funded by the Ministry of Science and ICT, Republic of Korea.References
- Global Carbon Atlas, Fossil Fuel Emission, http://www.globalcarbonatlas.org/en/CO2-emissions, (accessed 16 July 2020).
- International Energy Agency, Energy Technology Perspectives 2010: Scenarios & Strategies to2050, 2010.
- V. Masson-Delmotte, P. Zhai, H.-O. Pörtner, D. Roberts, J. Skea, P. R. Shukla, A. Pirani, W. Moufouma-Okia, C. Péan, R. Pidcock, S. Connors, J. B. R. Matthews, Y. Chen, X. Zhou, M. I. Gomis, E. Lonnoy, T. Maycock, M. Tignor and T. Waterfield, IPCC Special Report 1.5 - Summary for Policymakers - Global Warming of 1.5 degrees Centigrade, 2018.
- M. Bui, C. S. Adjiman, A. Bardow, E. J. Anthony, A. Boston, S. Brown, P. S. Fennell, S. Fuss, A. Galindo, L. A. Hackett, J. P. Hallett, H. J. Herzog, G. Jackson, J. Kemper, S. Krevor, G. C. Maitland, M. Matuszewski, I. S. Metcalfe, C. Petit, G. Puxty, J. Reimer, D. M. Reiner, E. S. Rubin, S. A. Scott, N. Shah, B. Smit, J. P. M. Trusler, P. Webley, J. Wilcox and N. Mac Dowell, Energy Environ. Sci., 2018, 11, 1062–1176 RSC.
- T. Terlouw, C. Bauer, L. Rosa and M. Mazzotti, Energy Environ. Sci., 2021, 14, 1701–1721 RSC.
- Global CCS Institute, SpringerReference DOI:10.1007/springerreference_15392.
- L. Joos, J. M. Huck, V. Van Speybroeck and B. Smit, Faraday Discuss., 2016, 192., 391–414 RSC.
- P. Markewitz, W. Kuckshinrichs, W. Leitner, J. Linssen, P. Zapp, R. Bongartz, A. Schreiber and T. E. Müller, Energy Environ. Sci., 2012, 5, 7281–7305 RSC.
- A. Otto, T. Grube, S. Schiebahn and D. Stolten, Energy Environ. Sci., 2015, 8, 3283–3297 RSC.
- I. Dimitriou, P. García-Gutiérrez, R. H. Elder, R. M. Cuéllar-Franca, A. Azapagic and R. W. K. Allen, Energy Environ. Sci., 2015, 8, 1775–1789 RSC.
- IEA (2019), Putting CO2 to Use, Paris.
- IEA (2019), Transforming Industry through CCUS.
- L. M. Bert Metz, O. Davidson, H. de Coninck and M. Loos, The IPCC special report on carbon dioxide capture and storage, Cambridge University Press, 2005 Search PubMed.
- C. Kolster, M. S. Masnadi, S. Krevor, N. Mac Dowell and A. R. Brandt, Energy Environ. Sci., 2017, 10, 2594–2608 RSC.
- Global CCS Institute & Parsons Brinckerhoff, Technology.
- S. C. Oh, E. Schulman, J. Zhang, J. Fan, Y. Pan, J. Meng and D. Liu, Angew. Chem., Int. Ed., 2019, 58, 7083–7086 CrossRef CAS PubMed.
- J. G. Jang, G. M. Kim, H. J. Kim and H. K. Lee, Constr. Build. Mater., 2016, 762–773 CrossRef CAS.
- S. Y. Pan, Y. H. Chen, L. S. Fan, H. Kim, X. Gao, T. C. Ling, P. C. Chiang, S. L. Pei and G. Gu, Nat. Sustainability, 2020, 3, 399–405 CrossRef.
- R. S. Norhasyima and T. M. I. Mahlia, J. CO2 Util., 2018, 26, 323–335 CrossRef CAS.
- S. Y. Pan, B. Lai and Y. Ren, RSC Adv., 2019, 9, 31052–31061 RSC.
- L. M. L. Laurens, J. Markham, D. W. Templeton, E. D. Christensen, S. Van Wychen, E. W. Vadelius, M. Chen-Glasser, T. Dong, R. Davis and P. T. Pienkos, Energy Environ. Sci., 2017, 10, 1716–1738 RSC.
- P. J. L. B. Williams and L. M. L. Laurens, Energy Environ. Sci., 2010, 3, 554–590 RSC.
- E. V. Kondratenko, G. Mul, J. Baltrusaitis, G. O. Larrazábal and J. Pérez-Ramírez, Energy Environ. Sci., 2013, 6, 3112–3135 RSC.
- M. Jouny, W. Luc and F. Jiao, Ind. Eng. Chem. Res., 2018, 57, 2165–2177 CrossRef CAS.
- G. Centi, E. A. Quadrelli and S. Perathoner, Energy Environ. Sci., 2013, 6, 1711–1731 RSC.
- M. D. Porosoff, B. Yan and J. G. Chen, Energy Environ. Sci., 2016, 9, 62–73 RSC.
- Y. Wu, Z. Jiang, X. Lu, Y. Liang and H. Wang, Nature, 2019, 575, 639–642 CrossRef CAS PubMed.
- Y. Wang, Z. Wang, C. T. Dinh, J. Li, A. Ozden, M. Golam Kibria, A. Seifitokaldani, C. S. Tan, C. M. Gabardo, M. Luo, H. Zhou, F. Li, Y. Lum, C. McCallum, Y. Xu, M. Liu, A. Proppe, A. Johnston, P. Todorovic, T. T. Zhuang, D. Sinton, S. O. Kelley and E. H. Sargent, Nat. Catal., 2020, 3, 98–106 CrossRef CAS.
- R. P. Ye, J. Ding, W. Gong, M. D. Argyle, Q. Zhong, Y. Wang, C. K. Russell, Z. Xu, A. G. Russell, Q. Li, M. Fan and Y. G. Yao, Nat. Commun., 2019, 10, 5698 CrossRef CAS PubMed.
- F. Zhang, Y. Zhu, Q. Lin, L. Zhang, X. Zhang and H. Wang, Energy Environ. Sci., 2021, 14, 2954–3009 RSC.
- J. H. Montoya, L. C. Seitz, P. Chakthranont, A. Vojvodic, T. F. Jaramillo and J. K. Nørskov, Nat. Mater., 2016, 16, 71–80 Search PubMed.
- A. González-Garay, M. S. Frei, A. Al-Qahtani, C. Mondelli, G. Guillén-Gosálbez and J. Pérez-Ramírez, Energy Environ. Sci., 2019, 12, 3425–3436 RSC.
- M. Jouny, G. S. Hutchings and F. Jiao, Nat. Catal., 2019, 2, 1062–1070 CrossRef CAS.
- N. Thonemann and M. Pizzol, Energy Environ. Sci., 2019, 12, 2253–2263 RSC.
- J. A. Herron, J. Kim, A. A. Upadhye, G. W. Huber and C. T. Maravelias, Energy Environ. Sci., 2015, 8, 126–157 RSC.
- V. Dieterich, A. Buttler, A. Hanel, H. Spliethoff and S. Fendt, Energy Environ. Sci., 2020, 13, 3207–3252 RSC.
- T. N. Do and J. Kim, J. CO2 Util., 2019, 33, 461–472 CrossRef CAS.
- T. N. Do and J. Kim, Energy Convers. Manage., 2020, 214, 112866 CrossRef CAS.
- J. Kim, T. A. Johnson, J. E. Miller, E. B. Stechel and C. T. Maravelias, Energy Environ. Sci., 2012, 5, 8417–8429 RSC.
- R. B. Diver, J. E. Miller, N. P. Siegel and T. A. Moss, in ASME 2010 4th International Conference on Energy Sustainability, ES 2010, 2010.
- J. Kim, C. A. Henao, T. A. Johnson, D. E. Dedrick, J. E. Miller, E. B. Stechel and C. T. Maravelias, Energy Environ. Sci., 2011, 4, 3122–3132 RSC.
- H. Rabiee, L. Ge, X. Zhang, S. Hu, M. Li and Z. Yuan, Energy Environ. Sci., 2021, 14, 1959–2008 RSC.
- R. Sharifian, R. M. Wagterveld, I. A. Digdaya, C. Xiang and D. A. Vermaas, Energy Environ. Sci., 2021, 14, 781–814 RSC.
- R. G. Grim, Z. Huang, M. T. Guarnieri, J. R. Ferrell, L. Tao and J. A. Schaidle, Energy Environ. Sci., 2020, 13, 472–494 RSC.
- J. Na, B. Seo, J. Kim, C. W. Lee, H. Lee, Y. J. Hwang, B. K. Min, D. K. Lee, H. S. Oh and U. Lee, Nat. Commun., 2019, 10, 5193 CrossRef PubMed.
- J. M. Spurgeon and B. Kumar, Energy Environ. Sci., 2018, 11, 1536–1551 RSC.
- R. Davis, A. Aden and P. T. Pienkos, Appl. Energy, 2011, 88, 3524–3531 CrossRef.
- S. M. Jarvis and S. Samsatli, Renewable Sustainable Energy Rev., 2018, 85, 46–68 CrossRef CAS.
- J. C. Abanades, E. S. Rubin, M. Mazzotti and H. J. Herzog, Energy Environ. Sci., 2017, 10, 2491–2499 RSC.
- S. Kim and J. Kim, Fuel, 2020, 266, 117093 CrossRef CAS.
- K. M. Vanden Bussche and G. F. Froment, J. Catal., 1996, 161, 1–10 CrossRef CAS.
- S. Kim, M. Kim, Y. T. Kim, G. Kwak and J. Kim, Energy Convers. Manage., 2019, 182, 240–250 CrossRef CAS.
- S. Han, S. Kim, Y. T. Kim, G. Kwak and J. Kim, Energy Convers. Manage., 2019, 187, 1–14 CrossRef CAS.
- S. Michailos, S. McCord, V. Sick, G. Stokes and P. Styring, Energy Convers. Manage., 2019, 184, 262–276 CrossRef CAS.
- C. Mevawala, Y. Jiang and D. Bhattacharyya, Appl. Energy, 2017, 204, 163–180 CrossRef CAS.
- S. Saeidi, N. A. S. Amin and M. R. Rahimpour, J. CO2 Util., 2014, 5, 66–81 CrossRef CAS.
- A. A. Kiss, J. J. Pragt, H. J. Vos, G. Bargeman and M. T. de Groot, Chem. Eng. J., 2016, 284, 260–269 CrossRef CAS.
- C. Zhang, R. Gao, K.-W. Jun, S. K. Kim, S.-M. Hwang, H.-G. Park and G. Guan, J. CO2 Util., 2019, 34, 293–302 CrossRef CAS.
- T. Riedel, G. Schaub, K. W. Jun and K. W. Lee, Ind. Eng. Chem. Res., 2001, 40, 1355–1363 CrossRef CAS.
- S. Najari, G. Gróf, S. Saeidi and F. Gallucci, Int. J. Hydrogen Energy, 2019, 44, 4630–4649 CrossRef CAS.
- R. B. Diver, J. E. Miller, M. D. Allendorf, N. P. Siegel and R. E. Hogan, J. Sol. Energy Eng., 2008, 130, 041001 CrossRef.
- R. B. Diver, N. P. Siegel, T. A. Moss, J. E. Miller, L. Evans, R. E. Hogan, M. D. Allendorf, J. N. Stuecker and D. L. James, Trans. ASME: J. Sol. Energy Eng., 2008, 130, 0410011 CrossRef.
- A. Martino, Sunshine to Petrol: Reimagining Transportation Fuels, Sandia Natl. Lab., U.S. Dep. Energy, 2017, pp. 1–24 Search PubMed.
- M. Zhong, K. Tran, Y. Min, C. Wang, Z. Wang, C. T. Dinh, P. De Luna, Z. Yu, A. S. Rasouli, P. Brodersen, S. Sun, O. Voznyy, C. S. Tan, M. Askerka, F. Che, M. Liu, A. Seifitokaldani, Y. Pang, S. C. Lo, A. Ip, Z. Ulissi and E. H. Sargent, Nature, 2020, 581, 178–183 CrossRef CAS PubMed.
- F. P. García de Arquer, C. T. Dinh, A. Ozden, J. Wicks, C. McCallum, A. R. Kirmani, D. H. Nam, C. Gabardo, A. Seifitokaldani, X. Wang, Y. C. Li, F. Li, J. Edwards, L. J. Richter, S. J. Thorpe, D. Sinton and E. H. Sargent, Science, 2020, 367, 661–666 CrossRef PubMed.
- L. Fan, C. Xia, F. Yang, J. Wang, H. Wang and Y. Lu, Sci. Adv., 2020, 6, 1–17 Search PubMed.
- F. R. Soares, G. Martins and E. S. M. Seo, Environ. Technol., 2013, 34, 1777–1781 CrossRef CAS PubMed.
- S. Michailos, S. McCord, V. Sick, G. Stokes and P. Styring, Energy Convers. Manage., 2019, 184, 262–276 CrossRef CAS.
- S. B. Jones and Y. Zhu, Techno-Economic Analysis for the Conversion of Lignocellulosic Biomass to Gasoline via the Methanol-to-Gasoline (MTG) Process, U.S. Dep. Energy, 2011, pp. 242–262 Search PubMed.
- M. R. Gogate, Pet. Sci. Technol., 2019, 37, 559–565 CrossRef CAS.
- D. Xiang, S. Yang and Y. Qian, Energy Convers. Manage., 2016, 110, 33–41 CrossRef CAS.
- F. Trippe, M. Fröhling, F. Schultmann, R. Stahl, E. Henrich and A. Dalai, Fuel Process. Technol., 2013, 106, 577–586 CrossRef CAS.
- C. D. Chang and A. J. Silvestri, J. Catal., 1977, 47, 249–259 CrossRef CAS.
- B. Lv, B. Guo, Z. Zhou and G. Jing, Environ. Sci. Technol., 2015, 49, 10728–10735 CrossRef CAS PubMed.
- Z. Peng, A Novel hydrogen and oxygen generation system, LSU Master’s theses, 2003, pp. 1–18 Search PubMed.
- Y. Il Lim, J. Choi, H. M. Moon and G. H. Kim, Korean Chem. Eng. Res., 2016, 54, 320–331 CrossRef.
- B. Chen, X. Ruan, W. Xiao, X. Jiang and G. He, J. Nat. Gas Sci. Eng., 2015, 26, 1254–1263 CrossRef CAS.
- Aspen Plus. Version 10.0, Aspen Technology Inc, 2019, http://www.aspentech.com Search PubMed.
- M. S. Peters and J. I. Peters, Eng. Econ., 1959, 5, 27–30 CrossRef.
- S. Jenkins, Chemical Engineering plant cost index: 2018 annual value, https://www.chemengonline.com/2019-cepci-updates-january-prelim-and-december-2018-final/, (accessed 20 October 2020).
- J. Kim, S. M. Sen and C. T. Maravelias, Energy Environ. Sci., 2013, 6, 1093–1104 RSC.
- Union of Concerned Scientists, Each Country's Share of CO2 Emissions, https://www.ucsusa.org/resources/each-countrys-share-co2-emissions, (accessed 3 May 2020).
- Y. Khojasteh Salkuyeh, B. A. Saville and H. L. MacLean, Int. J. Hydrogen Energy, 2017, 42, 18894–18909 CrossRef CAS.
- IEA, Evolution of natural gas spot market prices, 2014-2019, Paris, https://www.iea.org/data-and-statistics/charts/evolution-of-natural-gas-spot-market-prices-2014-2019, (accessed 4 March 2020).
- EIA Henry Hub Natural Gas Spot Price, https://www.eia.gov/dnav/ng/hist/rngwhhdm.htm, (accessed 5 September 2020).
- YCharts, European Union Natural Gas Import Price, https://cutt.ly/MbHp4AA, (accessed 5 September 2020).
- Y. Khojasteh Salkuyeh, B. A. Saville and H. L. MacLean, Int. J. Hydrogen Energy, 2017, 42, 18894–18909 CrossRef CAS.
- S. Bourne, The Future of Hydrogen: Seizing Today's Opportunities, 2019 Search PubMed.
- IEA (2020), World Energy Model, Paris https://www.iea.org/reports/world-energy-model.
- Renewable Energy Institute, Statistics: RE, https://www.renewable-ei.org/en/statistics/re/, (accessed 9 April 2020).
- IRENA, Renewable Power Generation Costs in 2017, Abu Dhabi, 2019.
- IEA, Evolution of natural gas spot market prices, 2014–2019, IEA, Paris.
Footnotes |
| † Electronic supplementary information (ESI) available. See DOI: 10.1039/d1ee01444g |
| ‡ Authors contributed equally to the manuscript. |
| This journal is © The Royal Society of Chemistry 2022 |