 Open Access Article
Aerosol emissions and their volatility from heating different cooking oils at multiple temperatures†
Sumit
Sankhyan‡
 a,
Kayley
Zabinski
b,
Rachel E.
O'Brien§
 c,
Steven
Coyan
a,
Sameer
Patel¶
a and
Marina E.
Vance
 *ab
*ab
aDepartment of Mechanical Engineering, University of Colorado Boulder, 1111 Engineering Drive, 427 UCB, Boulder 80309, CO, USA. E-mail: marina.vance@colorado.edu
bEnvironmental Engineering Program, University of Colorado Boulder, 4001 Discovery Drive, Boulder 80303, CO, USA
cDepartment of Chemistry, William & Mary Williamsburg, VA, USA
First published on 26th September 2022
Abstract
Heating cooking oils at high temperatures emits aerosols in the fine and ultrafine size ranges as well as a variety of volatile organic compounds. Exposure to these emissions has been associated with various respiratory and cardiovascular ailments. In this study, we characterized aerosol emissions from various popular frying oils using an electric heat source at multiple temperatures (below and above their individual smoke points). At 180 °C, a common deep-frying temperature, oils with lower smoke points (olive oil and lard) generated the highest aerosol mass concentrations among all oils tested. The volatility characteristics of these oil-generated aerosols were also studied by analyzing their volume distributions after thermal conditioning through a thermodenuder. For most of the oils, thermal conditioning beyond temperatures of 75 °C resulted in the near complete removal of volatiles leaving behind non-volatile cores in the 60–100 nm range. Fourier Transform-Ion Cyclotron Mass Spectrometry analyses of sample extracts obtained from smoking different oils exhibited large chemical similarity with average molecular mass in the range of 620–640 atomic mass units and low oxygen-to-carbon ratios (∼0.16). Lastly, we estimated the respiratory deposition values of different oils for a 30 minute exposure period, and the results show that lard had the highest average particle mass deposition in all three regions of the respiratory system (1–10 μg), whereas peanut oil had the lowest average values (∼1 μg).
Environmental significanceA variety of cooking oils with different smoke points are often used in large quantities in various indoor settings such as home kitchens and restaurants without effective control measures. In this study we compared the emissions from heating different oils to study the relevance of controlling cooking temperatures below their respective smoke point in reducing the associated aerosol exposure. We also studied the fate of these emissions by studying their volatility parameters and compared the soft ionization mass spectra of the smoke sample extracts from different oils. Lastly, we related these results to the health effects by evaluating the aerosol mass deposited in different regions of the respiratory system upon 30 min of exposure to these heated oil emissions. |
1 Introduction
Cooking is a major source of indoor air pollution. Cooking emissions usually contain ultrafine and fine particulate matter (PM) as well as a variety of volatile organic compounds (VOCs) such as alkanes, formaldehyde, benzene, toluene and xylene, and polycyclic aromatic hydrocarbons (PAHs).1–4 Exposure to cooking emissions has been linked with various respiratory and cardiovascular ailments and cancer-related risks.5–7 In recent years, various studies characterizing different aspects of cooking activities included type of stove and fuel used, cooking ingredients and methods, and evaluating measures for reducing cooking emissions and mitigating associated occupant exposures.4,8–11 These works have highlighted the need for continuously optimizing indoor cooking practices to reduce occupant exposure. Indoor cooking—especially in commercial settings—has also been shown to impact ambient air quality and global climate due to the release of PM and VOCs.12–14 As such, it is also important to investigate their fate to optimize control strategies that also reduce emissions to the outdoor environment while minimizing indoor occupant exposure.10,15–19Since most of the cooking activities undertaken indoors include a heat source, there have been concerted efforts to promote the switch to cleaner fuels and improved cookstoves, especially in developing countries to reduce PM exposure associated with fuel burning. These studies have also led to a proliferation of different models of improved cook stoves, which have shown to work well for their intended purpose.11,20 In the developed world, the focus has shifted primarily towards the use of different control strategies and optimizing cooking practices due to the mass availability of cleaner fuels. Significant progress has been made towards diverting the attention of the general public towards the use of control measures such as extracting range hoods and portable air cleaners, as well as increased ventilation in cooking areas to reduce exposure.21–23 In terms of optimizing cooking activities, past research has focused largely on characterizing the effects of cooking temperature, combination of ingredients, and cooking methods such as frying versus grilling on the release of PM and VOCs in different indoor settings.24–28
Frying in particular has been associated with higher PM emissions, especially in the ultrafine range, compared to other cooking practices utilizing oil.3,26,29 It has been well documented that keeping the cooking temperature below the oil's smoke point results in lower emission rates.26,30 At temperatures near the smoke point, fat breakdown occurs, leading to the formation of glycerol and free fatty acids. These products can then decompose further into VOCs and can further act as precursors to secondary organic aerosol (SOA) formation, which may explain the increased particle emission rates.24,31,32 Therefore, cooking temperature control may be useful in not only reducing human exposure to cooking aerosols but also preventing the release of organic compounds into ambient air—especially for oils with lower smoke points.33 Moreover, due to considerably larger quantities of oil being used in the frying process, it becomes important to study the relevance of smoke point and compare aerosol emissions relative to frying temperature.
In terms of health effects, the VOCs emitted during deep-frying present greater carcinogenic risk—primarily due to aldehydes—compared to other cooking methods using oil.28 This is in addition to the release of fine and ultrafine particulate matter which further aggravates the health risk associated with cooking oil emissions.33–35 Moreover, previous studies on the volatility of cooking emissions have reiterated that cooking aerosols can also contribute to SOA formation in ambient environments due to different aging processes making cooking emissions a pollutant of outdoor concern.18,32,36–38 The lower volatility compounds in cooking emissions could also feature in indoor surface organic films, thereby driving various gas-phase partitioning mechanisms and further affecting the indoor chemistry of aerosols.39–41
The main objectives of this study were to characterize emissions from different cooking oils as they were heated over a range of temperatures, including 180 °C, a common deep-frying temperature, as well as each oil's individual smoke point and 20 °C above it. We also investigated the volatility characteristics of different cooking oils using a thermodenuder. We further characterized the lower volatility compounds in terms of their chemical composition and double bond equivalencies. Lastly, we compared the particle deposition values in different regions of the respiratory system associated with heating different cooking oils to relate these results to the potential health effects associated with their use in indoor settings.
2 Methods
2.1 Oils tested
In this study, we tested five different types of cooking oils with a wide range of smoke points. These oils were selected because of their popularity as frying oils and the wide range in their smoke point and fat composition. All the oils used for this study were purchased directly from a local store and were stored in a lab shelf at room temperature, away from direct sunlight, during the course of the experiment. The physical and chemical characteristics of each oil are given in Table 1.| Oil | Lard | Coconut (refined) | Olive (extra light) | Peanut | Soybean | Canola | |
|---|---|---|---|---|---|---|---|
| Smoke point (°C) | 190 | 204 | 208 | 227 | 234 | 238 | |
| Fatty acid content | Saturated | 39% | 82.5% | 14.3% | 20.3% | 15.6% | 7.4% |
| Monounsaturated | 45% | 6.3% | 70% | 48.1% | 22.8% | 63.3% | |
| Polyunsaturated | 11% | 1.7% | 10.7% | 31.5% | 57.7% | 28.1% | |
Lard has the lowest smoke point (∼190 °C), whereas both canola and soybean oils have the smoke points in the higher range (232–238 °C). In terms of fat composition, canola oil has the lowest saturated fat content (7.4%) and highest unsaturated fat content (91.4%), while coconut oil is the opposite, with the highest saturated fat content (82.5%) and lowest unsaturated fat content (8%). The olive oil used for this study was advertised by the manufacturer as “ideal for frying” and, according to the product label, contained a mixture of refined olive oil and virgin olive oil. Another thing to mention here is that the soybean oil was marketed as vegetable oil on the product label by the particular brand we opted to use for this study.
2.2 Experimental setup
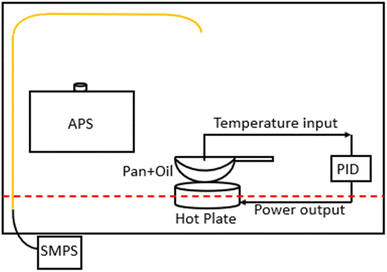
A schematic of the setup that was used to compare aerosol size distributions for different cooking oils heated over a range of temperatures is shown in Fig. 1. Briefly, 200 ml of oil was heated in a shallow stainless steel frying pan placed on an electric hot plate inside a fume hood. Similar setups have been used previously in other cooking oil characterization studies.24,42 The power supply of the hot plate (kept at medium heat setting) was controlled according to the oil temperature feedback from a k-type thermocouple to the proportional-integral-derivative (PID) controller.The fume hood sash was kept slightly open (13 cm from a fully closed position), pulling ambient air at a flow rate of ∼0.6 m3 s−1 towards the back panel of the fume hood. The pan was kept at the center of the fume hood, 2 cm away from the sash opening. We measured an air velocity of 0.24 m s−1 for up to 7 cm above the pan surface and zero air velocity for the remainder of the height of the fume hood. The lab space was usually unoccupied while the experiments were being conducted, thereby reducing the chances of any background sources interfering with the fume hood measurements.
The pan was washed with dish soap before each experiment and preheated for ∼15 min on the electric hot plate to remove any oil residue from the previous experiment and from any deposition taking place during storage. Afterwards, a given oil sample was poured onto the heated pan, and the resulting emissions were sampled. The temperature of the PID-controlled hot plate was set to 100 °C, 150 °C, 180 °C (the most commonly used deep-frying temperature), each oil's smoke point, and 20 °C above the smoke point (to account for several high-temperature cooking processes–other than deep frying–that are likely to reach above the smoke point of oils involved, such as stir-frying, baking, grilling, etc.). Each of these temperature setpoints was held for 15–20 min. We also recorded the real-time oil temperature values from the controller display panel in 1–5 minute intervals and the average of the percentage difference between the actual temperature and the set temperature (180 °C) values ranged between 4–6% for different oils.
An aerodynamic particle sizer (APS 3330, TSI, Shoreview MN) and a scanning mobility particle sizer (SMPS 3936, TSI), composed of a long differential mobility analyzer (DMA 3080L, TSI) and a water-based condensation particle counter (CPC 3788, TSI), were used for sampling aerosol size distributions. The sampling locations for both the instruments were chosen based on the inherent flow conditions inside the fume hood while at the same time ensuring maximum capture efficiency while sampling aerosols in ultrafine and fine size ranges. The APS was kept on an elevated platform (30 cm above the fume hood floor surface) next to the hot plate inside the fume hood whereas the SMPS sampled emissions through a copper inlet (0.64 cm ID) installed at the top of the fume hood. The last remaining section of the inlet was connected to conductive silicone tubing for connection with the SMPS inlet. We assumed a particle density of 1 g cm−3 throughout our analysis based on recommendations from previous studies.9,43
For studying the aerosol volatility characteristics, a thermodenuder (TD) was connected between the sampling inlet and the SMPS. During the experiment, the cooking oil was kept at 180 °C and the temperature of the heated section was ramped up in 25 °C increments till it reached 150 °C. The fraction of volatized material lost due to heating for different oils was qualitatively compared by observing the trends in averaged geometric mean diameter (GMD) of the volume distributions for a given TD temperature and volume fraction remaining (VFR). The VFR was calculated by taking the ratio of the averaged total volume concentration at a given TD heated section temperature to the averaged total volume concentration at ambient temperature.44 The TD system was derived from the design proposed and characterized in Huffman et al.45 A schematic of the TD used in this study is shown in Fig. 2.
The TD consisted of two sections: a heating section and a denuding section. The heating section was made up of stainless-steel tubing (1-inch OD) with heating tape wrapped around it encased in a stainless-steel chamber with rectangular cross-section, filled with fiberglass insulation material. The temperature of the heating section was monitored using a surface K-type thermocouple (attached to the outer surface of the heating tube) connected to a temperature controller. This measurement was previously calibrated using a different thermocouple at the center of the airstream. A temperature characterization of the heating section is described in greater detail in section S1 of the ESI file†.
The denuder section consisted of a stainless steel-mesh tube (1-inch OD) inside a 4-inch aluminum pipe and its annular space was filled with granular activated carbon for VOC adsorption. Both sections were connected using a Swagelok connector and a Swagelok reducing union was also used at the ends of the assembly so that the entire assembly could be connected to quarter-inch conductive silicone tubing. Information on the particle loss calculations for the sampling line and the TD setup is given in ESI file section S2†.
2.3 FT-ICR MS of smoke generated from heated oils
For chemical characterization of oil-generated smoke, a comparable heating set-up was used in a hood at William & Mary to minimize the time between collection of particles and extraction for further analysis. For these studies, the oils were heated to around the smoke point or up to ∼20 °C above it. Smoke particles were collected through a small denuder at ∼4–5 lpm onto a Teflon filter for ∼1 hour. A similar protocol to what has been previously used to characterize indoor surface films was used.39 Samples were extracted with acetonitrile and concentrated under a gentle flow of ultra-pure nitrogen. For analysis, these samples were shipped over-night on ice to Old Dominion University for analysis in a Fourier Transform-Ion Cyclotron Resonance (FT-ICR) Mass Spectrometer. This data was collected at the COSMIC lab on a Burker Daltonics 12 Tesla Apex Qe FT-ICR MS using methanol as the solvent, positive ion mode, and an Apollo II electrospray ionization (ESI) source. Mass Spectra were picked using DeCON 2LS (https://pnnl-comp-mass-spec.github.io/DeconTools/) with a peak to background ratio of 5 and a signal to noise threshold of 3. Peaks were picked in the range of C0–100 H0–200N0–3O0–50 within a ±1 ppm window using the Molecular Formula Calculator (https://nationalmaglab.org/user-facilities/icr/icrsoftware).For peak assignments, 2D and 1D kendrick mass series were used (CH2, H2, and O) and all peaks were removed that overlapped within ±2 ppm of peaks measured using solvent blanks run on the same day. The double bond equivalence (DBE) was calculated using eqn (1):
 | (1) |
2.4 Respiratory deposition analysis
We compared the PM mass deposited in different regions of the respiratory system associated with an arbitrary 30 minutes of heating time for each type of oil. We used the deposition model developed by the used International Commission on Radiological Protection (ICRP).46 The model uses empirical equations to estimate deposition in three main regions of the human respiratory system-head airways (HA), tracheobronchial (TB) and alveolar (AL) using aerosol number size distribution data.The model input parameters were set to a particle density of 1 g cm−3 and a volumetric inhalation rate of 7.8 L min−1, which corresponds to the breathing rate for adults engaged in sitting activity.47 Time-resolved number distribution data corresponding to the 180 °C cooking temperature was used to compare aerosol mass deposited in the different regions of the respiratory system for a given cooking oil exposure. Since these results were calculated using a fixed-point sampling method, the deposition values are meant for a qualitative comparison between different oils.
3 Results and discussion
3.1 Aerosol size distributions from heating different cooking oils
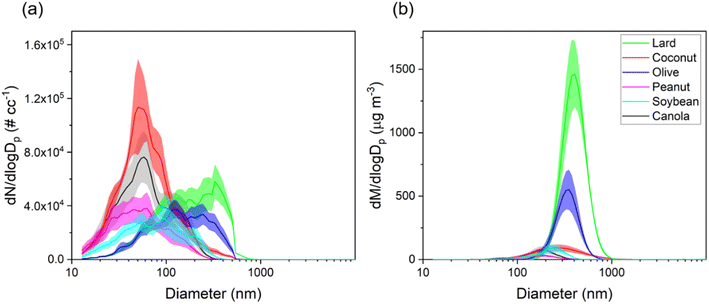
This section presents particle size distributions in terms of number and mass concentrations for different cooking oils heated at the common deep-frying temperature, i.e., 180 °C. The distributions varied greatly between different oils with clear differences in modes and peak number concentrations observed distinctly for each oil as shown in Fig. 3. A table showing the mode, total particle number and mass concentrations for each oil is also presented in Table S1 of the ESI file†.In terms of the particle number size distributions for different oils, the total number concentrations ranged between 2.5 × 10⁴–6.5 × 10⁴ # cm−3 with the highest concentration attributed to coconut oil, whereas the lowest concentration was measured for soybean oil. The modes for the particle size distributions for coconut, canola, peanut, and soybean oil were observed to be in the ultrafine range (50–90 nm) whereas for olive oil and lard, the mode of the distribution was in the accumulation mode range (100–1000 nm). These results agree well with those from Torkmahalleh et al.33 (with the exception of olive oil) in which the particle number mode diameters in the 130–197 °C cooking temperature range for different plant-based oils ranged between 16–82 nm.
In terms of mass distributions, the particle modes were in the 200–400 nm range for all oils. Particles in the size range of 100 nm – 1 μm constituted most of the total mass concentrations as was observed in previous studies characterizing cooking oil emissions.25,48 Heating lard (smoke point of 190 °C) resulted in the highest total mass concentration value of 450 μg m−3 followed by olive oil (163 μg m−3, smoke point of 208 °C), whereas the lowest value of 14 μg m−3 was measured for peanut oil (smoke point of 227 °C). Among plant-based oils, olive oil has been shown to emit higher PM mass at a fixed temperature due to the presence of increased triolein content; triolein has high molecular weight as compared to other triglycerides found in the oils.26 In general, oils with higher smoke points (>227 °C) had lower values of total mass concentrations when compared to low smoke point (190–210 °C range) cooking oils as shown in Fig. S3.† However, although soybean and canola oil have the highest smoke points (234 °C and 238 °C), their total particle mass concentrations were over 2× higher than that from peanut oil (227 °C).
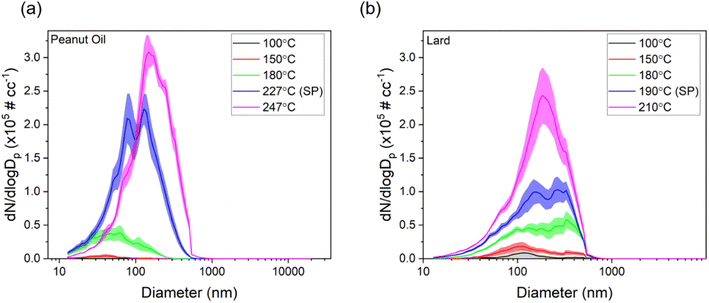
Next, we present size distributions for two oils commonly used for deep frying, peanut oil and lard, over different cooking temperatures to observe differences in their behavior based on smoke points and their source (peanut oil being plant-based and lard being animal-based), as shown in Fig. 4. The corresponding aerosol mass distributions are also shown in Fig. S4.†
For lower cooking temperatures of 100 and 150 °C, the mode of the distributions was in the ultrafine range for both oils. However, as soon as the temperature went above 180 °C, the mode started to shift into the accumulation mode range (100 nm −1 μm) for both oils. If we compare the total number concentrations for 180 °C and SP +20 °C for both oils, the increase was around 600% and 300% for peanut oil and lard, respectively. This could be due to thermal oxidation of oils resulting in increased SVOC emissions which can be sorbed onto the particle cores emitted by hot plate or by coagulation. These results also agree with previous studies wherein increased cooking temperatures were shown to exhibit bimodal distributions with higher concentrations in the accumulation mode.17 Overall, these findings present strong evidence for ensuring cooking temperatures below the smoke point and, if possible, employing the use of a strict temperature control, especially in commercial settings such as restaurants and in situations in which a high efficiency extracting range hood is not available.
3.2 Volatility characterization of emissions from heated cooking oils
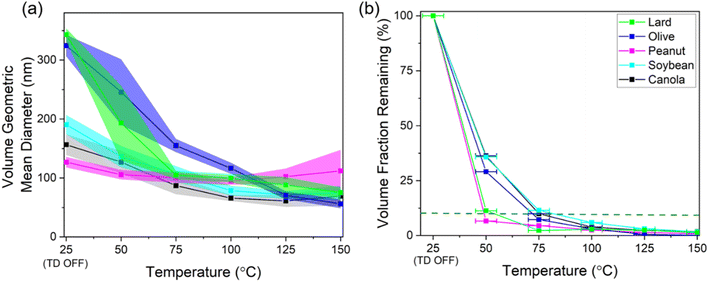
The GMD of the aerosol volume distributions and the resulting VFR after thermal conditioning over a range of temperatures for different cooking oils (heated at 180 °C) are shown in Fig. 5. The GMD profile shows an approximately linear decrease in particle volume followed by a plateauing trend demonstrating that the heated cooking oil aerosols started exhibiting non-volatile distributions at elevated heated section temperatures (except for olive oil, where GMD still shows a linear decrease till 150 °C thermal conditioning temperature).When the heating section of the TD was off (room temperature of ∼25 °C), the GMD for different oils ranged between 130 – 350 nm with the lowest GMD associated with peanut oil and the highest value attributed to lard and olive oil. The bi-modal volume distributions (TD switched off) for most of the oils as shown in Fig. S5† also hints towards presence of a mixed state between the volatile and non-volatile particles. However, as soon as the temperature of heated section was raised, the distributions started exhibiting a single mode towards smaller diameters suggesting removal of volatiles with varying rates depending upon the chemical composition of these aerosols.
The sharpest decrease in the GMD values between the temperatures of 25–75 °C was also observed for the lard and olive oil, where the diameter reduced by more than 200 nm, almost double than the GMD decrease for the remaining oils. For temperatures beyond 75 °C, the GMD trends for all the oil distributions (except olive oil) start to level off in the 60–100 nm range suggesting that the remaining aerosols comprised mostly of non-volatile core as seen in previous studies on volatility characterization of aerosols of outdoor origin at similar conditioning temperatures.44,49 The GMD profile for olive oil on the other hand shows a decreasing trend even at higher TD temperatures which could mean that the volatiles hadn't completely evaporated for this oil.
Next, we compared the T0.1 temperatures (aerosol heating temperature corresponding to a 10% aerosol VFR value) between different oils by linearly interpolating results between the measured heating temperatures. Peanut oil had the lowest T0.1 value of 49 °C, followed by lard at 54 °C, whereas the remaining oils showed higher temperatures in the range of 72–83 °C. In addition, the VFR values started to overlap among the different oils around the heating temperature range of 75–100 °C. Similar VFR values for this temperature range has been reported on similar studies focusing on SOA volatility measurements.50,51 Overall, these results suggest that peanut oil and lard generated higher volatility aerosols compared to the remaining oils, which has potential implications for fate and transport indoors and outdoors.
Using large quantities of these oils in a poorly ventilated indoor space could accelerate various gas-particle phase transformation processes indoors, and these compounds can also act as a precursor to ambient SOA formation. Previous studies on the characterization of VOC emissions from heated cooking oils have reported that these aerosols usually contain aldehydes, alkanes, alkenes, and aromatics including benzenes and furans which could also pose a carcinogenic risk upon human exposure.24,31,32 For further chemical characterization of these aerosols, we will now focus on the high molecular mass compounds that might remain in particle phase via organic films as described in the next section.
3.3 FT-ICR analysis
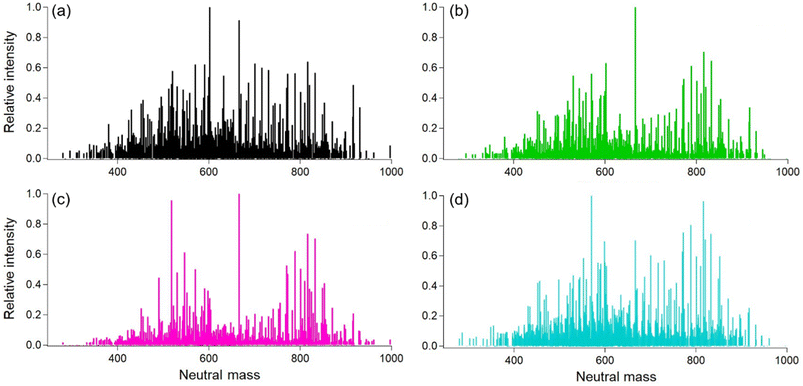
To investigate the chemical characteristics of the lower volatility fraction, we analyzed the soft ionization mass spectra for the smoke samples of different oils. The results show that there is a large amount of chemical similarity in terms of molecular formulas and intensity values for carbon, hydrogen, and oxygen compounds (Fig. 6). The average molecular formula for each sample and the resulting oxygen to carbon (O/C) and hydrogen to carbon (H/C) ratios for each cooking oil sample is also given in Table S2.†Overall, there were 1484 total identified ions and, of these, 751 were common for the four tested oil types. The O/C ratios for different oils ranged between 0.15–0.17 consistent with values obtained for cooking organic aerosol in both indoor and ambient environments.39,52 The canola oil sample was uniform in terms of intensity with two groups centered around 560 and 800 amu (atomic mass units). These values are slightly lower than the expected averages for di- (∼600 amu) and triglycerides (∼900 amu), consistent with thermal degradation of those precursors. Lard was similar to peanut oil, with a little more intensity in a third group at ∼700 amu. Soybean oil exhibited three main groups with a larger signal in the 700 amu range.
A summary about the number of similar compounds in the smoke sample extracts from different oils is also presented in Table 2. All the plant-based oils (Peanut. Soybean, and Canola) exhibited greater similarity among them in term of chemical compounds containing C, H, and O ions when compared to Lard possibly due to similar saturated fat content and smoke point temperatures.
| Frying Oil | Lard | Peanut | Soybean | Canola |
|---|---|---|---|---|
| Lard | x | |||
| Peanut | 862 | x | ||
| Soybean | 802 | 908 | x | |
| Canola | 841 | 961 | 884 | x |
Another interesting point to mention here is that we did find CHON signals in the soft ionization spectra for all four tested oils (Fig. S6†). The source for these is unknown, as there were no proteins or other food items in the heated oils. Possible sources include additives in the raw oil or reactions with gas-phase ammonia or amines. No gas-phase concentrations are available, but William & Mary is located very close to Colonial Williamsburg with commercial sheep farms, and ammonia from ambient air might have ended up in the smoke samples. While future work will investigate possible reaction pathways for the formation of CHON compounds, here we focus on the CHO compounds measured in the oil samples. Next, if we compare the DBE values and the resulting Van Krevelen diagram, then the results also show similar trends as shown in Fig. 7.
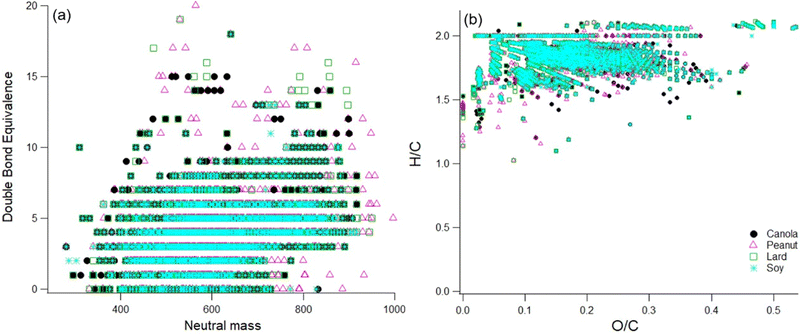 | ||
| Fig. 7 Panel a and Panel b represent the DBE and the resulting H/C and O/C ratios for the sample extract of different cooking oils. | ||
The DBE values for all the oil samples show a great degree of overlap mainly due to the chemical similarity in the smoke samples due to the breakdown of diglycerides and triglycerides at smoke points. The higher DBE values does however suggest the presence of aromatics, esters, and aldehyde precursors such as oleic acid and linoleic acid.24,39 For peanut oil, there appears to be some proportion of compounds in the higher mass (800–1000 amu range) containing double bond equivalents suggesting a higher degree of unsaturation as compared to the rest of the oils. Therefore, these compounds may participate in further chemical breakdown reactions affecting indoor chemistry processes on an even longer time scale.
Overall, this analysis provides insights into the chemical properties of the lower volatility chemicals that are collected in aerosol particles formed from oils at or just above their smoke point. These results also provide a good qualitative comparative analysis into the lower volatility portion of the mixture which is the fraction that would be expected to remain in the particles during dilution, or remain on surfaces after particles deposit. However, we also acknowledge that cooking emissions usually contain low molecular mass decomposition compounds. Some of these will be lost due to volatilization during collection, some to volatilization during the sample preparation (concentrating). Others may have lower intensity due to lower ionization efficiencies and the tuning in the FT-ICR.30,53 These mass spectra show one perspective on the composition. In the future, a wider range of solvents, ionization methods, and chromatography can be used to expand our understanding of the full range of chemicals found in these types of samples.
3.4 Respiratory deposition analysis
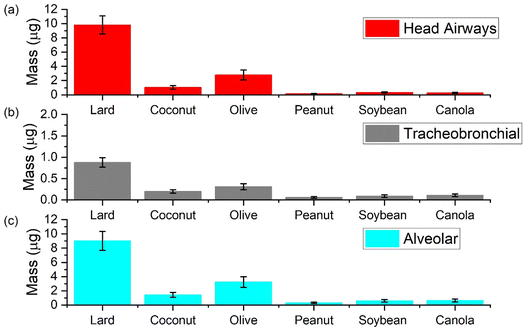
In this section we present results from the ICRP model to compare aerosol mass deposited in different regions of the respiratory system upon exposure to different cooking oils heated at 180 °C for a total duration of 30 minutes (Fig. 8). In general, exposure to aerosol emissions from heating lard was associated with the largest PM mass deposited in the respiratory system while those from peanut oil led to the lowest PM mass deposited.At the 180 °C cooking temperature, the deposition results emphasize the importance of heating cooking oils below their smoke points. The smoke point for lard being closest to the cooking temperature resulted in deposition values up to one order of magnitude higher than the other oils. The corresponding average values of mass deposited in the head airways (HA), tracheobronchial (TB), and alveolar (AL) region were calculated to be 9.8, 0.9 and 9.0 μg, respectively for lard. For canola, soybean, and peanut oil, the three most commonly used oils other than lard for deep frying, total average mass deposited in these three regions was less than 1 μg respectively. Coconut and olive oil both reported higher values for mass deposited when compared to other plant-based oils; with average values corresponding to HA, TB, and AL regions for olive oil (2.8, 0.3 and 3.2 μg) being almost double than that of coconut oil.
It is also important to mention here that between the deposition values corresponding to AL and TB regions in all the oils, the values for AL were an order of magnitude higher. In a real life setting, the dilution in the room could reduce the actual deposition values associated with cooking oil exposure but one has to understand that emissions from these oils at 180 °C still have the potential to reach the deepest parts of the respiratory system. Moreover, the chemical composition of these aerosols may also influence a biological effect due to the volatile content getting dissolved in the lung fluid which reiterates the need for effective control measures, especially when using large quantities of such oils.54
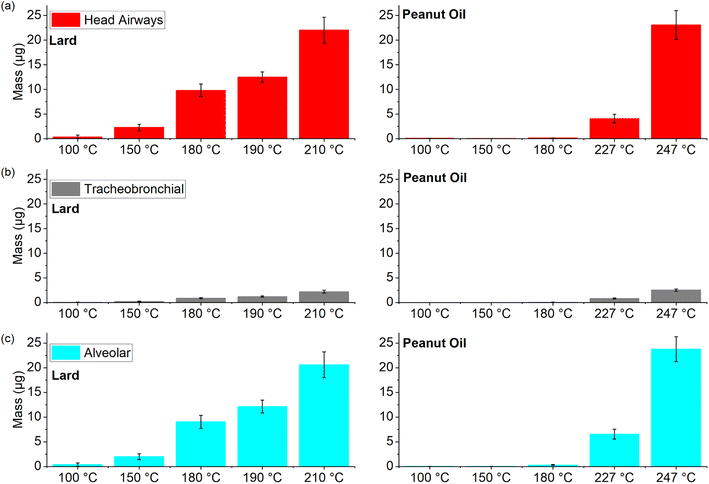
Next, we compared the deposition values for two different source-based oils (lard and Peanut oil) over a wide range of cooking temperatures to observe the overall trends in these values with increasing cooking temperatures (Fig. 9).
Peanut oil (smoke point of 227 °C) was associated with very low deposition values in the three regions (average < 1 μg) until the smoke point was surpassed. On the other hand, the deposition values for lard even in the 150–180 °C temperature range were comparable to the corresponding peanut oil values at smoke point. However, for cooking temperatures at or above smoke points, the average deposition values in all the three regions were in the range of 0.8–23 μg for both the oils despite a 30 °C difference in their respective smoke points. As mentioned in the previous section, the soft mass spectra from smoking different cooking oils were found to be quite similar and the deposition values also suggest that once the cooking temperature approaches the smoke point for a given oil, the physical and chemical characteristics of these emissions start to exhibit a degree of similarity to a certain extent. Therefore, future research efforts should focus on isolating chemical compounds on a molecular scale to help understand the indoor chemistry related process that may transform these organic compounds into pollutants of both outdoor and indoor concern.
4 Conclusions
In this study, we characterized aerosols emissions from the use of different cooking oils with distinct smoke points over a range of cooking temperatures. First, we observed the differences in the aerosol size distributions for different cooking oils when heated at the usual frying temperature of 180 °C. The mode of the number distributions for lard and olive oil (lower smoke points) was observed to be in the 100–300 nm range, whereas for the rest of the oils the mode was in the ultrafine range. Similarly, the total mass concentrations associated with these two oils were much higher (>100 μg m−3) than the other oils. We also compared the size distributions for two different source-based oils (lard and peanut oil) and found that in both the cases, the total number concentrations increased by more than threefold between the cooking temperature of 180 °C and SP+20 °C, thereby suggesting the need for temperature control while using such oils in larger quantities for reducing the associated exposure with their use.The geometric mean diameter of the volume distributions associated with heating cooking oils at 180 °C ranged between 130–350 nm when the heating section was switched off and these values dropped down by ∼30% as the temperature of the heated section was ramped up to 100 °C (indicative of removal of volatiles from non-volatile cores). In terms of VFR, lard and peanut oil had the lowest T0.1 temperature around 50 °C whereas the rest of the oils had T0.1 values in the 75–80 °C range suggesting increased number of volatiles in the aerosols generated from using these two oils as compared to the rest. The soft ionization spectra from smoke samples of different cooking oils showed a high degree of chemical similarity between the samples due to similar breakdown products from the diglycerides and triglycerides. The smoke samples also showed an abundance of carbon double-bond equivalents and low O/C ratios for lower volatile carbon, hydrogen, and oxygen containing compounds further implying the potential of these compounds to form organic pollutants of outdoor concern through oxidation of the carbon–carbon double bonds.
The deposition values calculated using the ICRP model for different parts of the respiratory system when a given cooking oil was used for 30 minutes and showed that heating an oil close to its smoke point (lard) led to much higher PM deposition than other oils. Similar comparison between peanut oil and lard over different cooking temperatures showed that the latter with lower smoke points had higher total deposition values for cooking temperatures in the range of 100–180 °C but as soon as the cooking temperature exceeds the smoke point, the total deposition values were calculated to be in the same range. Therefore, care should be taken in controlling cooking temperatures and avoiding using cooking oils at or above their smoke points to reduce the associated exposure and related health risks.
Conflicts of interest
There are no conflicts of interest to declare.Acknowledgements
We acknowledge the contributions of Cole Nielsen, Kwasi Kyeremeh-Dapaah, and Paul Yanowich for building the thermodenuder system and providing all schematics of the working model. This work was supported in part by the Alfred P. Sloan Foundation (G-2017-9944, G-2020-13953) and a CU Boulder Dean's Innovation Research Assistantship.References
- K.-H. Kim, S. K. Pandey, E. Kabir, J. Susaya and R. J. C. Brown, The modern paradox of unregulated cooking activities and indoor air quality, J. Hazard. Mater., 2011, 195, 1–10 CrossRef CAS PubMed.
- C. Chen, Y. Zhao and B. Zhao, Emission Rates of Multiple Air Pollutants Generated from Chinese Residential Cooking, Environ. Sci. Technol., 2018, 52, 1081–1087 CrossRef CAS PubMed.
- Q. Zhang, R. H. Gangupomu, D. Ramirez and Y. Zhu, Measurement of Ultrafine Particles and Other Air Pollutants Emitted by Cooking Activities, Int. J. Environ. Res. Public Health, 2010, 7, 1744–1759 CrossRef CAS.
- D. K. Farmer, M. E. Vance, J. P. D. Abbatt, A. Abeleira, M. R. Alves, C. Arata, E. Boedicker, S. Bourne, F. Cardoso-Saldaña, R. Corsi, P. F. DeCarlo, A. H. Goldstein, V. H. Grassian, L. H. Ruiz, J. L. Jimenez, T. F. Kahan, E. F. Katz, J. M. Mattila, W. W. Nazaroff, A. Novoselac, R. E. O'Brien, V. W. Or, S. Patel, S. Sankhyan, P. S. Stevens, Y. Tian, M. Wade, C. Wang, S. Zhou and Y. Zhou, Overview of HOMEChem: House Observations of Microbial and Environmental Chemistry, Environ. Sci.: Processes Impacts, 2019, 21, 1280–1300 RSC.
- J. A. Hoskins, Health Effects due to Indoor Air Pollution, Indoor Built Environ., 2003, 12, 427–433 CrossRef CAS.
- Y.-T. Gao, W. J. Blot, W. Zheng, A. G. Ersnow, C. W. Hsu, L. I. Levin, R. Zhang and J. F. Fraumeni Jr, Lung cancer among Chinese women, Int. J. Cancer, 1987, 40, 604–609 CrossRef CAS PubMed.
- K. L. Abdullahi, J. M. Delgado-Saborit and R. M. Harrison, Emissions and indoor concentrations of particulate matter and its specific chemical components from cooking: A review, Atmos. Environ., 2013, 71, 260–294 CrossRef CAS.
- L. Lv, L. Zeng, Y. Wu, J. Gao, W. Xie, C. Cao and J. Zhang, The application of an air curtain range hood in reducing human exposure to cooking pollutants, Build. Sci., 2021, 205, 108204 Search PubMed.
- S. Patel, S. Sankhyan, E. K. Boedicker, P. F. DeCarlo, D. K. Farmer, A. H. Goldstein, E. F. Katz, W. W. Nazaroff, Y. Tian, J. Vanhanen and M. E. Vance, Indoor Particulate Matter during HOMEChem: Concentrations, Size Distributions, and Exposures, Environ. Sci. Technol., 2020, 54, 7107–7116 CrossRef CAS PubMed.
- S. Sankhyan, S. Patel, E. F. Katz, P. F. DeCarlo, D. K. Farmer, W. W. Nazaroff and M. E. Vance, Indoor black carbon and brown carbon concentrations from cooking and outdoor penetration: insights from the HOMEChem study, Environ. Sci.: Processes Impacts, 2021, 23, 1476–1487 RSC.
- M. L. Clark, J. L. Peel, J. B. Burch, T. L. Nelson, M. M. Robinson, S. Conway, A. M. Bachand and S. J. Reynolds, Impact of improved cookstoves on indoor air pollution and adverse health effects among Honduran women, Int. J. Environ. Health Res., 2009, 19, 357–368 CrossRef CAS PubMed.
- R. U. Shah, E. S. Robinson, P. Gu, J. S. Apte, J. D. Marshall, A. L. Robinson and A. A. Presto, Socio-economic disparities in exposure to urban restaurant emissions are larger than for traffic, Environ. Res. Lett., 2020, 15, 114039 CrossRef.
- E. S. Robinson, P. Gu, Q. Ye, H. Z. Li, R. U. Shah, J. S. Apte, A. L. Robinson and A. A. Presto, Restaurant Impacts on Outdoor Air Quality: Elevated Organic Aerosol Mass from Restaurant Cooking with Neighborhood-Scale Plume Extents, Environ. Sci. Technol., 2018, 52, 9285–9294 CrossRef CAS PubMed.
- R. Song, A. A. Presto, P. Saha, N. Zimmerman, A. Ellis and R. Subramanian, Spatial variations in urban air pollution: impacts of diesel bus traffic and restaurant cooking at small scales, Air Qual., Atmos. Health, 2021, 14, 2059–2072 CrossRef CAS.
- T. Bergman, T. Mielonen, A. Arola and H. Kokkola, Climate and mortality changes due to reductions in household cooking emissions, 2016, EPSC2016, 12541 Search PubMed.
- C. Mohr, J. A. Huffman, M. J. Cubison, A. C. Aiken, K. S. Docherty, J. R. Kimmel, I. M. Ulbrich, M. Hannigan and J. L. Jimenez, Characterization of Primary Organic Aerosol Emissions from Meat Cooking, Trash Burning, and Motor Vehicles with High-Resolution Aerosol Mass Spectrometry and Comparison with Ambient and Chamber Observations, Environ. Sci. Technol., 2009, 43, 2443–2449 CrossRef CAS.
- L. L. Yeung and W. M. To, Size Distributions of the Aerosols Emitted from Commercial Cooking Processes, Indoor Built Environ., 2008, 17, 220–229 CrossRef.
- P. L. Hayes, A. G. Carlton, K. R. Baker, R. Ahmadov, R. A. Washenfelder, S. Alvarez, B. Rappenglück, J. B. Gilman, W. C. Kuster, J. A. de Gouw, P. Zotter, A. S. H. Prévôt, S. Szidat, T. E. Kleindienst, J. H. Offenberg, P. K. Ma and J. L. Jimenez, Modeling the formation and aging of secondary organic aerosols in Los Angeles during CalNex 2010, Atmos. Chem. Phys., 2015, 15, 5773–5801 CrossRef CAS.
- S. Patel, D. Rim, S. Sankhyan, A. Novoselac and M. E. Vance, Aerosol dynamics modeling of sub-500 nm particles during the HOMEChem study, Environ. Sci.: Processes Impacts, 2021, 23, 1706–1717 RSC.
- S. Patel, A. Leavey, S. He, J. Fang, K. O'Malley and P. Biswas, Characterization of gaseous and particulate pollutants from gasification-based improved cookstoves, Energy Sustainable Dev., 2016, 32, 130–139 CrossRef CAS.
- K. Kang, H. Kim, D. D. Kim, Y. G. Lee and T. Kim, Characteristics of cooking-generated PM10 and PM2.5 in residential buildings with different cooking and ventilation types, Sci. Total Environ., 2019, 668, 56–66 CrossRef CAS PubMed.
- B. C. Singer, R. Z. Pass, W. W. Delp, D. M. Lorenzetti and R. L. Maddalena, Pollutant concentrations and emission rates from natural gas cooking burners without and with range hood exhaust in nine California homes, Build. Sci., 2017, 122, 215–229 Search PubMed.
- S. Sankhyan, J. K. Witteman, S. Coyan, S. Patel and M. E. Vance, Assessment of PM2.5 concentrations, transport, and mitigation in indoor environments using low-cost air quality monitors and a portable air cleaner, Environ. Sci.: Atmos., 2022, 2, 647–658 CAS.
- D.-C. Zhang, J.-J. Liu, L.-Z. Jia, P. Wang and X. Han, Speciation of VOCs in the cooking fumes from five edible oils and their corresponding health risk assessments, Atmos. Environ., 2019, 211, 6–17 CrossRef CAS.
- G. Buonanno, L. Morawska and L. Stabile, Particle emission factors during cooking activities, Atmos. Environ., 2009, 43, 3235–3242 CrossRef CAS.
- M. A. Torkmahalleh, S. Gorjinezhad, H. S. Unluevcek and P. K. Hopke, Review of factors impacting emission/concentration of cooking generated particulate matter, Sci. Total Environ., 2017, 586, 1046–1056 CrossRef.
- W. M. To, L. L. Yeung and C. Y. H. Chao, Characterisation of Gas Phase Organic Emissions from Hot Cooking Oil in Commercial Kitchens, Indoor Built Environ., 2000, 9, 228–232 CrossRef CAS.
- C.-Y. Peng, C.-H. Lan, P.-C. Lin and Y.-C. Kuo, Effects of cooking method, cooking oil, and food type on aldehyde emissions in cooking oil fumes, J. Hazard. Mater., 2017, 324, 160–167 CrossRef CAS PubMed.
- L. A. Wallace, S. J. Emmerich and C. Howard-Reed, Source Strengths of Ultrafine and Fine Particles Due to Cooking with a Gas Stove, Environ. Sci. Technol., 2004, 38, 2304–2311 CrossRef CAS PubMed.
- A. Fullana, Á. A. Carbonell-Barrachina and S. Sidhu, Volatile aldehyde emissions from heated cooking oils, J. Sci. Food Agric., 2004, 84, 2015–2021 CrossRef CAS.
- H. R. Katragadda, A. Fullana, S. Sidhu and Á. A. Carbonell-Barrachina, Emissions of volatile aldehydes from heated cooking oils, Food Chem., 2010, 120, 59–65 CrossRef CAS.
- Z. Zhang, W. Zhu, M. Hu, H. Wang, Z. Chen, R. Shen, Y. Yu, R. Tan and S. Guo, Secondary Organic Aerosol from Typical Chinese Domestic Cooking Emissions, Environ. Sci. Technol. Lett., 2021, 8, 24–31 CrossRef CAS.
- M. A. Torkmahalleh, I. Goldasteh, Y. Zhao, N. M. Udochu, A. Rossner, P. K. Hopke and A. R. Ferro, PM2.5 and ultrafine particles emitted during heating of commercial cooking oils, Indoor Air, 2012, 22, 483–491 CrossRef CAS PubMed.
- F. Lu, B. Shen, S. Li, L. Liu, P. Zhao and M. Si, Exposure characteristics and risk assessment of VOCs from Chinese residential cooking, J. Environ. Manage., 2021, 289, 112535 CrossRef CAS PubMed.
- T.-A. Chiang, P.-F. Wu and Y.-C. Ko, Prevention of exposure to mutagenic fumes produced by hot cooking oil in Taiwanese kitchens, Environ. Mol. Mutagen., 1998, 31, 92–96 CrossRef CAS PubMed.
- T. Liu, Z. Li, M. Chan and C. K. Chan, Formation of secondary organic aerosols from gas-phase emissions of heated cooking oils, Atmos. Chem. Phys., 2017, 17, 7333–7344 CrossRef CAS.
- M. Takhar, Y. Li and A. W. H. Chan, Characterization of secondary organic aerosol from heated-cooking-oil emissions: evolution in composition and volatility, Atmos. Chem. Phys., 2021, 21, 5137–5149 CrossRef CAS.
- T. Liu, Z. Wang, D. D. Huang, X. Wang and C. K. Chan, Significant Production of Secondary Organic Aerosol from Emissions of Heated Cooking Oils, Environ. Sci. Technol. Lett., 2018, 5, 32–37 CrossRef CAS.
- R. E. O'Brien, Y. Li, K. J. Kiland, E. F. Katz, V. W. Or, E. Legaard, E. Q. Walhout, C. Thrasher, V. H. Grassian, P. F. DeCarlo, A. K. Bertram and M. Shiraiwa, Emerging investigator series: chemical and physical properties of organic mixtures on indoor surfaces during HOMEChem, Environ. Sci.: Processes Impacts, 2021, 23, 559–568 RSC.
- A. P. Ault, V. H. Grassian, N. Carslaw, D. B. Collins, H. Destaillats, D. J. Donaldson, D. K. Farmer, J. L. Jimenez, V. F. McNeill, G. C. Morrison, R. E. O'Brien, M. Shiraiwa, M. E. Vance, J. R. Wells and W. Xiong, Indoor Surface Chemistry: Developing a Molecular Picture of Reactions on Indoor Interfaces, Chem, 2020, 6, 3203–3218 CAS.
- V. W. Or, M. Wade, S. Patel, M. R. Alves, D. Kim, S. Schwab, H. Przelomski, R. O'Brien, D. Rim, R. L. Corsi, M. E. Vance, D. K. Farmer and V. H. Grassian, Glass surface evolution following gas adsorption and particle deposition from indoor cooking events as probed by microspectroscopic analysis, Environ. Sci.: Processes Impacts, 2020, 22, 1698–1709 RSC.
- W. Chen, P. Wang, D. Zhang, J. Liu and X. Dai, The Impact of Water on Particle Emissions from Heated Cooking Oil, Aerosol Air Qual. Res., 2020, 20, 533–543 CAS.
- S. W. See and R. Balasubramanian, Physical Characteristics of Ultrafine Particles Emitted from Different Gas Cooking Methods, Aerosol Air Qual. Res., 2006, 6, 82–92 CrossRef CAS.
- T. Kuhn, M. Krudysz, Y. Zhu, P. M. Fine, W. C. Hinds, J. Froines and C. Sioutas, Volatility of indoor and outdoor ultrafine particulate matter near a freeway, J. Aerosol Sci., 2005, 36, 291–302 CrossRef CAS.
- J. A. Huffman, P. J. Ziemann, J. T. Jayne, D. R. Worsnop and J. L. Jimenez, Development and Characterization of a Fast-Stepping/Scanning Thermodenuder for Chemically-Resolved Aerosol Volatility Measurements, Aerosol Sci. Technol., 2008, 42, 395–407 CrossRef CAS.
- M. R. Bailey (invited), The New ICRP Model for the Respiratory Tract, Radiat. Prot. Dosim., 1994, 53, 107–114 CrossRef.
- W. C. Hinds, Aerosol technology: properties, behavior, and Measurement of airborne particles, Wiley, 1999 Search PubMed.
- L. A. Wallace, S. J. Emmerich and C. Howard-Reed, Source Strengths of Ultrafine and Fine Particles Due to Cooking with a Gas Stove, Environ. Sci. Technol., 2004, 38, 2304–2311 CrossRef CAS PubMed.
- H. Sakurai, H. J. Tobias, K. Park, D. Zarling, K. S. Docherty, D. B. Kittelson, P. H. McMurry and P. J. Ziemann, On-line measurements of diesel nanoparticle composition and volatility, Atmos. Environ., 2003, 37, 1199–1210 CrossRef CAS.
- W. J. An, R. K. Pathak, B.-H. Lee and S. N. Pandis, Aerosol volatility measurement using an improved thermodenuder: Application to secondary organic aerosol, J. Aerosol Sci., 2007, 38, 305–314 CrossRef CAS.
- P. K. Saha, A. Khlystov and A. P. Grieshop, Determining Aerosol Volatility Parameters Using a “Dual Thermodenuder” System: Application to Laboratory-Generated Organic Aerosols, Aerosol Sci. Technol., 2015, 49, 620–632 CrossRef CAS.
- C. Kaltsonoudis, E. Kostenidou, E. Louvaris, M. Psichoudaki, E. Tsiligiannis, K. Florou, A. Liangou and S. N. Pandis, Characterization of fresh and aged organic aerosol emissions from meat charbroiling, Atmos. Chem. Phys., 2017, 17, 7143–7155 CrossRef CAS.
- E. F. Katz, H. Guo, P. Campuzano-Jost, D. A. Day, W. L. Brown, E. Boedicker, M. Pothier, D. M. Lunderberg, S. Patel, K. Patel, P. L. Hayes, A. Avery, L. Hildebrandt Ruiz, A. H. Goldstein, M. E. Vance, D. K. Farmer, J. L. Jimenez and P. F. DeCarlo, Quantification of cooking organic aerosol in the indoor environment using aerodyne aerosol mass spectrometers, Aerosol Sci. Technol., 2021, 55, 1099–1114 CrossRef CAS.
- G. Buonanno, G. Johnson, L. Morawska and L. Stabile, Volatility Characterization of Cooking-Generated Aerosol Particles, Aerosol Sci. Technol., 2011, 45, 1069–1077 CrossRef CAS.
Footnotes |
| † Electronic supplementary information (ESI) available. See https://doi.org/10.1039/d2ea00099g |
| ‡ Now at Lyles School of Civil Engineering, Purdue University, West Lafayette, IN 47907, USA. |
| § Now at Department of Civil and Environmental Engineering, University of Michigan, Ann Arbor, MI, USA. |
| ¶ Now at Discipline of Civil Engineering and Discipline of Chemical Engineering, IIT Gandhinagar, Gandhinagar, Gujarat 382355, India. |
| This journal is © The Royal Society of Chemistry 2022 |

