A laboratory study on the uptake of gaseous molecular iodine by clay minerals at different relative humidities†
Received
4th April 2022
, Accepted 13th June 2022
First published on 15th June 2022
Abstract
Dry deposition of iodine is a crucial parameter for estimating the public health risk of radioiodine released in the Fukushima Dai-ichi nuclear power plant accident. We measured the uptake of molecular iodine (I2) by aqueous solutions and clay minerals in the laboratory to inform estimates of the ground surface resistance for I2 in dry deposition which photolysis limited to nighttime. We injected rectangular pulses of humidified air including I2 into a contactor holding samples of aqueous solutions and clay minerals and monitored I2 concentrations in air leaving the contactor to distinguish I2 loss from I2 adsorption. Uptake of I2 proceeded much more rapidly by aqueous ascorbic acid than by water; the former was limited by mass transfer in the gas-film layer. Uptake of I2 by clay samples was confirmed under dry conditions (20–80% relative humidity), which suggested that it contributed to the dry deposition of I2 onto soils as much as other processes such as reactions with organic matter. The surface resistance for I2 increased with repeated experiments on the same clay samples, reaching 240–670 s m−1, and its dependence on relative humidity differed from that for sulfur dioxide (SO2), a commonly used proxy for I2 in scaling methods. Reference values of surface resistance for SO2 above soils remain useful for estimating the resistance for I2 above vegetate surfaces at 80% RH in atmospheric transport and dispersion model calculations but may result in substantial errors at 20% RH unless organic matter in soils contributes to ground surface resistance for I2.
Environmental significance
Ground surface resistance for iodine is a crucial parameter in dry deposition for estimating the public health risk associated with accidental release of radioiodine from nuclear power plants. We conducted rectangular pulse experiments on the uptake of I2 by clay samples and confirmed I2 deposition on the clay samples. The deposition rates decreased with successive runs and remained finite through each set of experimental runs. The resultant ground surface resistances for I2 were greater than the resistances adopted in atmospheric model calculations which considered no difference between I2 and its photodegradation products. The relative-humidity dependence was different between these resistances. Radioiodine dry deposition processes therefore need to be estimated separately before and after sunrise when I2 is released at night.
|
1. Introduction
Radioiodine-131 (131I), with a half-life of 8 days, is a major contributor to the public health risk associated with accidental release of radionuclides, because of its high short-term radiation levels and the tendency of iodine to concentrate in the thyroid gland.1 The accident at the Fukushima Dai-ichi nuclear power plant following the 11 March 2011 Tohoku earthquake and tsunami released 131I into the atmosphere in several different forms, including molecular iodine (I2), methyl iodine (CH3I), and aerosol-form iodine such as cesium iodide (CsI),2 which behave differently in the atmosphere. The atmospheric reaction and deposition processes of these species, in particular the deposition velocity, need to be known so that the emission source terms of radioiodine released in the accident and the inhaled internal dose of radioiodine in affected populations can be properly estimated by atmospheric transport and dispersion models2,3 from limited field observations.4–6
Dry deposition of 131I has been studied in both field releases7–10 and wind tunnel experiments11,12 to investigate the transfer from the atmosphere to grass and other surrogate surfaces. Deposition velocities of radioiodine have also been calculated from field observations after the Windscale nuclear accident in 195713 and nuclear tests in the atmosphere.9 Reported deposition velocities of elemental iodine or I2 onto various surfaces, however, vary from 0.02 to 26 cm s−1.14 When dealing with atmospheric transport of radioiodine, the chemical form of iodine has to be considered explicitly. Because photolysis limits the lifetime of I2 to about 10 seconds,15,16 most field studies on the release of I2 in daytime have reported the behavior of not I2 itself, but a mixture of iodine species produced through atmospheric reactions initiated by photolysis of I2.16 Similarly, in almost all models of the release of radioiodine from nuclear power plants, the species reported as I2 include not only molecular iodine but also other potential iodine species, such as HOI, produced by atmospheric reactions; we refer to this mixture as Imodel2. In the models applied to the Fukushima accident, deposition velocities of Imodel2 over short vegetation are assumed to have constant values, such as 0.3 cm s−1,17 or values similar to that of sulfur dioxide (SO2).3 If dry deposition velocities of I2 differ greatly from these values, the dry deposition process of Imodel2 needs to be estimated separately before and after sunrise when I2 is released at night.
In numerical models, the dry deposition process is commonly treated as a resistance model, which consists of a series of resistances.18 The bulk surface resistance, which represents the transfer of substances at the level nearest to Earth's surface, is typically the most uncertain because it involves the atmospheric chemistry of each species over various surfaces, such as leaf cuticles and soils. The bulk surface resistance consists of stomatal resistance and non-stomatal resistance. For I2, stomatal resistance is ignored because photolysis limits dry deposition of I2 to nighttime, when most plants close their stomata.19 Non-stomatal resistance, Rns, above vegetate surfaces is decomposed as
| |  | (1) |
where
Rac is the in-canopy aerodynamic resistance,
Rg is the subsequent ground resistance, and
Rcut is the resistance to cuticle uptake.
20 For surfaces without canopies, such as bare soil and open water,
Rac and
Rcut are not applicable. When information on
Rg and
Rcut is limited, models commonly estimate these resistances by a scaling method, relying on an effective Henry's law coefficient or a half-redox potential as an index.
20,21 For I
2, however, effective Henry's law coefficients cannot be defined unless the aqueous concentration of I
− in the following reaction is assumed to be constant.
| | | I2 + H2O ⇄ I− + HOI + H+ | (R1) |
Given these considerations, we conducted a laboratory study of I2 uptake by various reactors, consisting of six different types of clay mineral particles and three different aqueous surfaces, to provide data for estimating Rg for I2 above soils. We used a rectangular pulse method22 to distinguish loss of I2 from adsorption onto the reactor. This method can be conducted under lower-atmospheric conditions such as humidified air at 1 atm. The pulse method is useful for determining the loss rates for the reactors which tend to deactivate with exposure to I2 because it can control the exposure to I2 precisely at low concentration levels of I2. As a disadvantage, it needs an estimate of mass-transfer resistances in gas-film layers above the solid or the liquid reactors for determination of the surface resistance above the reactors. The clay samples consisted of five pure clay minerals and standard clay soil, and the aqueous surfaces were water, aqueous sulfuric acid, and aqueous ascorbic acid. In this paper we present surface resistances estimated from the experiment and resultant non-stomatal resistances and discuss their implications for calculations in atmospheric transport and dispersion models.
2. Methods
2.1 Materials
Molecular iodine (anhydrous, beads, 10 mesh, 99.999%) was purchased from Sigma-Aldrich. Sodium iodide (99.5%), 1/240 M standard aqueous potassium iodate (NaIO3) solution, 0.5 M standard aqueous sulfuric acid (H2SO4) solution, L(+)-ascorbic acid (99.6%), and 1 M standard aqueous sodium hydroxide (NaOH) solution were purchased from FUJIFILM Wako Chemicals. These reagents were used without further purification. Water was purified with an EMD Millipore Milli-Q Gradient A10 system (>18 MΩ cm). Synthetic air (an O2–N2 mixture, 1![[thin space (1/6-em)]](https://www.rsc.org/images/entities/char_2009.gif) :
:![[thin space (1/6-em)]](https://www.rsc.org/images/entities/char_2009.gif) 4 volume ratio) and carbon dioxide gas (CO2, 1.02% in synthetic air) were purchased from Takachiho Chemical Industrial Co., Ltd.
4 volume ratio) and carbon dioxide gas (CO2, 1.02% in synthetic air) were purchased from Takachiho Chemical Industrial Co., Ltd.
Pure clay minerals of kaolinite, halloysite, montmorillonite, allophane, and illite were purchased from Iwamoto Mineral. These were the same materials used in previous studies at our laboratory.23–25 Clay powder of AgroMAT Clay Soil AG-1 (Lot No. S131024028, SCP Science) was purchased from GL Science Inc. The allophane and the illite samples were ground to reduce the particle size with a mortar machine. The other clay samples were used as purchased. The grain size of the samples ranged from several millimeters down to submillimeter sizes. Table 1 lists the Brunauer–Emmett–Teller (BET) surface areas of these samples. AgroMAT AG-1 contained organic matter by 3.7% in weight, based on the loss-on-ignition method.
Table 1 Properties of clay samples
|
|
Kaolinite |
Halloysite |
Montmorillonite |
Allophane |
Illite |
AgroMAT AG-1 |
|
Standard clay samples from the American Petroleum Institute, no. 35 (Fithian, Ill).
|
| Morphology |
Thin sheets |
Tubes |
Thin sheets |
Hollow spherules |
|
|
| Structure |
Crystalline (1![[thin space (1/6-em)]](https://www.rsc.org/images/entities/char_2009.gif) : :![[thin space (1/6-em)]](https://www.rsc.org/images/entities/char_2009.gif) 1) 1) |
Crystalline (1![[thin space (1/6-em)]](https://www.rsc.org/images/entities/char_2009.gif) : :![[thin space (1/6-em)]](https://www.rsc.org/images/entities/char_2009.gif) 1) 1) |
Crystalline (2![[thin space (1/6-em)]](https://www.rsc.org/images/entities/char_2009.gif) : :![[thin space (1/6-em)]](https://www.rsc.org/images/entities/char_2009.gif) 1) 1) |
Amorphous |
Crystalline (2![[thin space (1/6-em)]](https://www.rsc.org/images/entities/char_2009.gif) : :![[thin space (1/6-em)]](https://www.rsc.org/images/entities/char_2009.gif) 1) 1) |
|
| Origin |
Kawachi, Tochigi, Japan |
New Zealand |
Aterazawa, Yamagata, Japan |
Kanuma, Tochigi, Japan |
Fithian, Ill, USA |
|
| BET area (m2 g−1) |
16 |
29 |
18 |
235 |
70 |
12 |
| Others |
Kanpaku kaolin |
Metahalloysite |
KUNIPIA-F, Na-type |
|
API no. 35a |
200 mesh size |
2.2 Experimental setup
The experimental setup is shown schematically in Fig. 1. Each experimental run comprised preparation and injection of an I2–air mixture of specified relative humidity (RH), passage of the mixture through a two-phase contact chamber (contactor), and analysis of the mixture leaving the contactor in an incoherent broad-band cavity-enhanced absorption spectroscopy (IBBCEAS) instrument.26–28 The method for injecting and flowing the gas mixture through the contactor was essentially the same as that reported for volatile organic compounds by the authors.22 The gas flow was controlled with eight mass-flow controllers (d in Fig. 1) at rates listed in Table S1 in the ESI.† The gas mixtures flowed through perfluoroalkoxy alkane (PFA) tubes covered in black.
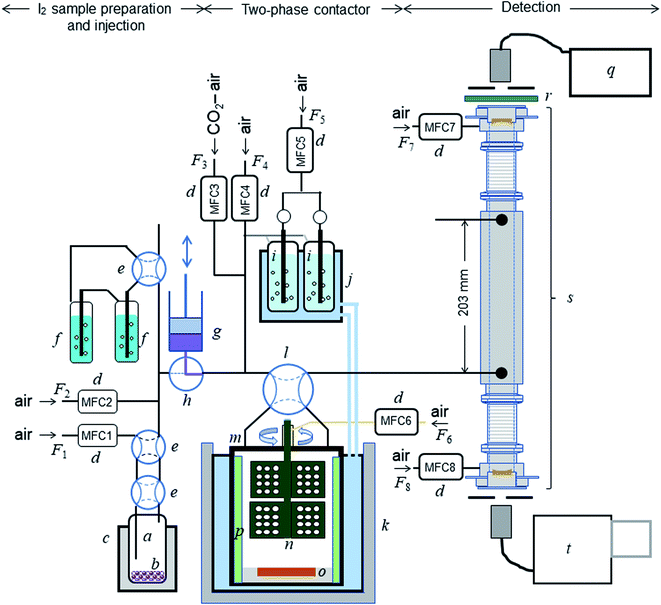 |
| | Fig. 1 Schematic diagram of the experimental setup: (a) bottle containing I2 beads (b); (c) electronic dry bath; (d) mass-flow controllers; (e) four-port valve; (f) impinger with 20 mM NaOH; (g) syringe pump; (h) three-port ceramic valve; (i) humidifier; (j) temperature-controlled water circulator; (k) stainless-steal water bath; (l) four-port valve; (m) contactor; (n) turbine for stirring the gas phase; (o) dish to hold samples; (p) baffles; (q) light source; (r) optical bandpass filter; (s) IBBCEAS measurement cavity; (t) spectrometer. | |
2.2.1 Gas mixture preparation and injection.
About 5 g of I2 beads was placed in a PFA bottle (inner diameter, 25.4 mm) in the cavity of the aluminum block of an electronic dry bath (CTU-Mini, Taitec) set at 288.2 K (Fig. 1(a)–(c)). Synthetic air was introduced into the bottle to produce an I2–air mixture that was further diluted with synthetic air to produce a mixture referred to hereafter as I2–air(o). As shown in the ESI,† the partial pressure of I2 in I2–air(o), Pin-o, was determined by bubbling I2–air(o) into 20 mL of 20 mM NaOH solution in an impinger (f) for a certain time period, followed by analysis of the solution with an ion chromatograph (Dionex ICS-2100, Thermo Fisher Scientific) for I− and IO3− produced through| | | 3I2 + 3NaOH → 5I− + IO3− + 3Na+ + 3H+ | (R2) |
I2–air(o) was injected using a computer-controlled syringe pump (PSD/4, Hamilton Co.), comprising a 1.25 × 10⁻² dm3 glass gas-tight syringe (g) and a three-port ceramic valve (h), into the flow of a mixture of 400 ppmv CO2 and humidified synthetic air (humidified at 283.2 K; (i) and (j)); the resulting I2–CO2–air mixture is hereafter referred to as I2–air(s). The syringe pump was shaded with aluminum foil to protect I2 from photolysis. The syringe pump introduced I2–air(s) into the contactor as a rectangular pulse of I2 (pulse width, 300 s; partial pressure, 4 × 10⁻⁷ or 2 × 10⁻⁷ atm).
2.2.2 Two-phase contactor.
The contactor, a cylindrical PTFE vessel (Fig. 1(m): inner diameter, 81 mm; inner height, 80 mm), was almost fully submerged in a jacketed stainless-steel water bath (BT-80, SGI) (k) at 283.2 K; the temperature was maintained by circulating temperature-controlled water (NCB-2100, EYELA) through the jacket. Inside the contactor were a PTFE-coated stainless-steel turbine (n, Yamazaki Seisakusyo), a PTFE dish (80 mm in diameter and 5 mm high) with a central basin (o), and PTFE-coated stainless-steel baffles (p), leaving a remaining gas-phase volume of 0.390 dm3. The turbine consisted of two sets of three blades, arranged vertically and offset by 60°, with each blade containing 12 holes, and stirred the gas phase at 300 rpm. Synthetic air was slowly introduced into the contactor (ca. 2.4 × 10⁻⁵ dm3 s−1) through the dead space between the contactor and the axis of the turbine using a mass-flow controller (MFC6 in Fig. 1) to prevent the sample gases from lingering there. The PTFE vessel, its PTFE lid, the support for the motor connected to the contactor, and the PTFE dishes were fabricated in our workshop. Fig. S1† shows the dimensions of the vessel, turbine, baffles, and dishes.
Aqueous solutions were set in dishes with deep basins (4 mm) of two different diameters (30 or 55 mm), and clay samples were set loosely in dishes with shallow (2 mm) basins with diameters of 35 or 55 mm. The ratios between the areas of the basin (S) and the floor of the contactor (Sc), S/Sc, were 0.137 or 0.461 for aqueous solutions and 0.187 or 0.461 for clay samples. The sample sizes depended on the S/Sc as follows: aqueous samples were 2.8 mL for S/Sc = 0.137 and 9.4 mL for S/Sc = 0.461, and clay samples were 0.73 g for S/Sc = 0.187 and 1.78 g for S/Sc = 0.461. Before I2–air(s) was introduced into the contactor, the same gas mixtures without I2 had flowed over each clay sample for >90 min under the same experimental conditions. A four-port PTFE valve (l) was used to direct I2–air(s) into the contactor.
2.2.3 Detection and analysis.
After passing through the contactor, the gas mixture entered a PTFE cell (Fig. 1(s); inner diameter, 20 mm) for measuring I2 in the IBBCEAS instrument. The inlet and outlet of the cell were 0.203 m apart, and its ends were equipped with plano-concave mirrors 25 mm in diameter with a 1.0 m radius of curvature (quoted reflectivity > 0.999 at 515 nm; Article 142831, Layertec), forming a stable optical cavity ca. 0.5 m long. To protect the mirrors from I2 and reduce the residence time of the sample gas in the cell, synthetic air was purged over the mirrors at a constant flow rate (MFC7 and MFC8 in Fig. 1; F7 and F8 in Table S1†).
Light from a laser-driven broadband xenon light source ((q) Model EQ-99-FC, ENERGETIQ) was directed into the cavity through a fiber-coupled output, using a bandpass filter ((r) FF03-525/50-25, Semrock) to exclude light outside the wavelength range of interest (500–550 nm). The light output from the cavity was directed into a spectrograph ((t) M25-GTM, Bunko Keiki) with a grating of 1200 grooves per mm equipped with a 1024 × 256 pixel CCD camera (DU420-OE, ANDOR). Full vertical binning was applied, providing 1024 superpixels. Spectra were recorded by averaging four spectra taken with exposure times of 1 s (total exposure time of 4 s).
2.3 Quantification of I2
In IBBCEAS measurements, the relationship between the spectra and the I2 concentration in the cavity (Fig. 1(s)) is26| |  | (2) |
where nI2 and σI2 are the number density and absorption cross section, respectively, of I2; Rm is the mirror reflectivity; deff is the effective single-pass extinction path length of the I2–air mixture in the cell; and I0 and I are the intensity of transmitted light recorded with synthetic air and I2–air(s), respectively, inside the cavity, with both gases containing CO2 and water vapor. Letting Pout(t) be the partial pressure of I2 in the I2–air(s) leaving the contactor at time t, eqn (2) yields| |  | (3) |
where Iout(t) is the I value at time t for I2–air(s) leaving the contactor, Iin(t) is the I value at time t for I2–air(s) not passing through the contactor when the partial pressure of I2 is Pin, and Pin is the partial pressure of I2 in I2–air(s) corresponding to the peak height of the rectangular input pulse. Pin is calculated from the partial pressure of I2 in I2–air(o), Pin-o, using| |  | (4) |
where Fs is the flow rate of I2–air(o) from the syringe pump and F3, F4, and F5 are the flow rates of CO2–air, air, and humidified air, respectively, from the mass-flow controllers (Fig. 1; Table S1†). As shown in Section S1.2 in the ESI,†Pin-o was experimentally determined to be 7.1 ± 0.2 Pa on the basis of ion chromatography analysis of I− and IO3− in 20 mM NaOH solutions that had captured I2 from I2–air(o). Letting P0 be the value of Pin in our experiments, when 12.5 mL of I2–air(o) was injected in 300 s at a flow rate Fs of 4.17 × 10⁻⁵ dm3 s−1, P0 was 41 mPa, yielding a concentration of 0.40 ppmv.
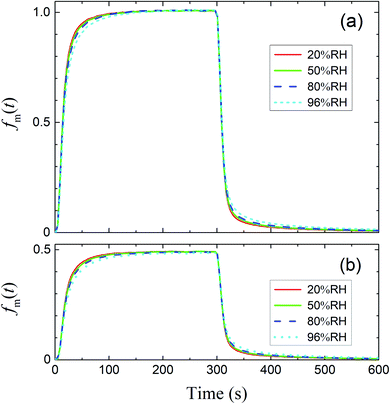
For the clay sample, eight measurements of I2 in I2–air(s) passing through the contactor were typically made for the same sample, when the value of Pin was set at P0 for the first, third, fifth, and seventh measurements and at 0.5P0 for the second, fourth, sixth, and eighth measurements. For the aqueous solutions, two measurements were made for the same sample with the value of Pin set at P0. The input pulse width of I2–air(s) was 300 s for all the measurements. In each measurement, the pulse was injected into the contactor at 89 s after the acquisitions on IBBCEAS started. The value of I0 in eqn (2) and (3) was taken as the average of 10 spectra recorded 7–47 s before injecting I2–air(s) into the contactor. Calibration pulses of I2–air(s) not passing through the contactor were measured with the input pulse height set at P0, 0.8P0, 0.6P0, or 0.5P0 before each series and P0 or 0.5P0 after each series.
The absorption spectra of I2 at the wavelength range of 500–550 nm had both gradual absorption and strongly varying absorption and the latter was used to determine Pout(t). The (I0/Iin(t) − 1) spectrum was fitted by a polynomial of order 19.28 This smooth function was subtracted to yield a strongly varying residual spectrum: an illustrative example is shown in Fig. S2.† After the spectra of both (I0/Iin(t) − 1) and (I0/Iout(t) − 1) had been given this treatment, a principal component regression was applied to the residual spectra from (I0/Iout(t) − 1) to obtain a time series of I2 concentrations while the residual spectra from (I0/Iin(t) − 1) were used as calibration spectra. The regression was carried out, assuming one factor, by using the FACT chemometric toolbox in Scilab software.29,30 No H2O absorption features were detected around 505 nm as a 6ν polyad overtone,28 and hence the influence of water vapor was expected to be negligible (Fig. S2c†).
Returning to eqn (2), let leff represent the effective pathlength in IBBCEAS, calculated from deff/(1 − Rm) (Fig. S2d†). Values of leff and Rm were approximately 600 m and 0.9997, respectively, in the wavelength range of 520–530 nm. The value of nI2 was taken as 28 mPa (6.9 × 10¹² molecules per cm3) under the assumption that the additional flows over the mirrors (at flow rates of F7 + F8) diluted the I2–air(s) in the detection cell, yielding a deff value of 0.20 m. The values of σI2 were interpolated by using previously reported values.31,32 The partial pressure of I2 observed at time t, Pm(t), is related to Pout(t) based on
| |  | (5) |
where
Fout is the total flow rate at 298.2 K of I
2–air(s);
Fadd is the flow rate of air added to the IBBCEAS cell (assumed equal to F7 + F8);
τm is the residence time of I
2 in the cell from
| |  | (6) |
where
Vm is the partial volume of the cell (6.28 × 10
−2 dm
3 with an effective length
deff of 0.20 m). This yields a value of 6.1 s for
τm.
2.4 Data analysis
2.4.1 residence ratios of I2.
The residence ratio xout of I2 at time t is defined as| |  | (7) |
The measured residence ratio xm of I2 at time t is given by
| |  | (8) |
where
P0m is the partial pressure of I
2 for a pulse height when
Pin is
P0:
| |  | (9) |
Substituting eqn (8) and (9) into eqn (5), we get
| |  | (10) |
Values of xm(t) are approximately given by
| |  | (11) |
Combining eqn (10) and (11) yields
| |  | (12) |
2.4.3 First-order rate constants with respect to the concentration of gaseous I2 for uptake on surfaces.
The loss rate of I2 by uptake on surfaces such as clay samples, U(t), is calculated using| |  | (17) |
where P0f(t) is the time series of I2 in the input pulse, Anp is a unit conversion factor, and τc is the residence time of I2–air(s) in the contactor:| |  | (18) |
where Vc is the volume (3.90 × 10⁻¹ dm3) and T is the temperature (283.2 K) of the contactor; T0 is 298.2 K. Eqn (17) is then rewritten as| |  | (19) |
From eqn (12), (16) and (19), U(t) can be expressed in terms of fm(t) and xm(t), as shown in the ESI,† using
| |  | (20) |
Here, values of fm(t) and dfm(t)/dt were calculated from eqn (13), and values of dxm(t)/dt and d2xm(t)/dt2 were obtained for each value of xm(t) by quadratic curve fitting of five data points from (t − 8) to (t + 8). The first-order rate constant for uptake of I2 on the surface with respect to xout(t) at time t, k1-a(t), is given from eqn (12) using
| |  | (21) |
If uptake of I2 on the contactor is negligibly small, the deposition rate at time t, kg-a(t) in cm s−1, is then
| |  | (22) |
where
hc is the height of the contactor (7.5 cm). Values of
kg-a(
t) are related not only to loss but also to adsorption of I
2 on the samples. The apparent surface resistance for I
2 above the surface,
Rg-a(
t), is the reciprocal of
kg-a(
t):
| |  | (23) |
2.4.4 Parameter fitting by simulations to estimate surface resistance for I2.
The parameters related to I2 uptake on surfaces were determined by a simulation in which the parameters were fitted to reproduce the time series of xm(t) by using the parameter-fitting routine of FACSIMILE software (MCPA Software Ltd., UK).22 It is briefly described in Section 3.
3. Results and discussion
3.1 Blank experiments
Blank experiments were run in which I2–air(s) flowed through the contactor with no samples at each value of RH. These assumed perfect mixing of the gas phases and that no loss or adsorption of I2 occurred in the contactor:| |  | (24) |
Here, f(t) is calculated from fm(t) using eqn (16), and xout(t) is related to xm(t) by eqn (12).
The measured time series (Fig. 3) showed that xm(t) before and after 300 s was smaller and larger, respectively, than the dashed curve representing the simulation results, which showed that I2 was reversibly adsorbed on the inner wall of the contactor. This reversible adsorption of I2 increased with increasing RH.
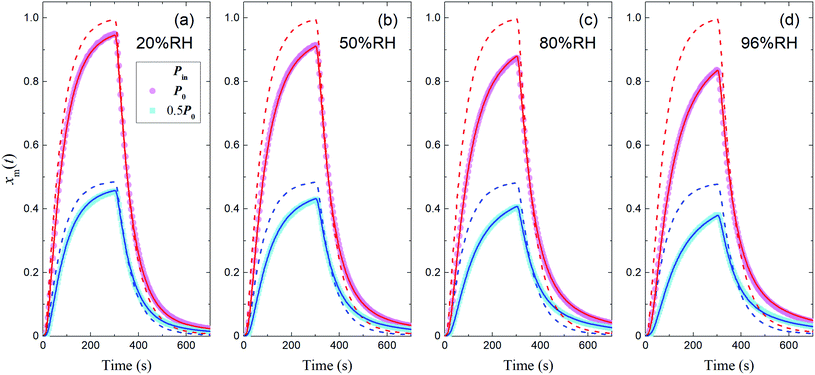 |
| | Fig. 3 Time series of xm(t) for I2 in blank experiments at four RH values. Pin was P0 (4.0 × 10⁻⁷ atm; pink circles) or 0.5P0 (2.0 × 10⁻⁷ atm; blue squares), the temperature was 283.2 K, and Fout was (a) 7.315 × 10⁻³, (b) 7.281 × 10⁻³, (c) 7.302 × 10⁻³, and (d) 7.369 × 10⁻³ dm3 s−1. Dashed curves are the simulation results without loss or adsorption of I2 (from eqn (24)) and solid curves are fitted to the experimental results using eqn (26)–(28). | |
The apparent uptake rates of I2 by the contactor decreased with time, although the gas-phase concentrations of I2 increased (Fig. S4†). This result suggests that the uptake occurred as an initial rapid stage followed by a slow stage, as documented for the sorption of volatile organic compounds on soil particles.33 I2 was readily adsorbed on the contactor walls, then transformed to internal surfaces, such as pores, at a slower rate. Thus our simulation assumed Freundlich-type adsorption of I2 on the contactor walls (eqn (25)) and a reversible transformation of I2 between the surface and internal sites:
| | | yb(t) = Kbadsxout(t)1/N | (25) |
where
yb(
t) is the amount of I
2 on the wall surface;
Kbads and
N are parameters of Freundlich adsorption equilibrium and
N is 2 here, and
| |  | (26) |
| |  | (27) |
| |  | (28) |
where
kbm is the mass-transfer coefficient of I
2 between the gas phase and the wall surface;
kbf and
kbb are first-order forward and backward rate constants, respectively, for the transport of adsorbents between surface and internal sites in the wall;
kbl is a first-order rate constant for I
2 loss in the internal sites;
zb(
t) is the amount of I
2 in the internal sites; and
Abpn is a unit conversion factor. Simulations using
eqn (12) and
eqn (26)–(28) were conducted to simultaneously reproduce the observed time series of
xm(
t) with values of
Kbads,
kbf,
kbb, and
kbl as common parameters for each value of RH while a value of
kbm is a common parameter for all data.
The solid curves in Fig. 3 show xm(t) values from the simulation that minimized the residual sum of squares (RSS); the observed data were satisfactorily reproduced. The values determined for each parameter are listed in Table S4,† which also lists mole ratios of I2 loss. In the blank experiments, the loss ratio of I2 increased from 2.7% to 12.6% with increasing RH for P0 as Pin and from 2.2% to 15.6% for 0.5P0 as Pin. Langmuir-type adsorption of I2 on the contactor also reproduced the xm(t) time series (Table S5†), but the Freundlich-type equation fitted the data with a smaller RSS, as shown in the ESI.† The parameters determined at each RH value (Table S4†) were used to estimate k1-a(t) and simulate xm(t) in the other experiments.
3.2 Uptake of I2 by aqueous solutions
In the time series of xm(t) in I2–air(s) after passage through the contactor with dishes holding 2.8 mL of water, 1 mM aqueous sulfuric acid, or 1 mM or 10 mM aqueous ascorbic acid in small basins (S/Sc, 0.138), maximum values of xm(t) for water and sulfuric acid were both ∼5% smaller than those of the blank, and values for ascorbic acid were ∼40% smaller than those of the blank (Fig. 4). The similar time series for water and sulfuric acid suggests that the water surface was saturated with undissociated I2 under the experimental conditions such that the uptake of I2 was controlled by aqueous-phase diffusion of I2. The dissociation ratio in reaction (R1) was estimated at 16% under the experimental conditions (283 K; pH, 5.6 for water in equilibrium with 400 ppmv CO2; partial pressure of I2, 3.2 × 10⁻⁷ atm) according to| |  | (29) |
where Ka is the dissociation constant of reaction (R1) at 283 K, KH is the Henry's law constant of I2 at 283 K, and PI2 is the partial pressure of I2 (see the ESI†). In contrast, in ascorbic acid, I2 was reduced to I− based on| | | I2 + C6H8O6 → 2H+ + 2I− + C6H6O6 | (R3) |
and I2 uptake proceeded much faster than in water. With the reported rate constant for reaction (R3) of 1.2 × 10⁵ M−1 s−1 at 20 °C,34 the lifetime of I2 with respect to reaction (R3) in 10 mM ascorbic acid is estimated at about 10−3 s at 20 °C, which is two orders of magnitude shorter than that of I2 with respect to hydrolysis in reaction (R1).35 In this solution, I2 thus reacts dominantly with ascorbic acid. However, the similar time series of xm(t) for 1 mM and 10 mM ascorbic acid (Fig. 4c and d) suggests that the rate-limiting step is not the aqueous reaction but mass transfer in the gas-film layer, as described by two-film layer theory. We estimated the resistance for I2 for mass transfer in the gas-film layer above ascorbic acid, or Rg-cont-w, under the experimental conditions from the k1-a(t) values and simulations for 10 mM ascorbic acid, and as discussed below, we were able to compare them with the corresponding uptake coefficients (γ) of I2 estimated from previously published data.
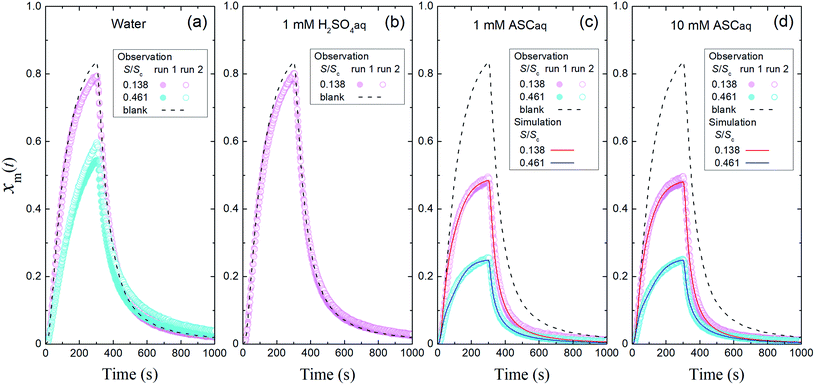 |
| | Fig. 4 Time series of xm(t) in I2–air(s) (Pin, 4.0 × 10⁻⁷ atm) after passage through the contactor over (a) water, (b) 1 mM aqueous sulfuric acid (H2SO4aq), (c) 1 mM aqueous ascorbic acid (ASCaq), and (d) 10 mM ASCaq. Blank runs are shown as dashed curves. Pink symbols are the results for 2.8 mL of solution in the small basin (S/Sc, 0.137) of the contactor dish, and blue symbols are the results for 9.4 mL of solution in the large basin (S/Sc, 0.461). The red and blue curves are the simulation results obtained by using eqn (S11)–(S13).† | |
Fig. 4 also shows the time series of xm(t) for experiments with 9.4 mL of liquid in the contactor dish with a large basin (S/Sc, 0.461). Loss rates of I2 through uptake on the surface, U(t), were calculated during the injection period (13–289 s) using eqn (20). After 50 s, these values decreased with time for water and the blank but were almost constant for 10 mM ascorbic acid (Fig. 5a). Because the gas-phase concentration of I2 increased with time, the rate constants k1-a(t) calculated using eqn (21) decreased with time (Fig. 5b). The k1-a(t) value for uptake by the contactor (Table S6†) was subtracted from the rate constants, and the remainders were used to calculate deposition rates, kg-a(t), using eqn (22) (Fig. 5c).
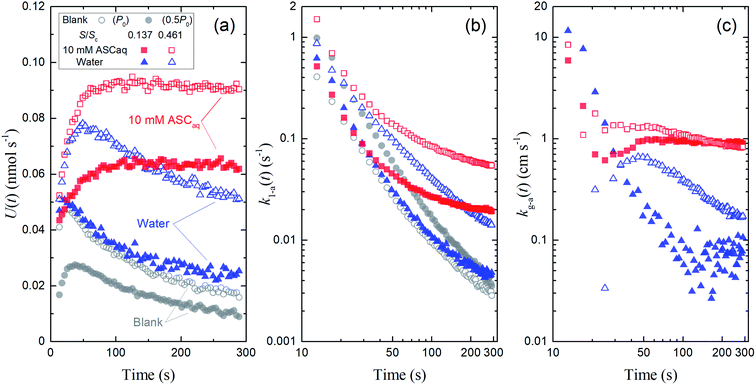 |
| | Fig. 5 Time series of (a) loss rates of I2 by uptake on surfaces, U(t), (b) their apparent first-order rate constants, k1-a(t), and (c) their apparent deposition rates, kg-a(t) in blanks and the first experimental run for 10 mM ascorbic acid and water in small basins (S/Sc, = 0.138, closed symbols) and large basins (S/Sc = 0.461; open symbols). Red square symbols represent the results for ascorbic acid, blue triangle symbols represent the results for water, and gray circle symbols represent the results for blank (open circles, P0 as Pin at 96% RH; closed circles, 0.5P0 as Pin at 96% RH; the former was taken as the blank to obtain kg-a(t) values here). | |
The rate constant k1-a and the deposition rate kg-a were defined as the average of 10 data points of k1-a(t) and kg-a(t), respectively, from 253–289 s and the surface resistance Rg-a was determined to be the reciprocal of kg-a. When the k1-a(t) value for the blank with P0 as Pin was subtracted from the rate constants in the first experimental run, the kg-a values in 10 mM ascorbic acid were 0.91 ± 0.03 cm s−1 for the small basin and 0.85 ± 0.01 cm s−1 for the large basin, yielding Rg-a values of 109 s m−1 and 118 s m−1, respectively. Values of k1-a, kg-a, and Rg-a were estimated similarly for all of the aqueous solutions (Table S6†).
Simulations were carried out to distinguish the uptake of I2 by ascorbic acid and the contactor (Section S6-3 in the ESI†). Letting km be the mass-transfer coefficient of I2 in the gas-film layer above ascorbic acid, values of km are thus estimated to be 0.91 ± 0.01 cm s−1 and 0.78 ± 0.01 cm s−1 for the small and large basins, respectively (errors at 90% confidence level). These values are approximately equal to the estimated values of kg-a. Overall, Rg is estimated to be 120 ± 5 s m−1 from 16 data of Rg-a for 1 mM and 10 mM ascorbic acid (Table S6†). Errors represent the standard deviation.
Referring to the reported physicochemical properties of I2,34,36–38 we estimate the uptake coefficients (γ) of I2 at 2.6 × 10⁻³ for 10 mM ascorbic acid and 1.0 × 10⁻³ for 1 mM ascorbic acid (Section S6.4. in the ESI†). In this estimate, 10−2 was adopted as the accommodation coefficient of I2.36 In the absence of the gas-film transfer limitation, the Rg values for I2 above ascorbic acid would be 10 s m−1 and 26 s m−1, respectively (the ESI†). These values are much smaller than the Rg values obtained here; this supports our experimental finding that the Rg value of 120 s m−1 is the resistance for mass transfer of I2 in the gas-film layer above aqueous surfaces (Rg-cont-w). This value of Rg-cont-w was used as the resistance for mass transfer of I2 in the gas-film layer above clay samples in Section 3.3.
Fig. 4 and 5 suggest that uptake of I2 by water differed with basin size, probably because of a difference in aqueous-phase turbulence between them. We did not obtain surface resistance for I2 above water. As seen in eqn (29), dissociation of I2 in water occurs much more strongly in the atmosphere than that observed here because the partial pressure of I2 is very low, and I2 uptake on aqueous surfaces in the atmosphere is determined not only by turbulence near surface water but also by hydrolysis in reaction (R1).36 For ascorbic acid, because the leaf apoplast contains ascorbic acid, reaction (R3) is expected to proceed in the leaf interior, where O3 is taken up by ascorbic acid.39 However, this will happen only in the small number of plants that open their stomata at night.19
3.3 Uptake by clay samples
3.3.1 Loss and adsorption ratios of I2.
The first of our experiments with a flow of I2–air(s) over the clay samples was conducted at 80% RH and yielded xm(t) values that were definitely smaller than those of the blank experiment (Fig. 6). For each clay sample, xm(t) was smaller in the large basins than in the small basins. These results showed that I2 was deposited on the clay samples and removed from the gas phase. Uptake of I2 by clay samples probably involved irreversible adsorption of I2 in micropores of clay minerals because of the relatively large size of I2, as reported for I2 uptake by active carbons.40 This decrease of xm(t) varied among the clay samples, but the variation was small compared to that of the BET surface areas of the samples (Table 1). Fig. S5 and S6† show the results for 20% RH and 50% RH, respectively.
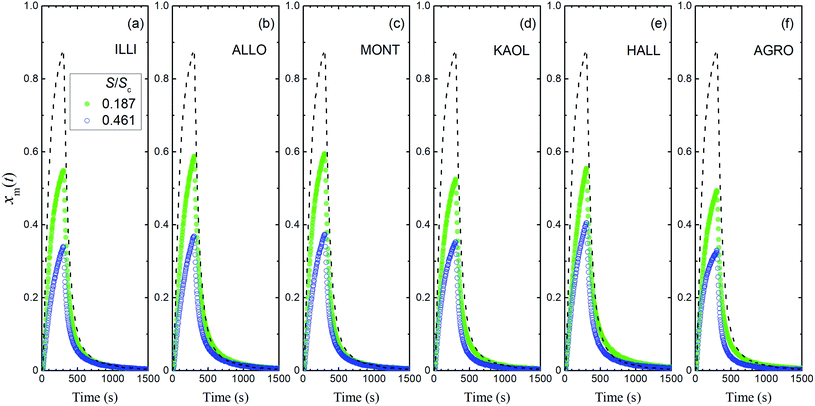 |
| | Fig. 6 Time series of xm(t) in I2–air(s) (Pin, 4.0 × 10⁻⁷ atm) after passage through a contactor containing (a) illite, (b) allophane, (c) montmorillonite, (d) kaolinite, (e) halloysite, or (f) AgroMAT AG-1 in run 1 at 80% RH in small basins (S/Sc, 0.187; sample, 0.73 g; green closed symbols) and large basins (S/Sc, 0.461; sample, 1.78 g; blue open symbols). Dashed curves show time series of xm(t) in blank experiments at 80% RH. | |
Loss ratios of I2 were defined as ΔQloss/Qin, where ΔQloss = Qin − Qout, Qin was the amount of I2 entering the contactor, and Qout was the integrated amount of I2 observed at 0–1709 s in I2–air(s) leaving the contactor. Loss ratios of I2 decreased over successive runs for every clay sample. The decrease was greatest after run 1 (Fig. 7). Loss ratios decreased with increasing RH from 20% RH to 80% RH for all runs of allophane and for runs 3–7 of illite and kaolinite. This dependence on RH tended to strengthen as runs were repeated. Loss ratios for montmorillonite, halloysite, and AgroMAT AG-1 decreased between 20% RH and 50% RH and increased between 50% RH and 80% RH. However, the latter increase was also evident in the blank experiments. This relative-humidity dependence is discussed in Section 3.3.3 (see eqn (40)).
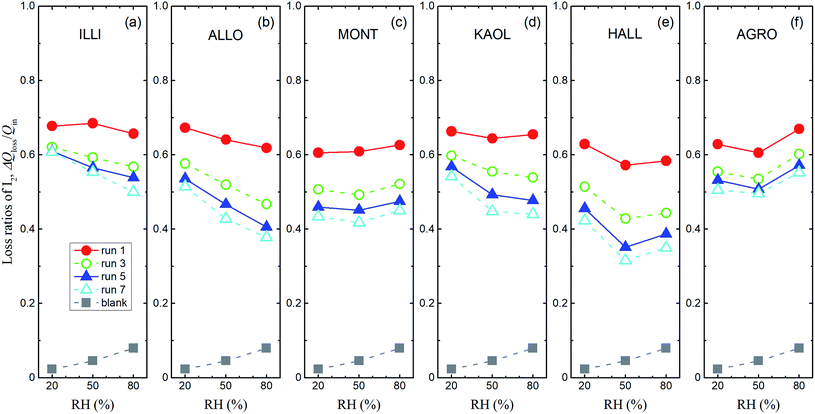 |
| | Fig. 7 Loss ratios of I2, ΔQloss/Qinversus RH for I2–air(s) mixtures flowing over large basins of (a) illite, (b) allophane, (c) montmorillonite, (d) kaolinite, (e) halloysite, and (f) AgroMAT AG-1 samples in odd-numbered runs (Pin, 4.0 × 10⁻⁷ atm). Gray squares show ΔQloss/Qin in blank experiments with P0 as Pin. | |
Fig. 8 shows the time series of xm(t) in odd-numbered runs for kaolinite at 80% RH along with the same profiles normalized to the maximum (xm-max) in each run to bring out changes in the profile shape with successive runs. The monotonic decrease with successive runs of the ratios of the integrated amount of I2 during the injection period (0–300 s) to that after 300 s meant that there was an increase in the ratio of I2 adsorption to I2 loss. Fig. 9 shows stacked column charts of ΔQloss/Qin and ΔQads/Qin for odd-numbered runs with each clay sample at 80% RH. ΔQads is the amount of I2 reversibly adsorbed on the clay samples and was defined as ΔQads = Qaft − Q300 − Qsaft where Qaft is the integrated amount of I2 observed at 301–1709 s in I2–air(s) leaving the contactor, Q300 is the amount of gaseous I2 in the contactor at 300 s, and Qsaft is the integrated amount of I2 in I2–air(s) entering the contactor at 301–1709 s (Fig. 2). ΔQloss decreased and ΔQads increased with successive runs; the sum of ΔQloss and ΔQads, which represented the amount of I2 accommodated by clay samples, remained almost constant or decreased more slowly than ΔQloss with successive runs. This behavior could be explained by using a two-stage model with two kinds of active sites on the surface and in the interior for loss of I2. One kind was consumed on the surface, and the other retained its activity in the interior for uptake of I2, as shown in Section 3.3.3. Similar behavior of ΔQloss/Qin and ΔQads/Qin over successive runs was observed at 20% RH and 50% RH and for even-numbered runs (Fig. S7–S11†).
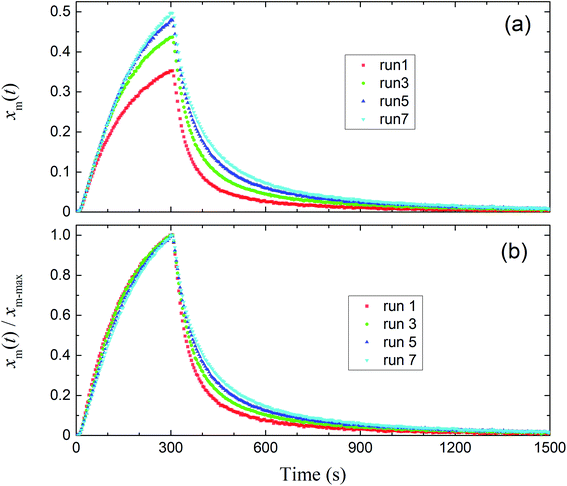 |
| | Fig. 8 (a) Time series of xm(t) in I2–air(s) for odd-numbered runs with kaolinite in the small basin at 80% RH (Pin, 4.0 × 10⁻⁷ atm). (b) Normalized time series from (a). | |
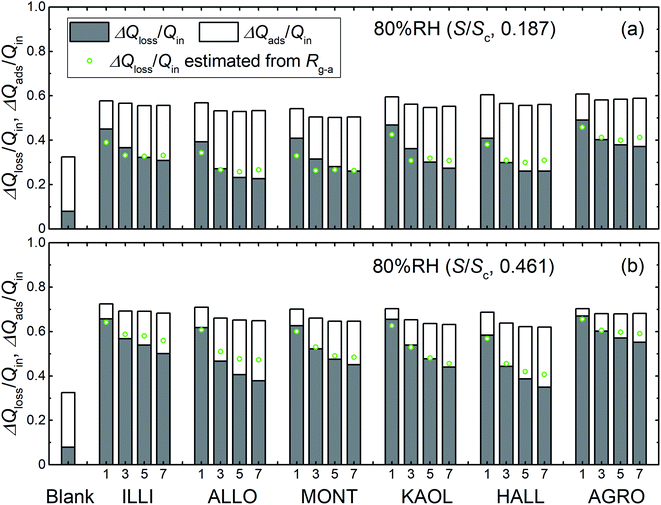 |
| | Fig. 9 Loss ratios (ΔQloss/Qin, grey columns) and adsorption ratios (ΔQads/Qin, white columns) of I2 for blank and odd-numbered runs with each clay sample, (a) in small basins (S/Sc, 0.187) and (b) in large basins (S/Sc, 0.461), at 80% RH (Pin, 4.0 × 10⁻⁷ atm). Green circles represent loss ratios, ΔQloss/Qin, calculated from Rg-a (Tables S8–S13†) with eqn (S21).† | |
3.3.2 Apparent surface resistance for I2.
We calculated I2 loss rates through surface uptake U(t), the rate constants k1-a(t), and the deposition rates kg-a(t) during the injection period (13–289 s) for each run of the clay experiments at the two basin sizes. Fig. 10 shows the results of runs 1 and 5 with illite at 80% RH. We then used a procedure analogous to our procedure for the aqueous solutions (Section 3.2) to obtain the apparent surface resistance, Rg-a, above the clay samples (Tables S8–S13) as described in Section S7.3 in the ESI.†
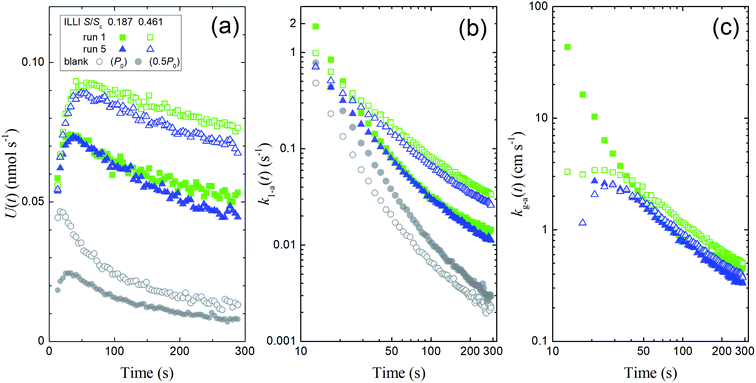 |
| | Fig. 10 Plots calculated from the experimental results during I2 injection over illite at 80% RH showing (a) loss rates of I2 by surface uptake, U(t), (b) the apparent first-order rate constants k1-a(t), and (c) the apparent deposition rates kg-a(t) in blank experiments and in runs 1 and 5 with small basins (S/Sc, 0.187; closed symbols) and large basins (S/Sc, 0.461; open symbols). Green squares indicate the results in run 1, blue triangles indicate the results in run 5, and grey circles indicate the results for the blank run (open circles, Pin = P0; closed circles, Pin = 0.5P0). The k1-a(t) value for the blank with Pin = 0.5P0 was subtracted from each value of k1-a(t), and the difference was used to calculate the kg-a(t) value. | |
If Rg-cont is the resistance for mass transfer of I2 in the gas-film layer above clay samples in the contactor, the surface resistance for I2 above clay samples, Rg-a-clay, is given by
| | | Rg-a-clay = Rg-a − Rg-cont | (30) |
The Rg-cont-w value above ascorbic acid (120 ± 5 s m−1; Section 3.2) was taken as the value of Rg-cont in eqn (30). Fig. 11 shows the Rg-a-clay values thus calculated from the average of Rg-a values for each clay sample with the Rg-cont-w value.
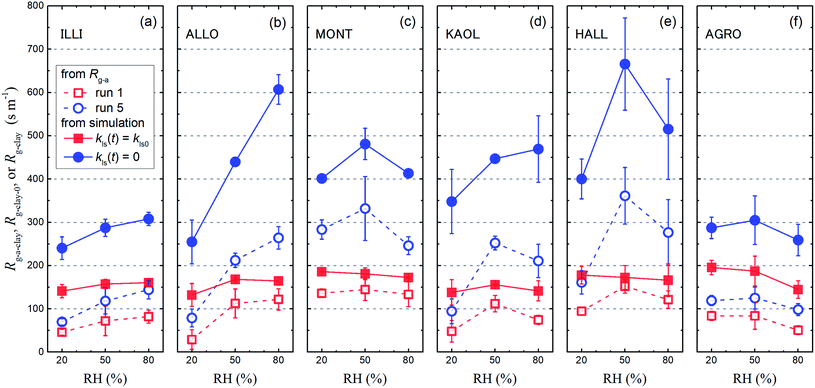 |
| | Fig. 11 Resistance for I2 above clay samples of Rg-a-clay, Rg-clay-0, and Rg-clay at 20% RH, 50% RH, and 80% RH. The Rg-a-clay values (open symbols) were calculated with eqn (30) by subtracting the Rg-cont-w value (120 s m−1) from the average of the Rg-a values with small and large basins for each clay sample in run 1 (red squares) and run 5 (blue circles) (Tables S8–S13†). Values of Rg-clay-0 (red closed squares) and Rg-clay (blue closed circles) were calculated with eqn (38) and eqn (40), respectively, using the values of parameters obtained in the simulation (Table S14†). Error bars are standard deviations of the two values: one is calculated for the results with the small basins and the other is calculated for the results with the large basins. | |
However, as is apparent in Tables S8–S13,† the values of Rg-a for all clay samples in even-numbered runs (Pin, 0.5P0) are apparently smaller than the Rg-a values in odd-numbered runs (Pin, P0), except for run 1. This pattern suggests that there was a systematic error in the determination of Rg-a. This error was probably caused by the fact that the degree of decrease in k1-a(t) with time differed between even-numbered and odd-numbered runs because the values of Pin differed and because the differences varied between each run and blank. To reduce these errors, the mass-transfer processes of I2 in a gas-film layer above clay samples need to be formulated and then taken into account in a simulated calculation to reproduce the decrease of I2 uptake rates with time and to distinguish between I2 uptake on clay samples and uptake on the wall surfaces of the contactor (blank). The parameters obtained in the simulation were used to estimate I2 uptake rates at the low concentrations of I2 that might be found in the atmosphere.
3.3.3 Simulation of I2 uptake by clay samples.
The simulation was conducted on the basis of a two-stage model in which the uptake of I2 by clay samples occurred via an initial stage of rapid sorption onto surface sites followed by a stage of slow sorption onto interior sites such as the mesopores and the micropores of clay samples. Such a two-stage process has been documented for the sorption of volatile organic compounds on soil particles.33 Kinetics of adsorption on porous solids such as clay particles in the gas phase and in liquid phase has been investigated on the basis of intraparticle diffusion models or surface reaction models.33,41,42 Statistical rate theory also approached adsorption/desorption kinetics for homogeneous and heterogeneous solid surfaces.41 We used a surface reaction model assuming homogeneous surfaces. This model was simple but could reproduce the time series of xm(t) in consecutive runs as shown below.
For the first stage, as mentioned in the previous section, we assumed that the mass-transfer rates of the I2 in the gas-film layer above the clay samples were represented by a time-dependent function of km(t) that took positive values for the mass transfer from the gas to surfaces and negative values for the reverse transfer. This scenario is analogous to a model for gas-film layer diffusion followed by Langmuir-type adsorption (see the ESI†) and takes the form
| |  | (31) |
| |  | (32) |
where
Kads is the equilibrium coefficient for the adsorption of I
2 onto clay samples, and
kma is a parameter needed to determine
km(
t); it is noteworthy that
kma may take larger values than the actual mass-transfer rates of I
2 in the gas-film layer. Here,
θ(
t) is the fractional coverage on the surface, that is,
qt/
q∞, where
qt and
q∞ denote the amount of I
2 adsorbed at time
t and when the clay surface is fully saturated, respectively.
For the second stage, some of the adsorbed I2 is assumed to transfer between the surface and the interior sites and some is lost. As described in Section 3.3.1, the loss ratios of I2 decreased over successive runs for every clay sample. The decrease was greatest after run 1 and remained finite through each set of experimental runs. This pattern suggests different kinds of active sites for loss of I2. We hence assumed that there were two kinds of active sites: one kind was consumed on the surface, and the other retained its activity in the interior for uptake of I2 as follows:
| |  | (33) |
| |  | (34) |
where
kf is the first-order rate constant for the transfer of adsorbents from the surface to the interior sites of the clay samples,
Kpads is the equilibrium constant of I
2 between the surface and the interior,
φ(
t) is the number of the interior sites into which I
2 has been transformed as a fraction of
q∞,
Bpn is a conversion factor used to convert units,
kloss-p is the first-order rate constant for loss of I
2 in the interior sites that retain their activity regardless of I
2 loss. Here,
kloss-s(
t) is the time-dependent, first-order rate constant for loss of I
2 in the surface sites and is represented by
| |  | (35) |
where
kls0 is the first-order rate constant for I
2 loss for fresh clay samples at the active sites that are lost per loss of I
2, and
Nls0 and
nls(
t) are the numbers of these active sites as a fraction of
q∞ for fresh clay samples and for clay samples exposed to I
2–air(s) during time
t, respectively. Assuming that the decrease of
nls(
t) is equal to the loss of I
2, it follows that
| |  | (36) |
Simulations using eqn (31)–(36) together with eqn (12), (27) and (28) were conducted to simultaneously reproduce the time series of xm(t) for runs 1–5 for the same clay sample in two experimental sets, one set with small basins and another with large basins for each clay sample (Fig. S12–S17†). The simulation was conducted with common values of the parameters kma, Kads, kf, kloss-p, kls0, and Nls0 for both experimental sets and with a parameter q∞ that varied between the sets. Fig. 12 shows the result for montmorillonite samples at 80% RH. The observed time-series of xm(t) were reproduced by the simulation. The active sites for I2 loss on the surface decreased with successive runs and almost all sites were lost at the end of run 5. The observed data were similarly reproduced by the simulation for all clay samples (Fig. S12–S17†). The values of the parameters obtained in the simulation are listed in Table S14.† The residual sums of squares, RSS, for allophane and kaolinite samples at 20% RH were larger than those for the other samples. Values of kf decreased with increasing relative humidity for all clay samples (Table S14†). This decrease was consistent with the scenario that a water film formed in the interior, which increased with relative humidity and decreased surface areas in shale clay,43 reduced rates for the transfer of I2 between the surface and the interior of clay samples.
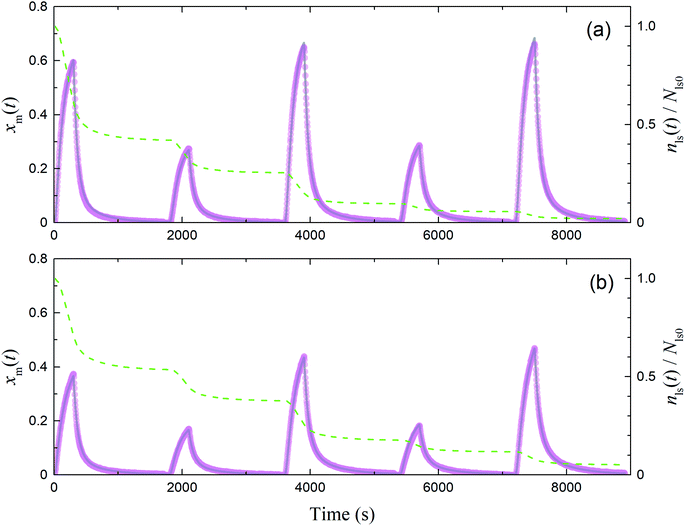 |
| | Fig. 12 Time series of xm(t) in I2–air(s) observed (pink circles) and simulated (grey curves) in runs 1–5 with each montmorillonite sample at 80% RH in (a) small basins (S/Sc, 0.187) and (b) large basins (S/Sc, 0.461). Green dashed curves indicate the time series of residence ratios of active sites for I2 loss, nls(t)/Nls0. Temporal duration of each run was about 1700 s and there were several minutes between runs; however, each panel shows plots of all data from runs 1–5 in consecutive 1800 s intervals for convenience. | |
The corresponding equilibrium constant, Kpads, decreased with increasing RH between 50% and 80% for illite, allophane, and kaolinite samples while it increased or remained almost constant for montmorillonite, halloysite, and AgroMAT AG-1 samples. It suggested that the water film might destabilize I2 on the surface and in the interior to almost the same extent for the latter three clay samples since Kpads was the equilibrium constant of I2 between the surface and the interior of clay samples. This equal destabilization might be the reason that the loss ratios for the latter three clay samples increased with RH between 50% and 80% (Fig. 7 and 11) as discussed below (see eqn (40)).
When uptake of I2 proceeded at a constant rate at low concentrations of I2 such as the concentrations in the atmosphere, we calculated the uptake rate kg0 of I2 by fresh clays with eqn (37) (see the ESI†)
| |  | (37) |
Because the term kma−1 on the right side of eqn (37) corresponds to mass transfer in a gas-film layer, the surface resistance above fresh clays, Rg-clay-0, is represented by
| |  | (38) |
We assumed that kloss-s(t) = 0 for clays in the environment because surface active sites might be consumed by exposure to naturally-occurring I2 and other species. For clays with kloss-s(t) = 0, the uptake rate kg of I2 by the clays and the surface resistance for I2 above the clays, Rg-clay, are given by eqn (39) and (40), respectively, from eqn (37) and (38).
| |  | (39) |
| |  | (40) |
Values of kg0, Rg-clay-0, kg, and Rg-clay were calculated from the values of the parameters obtained in the simulation (Table S14†). The calculated values of Rg-clay-0 and Rg-clay are plotted in Fig. 11. The Rg-clay-0 values were greater than the Rg-a-clay values for run 1 and the difference was about 100 s m−1 for illite and AgroMAT-AG-1 samples. The implication is that the value of Rg-cont in eqn (30) was overestimated. It is possible that the value of Rg-cont was smaller than the value of Rg-cont-w because the surface roughness of clay samples decreased resistance to mass transfer in the gas-film layer. For the same reason, the Rg-clay values were greater than the Rg-a-clay values for run 5. This also resulted from the fact that, even at the end of the injection period in run 5, k1-a(t) did not decrease to a constant value which corresponded to the value expressed using eqn (40).
Fig. S18 and S19† show the plots of Bnq/q∞/Kads, r1, and r2 against RH for each clay sample in small basins (Fig. S18†) and large basins (Fig. S19†) where r1 and r2 are the first term and the second term, respectively, in the right of eqn (40). Fig. S18 and S19† show that values of Bpn/q∞/Kads decreased with RH between 50% and 80% for all clay samples. It meant that the adsorption of I2 on the surfaces of clay samples increased with increasing RH. Hence if kf, Kpads, and kloss-p were constant, values of r1 and r2 would decrease with increasing RH and the loss ratios would increase for all clay samples. However, r1 or r2 or both increased with increasing RH for illite, allophane, and kaolinite samples because Kpads decreased with increasing RH. In contrast, values of Kpads increased or remained almost constant and the loss ratios increased with increasing RH between 50% and 80% for montmorillonite, halloysite, and AgroMAT AG-1. It suggested that relative humidity might destabilize I2 in the interior more than on the surface for the former three clay samples and to almost the same extent as on the surface for the latter three clay samples. This difference might come from the difference in pH values of the water film in the interiors and buffering capacity against absorption of CO2 among the clay samples.
Values of Rg-clay for all samples reached 241–402 s m−1 at 20% RH, 288–666 s m−1 at 50% RH, and 260–608 s m−1 at 80% RH. These values were equal to a value of 330 s m−1, which corresponded to a deposition velocity of 0.3 cm s−1 in atmospheric model calculations for Imodel2, within a factor of two. However, if the clay content in soils, such as 10–20% in weight,44,45 was taken into account, the surface resistance for I2 with respect to uptake by clay minerals further exceeded the values used in the atmospheric models. We used the Rg-clay values calculated from eqn (40) to estimate non-stomatal bulk surface resistance in dry deposition (Section 3.4).
3.4 Influence of I2 uptake by clay minerals on non-stomatal resistance for I2 above ground surfaces
We estimated non-stomatal resistance for I2 above ground surfaces (Rns) with eqn (1) using the Rg values for I2 above the clay minerals that we examined. The values of Rac and Rcut in eqn (1) have been expressed as functions of friction velocity (u*) and the leaf area index (LAI), both of which have been specified for each land use category (LUC) for dry and wet conditions.20 Because the RH range in this study (20–80% RH) fell within the range of dry conditions, we calculated Rac and Rcut values under dry conditions with eqn (41) and (42), respectively:| |  | (41) |
| |  | (42) |
where Rac0 is the reference value for in-canopy aerodynamic resistance specific to each LUC and Rcut0 is the reference value for cuticle resistance under dry conditions specific to both depositing species and the LUC. Table S16† lists reference values of Rac0, Rcut0 for SO2, Rg for SO2, and LAI for three LUCs (short grass and forbs, evergreen broadleaf trees, and deciduous broadleaf trees).20
For soils in each LUC, we calculated Rns values (1) using the reference value of Rg for SO2 as the ground surface resistance (Rns-SO2) and (2) using the Rg-clay values for I2 above the clay samples as ground surface resistance (Rns-RgI2). Fig. 13 shows plots of these resistances against u* at 20% RH and 80% RH. The Rns-RgI2 values were calculated from the minimum and maximum Rg-clay values for I2 for all the clay samples. Values of Rns-RgI2 consistently exceeded those of Rns-SO2; the difference between them was smaller at 80% RH than at 20% RH because the Rcut values for SO2 decreased with increasing RH, as seen in eqn (42), and Rns was thereby more strongly controlled by Rcut than by Rg (eqn (1)).
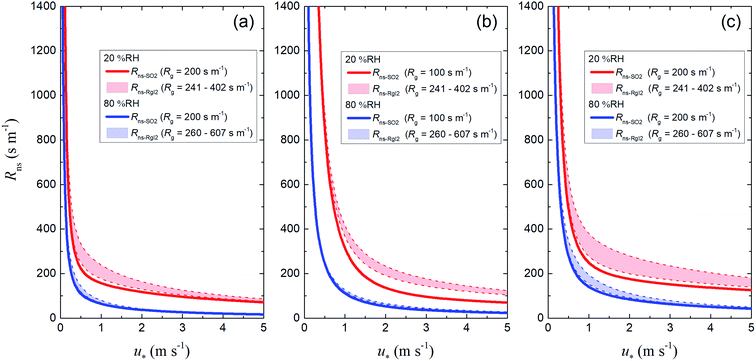 |
| | Fig. 13 Plots of non-stomatal surface resistance, Rns, against friction velocity, u*, at 20% RH (red) and 80% RH (blue) if Rg is the reference value for SO2 (solid curves, Rns-SO2) or the Rg-clay value for I2 (dashed curves, Rns-RgI2) for (a) short grass and forbs, (b) evergreen broadleaf trees, and (c) deciduous broadleaf trees. For the deciduous broadleaf tree LUC, LAI is 0.5, the reference value of LAI in March (see the ESI†). | |
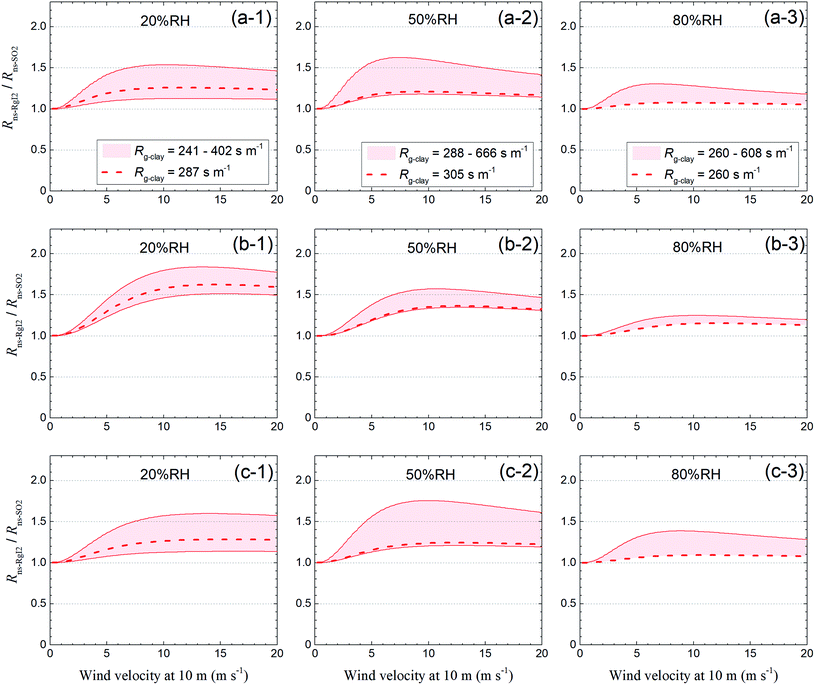
Fig. 14 shows the ratio of these two resistances (Rns-RgI2/Rns-SO2) for each LUC at 20% RH, 50% RH, and 80% RH against wind velocity at a height of 10 m (u10), which was calculated by relating u10 to u* with eqn (S37).† For the short grass and forb LUCs, the Rns-RgI2/Rns-SO2 ratios at u10 = 5 m s−1 were approximately 1.1–1.4 at 20% RH, 1.1–1.6 at 50% RH, and 1.1–1.3 at 80% RH, whereas the values of Rg-clay were approximately 1.2–3.3 times the reference value of Rg for SO2 above soils in this LUC (200 s m−1). For the evergreen broadleaf tree LUC, the dependence of the Rns-RgI2/Rns-SO2 ratios on wind velocity was greater than for the short grass and forb LUCs because the roughness length was longer in the former than in the latter. The Rns-RgI2/Rns-SO2 ratios at u10 = 10 m s−1 were approximately 1.5–1.8 at 20% RH, 1.3–1.6 at 50% RH, and 1.1–1.2 at 80% RH whereas the values of Rg-clay were approximately 2.4–6.6 times the reference value of Rg for SO2 above soils in this LUC (100 s m−1). For the deciduous broadleaf tree LUC, the Rns-RgI2/Rns-SO2 ratios at u10 = 10 m s−1 were approximately 1.1–1.6 at 20% RH, 1.2–1.8 at 50% RH, and 1.1–1.4 at 80% RH. Fig. 14 also shows the Rns-RgI2/Rns-SO2 ratios calculated from the Rg-clay values above the AgroMAT AG-1 sample (dashed curves). Values of this ratio at 80% RH were as much as 1.2 for all LUCs. Values of this ratio became greater at lower relative humidity and the values at 20% RH were as much as 1.6 for the evergreen broadleaf tree LUC and as much as 1.3 for the other LUCs. The change in Rns by switching the Rg values between I2 and SO2 in the scaling method could thus be appreciable at 20% RH.
 |
| | Fig. 14
R
ns-RgI2/Rns-SO2versus wind velocity at 10 m of height at (1) 20% RH, (2) 50% RH, and (3) 80% RH for (a) short grass and forbs, (b) evergreen broadleaf trees, and (c) deciduous broadleaf trees. Red regions indicate values calculated from the range of the Rg-clay values. Dashed curves indicate values calculated from the Rg-clay values above the AgroMAT AG-1 sample. The reference values of Rg for SO2 are 100 s m−1 for evergreen broadleaf tree LUCs and 200 s m−1 for the other LUCs. For deciduous broadleaf tree LUCs, roughness length, z0, is set at 0.4 m and LAI is 0.5, the reference value of LAI in March (see the ESI†). | |
4. Conclusion
We used the rectangular pulse method with an IBBCEAS instrument to determine uptake rates of I2 by aqueous solutions and clay particles in a gas mixture of 400 ppmv CO2 and humidified air at 283 K. Uptake of I2 proceeded much more rapidly by aqueous ascorbic acid than by water; the former was limited by mass transfer in the gas-film layer. Reactions of I2 with ascorbic acid were expected to proceed in the leaf interior. However, this would happen only in the small number of plants that open their stomata at night.
Uptake of I2 by clay particles was confirmed at 20–80% RH. Uptake rates of I2 varied among the clay samples, but the variation was small compared to that of the BET surface areas of the samples. Uptake rates of I2 decreased with successive runs and remained finite through each set of experimental runs. These finite rates decreased with increasing relative humidity from 20% RH to 80% RH for illite, allophane, and kaolinite samples. This dependence on relative humidity was different from that for SO2, a commonly used proxy for I2 in scaling methods. Ratios of I2 loss and adsorption decreased and increased, respectively, with the exposure time of clay samples to I2 and their changes were largest during the initial periods after exposure to I2. Confirmation of the uptake of I2 by clay minerals at 20–80% RH suggested that it contributed to the dry deposition of I2 on soils as much as other processes such as reactions of I2 with organic matter. Uptake of I2 by clay samples probably proceeded through irreversible adsorption of I2 in micropores of clay minerals, as reported for I2 uptake by active carbons.40
The time-series of I2 were reproduced in the simulation by assuming a two-stage process. The parameters obtained in the simulation were used to estimate I2 uptake rates at low concentrations of I2 that might be found in the atmosphere. For fresh clay samples, the surface resistance for I2 above them was smaller than that for Imodel2 above soils applied to atmospheric model calculations, such as 200 s m−1. For clay samples having been exposed to a gas mixture of I2, the surface resistance, however, exceeded the values used in atmospheric models. Further excess was expected by taking into account the clay content in soils. For vegetated surfaces such as those near the Fukushima Dai-ichi nuclear power plant, the change in Rns by switching the Rg values between I2 and SO2 in the scaling method was smaller at 80% RH than at 20% RH, and it could be appreciable at 20% RH. For vegetated surfaces, switching the Rg values between I2 and SO2 in the scaling method thus remained useful for estimating the dry deposition velocity of I2 at 80% RH, but it might result in substantial errors for the surface resistance at 20% RH, unless surface resistance for I2 above soils is controlled by other processes such as reactions of I2 with organic matter in soils. This suggested that the dry deposition processes of I2 or Imodel2 needed to be estimated separately before and after sunrise when I2 was released at night.
In the blank experiments (Section 3.1), the loss and adsorption of I2 on inert surfaces (PTFE wall surfaces) increased with increasing RH. This pattern was similar to the pattern of Rcut for SO2, as expected from eqn (42). As seen in Fig. 13, Rns values above vegetated surfaces at 80% RH were determined mostly by Rcut rather than by Rg. The estimate of Rcut for I2 was thus important for evaluating the dry deposition velocity of I2 at night. A study on Rcut was, however, beyond the scope of this work. Although we did not explicitly drive dry deposition velocities in this study, the surface resistance data we obtained can be used in series-resistance models of dry deposition embedded in atmospheric transport and dispersion models to assess the human risk of radioiodine.
Author contributions
The laboratory experiments and simulated calculations were performed by SK. The manuscript was written through the contributions of all authors. All authors have given approval to the final version of the manuscript.
Conflicts of interest
There are no conflicts of interest to declare.
Acknowledgements
We thank Dr Zheng-Ming Wang (AIST) for providing data on the BET surface area of AgroMAT Clay Soil AG-1. This work was supported by the Japan Society for the Promotion of Science (grant number JP18K11633).
References
-
WHO, Health Effects of the Chernobyl Accident and Special Health Care Programmes, Geneva, 2006 Search PubMed.
- G. Katata, M. Chino, T. Kobayashi, H. Terada, M. Ota, H. Nagai, M. Kajino, R. Draxler, M. C. Hort, A. Malo, T. Torii and Y. Sanada, Detailed source term estimation of the atmospheric release for the Fukushima Daiichi Nuclear Power Station accident by coupling simulations of an atmospheric dispersion model with an improved deposition scheme and oceanic dispersion model, Atmos. Chem. Phys., 2015, 15, 1029–1070 CrossRef.
- Y. Morino, T. Ohara and M. Nishizawa, Atmospheric behavior, deposition, and budget of radioactive materials from the Fukushima Daiichi nuclear power plant in March 2011, Geophys. Res. Lett., 2011, 38, L00G11 CrossRef.
- K. Saito, I. Tanihata, M. Fujiwara, T. Saito, S. Shimoura, T. Otsuka, Y. Onda, M. Hoshi, Y. Ikeuchi, F. Takahashi, N. Kinouchi, J. Saegusa, A. Seki, H. Takemiya and T. Shibata, Detailed deposition density maps constructed by large-scale soil sampling for gamma-ray emitting radioactive nuclides from the Fukushima Dai-ichi Nuclear Power Plant accident, J. Environ. Radioact., 2015, 139, 308–319 CrossRef CAS PubMed.
- H. Tsuruta, Y. Moriguchi and T. Nakajima, Dynamics of atmospheric 131I in radioactive plumes in eastern Japan immediately after the Fukushima accident by analysing published data, Sci. Rep., 2019, 9, 13240 CrossRef PubMed.
- Y. Muramatsu, H. Matsuzaki, C. Toyama and T. Ohno, Analysis of 129I in the soils of Fukushima Prefecture: preliminary reconstruction of 131I deposition related to the accident at Fukushima Daiichi Nuclear Power Plant (FDNPP), J. Environ. Radioact., 2015, 139, 344–350 CrossRef CAS PubMed.
- A. C. Chamberlain and R. C. Chadwick, Deposition of airborne radioiodine vapor, Nucleonics, 1953, 11, 22–25 CAS.
- A. C. Chamberlain, A. E. J. Eggleton, W. J. Megaw and J. B. Morris, Behaviour of iodine vapour in air, Discuss. Faraday Soc., 1960, 30, 162–169 RSC.
- A. C. Chamberlain and R. C. Chadwick, Transport of iodine from atmosphere to ground, Tellus, 1966, 18, 226–237 CrossRef CAS.
- O. Telly Bah, D. Hebert, O. Connan, L. Solier, P. Laguionie, D. Bourlès and D. Maro, Measurement and modelling of gaseous elemental iodine (I2) dry deposition velocity on grass in the environment, J. Environ. Radioact., 2020, 219, 106253 CrossRef CAS PubMed.
- A. C. Chamberlain, CXXI. Experiments on the deposition of iodine 131 vapour onto surfaces from an airstream, London, Edinburgh Dublin Philos. Mag. J. Sci., 1953, 44, 1145–1153 CrossRef CAS.
- M. D. Allen and R. D. Neff, Measurements of deposition velocity of gaseous elemental iodine on water, Health Phys., 1975, 28, 707–715 CrossRef CAS PubMed.
- N. G. Stewart and R. N. Crooks, Long-range travel of the radioactive cloud from the Accident at Windscale, Nature, 1958, 182, 627–628 CrossRef CAS.
- G. A. Sehmel, Particle and gas dry deposition: A review, Atmos. Environ., 1980, 14, 983–1011 CrossRef.
- A. Saiz-Lopez and J. M. C. Plane, Novel iodine chemistry in the marine boundary layer, Geophys. Res. Lett., 2004, 31, L04112 Search PubMed.
- A. Saiz-Lopez, J. M. C. Plane, A. R. Baker, L. J. Carpenter, R. von Glasow, J. C. Gómez Martín, G. McFiggans and R. W. Saunders, Atmospheric chemistry of iodine, Chem. Rev., 2012, 112, 1773–1804 CrossRef CAS PubMed.
- G. Katata, M. Ota, H. Terada, M. Chino and H. Nagai, Atmospheric discharge and dispersion of radionuclides during the Fukushima Dai-ichi Nuclear Power Plant accident. Part I: Source term estimation and local-scale atmospheric dispersion in early phase of the accident, J. Environ. Radioact., 2012, 109, 103–113 CrossRef CAS PubMed.
- M. L. Wesely and B. B. Hicks, Some factors that affect the deposition rates of sulfur dioxide and similar gases on vegetation, J. Air Pollut. Control Assoc., 1977, 27, 1110–1116 CrossRef CAS.
- R. C. Musselman and T. J. Minnick, Nocturnal stomatal conductance and ambient air quality standards for ozone, Atmos. Environ., 2000, 34, 719–733 CrossRef CAS.
- L. Zhang, J. R. Brook and R. Vet, A revised parameterization for gaseous dry deposition in air-quality models, Atmos. Chem. Phys., 2003, 3, 2067–2082 CrossRef CAS.
- M. L. Wesely, Parameterization of surface resistances to gaseous dry deposition in regional-scale numerical models, Atmos. Environ., 1989, 23, 1293–1304 CrossRef CAS.
- S. Kutsuna and N. Kaneyasu, Henry's law constants and hydration equilibrium constants of n-hexanal and their temperature dependence as determined by the rectangular pulse method, Chem. Eng. Sci., 2021, 239, 116639 CrossRef CAS.
- S. Kutsuna, K. Takeuchi and T. Ibusuki, Laboratory study on heterogeneous degradation of methyl chloroform (CH3CCl3) on aluminosilica clay minerals as its potential tropospheric sink, J. Geophys. Res.: Atmos., 2000, 105, 6611–6620 CrossRef CAS.
- S. Kutsuna, L. Chen, K. Nohara, K. Takeuchi and T. Ibusuki, Heterogeneous decomposition of CHF2OCH2CF3 and CHF2OCH2C2F5 over various standard aluminosilica clay minerals in air at 313 K, Environ. Sci. Technol., 2002, 36, 3118–3123 CrossRef CAS PubMed.
- S. Kutsuna, L. Chen, K. Ohno, N. Negishi, K. Takeuchi, T. Ibusuki, K. Tokuhashi and A. Sekiya, Laboratory study on heterogeneous decomposition of methyl chloroform on various standard aluminosilica clay minerals as a potential tropospheric sink, Atmos. Chem. Phys., 2003, 3, 1063–1082 CrossRef CAS.
- S. E. Fiedler, A. Hese and A. A. Ruth, Incoherent broad-band cavity-enhanced absorption spectroscopy, Chem. Phys. Lett., 2003, 371, 284–294 CrossRef CAS.
- R. A. Washenfelder, A. O. Langford, H. Fuchs and S. S. Brown, Measurement of glyoxal using an incoherent broadband cavity enhanced absorption spectrometer, Atmos. Chem. Phys., 2008, 8, 7779–7793 CrossRef CAS.
- C. Bahrini, A.-C. Grégoire, D. Obada, C. Mun and C. Fittschen, Incoherent broad-band cavity enhanced absorption spectroscopy for sensitive and rapid molecular iodine detection in the presence of aerosols and water vapour, Opt. Laser Technol., 2018, 108, 466–479 CrossRef CAS.
-
FACT (Free-Access Chemometric Toolbox) under SCILAB, https://atoms.scilab.org/toolboxes/FACT, accessed April, 2022 Search PubMed.
-
SCILAB, https://www.scilab.org, accessed April, 2022 Search PubMed.
- P. Spietz, J. Gómez Martín and J. P. Burrows, Effects of column density on I2 spectroscopy and a determination of I2 absorption cross section at 500 nm, Atmos. Chem. Phys., 2006, 6, 2177–2191 CrossRef CAS.
- H. Keller-Rudek, G. K. Moortgat, R. Sander and R. Sörensen, The MPI-Mainz UV/VIS Spectral Atlas of Gaseous Molecules of Atmospheric Interest, Earth Syst. Sci. Data, 2013, 5, 365–373 CrossRef.
- F. A. Morrissey and M. E. Grismer, Kinetics of volatile organic compound sorption/desorption on clay minerals, J. Contam. Hydrol., 1999, 36, 291–312 CrossRef CAS.
- A. E. Burgess and J. C. Davidson, Kinetics of the Rapid Reaction between Iodine and Ascorbic Acid in Aqueous Solution Using UV-Visible Absorbance and Titration by an Iodine Clock, J. Chem. Educ., 2014, 91, 300–304 CrossRef CAS.
- M. Eigen and K. Kustin, The Kinetics of Halogen Hydrolysis, J. Am. Chem. Soc., 1962, 84, 1355–1361 CrossRef CAS.
- A. Takami, T. Kondo, A. Kado and S. Koda, The uptake coefficient of I2 on various aqueous surfaces, J. Atmos. Chem., 2001, 39, 139–153 CrossRef CAS.
- W. Eguchi, M. Adachi and M. Yoneda, Dependency of partition equilibrium of iodine between air and aqueous solution containing sodium hydroxide upon temperature and concentration, J. Chem. Eng. Jpn., 1974, 6, 389–396 CrossRef.
-
C. R. Reid, J. M. Prausnitz and B. E. Poling, The Properties of Gases Ana Liquids, 5th edn, McGraw-Hill, New York, 1987 Search PubMed.
- U. Pöschl and M. Shiraiwa, Multiphase chemistry at the atmosphere–biosphere interface influencing climate and public health in the Anthropocene, Chem. Rev., 2015, 115, 4440–4475 CrossRef PubMed.
- S. K. Bhatia, F. Liu and G. Arvind, Effect of pore blockage on adsorption isotherms and dynamics: Anomalous adsorption of iodine on activated carbon, Langmuir, 2000, 16, 4001–4008 CrossRef CAS.
- W. Rudzinski and W. Plazinski, Studies of the kinetics of solute adsorption at solid/solution interfaces: On the possibility of distinguishing between the diffusional and the surface reaction kinetic models by studying the pseudo-first-order kinetics, J. Phys. Chem. C, 2007, 111, 15100–15110 CrossRef CAS.
- L. Largitte and R. Pasquier, A review of the kinetics adsorption models and their application to the adsorption of lead by an activated carbon, Chem. Eng. Res. Des., 2016, 109, 495–504 CrossRef CAS.
- D. Feng, X. Li, X. Wang, J. Li, F. Sun, Z. Sun, T. Zhang, P. Li, Y. Chen and X. Zhang, Water adsorption and its impact on the pore structure characteristics of shale clay, Appl. Clay Sci., 2018, 155, 126–138 CrossRef CAS.
- J. Koarashi, M. Atarashi-Andoh, T. Matsunaga, T. Sato, S. Nagao and H. Nagai, Factors affecting vertical distribution of Fukushima accident-derived radiocesium in soil under different land-use conditions, Sci. Total Environ., 2012, 431, 392–401 CrossRef CAS PubMed.
- K. Fujii, N. Yamaguchi, N. Imamura, M. Kobayashi, S. Kaneko and M. Takahashi, Effects of radiocesium fixation potentials on 137Cs retention in volcanic soil profiles of Fukushima forests, J. Environ. Radioact., 2019, 198, 126–134 CrossRef CAS PubMed.
|
| This journal is © The Royal Society of Chemistry 2022 |
Click here to see how this site uses Cookies. View our privacy policy here.  Open Access Article
 * and
Naoki
Kaneyasu


![[thin space (1/6-em)]](https://www.rsc.org/images/entities/char_2009.gif) :
:![[thin space (1/6-em)]](https://www.rsc.org/images/entities/char_2009.gif) 4 volume ratio) and carbon dioxide gas (CO2, 1.02% in synthetic air) were purchased from Takachiho Chemical Industrial Co., Ltd.
4 volume ratio) and carbon dioxide gas (CO2, 1.02% in synthetic air) were purchased from Takachiho Chemical Industrial Co., Ltd.
![[thin space (1/6-em)]](https://www.rsc.org/images/entities/char_2009.gif) :
:![[thin space (1/6-em)]](https://www.rsc.org/images/entities/char_2009.gif) 1)
1)![[thin space (1/6-em)]](https://www.rsc.org/images/entities/char_2009.gif) :
:![[thin space (1/6-em)]](https://www.rsc.org/images/entities/char_2009.gif) 1)
1)![[thin space (1/6-em)]](https://www.rsc.org/images/entities/char_2009.gif) :
:![[thin space (1/6-em)]](https://www.rsc.org/images/entities/char_2009.gif) 1)
1)![[thin space (1/6-em)]](https://www.rsc.org/images/entities/char_2009.gif) :
:![[thin space (1/6-em)]](https://www.rsc.org/images/entities/char_2009.gif) 1)
1)


