Chemical composition and morphological analysis of atmospheric particles from an intensive bonfire burning festival†
Received
1st April 2022
, Accepted 4th June 2022
First published on 6th June 2022
Abstract
Atmospheric particles were sampled in Rehovot, Israel during a national Lag Ba'Omer bonfire festival as a case study to investigate the physical and chemical transformations of mixed mineral dust and biomass burning (BB) aerosols. Aerosol mass spectrometry was used in situ to characterize aging and chemical evolution of BB aerosols in real time throughout the event. During this dynamic period of BB emissions, particle samples were collected for chemical imaging using spectromicroscopy techniques. Computer-controlled scanning electron microscopy with energy dispersive X-ray analysis identified multiple particle types including highly carbonaceous (54–83%) particles, aged mineral dust (1–6%), and sulfur-containing particles (17–41%). Synchrotron-based scanning transmission X-ray microscopy coupled with near edge X-ray absorption fine structure (STXM/NEXAFS) was used to assess the internal chemical heterogeneity of individual BB particles and the morphology of soot inclusions. The observed higher contribution of mixed component particles along with an increase in particle organic volume fraction suggests an atmospheric aging process, consistent with in situ measurements. An estimation method for particle component masses (i.e., organics, elemental carbon, and inorganics) inferred from STXM measurements was used to determine quantitative mixing state metrics of particles based on entropy-derived diversity measures for different periods of the BB event. In general, there was a small difference in the particle-specific diversity among the samples (Dα = 1.3–1.8). However, the disparity from the bulk population diversity observed during the intense periods was found to have high values of Dγ = 2.5–2.9, while particles collected outside of the burning event displayed lower bulk diversity of Dγ = 1.5–2.0. Quantitative methods obtained from chemical imaging measurements presented here will serve to accurately characterize the evolution of mixed BB aerosols within urban environments.
Environmental significance
The effects of atmospheric aerosols on climate include radiative effects, cloud forming propensity, and chemical reactivity. Aerosol properties are greatly influenced by particle sizes, and external and internal mixing states of their chemical components. Assessing the uncertainty projection of aerosol effects by models lacks critical particle-specific information on the composition, morphology, and spatial distribution of chemical species within individual particles. This work characterizes individual biomass burning particles using complementary spectro-microscopy techniques, which provide quantitative metrics describing composition of atmospheric particles and their aging transformations.
|
1 Introduction
Smoke from biomass burning (BB) events is one of the largest sources of atmospheric aerosols on the global scale, and therefore has prominent impact on air quality and human health.1,2 Aerosols released from BB events remain a challenge when discerning their climate impact due to their insufficient representation in current models.3 Changes in the size, composition, and chemical mixing state of BB aerosols dictate key atmospherically-relevant processes, such as the optical properties and cloud forming propensity.4,5 The particle number and mass distributions of BB aerosols are predominantly in the accumulation-mode (Dp < 1 μm).6,7 Typically, the accumulation-mode of BB aerosols is represented by 5–9% soot/elemental carbon (EC) and 12–15% of inorganic species with organic matter making up approximately 80% by mass.7,8 Reported data has shown that ∼70% of organic matter in BB aerosols composed of water soluble species such as carboxylic acids,9,10 while a fraction of sugars, alcohols, and fatty acid represent ∼30% of the organic component.11–14 Organic carbon (OC) overwhelmingly dominates the submicron BB aerosol mass, however a large variability on a per particle basis exists due to diverse range of the biofuels, burning conditions, and complex atmospheric transformation processes.7,15,16 As a result, the quantitative assessment of organic BB aerosols in field measurements poses a technical challenge that requires the utilization of complementary online and offline methods.17,18 A detailed characterization of the particle-to-particle variation of OC in BB aerosols is essential in understanding their physical and chemical properties, and thereby their broader climate relevant implications.
Methods of real-time quantification of the aerosol chemical composition include Aerodyne Aerosol Mass Spectrometer (AMS) and Single Particle Mass Spectrometry (SPMS).19–21 AMS provides bulk information and temporal evolution of organic aerosols.22 Laser desorption/ionization instruments such as SPMS can provide both volatile organics and refractory compounds.20,23,24 Complementary analysis of particles with electron microscopy coupled to microanalysis techniques allows for the assessment of individual particles including particle size and morphology while providing elemental composition information.25–32 Scanning transmission electron microscopy (STEM) and scanning electron microscopy (SEM) have been commonly used to acquire detailed images of atmospheric particles. These microscopy methods are combined with energy dispersive X-ray spectroscopy (EDX) microanalysis or electron energy loss spectroscopy (EELS) to obtain elemental information in a spatially resolved manner with the latter being more sensitive to lighter elements, while EDX has higher sensitivity for heavier elements. EELS in connection with STEM has been used to characterize carbonaceous urban particles, and showed systematic difference in the molecular structure of carbon (e.g., distinguishing between EC and OC within individual particles).33 SEM coupled with EDX has been traditionally used for the study of environmental particles providing quantitative description of elements with atomic number higher than Na and morphological information.34–38 SEM can be operated in computer-controlled mode (CCSEM), allowing for the automated measurements over large ensembles of particles.25
Synchrotron-based scanning transmission electron microscopy (STXM) coupled to near edge X-ray absorption fine structure (NEXAFS) spectroscopy provides imaging of spatially resolved chemical bonding environment and oxidative state information.39,40 Since carbon is a critical component of atmospheric aerosol, STXM/NEXAFS measurements are most commonly conducted at the carbon K-edge (278–320 eV).41 The NEXAFS spectral features are sensitive to the chemical bonding environment of carbon, and thereby provide insight on the spatial distribution and functionality of carbonaceous materials in atmospheric particles.32,37,41,42 It is also the method of choice to accompany electron microscopy techniques as it provides complementary molecular information at an individual particle basis. Therefore, the utilization of offline spectromicroscopy measurements corroborated by in situ field records provides more detailed characterization of atmospheric particles from field studies.34,43–46
Here, we performed chemical imaging analysis of individual particles to provide detailed chemical speciation of particle mixing states and investigate the heterogeneous particle structure from samples collected during an extensive national wood burning event in Israel (Lag Ba'Omer festival), which took place on 2–3 May 2018. The festival is annually celebrated and the resulting BB emissions have been shown to correlate with increased occurrence of asthma and exacerbation of chronic obstructive pulmonary disease.47 Local bonfires spawning across the country yielded significant amounts of BB aerosols with the added contribution of airborne mineral dust from a major dust storm event occurring at the same time. This episode provided unique environmental conditions for interactions between multiple aerosol types adding to the complexity of particles' mixing states. Our study aims to understand the temporal evolution of mixed BB emissions and quantify the changes in the internal structure of individual particles to aid in evaluating their impact on air quality, human health, and highly uncertain role in the climate. Particle analysis was accomplished using STXM/NEXAFS complemented with CCSEM/EDX for the detailed description of individual particle mixing states with respect to their OC, EC, inorganics, and other atmospherically relevant elemental components. Online measurements provided the size distribution and chemical composition of smoke emission to complement the spectromicroscopy analysis. Back trajectories were used to identify key meteorological events and plume transport in the region. Samples were chosen along the different phases of the BB event.
2 Methods
2.1 Sampling site and meteorological conditions
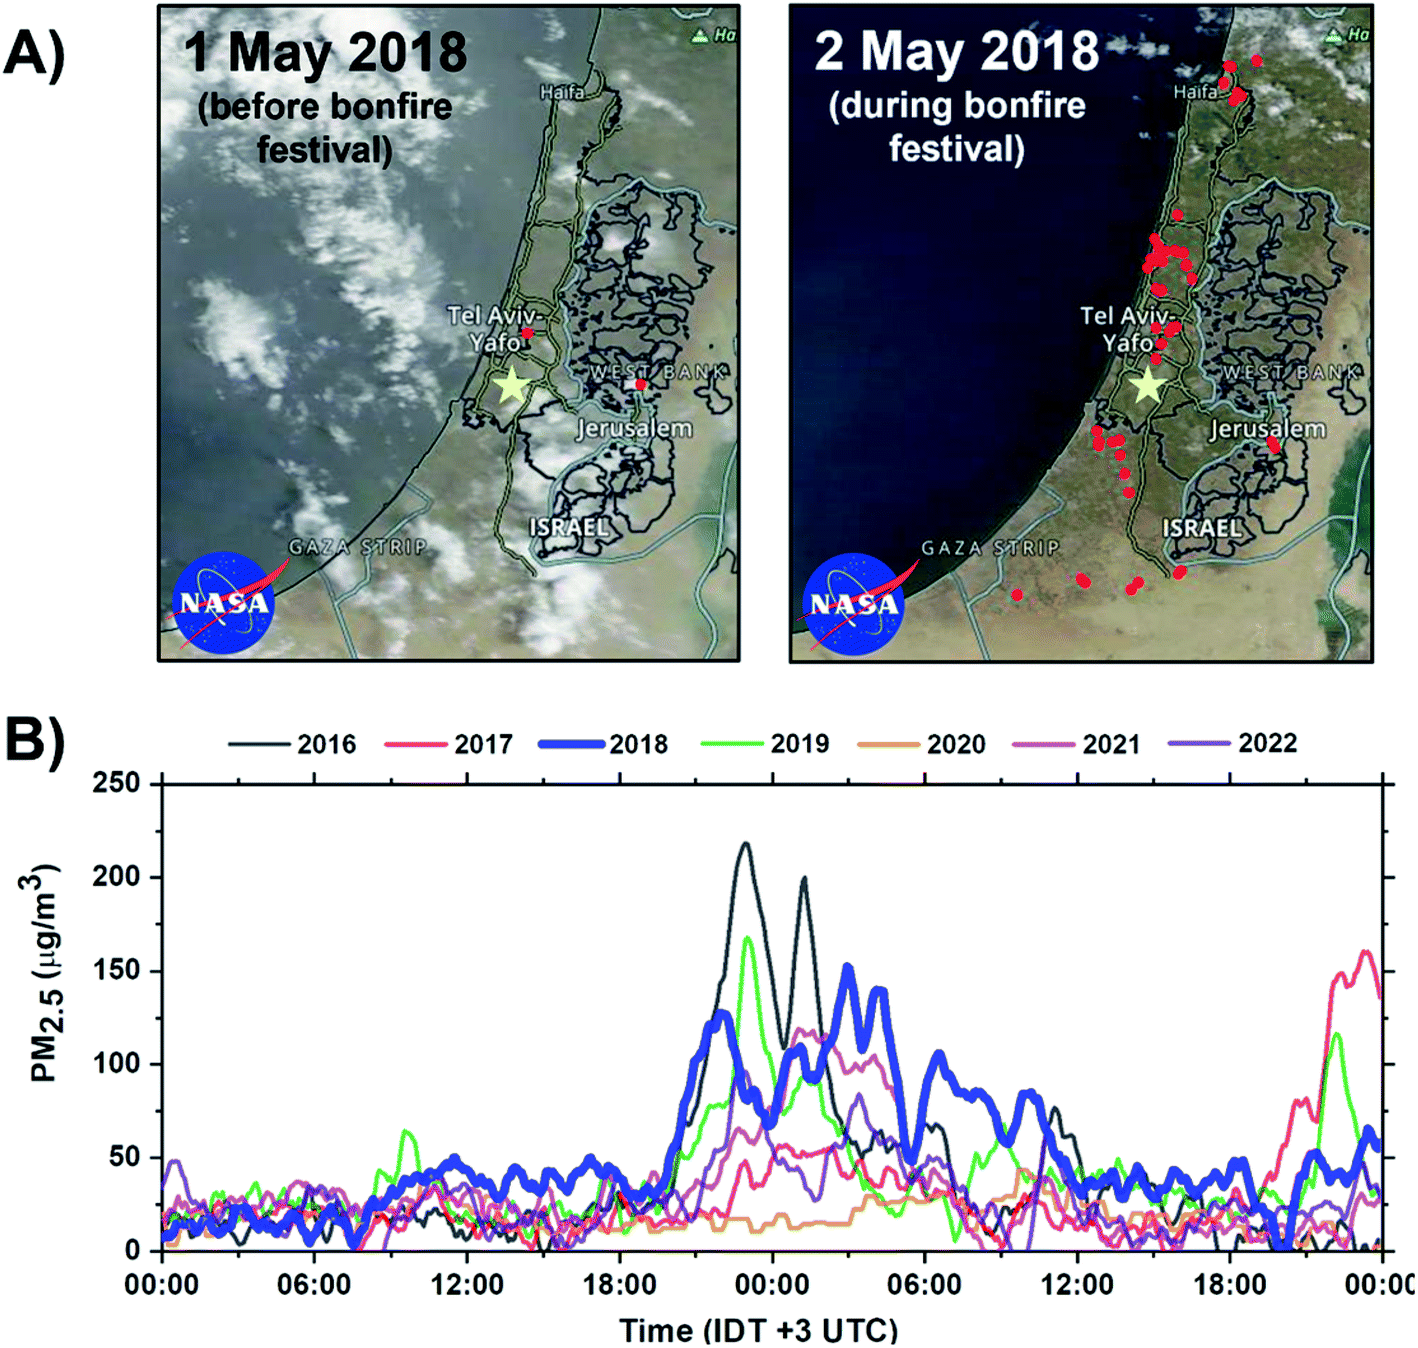
The bonfire event occurred on 2–3 May 2018. During the event, thousands of bonfires were ignited in open spaces across towns and cities of Israel. The event begins at sunset (19:22 IDT) and ends by sunrise (05:54 IDT) the next day. However, at this time, most of the fires have already been extinguished. Fig. 1A shows the frequency of the fires within 1–2 May 2018 period across Israel, visualized using Visible Infrared Imaging Radiometer Suite (VIIRS) satellite retrieval datasets.48 Approximately 54 unique thermal anomalies related to fires were identified at the peak of the bonfire festival. Fig. 1B shows PM2.5 concentrations during the Lag Ba'Omer festival events in 2016 to 2022 years acquired from air quality monitoring station located ∼7 km from the sampling site. During the 2018 event, the average PM2.5 concentration was found to average around 100 μg m−3 resulting in a 150% increase in PM2.5 emissions compared to common background level of 40 μg m−3. Of note, there is an overall decreasing trend in peak emissions during the bonfire festival between 2016 to 2022. This observed trend is a reflection of more strict regulations49,50 by the authorities and an increase in public awareness about the adverse health impact of the emissions from excessive BB burning events.51,52
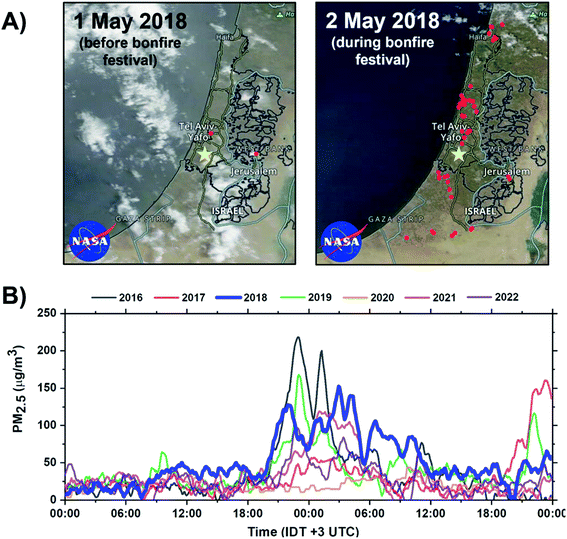 |
| | Fig. 1 Impact of Lag Ba'Omer festival in Israel. (A) Terra MODIS corrected reflectance satellite images of Israel acquired from NASA Worldview at 500 m resolution.57 Active fires before and during the 2018 sampling periods are visualized using VIIRS fire and thermal anomalies product and represented as red dots.57,58 The yellow marker corresponds to the sampling site in Rehovot, Israel. (B) Annual PM2.5 concentration during the Lag Ba'Omer festival between 2016–2022 obtained from Rishon LeTsiyon air quality monitoring station located ∼7 km from the sampling site with the relevant 2018 datasets bolded in blue.59 | |
A severe and persistent dust storm took place on 1–6 May 2018 over North Africa and Arabic Peninsula affecting several neighbouring countries including Israel (Fig. S1†) adding to a level of complexity to atmospheric particles in the region. Back trajectory calculations using Hybrid Single-Particle Lagrangian Integrated Trajectory (HYSPLIT)53,54 and MODIS Aerosol Optical Depth (AOD) measurements show plumes of high aerosol concentration near the Arabian Desert (eastern), Red Sea (southern), and Sahara Desert (western) transported to the sampling site during peak of the BB event as shown in Fig. S2.† The data for the AOD information were obtained from the Level-3 MODIS AOD measurements at 550 nm from the online resource Giovanni interface (https://giovanni.gsfc.nasa.gov/giovanni/)55 utilizing the MODIS Terra and Aqua sensor (data product: combined MODIS-Terra and -Aqua, MOD08_D3_v6.1) at 1° × 1° daily average. Additional back trajectory calculations were performed on different time periods before and at the peak of burning event (Fig. S3†). Air mass trajectories indicate that dust origin initially from the Sahara Desert followed by transportation from the Arabian Desert region during the burning event. Coupling both satellite images and trajectory calculations suggests Sharav low synoptic conditions, which are tropical depressions formed over North Africa. Typically, these conditions bring hot and dry air accompanied by dust storms from the Sahara.56 The introduction of substantial BB emissions with preceding mineral dust (MD) and influence of sea spray (SS) aerosol from the Mediterranean and Red Sea provided a unique episode, allowing us to observe the evolution and interaction of different particle types.
The aerosol measurements and sampling were continuously conducted on 2–5 May 2018 on a rooftop at Weizmann Institute of Science within an urban area in Rehovot, Israel (31°54′N, 34°48′E). Particle size distribution and number concentration were measured using a Scanning Mobility Particle Sizer (SMPS, TSI model 3080; DMA, model 3081) and condensation particle counter (CPC, model 3021 low). The particle aerodynamic diameter was acquire using an Aerodynamic Aerosol Classifier (AAC, Cambustion). The chemical composition of bulk non-refractory aerosols was characterized using a High-Resolution Time-of-Flight Aerosol Mass Spectrometer (HR-TOF-AMS, Aerodyne). In addition, ozone and PM2.5 measurements were obtained from the air quality monitoring network provided by the Ministry of Environmental Protection of Israel located near the field site. Atmospheric particles were collected by impaction using a rotating eight stage Micro-Orifice Uniform Deposit Impactor (MOUDI, MSP MOUDI 100-R). Samples for analysis were selected from two stages with cut-off aerodynamic diameters of D50 = 0.32 (stage 7) and D50 = 0.18 μm (stage 8). A set of microscopy substrates including Si3N4 window frame supported by Si wafer (Silson Ltd.) and copper 400 mesh TEM grids with carbon type-B thin film (Ted Pella, Inc.) were mounted onto stages 7 and 8. After collection, the particle samples were placed inside plastic containers, sealed with Parafilm, and stored in desiccator cabinets prior analysis. Table S1† summarizes the time periods of sample collection and the number of individual particles analyzed using complementary spectromicroscopy techniques as discussed in the following sections. Since ambient particle number concentrations were high during the burning event, we only collected at discrete times to avoid overloading the substrates.
2.2 Chemical imaging of individual particles
Size and elemental composition of individual particles were determined using CCSEM/EDX (FEI Quanta 3D, EDAX Genesis) operating at ∼480 pA beam current and 20 kV accelerating voltage.25 EDX spectra were acquired at a pre-set time of 10 s per particle to collect sufficient X-ray counts (20–2000 photons per s). The elemental concentrations are reported as the relative atomic fractions of 15 elements: C, N, O, Na, Mg, Al, Si, P, S, Cl, K, Ca, Mn, Fe, and Cu. Of note, the Cu EDX peak is influenced by the background signal copper TEM grid and the beryllium–copper alloy sample holder. Therefore, particles with high Cu contribution (≥10% Cu) were excluded from the particle classification analysis. A total of ∼26![[thin space (1/6-em)]](https://www.rsc.org/images/entities/char_2009.gif) 500 particles were analyzed during the time periods denoted in Table S1,† which represents different phases of the BB event. This allows for statistically significant representation of ambient particle population for each sample.60 Similar to our previous works, we used an unsupervised machine learning algorithm to identify particle-types based on elemental composition.34,61k-Means clustering method was applied to the CCSEM/EDX data sets combined as one input utilizing the atomic fraction from the selected elements to serve as quantitative observations in the algorithm, and then sorting them into individual cluster of the nearest mean for different samples. The square root of the atomic fraction obtained from EDX was supplied into the k-means clustering algorithm for the larger weighting of trace elements resulting in more optimal analysis.62
500 particles were analyzed during the time periods denoted in Table S1,† which represents different phases of the BB event. This allows for statistically significant representation of ambient particle population for each sample.60 Similar to our previous works, we used an unsupervised machine learning algorithm to identify particle-types based on elemental composition.34,61k-Means clustering method was applied to the CCSEM/EDX data sets combined as one input utilizing the atomic fraction from the selected elements to serve as quantitative observations in the algorithm, and then sorting them into individual cluster of the nearest mean for different samples. The square root of the atomic fraction obtained from EDX was supplied into the k-means clustering algorithm for the larger weighting of trace elements resulting in more optimal analysis.62
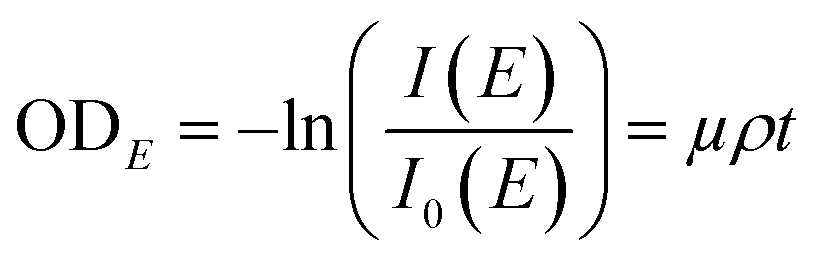
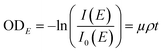
The synchrotron-based STXM/NEXAFS measurements were conducted on beamline 5.3.2.2 at the Advanced Light Source at the Lawrence Berkeley National Laboratory, Berkeley, CA. Details on instrument operation can be found in Kilcoyne et al. (2003).40 The experiments were performed at the carbon K-edge energy (278–320 eV) to probe the chemical bonding of carbon within individual particles and quantify important properties of atmospheric aerosols including OC speciation, organic volume fraction (OVF), and chemical mixing state information as shown in our previous works.32,34,41,42,61,63–65 In brief, the STXM chamber is backfilled with He and maintained at ∼500 Torr prior to data acquisition. Images were obtained at a given photon energy within the carbon K-edge by raster scanning the sample through the focal point while acquiring the transmitted X-rays. A sequence of images was collected as a function of photon energy to generate spatially resolved spectral information per pixel. The intensity of the transmitted light across different energies is converted into optical density (ODE) using the following relationship:
| |  | (1) |
where
I is the intensity of the particle regions,
I0 is the intensity of the background particle-free regions,
μ corresponds to the mass absorption coefficient,
ρ is the density, and
t is associated to the thickness of a particle. Each pixel of the STXM image contains OD information, which is used to extract pixel-size resolved individual components. An automated method to generate spatial maps of relevant aerosol components has been described in detail in Moffet
et al. (2010) and Moffet
et al. (2016).
41,66 This approach utilizes four key energies to generate “maps”, and to quantitatively examine larger number of particles resulting in improved particle population statistics while maintaining faster image acquisition. Particle maps are taken as a 15 × 15 μm fields of view with a 35 nm pixel resolution and 1 ms dwell time. Specific energies were chosen to identify and highlight atmospherically relevant components present in individual particles: 278 eV (pre-edge), 285.4 eV (C
![[double bond, length as m-dash]](https://www.rsc.org/images/entities/char_e001.gif)
C, sp
2/elemental carbon EC), 288.5 eV (–COOH, organic carbon OC), and 320 eV (post-edge). The components of individual species within particles were defined using previously established detection thresholds.
41 Of note, OD
278 eV is proportional to the number of non-carbon containing elements while OD
320 eV − OD
278 eV is equivalent to the total carbon (TC) within that region. Therefore, inorganic (IN) constituents are classified when the ratio of the pre- and post-edge absorbance is greater than 0.5 (OD
278 eV/OD
320 eV > 0.5). OC components are identified as regions with substantial contribution from the base subtracted –COOH peak at 288.5 eV (OD
288.5 eV − OD
278 eV > 0). Traditionally, carboxylic acid is used as a proxy for atmospherically relevant OC for STXM analysis.
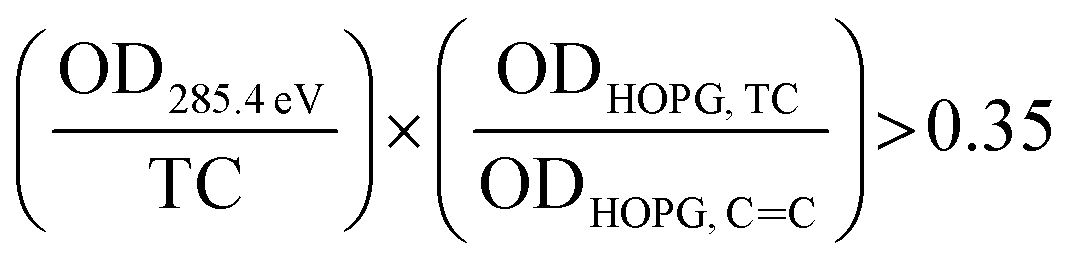
41 EC regions are defined by comparing the OD ratio of C
C and TC to the ratio of highly oriented pyrolytic graphite (HOPG) associated with soot and graphitic layers, as reported in Hopkins
et al. (2007).
63 The sp
2 hybridization is calculated for each pixel as follows:
| | 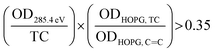 | (2) |
These components can overlap resulting in mixed components within the same pixel. In general differences in absorbance features allow for the assessment of the chemical structure of carbon containing particles.
2.3 Organic volume fraction calculations
STXM carbon maps were used to derive the OVF of individual particles. The calculations were performed based on the previously published method by Fraund et al. (2019) applied for the datasets in this work.65 Recognizing that each pixel on the image has an OD value comprising of the mixture of inorganic and organic components, we can estimate the OD contribution as a linear combination of the individual constituents of eqn (1) as discussed in O'Brien et al. (2015).67| | | OD278 eV = μ278 eV,inorgρinorgtinorg + μ278 eV,orgρorgtorg | (3) |
| | | OD320 eV = μ320 eV,inorgρinorgtinorg + μ320 eV,orgρorgtorg | (4) |
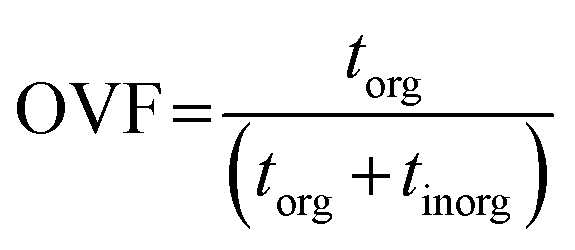
The thickness of a given pixel can then be expressed as a function of absorbance, density, and mass absorption coefficient. The mass absorption coefficient is calculated using the known elemental composition and cross section derived from Henke tables.68 This allows us to calculate OVF from the relative optical thickness of the organic component (torg) with respect to the total optical thickness of the particle (torg + tinorg) as follows,65
| | 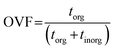 | (5) |
This approach requires a priori knowledge for the inorganic and organic constituents. For this work, we used ammonium sulfate ((NH4)2SO4) as the inorganic component based on the observations from CCSEM/EDX analysis and from AMS, while adipic acid ((CH2)4(COOH)2) was used as a proxy for the organic component. Adipic acid is also preferred due to a higher O/C ratio of around 0.7, which can be used as an indicator for aged organic aerosols.69
2.4 Component mass calculation and entropy metrics for mixing state parameterization
The framework for generating quantitative metrics of particle mixing state is discussed in Riemer and West (2013) utilizing mass fractions and diversity parameters,70 and adopted for STXM application by Fraund et al. (2017) as described here.42 First, the volume of the organic component (Vorg) is obtained by taking the sum of torg of each pixel (n) over the pixel area (Apx) of the entire particle and then converted to mass as follows,65| | 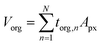 | (6) |
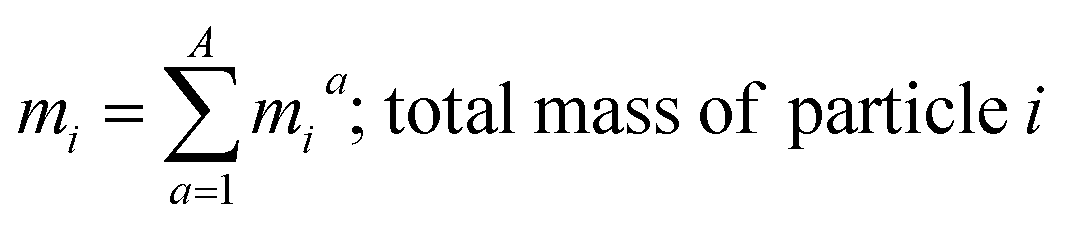
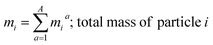
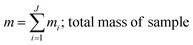
where, morg is the mass of the OC component and dorg is the density of the OC component. The mass of IN and EC regions is also obtained following the same scheme. Then obtained mass fractions of individual component allows for mixing state parameterization. The mass of a component (a) in a particle (i) is defined as mia, where a = 1, …, A (number of components) and i = 1, …, J (number of particles in the population). Therefore, metric for mass descriptions include,| | | mia; mass of component a in particle i | (8) |
| |  | (9) |
| |  | (10) |
| |  | (11) |
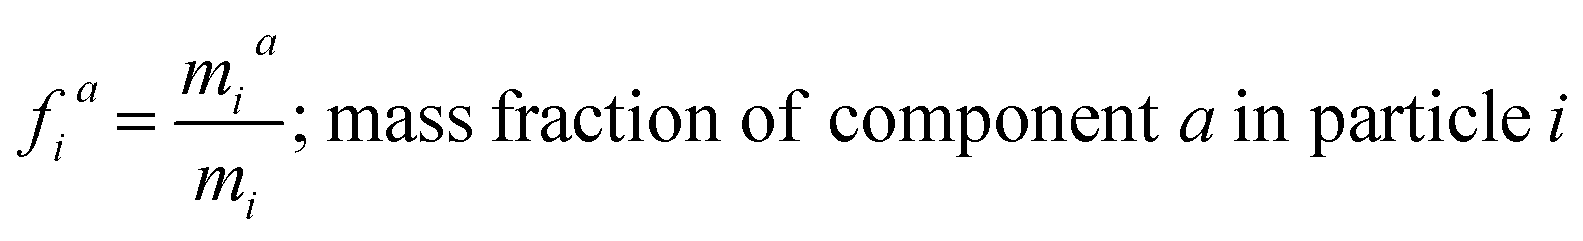
and the mass fractions are denoted as,| | 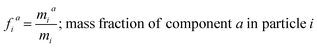 | (12) |
| |  | (13) |
| |  | (14) |
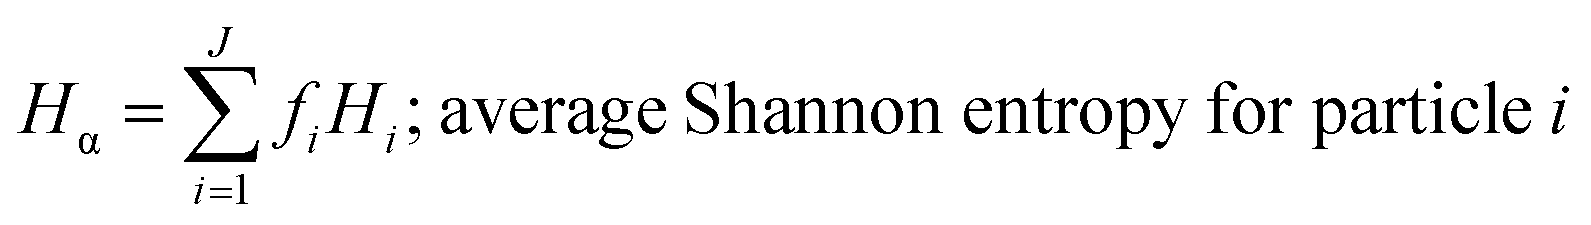
These mass fraction descriptions are then used to calculate Shannon entropy-derived diversity parameters from individual components (Hi), particle (Hα), and bulk population (Hγ). Detailed description of aerosol mixing state entropy are discussed in Riemer and West (2013),70
| |  | (15) |
| |  | (16) |
| |  | (17) |
Shannon entropy is used as a metric to measure the extent at which data is spread, also referred to as a probability distribution. It is also used to quantify the amount of information held for a given particle. High entropy data can be thought of as the spread of information leading to higher variability among the data while a low entropy suggests that the data is converging into a single value leading to a more predictable pattern.70 Similarly, by treating the component mass fractions as a probability distribution, the different components within individual particles and extend it to the entire population are used to define entropy and diversity parameters of,
| | | Di = eHi; number of components in particle i | (18) |
| | | Dα = eHα; average number of components in particle i | (19) |
| | | Dγ = eHγ; number of components in the sample | (20) |
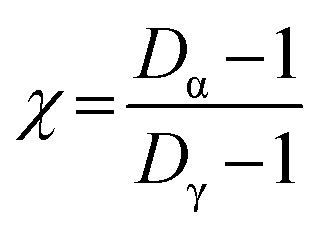
Conceptually, both Shannon entropy (Hi) and diversity (Di) are analogous and hold the same information. However, diversity reports the effective number of components to quantify aerosol chemical mixing state. For example, the range of possible values for Di can be between Di = 1 (suggesting the particle only has a single component) to Di = A (indicating equal distribution of all A components for a given particle). This definition can be extended to the average number of components present within individual particles (Dα) and to the total number of components in the sample (Dγ). These population diversity parameters are then used to generate the mixing state index (χ), which is an effective parameter that describes how representative the individual particle composition is relative to the bulk particle population.
| |  | (21) |
3 Results and discussion
3.1 Physical and chemical evolution of biomass burning aerosols
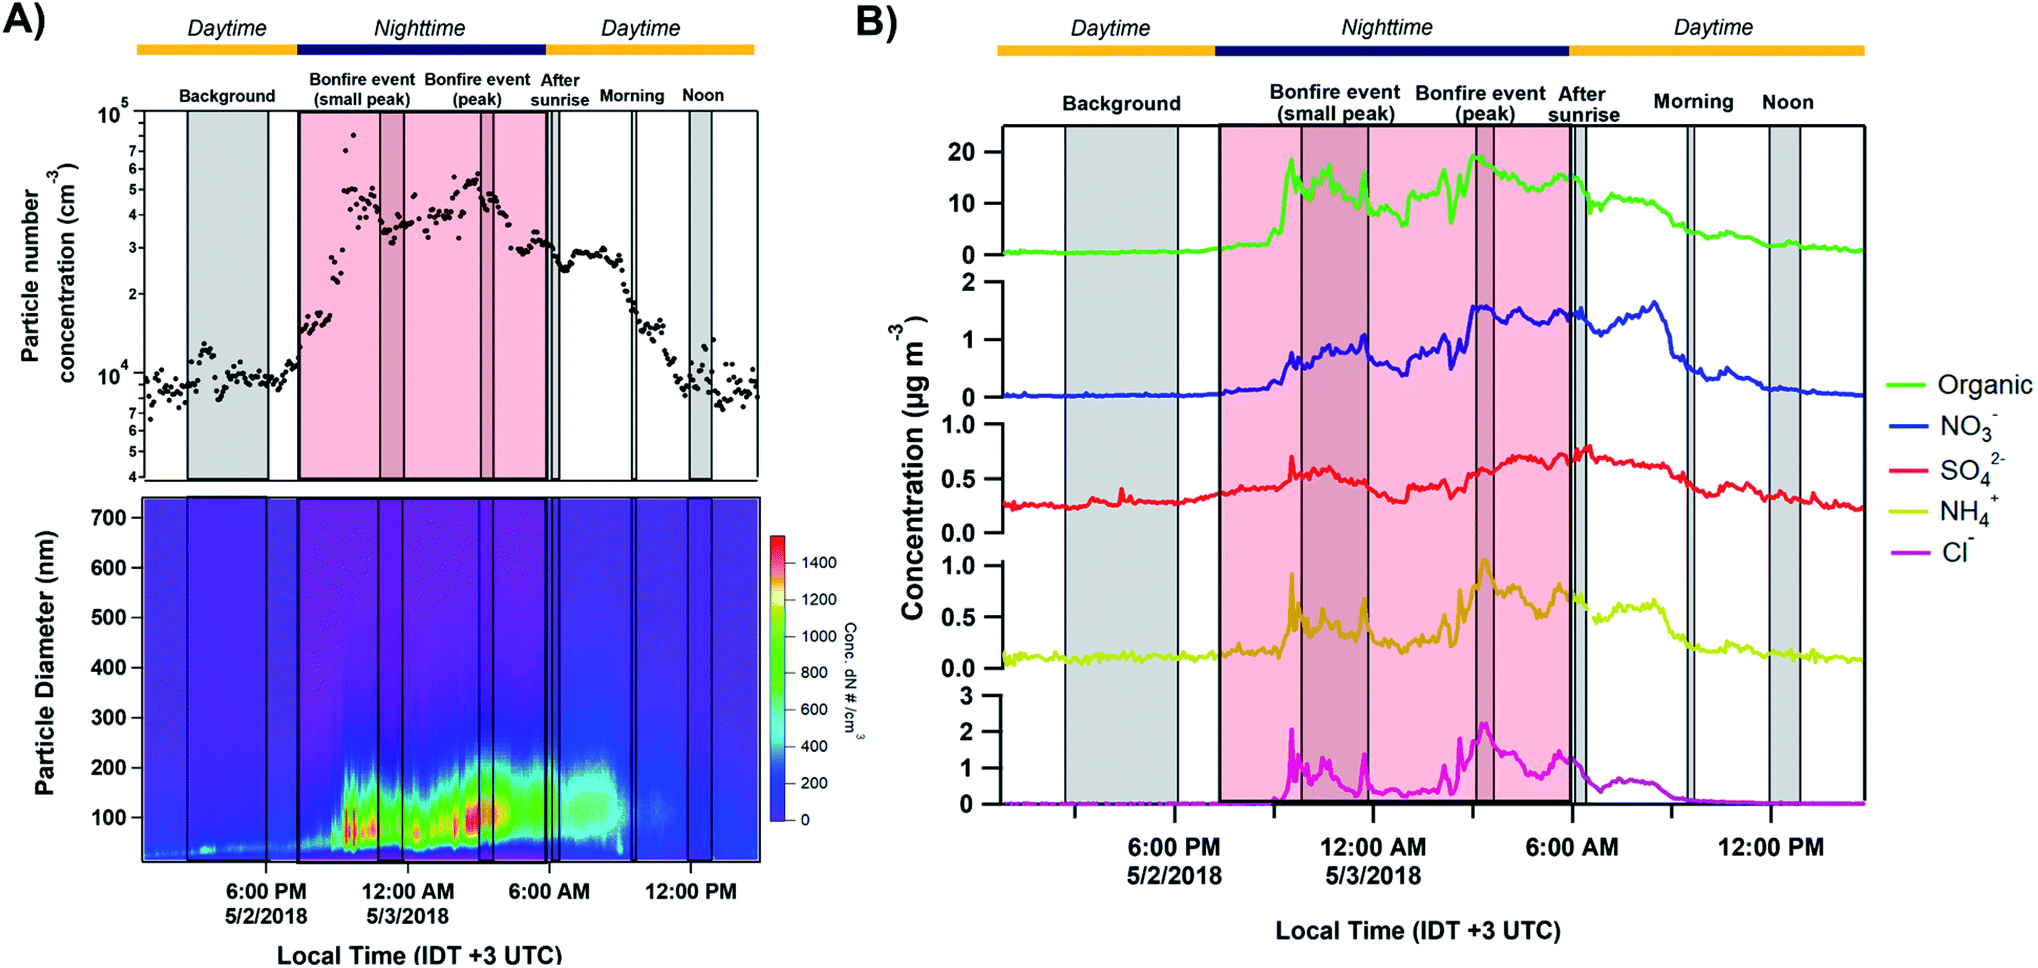
Fig. 2A shows the total number concentration and size distributions measured by the SMPS during the sampling period. The gradual increase in the mobility diameter a few hours after the first fires were ignited is largely attributed to immediate aging processes such as coagulation of fresh emitted, condensation processes of gas to particle conversion.7 The continuous change in the size of BB aerosols over time has been well documented and widely observed in previous laboratory and field studies.7,71,72 The full timeline of particle growth in the region between 2 and 5 May 2018 is shown in Fig. S4.† AMS time series, shown in Fig. 2B, illustrate the build-up of non-refractory compounds during the event period with around a 20-fold increase in organics concentration during the peak burning period, and settle the following morning as the fires are extinguished. Interestingly, a slight increase in the size distribution and non-refractory compounds is observed in the following morning of May 3 between 06:00–09:00. The accumulation of volatile organic compounds (VOCs) released from the BB event the night prior likely resulted in the formation of secondary organic aerosols (SOA), and an increase in the particle number concentration following oxidation processes through ozone or ˙NO3 pathways.7,72,73 Following Fig. 3A, the accumulation of ozone in the morning and OH˙-initiated photooxidation of VOCs producing semi/low-volatile compounds that then partitioned into the condensed phase. We also observed substantial oxygenated organics throughout the sampling period as illustrated in Fig. S5A.† Previous works have reported similar observations following an increase in secondary organics and nitrated products relating to the aging process of BB aerosols, and not from a different emission source.71,74,75
 |
| | Fig. 2 Particle mobility size and number distribution measured by SMPS/CPC along with particle chemical composition from AMS between 12:50 IDT 2 May to 14:40 IDT 3 May 2018 (before, during, and after bonfire event). (A) From top to bottom plots: temporal variation of absolute particle number concentrations and particle size number distributions. (B) Time-resolved concentration series (local IDT time) of non-refractory organics, nitrates, sulfates, ammonium, and chlorine. The grey shaded regions corresponding to the MOUDI sampling time periods while the red shaded region shows the time period of the Lag Ba'Omer bonfire festival. The daytime (yellow line) and nighttime (dark blue line) cycle is also shown above. | |
 |
| | Fig. 3 (A) Comparison of the normalized size distributions with respect to the particulate organics and ozone concentrations. Red dots indicate peak values of particle size in distribution. The grey shaded regions corresponding to the MOUDI sampling time periods while the red shaded region shows the time period of the Lag Ba'Omer bonfire festival. The daytime (yellow line) and nighttime (dark blue line) cycle is also shown above. The daytime (yellow line) and nighttime (dark blue line) cycle is shown above. (B) Top – triangle plot of f44(CO2+) as a function of f43(C2H3O+) between 12:00 2 May to 00:00 5 May 2018 with the grey dashed lines corresponding to ambient observation from Ng et al. (2010).76 (C) Van Krevelen diagram of elemental ratio (H/C vs. O/C) from organic aerosols measured by AMS. The grey solid lines represent threshold ratios for arbitrary organic functionalities. The red arrows on the color scale indicate the peak burning period. | |
The presence of aged BB aerosols was assessed by observing AMS-identified mass fragments at m/z 43 (mainly C2H3O+ ion) and m/z 44 (dominated by CO2+ ion), which have been previously used to represent the extent of oxidation for organic aerosols.76,77 We also used m/z 60 (C4H4O2+ ion, levoglucosan) as a marker for primary BB aerosols to help characterize its temporal evolution.7 The total organic mass concentration were compared against m/z 60 (f60) for levoglucosan in Fig. S6A.† The clear build-up in f60 on 2 May 2018 agrees with emissions from the burning event. This is followed by the sharp decrease around 06:00 3 May 2018 suggesting photodegradation of primary emissions. Furthermore, the contribution of m/z 43 to the total organic aerosol signal (f43) increases for less oxidized components.76 In contrast, higher fraction of m/z 44 signal to the total organic aerosol signal (f44) suggests larger contribution of oxygen-containing functional groups.78,79 Of note, f44 can be used as an indicator for photochemical aging.78,80,81Fig. 3B shows f44 as a function of f43 measured between 12:00 2 May to 00:00 5 May 2018. Ng et al. (2010) suggested distinct regions of the triangle plot based on ambient observation with fresh organics (i.e., less oxidized) trend towards the lower-right region of the triangle, while aged organics (i.e., more photochemically processed organics) tend to group around the upper-left side of the triangle.76 In general, we observe stable f43 throughout the sampling period implying that the organic aerosols detected have similar source and oxidation state. The decrease in f44 during fresh BB emissions followed by the sudden increase in the following morning occurred due to daytime photooxidation as illustrated in Fig. S6B.† Furthermore, we can parameterize the organic atomic H/C and O/C as a Van Krevelen diagram as shown in Fig. 3C. Van Krevelen space provides the description for atmospheric aging by the observing the change in carbon functionality represented by the variability in the slope (e.g., m = 0, –CH2 to –C–OH/R–O–O–R; m = −1, addition of –COOH; m = −2, –CH2 to –CO).82 The timeline of BB aerosols oxidation is observed with the decrease in H/C along with an increase in O/C in Van Krevelen space following a slope between −1 and −2. H/C, O/C, and N/C follow a diurnal pattern prior except for S/C which remained constant as shown in Fig. S5B.† The oxidation of ambient organic aerosols during the daytime is induced by daytime oxidation processes leading to a decrease in H/C contribution and increase in O/C during the day, which is most pronounced on the following morning after the BB event. We also observed a similar trend in N/C during the day suggesting an increase in nitrogen content. Previous studies have shown the dependence of organic aerosol composition on OH˙ exposure while under high NOx conditions, can lead to the formation of secondary nitrated organics during daytime.83,84 In general, the composition of ambient organic aerosols start to become chemically similar over time with the clustering of data points after the BB period between 06:00 4 May and 00:00 5 May 2018.
3.2 Particle-type classification using elemental microanalysis of individual particles
AMS data is complemented with the individual particle information which plays an important role in assessing atmospherically relevant physicochemical properties such as optical and hygroscopic properties.32,85 The compositional analysis at an individual particle basis provides enhanced metrics for single particle functionality and reactivity. Aged atmospheric particles have multicomponent chemical composition within individual particles (i.e., internal mixing) and among the particle population (i.e., external mixing).27,85,86 The complexity of aerosol composition becomes more prominent when different types of aerosols are introduced to result in more externally mixed state, while atmospheric aging processes or the inclusion of a dominant aerosol type lead to internally mixed populations.85
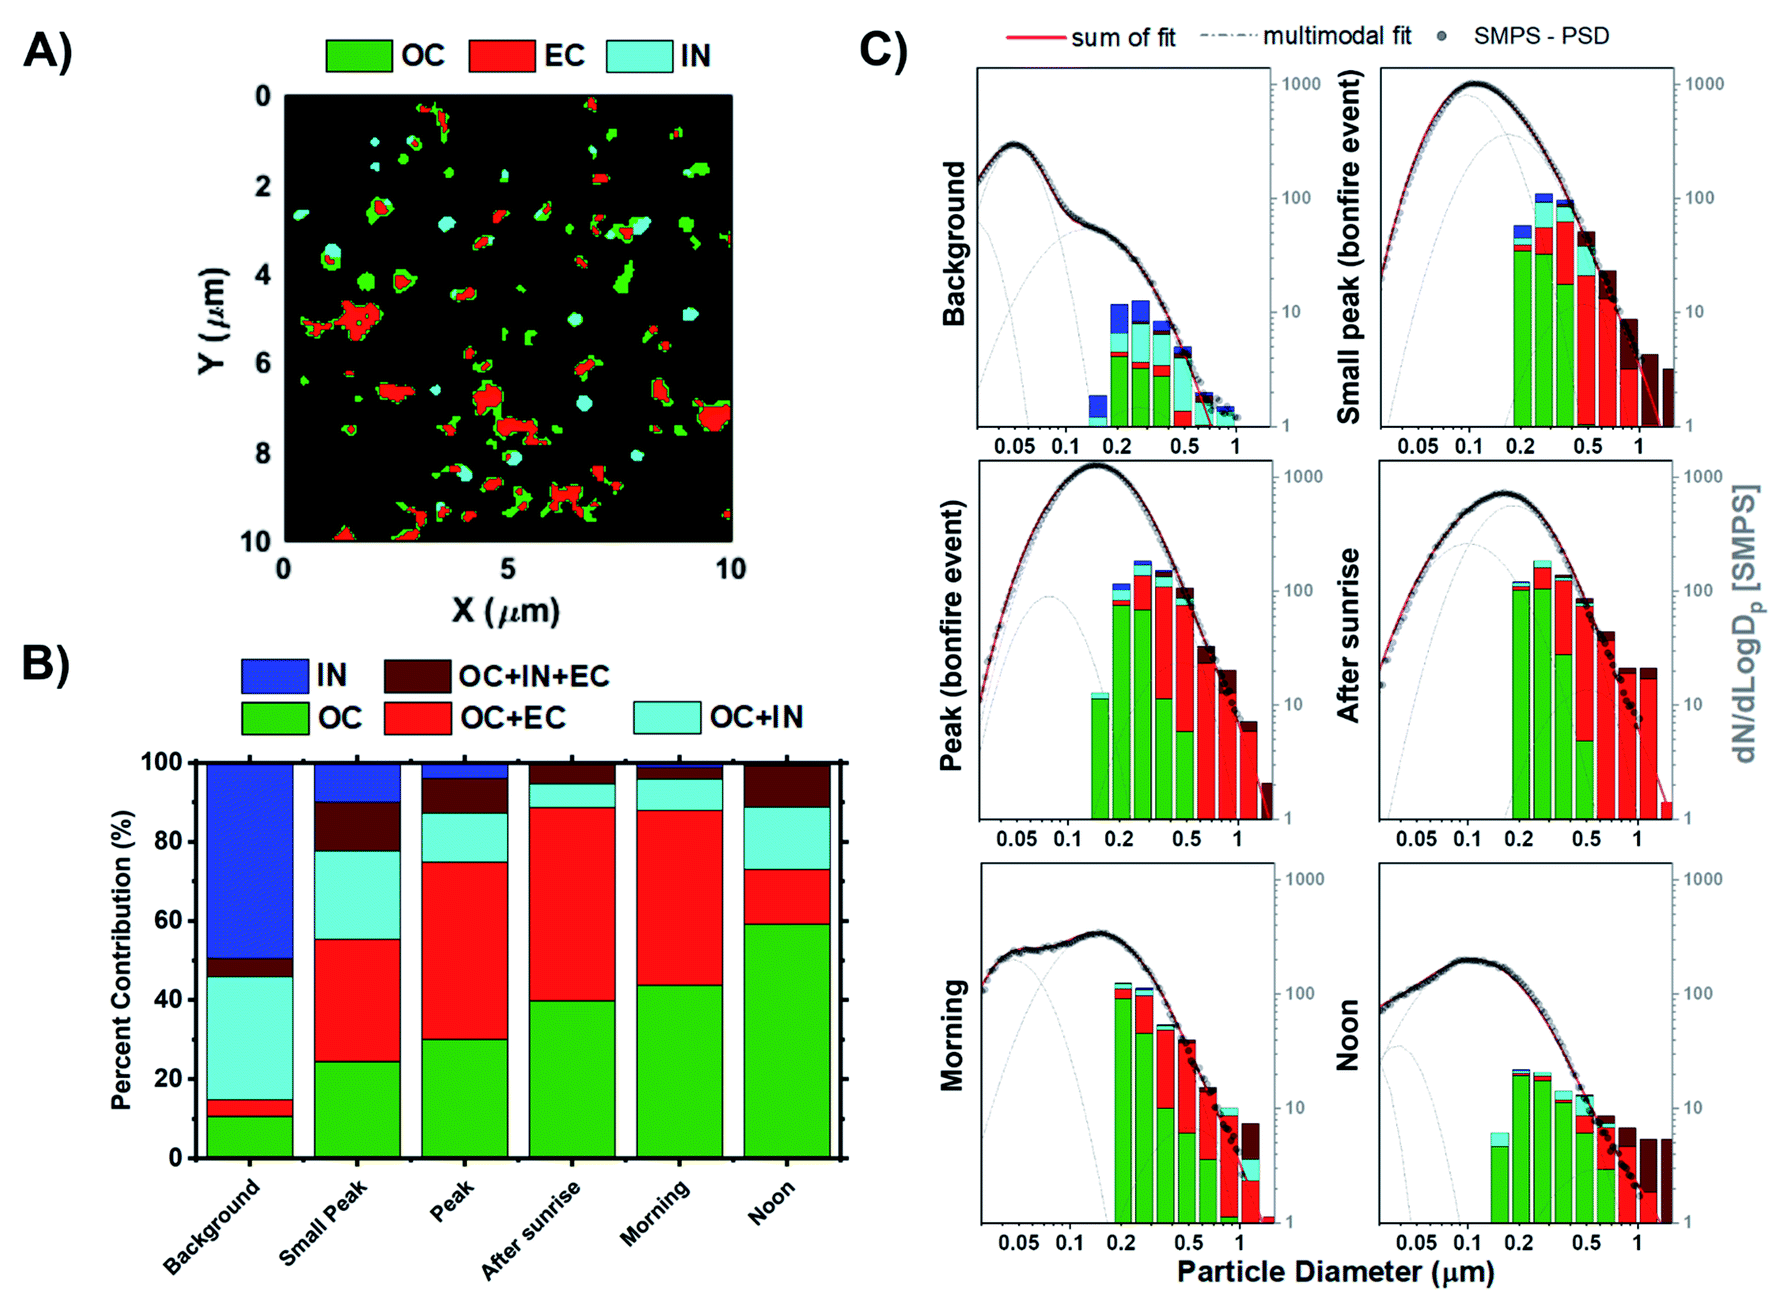
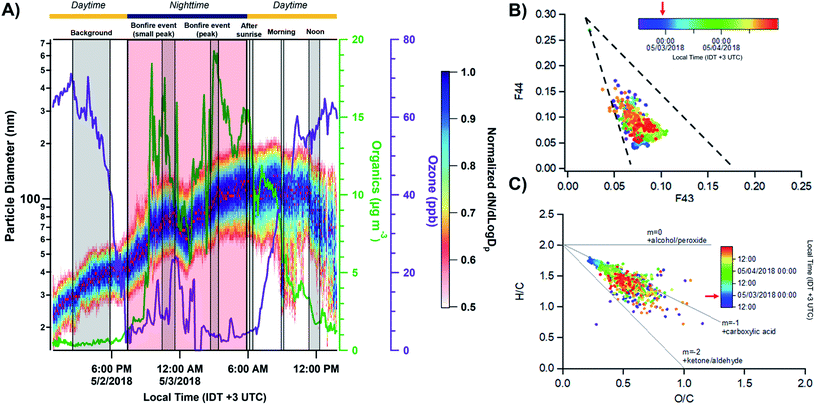
The elemental composition of aged BB particles is characterized using CCSEM/EDX, providing statistically significant number of analyzed particles, inorganic fraction at an elemental level, and relevant size ranges among particle types. The CCSEM/EDX results captured heavy influence of organic particles among the aerosol population. Henceforth, the discussion of particle size determined by CCSEM will be in the context of the Area Equivalent Diameter (AED), which corresponds to the diameter of a fitted circle equal to the particle's 2D projection area. For this study, the size distribution derived from spectromicroscopy measurements are anchored at 0.50 μm to facilitate visual comparison with the SMPS results and provide an estimation of the representative chemical composition of particles during different periods of the BB event. Of note, there are systematic differences between the AED and SMPS sizes which need to be considered for interpreting these comparisons. Microscopy methods have a tendency to overestimate particle sizes due to the nature of particle collection causing particles to flatten upon impact with substrates.7 Considering that, we estimated the aerodynamic diameter from the SMPS mobility diameters to facilitate comparison with the AED distributions. The conversion of mobility into aerodynamic diameters requires a correction utilizing the particle dynamic shape factors, settling velocity, and density.87 This work does not aim to measure those parameters for conversion. Rather, we only applied the particle density which is measured to be around 1.4 g cm−3 during the burning period (see Fig. S7†).
Fig. 4A shows the size resolved particle-type allocation of ∼14950 particles for stage 7 samples classified by k-means clustering. The machine learning algorithm identified five different particle types that are defined based on the average elemental fractions illustrated in Fig. 4B. Of note, Fig. 4B does not include the contribution of Cu due to the signal interference with the beryllium–copper alloy sample holder. These particle types can be discussed along the lines of three broader groups including organics, mineral dust, and sulfur-containing particles. The class of “carbon dominated” is mainly composed of C, N, and O and appears to be the primary particle-type identified by k-means, contributing between 54–83% throughout the sampling period. This group is a mixture of ambient SOA and organics released from BB. Clusters associated with dust particles is termed “Aged mineral dust”, which contains varying degrees of common mineral elements Mg, Al, Si, Ca, Mn, and Fe. The presence of Na could be attributed to internal mixing with sea salt, BB emissions, or potentially naturally occurring Na within dust components, as suggested by back trajectory calculation originating inland.88,94,95 Interestingly, the observed depletion of Cl (<0.5%) is likely due to the reactivity with inorganic and organic acids producing gaseous HCl.88 Furthermore, the minimal contribution of Ca in this cluster can be indicative to the aging of mineral dust aerosols since the rate of loss of carbonate mineral is greater than metal oxides.89 Mineral dust accounts between 1–6% of the observed particle population. Sulfur-containing particles were identified within three distinct clusters contributing between 17–41%: “Sulfur dominated”, “K/S dominated”, and “Mixed carbon + K/S”. The “Sulfur dominated” relates to ammonium sulfate origin while “K/S dominated” contains significant fractions of C, N, O, K, S and is known to be related to BB sources.63 Fresh BB emissions release potassium salts in the form of potassium chlorides that can react with gaseous inorganic acids resulting in the formation of potassium sulfate and potassium nitrates during atmospheric aging processes.90–93 “Mixed carbon + K/S” had the second largest contribution to the particle-type population ranging between 4–23%. This cluster displayed the same elements as the “K/S dominated” while having a lower K and S contribution. Overall, the external particle mixing remains to be similar throughout the BB period with only a stark difference between the background case with the larger contribution of “Sulfur dominated” particles compared to the start of the BB event. In addition, the distribution of particle-types observed for the samples from stage 8 were consistent with those from stage 7, as illustrated in Fig. S8.† However, stage 8 samples have larger contributions of particles <0.3 μm consistent with its lower cut-off size.
 |
| | Fig. 4 (A) Size resolved particle-type classification obtained from CCSEM/EDX analysis and identified by k-means clustering analysis plotted as a 16 bin per decade histogram in logscale for different sampling periods of BB event. Black markers represent the average SMPS aerosol size distribution measured during the sampling periods. The SMPS distributions were superimposed and anchored at 0.50 μm to provide a qualitative visual comparison of particle size distribution and external mixing state. Multimodal lognormal fits were applied to the SMPS particle size distribution. Grey dashed lines correspond to the single-mode lognormal fits while the red solid line is the sum of the fits. (B) Cluster-average elemental contribution (log scale) for each identified particle-type applied to all particle samples. Black dashed line corresponds to 0.5% elemental fraction. | |
3.3 Assessment of internal heterogeneity and morphology of individual particles
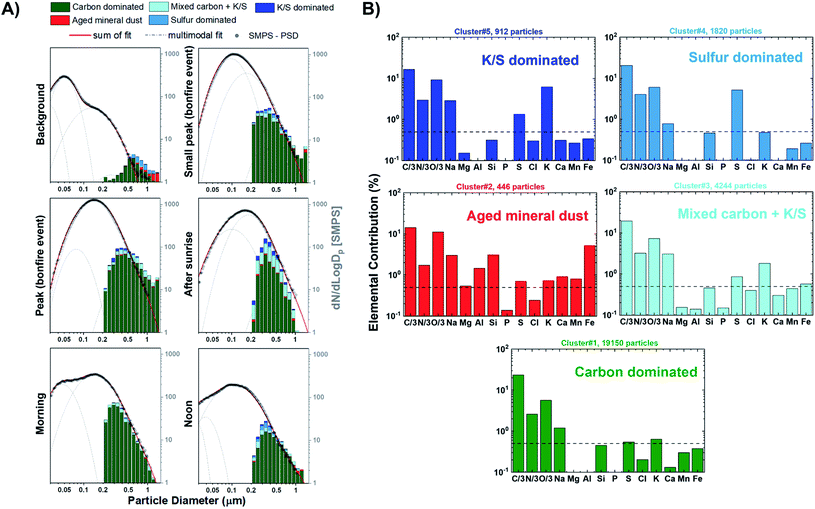
STXM/NEXAFS measurements were used to probe carbon chemical bonding within individual particles and assess their internal chemical structure. The arrangement of organic constituents, especially OC versus EC, plays an important role in influencing both the optical and hygroscopic properties of particles.85 The representative STXM carbon speciation map in Fig. 5A illustrates the assortment of particle morphologies and the complexity of particle internal heterogeneity. Absorption data acquired for the composition maps at the carbon K-edge is separated into three components based on the spectral characteristics and applied threshold definitions, whereby each pixel can contain up to three components:41 OC (green), EC (red), and IN (teal). If a portion of the composition map contains more than one or multiple components, then the particle will be assigned to one of the following categories: (1) OC, (2) IN, (3) OCEC, (4) OCIN, (5) OCINEC. The mixing state definitions derived from STXM/NEXAFS measurements are the same as those introduced by Moffet et al. (2010),41 which were also applied in our previous works.34,42,96–99Fig. 5B shows the fractions of particle chemical mixing states for each of the sampling periods derived from the cumulative carbon component maps from Fig. S9.†Fig. 5C presents the same datasets as Fig. 5B but presented as a size-resolved chemical mixing state expressed as fractions of particle mixing state for each bin. In general, we see substantial contribution of IN prior to the BB event, which corresponds to non-carbonaceous elements. These observations are consistent with the CCSEM/EDX measurements. Of note, due to the limitation in data acquisition at the carbon K-edge energy, we can only infer presence of non-carbonaceous elements that correspond to observed particle-types including sea spray aerosols, mineral dust, and sulfur-containing particles. The subsequent change in the distribution of particle internal heterogeneity reflects the process of OC build-up, followed by the mixing with EC due to atmospheric aging processes. Of note, the lack in contribution of fresh EC particles is due to the limitation in the stage 7 cut-off size (D50 = 0.32 μm), which suggest that freshly emitted EC particles (typically Dm = ∼150 nm)100 generated in the earlier periods would not be efficiently collected. For this reason, only aged EC particles with sufficient OC coating can be sampled in stage 7 due to an increase in particle size. Interestingly, it appears that OC frequently mixes with EC rather than with IN. However, this could be attributed to the lack of observed submicron IN particles during peak burning period. In turn, there is also a minimal fraction of OCINEC particles. Nevertheless, the clear evolution of particle mixing state and the systematic increase in OC and OCEC contribution is observed as a function of time, consistent with previous field studies.66,101 The only exception is for the noon samples from the following day being dominated by homogeneous OC particles (∼60% fraction). This observation is most likely due to the post combustion smouldering phase and peak photochemical processing.71,102–104
 |
| | Fig. 5 Chemical mixing state of individual particles from stage 7. (A) Representative carbon speciation map derived from STXM/NEXAFS images. Colors correspond to experimentally defined chemical components; green – organics (OC), red – soot/elemental carbon (EC), and teal – inorganics (IN). Note that each pixel can contain up to three components resulting in overlapping colors. (B) Fractions of internally mixed particles at different sampling periods. (C) Distribution of analyzed particles measured by STXM/NEXAFS shown as an 8 bin per decade histogram in logscale to compare the chemical mixing state across different periods of the BB event. Black markers correspond to the particle size distribution from SMPS measurements anchored at 0.50 μm to facilitate a visual comparison. Lognormal fits were applied to the SMPS particle size distribution measurements. Grey dashed line corresponds to the single mode lognormal fits while the red solid line is the sum of the fits. | |
Atmospheric aging of EC particles results in considerable structural change from a fractal dimension to a more compact morphology.105,106 The irregular geometry of fresh EC agglomerates provides active sites for the deposition of water and organic species resulting in the subsequent collapse of the EC fractal structures.107 This process has been experimentally observed and found that the introduction of sulfuric acid and oxidative species (e.g., OH˙, O3. HNO3) can enhance this structural rearrangement.106,108 Here, we quantified the EC morphology within individual particles by utilizing the carbon STXM maps and calculating the particle morphology eccentricity.66 Eccentricity (e) is a parameter that describes the extent of circularity. Values of e are calculated from the best fit ellipse applied around an EC inclusion and minimizing the minor and major axis of the corresponding ellipse. e is then calculated as e = c/a, where c is the distance from the center to the foci and a is the distance from the center to the major axis vertex as shown in Fig. S10.† Therefore, e is measured between 0 and 1 for an ellipse. Circular shape corresponds to e ≈ 0, while e ≈ 1 if the ellipse is elongated (i.e., oval shape). This allows for the quantification of the compactness of EC inclusions, as shown in Fig. S10.† In general, the majority of EC particles have an e ≈ 0.8 and found little variability among analyzed EC across different periods of the event. This suggests that the EC particles retained their elongated and fractal morphology within the window of BB sampling.
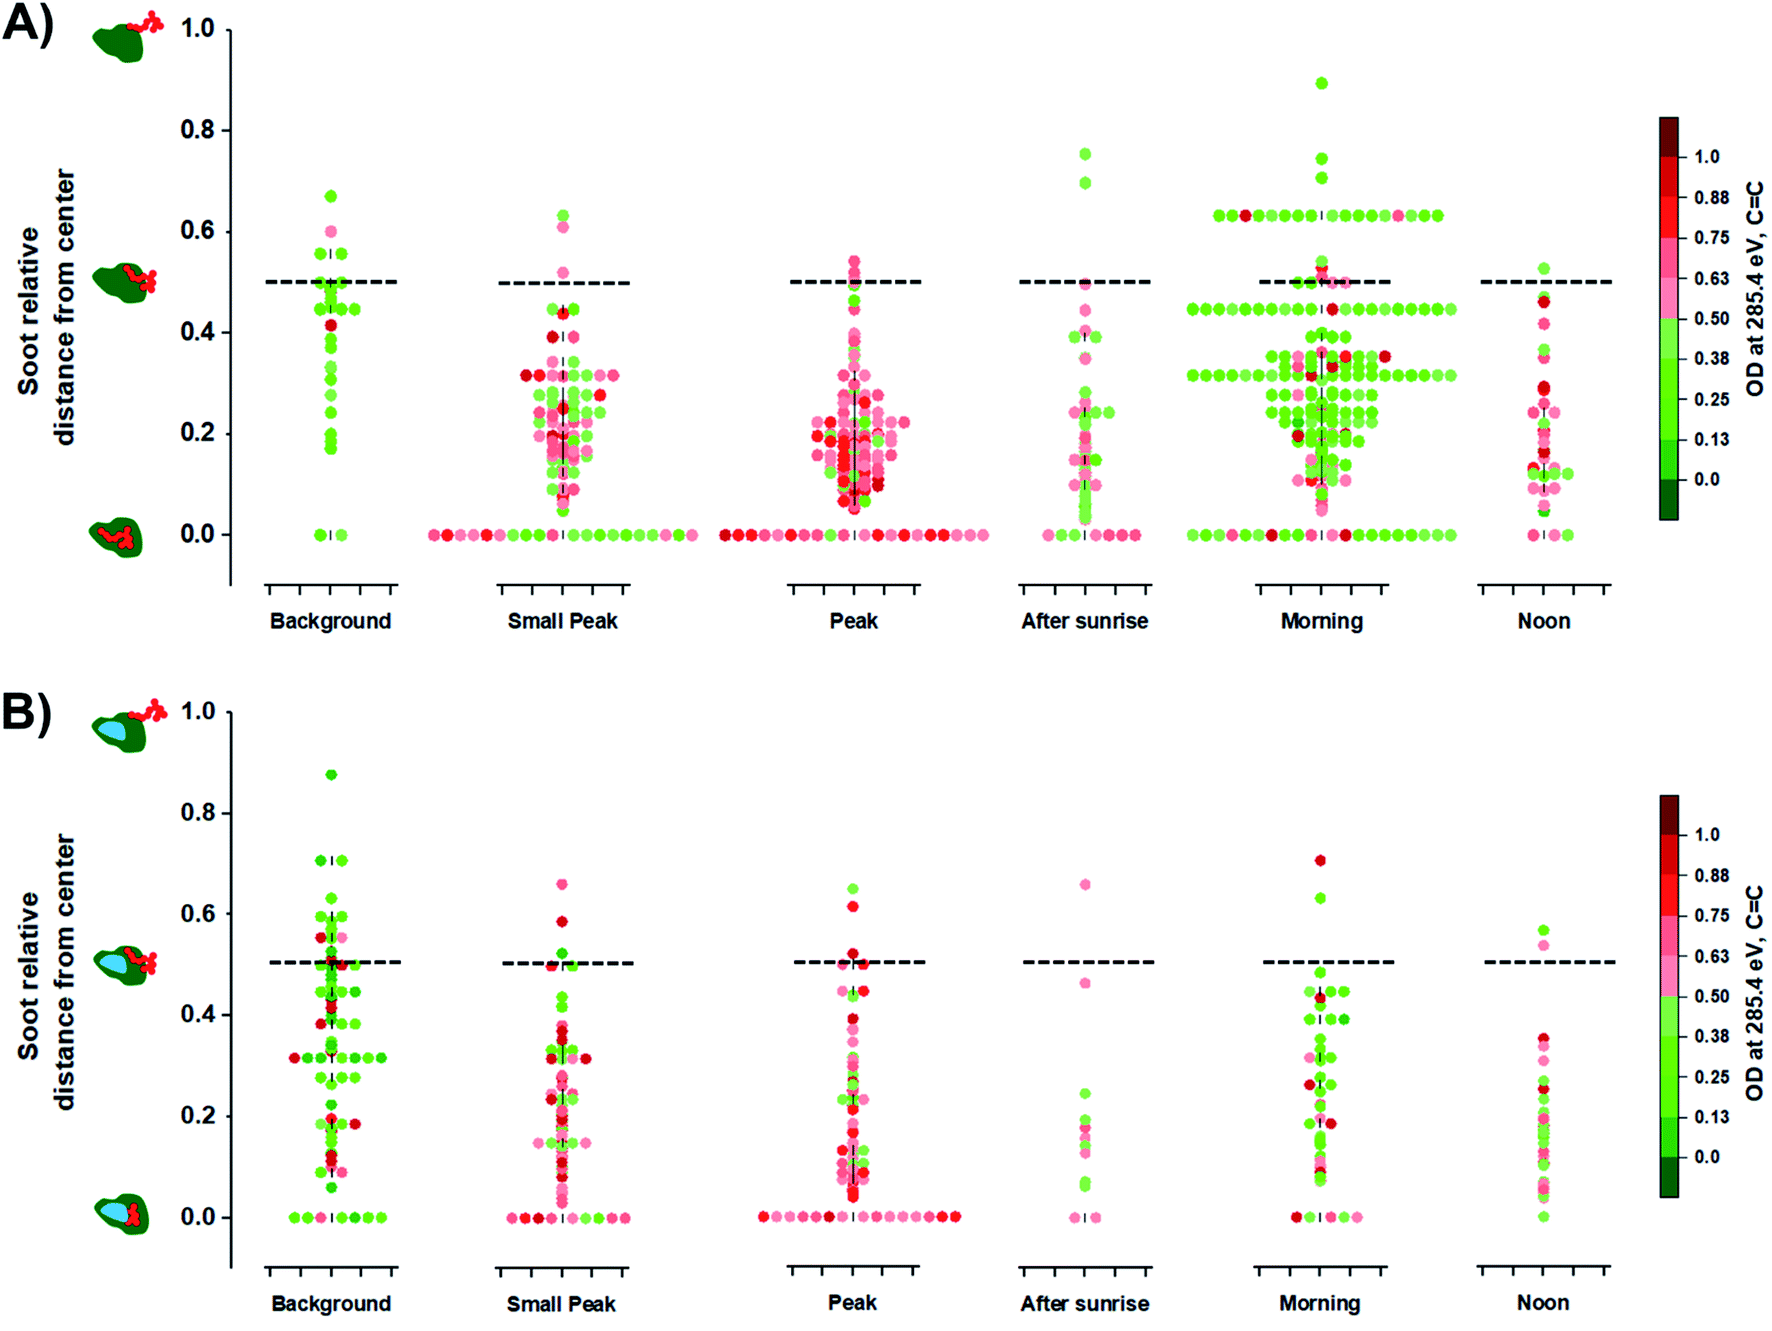
The optical properties of EC containing particles are influenced by the location of the soot within the entire particle such as in the center or on the surface.109,110 Moffet et al. (2016) identified the position of soot/EC from STXM measurements.66 Briefly, the distance of soot/EC components from the center (REC) were calculated relative to the longest distance between the center to the edge of the entire host particle (Rmax). Therefore, this relationship can be expressed as the ratio between the two relative distances, REC/Rmax, which vary between 0 and 1 regardless of particle size. The value of 0 for the soot relative distance from center suggests that the EC components is in the center core, while a value of 1 suggests that the EC component is at the surface of the host particle. Fig. 6 illustrates the distribution of EC inclusions within their respective host particle for OCEC and OCINEC during the BB period while also showing intensity of OD285.4 eV, values which are associated with the CC absorbance. At the peak of the BB event, particles show more frequent EC inclusion in the center. The following morning, we observed a higher number of EC inclusions shifting away from the center. This likely could be due to coagulation events between OC/IN and aged OC/EC particles causing the EC inclusions to be placed closer to the edge of the host particle rather than in the center. The condensation process of OC onto fresh EC particles, however, results in the EC inclusion positioned in the center. Furthermore, the lower absorbance OD285.4 eV among EC particles post burning event suggests that the reduced mass fraction of the soot/EC component, which is a consequence of atmospheric aging as more OC contribute to the total carbon mass.106,111 However, it must be advised that the identification of soot/EC position within individual particles by this method can be partially biased due to the nature of particle collection resulting in a possible displacement of soot/EC components upon impact with the substrate.
 |
| | Fig. 6 Radial distribution of soot/EC inclusions among analyzed particles derived from STXM/NEXAFS measurements: (A) organic + elemental carbon (OCEC) particles; (B) organic + inorganic + elemental carbon (OCINEC) particles normalized by OD285.4 eV (CC) values. Markers represent the measurement of individual particles. The black dashed lines serve as a visual guide representing the 0.50 soot relative distance value. Violin plots display the density of individual measurements at different periods of the BB event. The illustrations on the left represents relative location of soot with respect to the entire particle. | |
3.4 STXM-derived organic volume fraction
OVF of individual particles is calculated from the carbon K-edge STXM maps deriving from the OC and IN thickness on a per particle basis, as shown in eqn (5) described previously.65,97Fig. 7A illustrates a representative OVF map on the same field of view as the carbon speciation map of Fig. 5A. The significance of quantifying OVF values is due to the strong connection with the hygroscopic behavior of particles, which is also tied to the size, chemical composition, and the distribution of components within individual particles.112,113 OVF values from STXM analysis were used to estimate the aerosol hygroscopicity parameter (κ) as formalized by Petters and Kreidenweis (2007).114 It is an effective parameter to evaluate the water uptake characteristics and cloud condensation nuclei (CCN) activity of multicomponent particles. The κ parameter was estimated for mixed organic–inorganic particles as follows:| | | κ = (1 − forg)κinorg + forgκorg | (22) |
where forg is the STXM-derived OVF values. For this study, (NH4)2SO4 is assumed to be the dominant IN component while the organic component is represented by adipic acid. Assuming these two components, values of κinorg = 0.60 and κorg = 0.06 are used.114,115Fig. 7B shows the build-up of organics onto existing particles through atmospheric aging processes and systematic decrease in average κ as a function of time. The estimated κ value prior to the start of the BB event is 0.50 ± 0.14 with higher contributions of IN component, which corresponds to moderately hygroscopic species. However, the average κ value for samples of the following day begins to plateau around 0.12 ± 0.10. The large change in κ between the pre and post BB period is due to the difference in internal composition, with the former heavily dominated by IN while the latter shows increased contribution of OC. A previous field study on aged BB organic aerosols reported a κ value of mixed organic/inorganic particles between 0.20 and 0.16 during the day and night sampling, respectively.116 Furthermore, Engelhart et al. (2012) observed high variability among the κ of freshly emitted BB SOA, and only during ∼3–4 h of photochemical aging where the variability of κ is reduced.117 Fresh organic aerosols emitted from the start of the BB event experienced atmospheric aging due to the photooxidation of organics the following morning. As a result, we observed higher contribution of OCEC in larger sizes and enhanced OVF within the corresponding size bins as shown in Fig. 7C. These results show that STXM-derived OVF calculations can be an effective metric for the quantification of κ values and assessing hygroscopicity while considering individual particle internal heterogeneity and chemical mixing state.
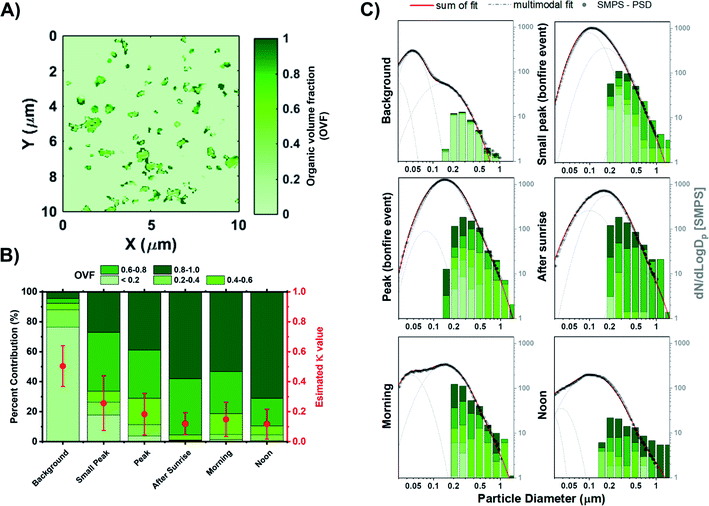 |
| | Fig. 7 STXM-derived organic volume fraction (OVF) of particles from stage 7 samples. (A) Representative OVF map. (B) Percent contribution of OVF distribution with estimated average κ values (red markers) derived from STXM measurements at different burning phases. (C) Size-resolved OVF grouped as 8 bin per decade histogram in logscale with black markers corresponding to the SMPS particle size distribution. Lognormal fits were applied to the SMPS particle size distribution measurements. Grey dashed line corresponds to the individual modal fit while the red solid line is the sum of the fits. | |
3.5 Chemical mixing state of biomass burning particles
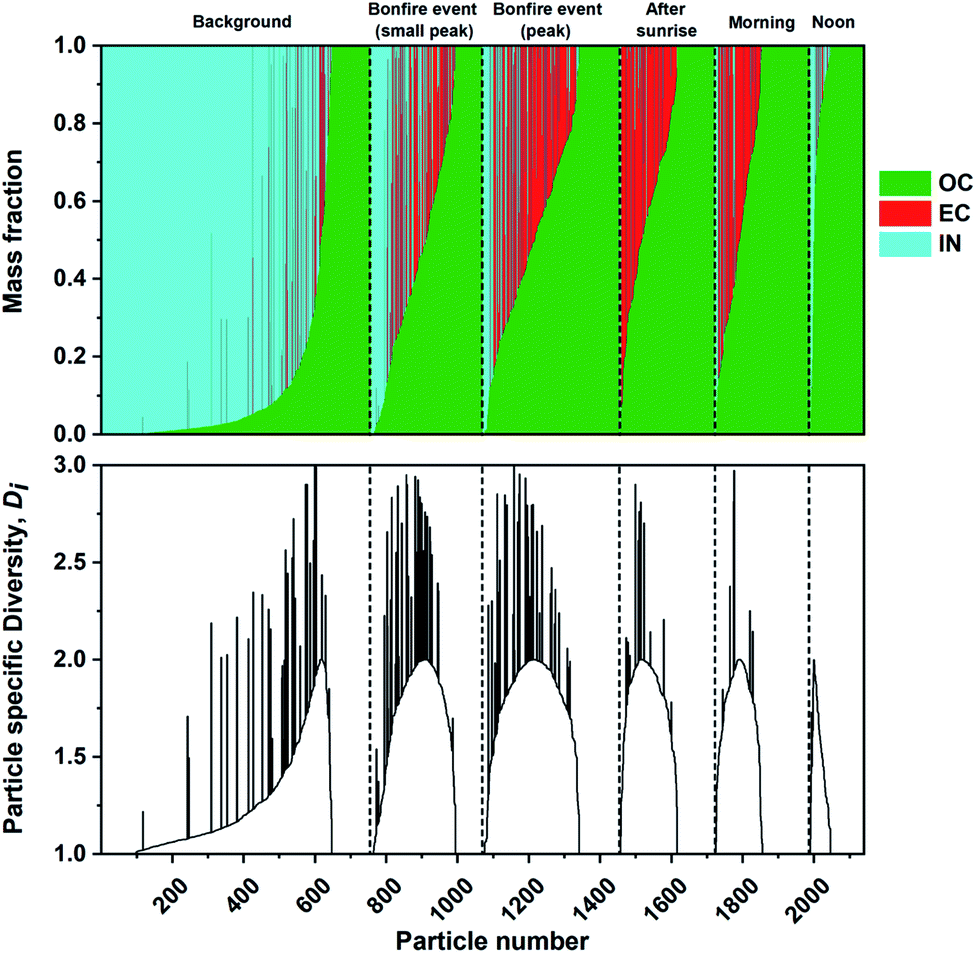
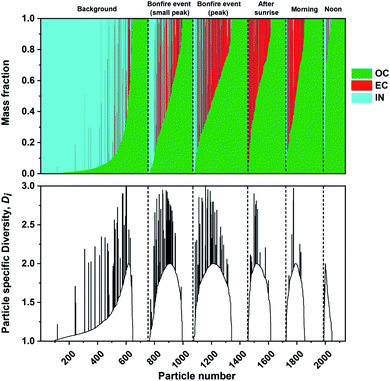
The mass fractions of individual components were estimated from STXM/NEXAFS measurements as described in Section 2.4. Similar analyses were performed previously on mass-based carbonaceous mixing states formulated by Riemer and West (2013)70 to acquire the entropy metrics and diversity parameters.66,96,97 Here, we utilized the three components acquired at the carbon K-edge including OC, EC, and IN. Noncarbonaceous components (e.g., sea spray aerosols and mineral dust) can be broadly represented as IN since the X-ray absorption energies chosen for this work cannot be used to distinguish between different particle types identified by CCSEM/EDX analysis. Fig. 8 shows the individual particle mass fraction for OC, EC, and IN components at different phases of the burning event. The mass fraction of IN component had the largest contribution prior to the burning period. However, OC mass fraction promptly becomes the dominant component among individual particles. Again, this is consistent with the condensation of co-emitted organics onto EC particles and growth of OC particles resulting in higher mass fractions.96,97,118 Furthermore, the particle specific parameter (Di) were also calculated for the same sequence of particles to quantify the number of effective species within individual particles. The diversity range of Di can be between 1 to maximum diversity (in this case 3) with the former corresponding to a single component particle while latter describe equal fractions of OC, EC, and IN. The substantial contribution of IN along with emission of OC and EC particles in the background case results in a more evenly spread Di as the ambient particle population has experienced extended aging processes. However, the simultaneous emission of OC and EC species during the burning event resulted in a temporary increase in Di, which is consistent with the assumption that ambient aerosols begin to interact and mix with freshly emitted plumes of particles. The continuous emission of OC and EC species eventually result in a lack in individual particle diversity, as shown by the reduced Di the following day.
 |
| | Fig. 8 Calculated mass fraction of STXM identified components, organic (OC), soot/elemental carbon (EC), and inorganic (IN), plotted as a stacked bar plot and corresponding individual particle diversity (Di) values. The particles are sorted based on increasing OC mass separated for each sampling period (black dashed lines). | |
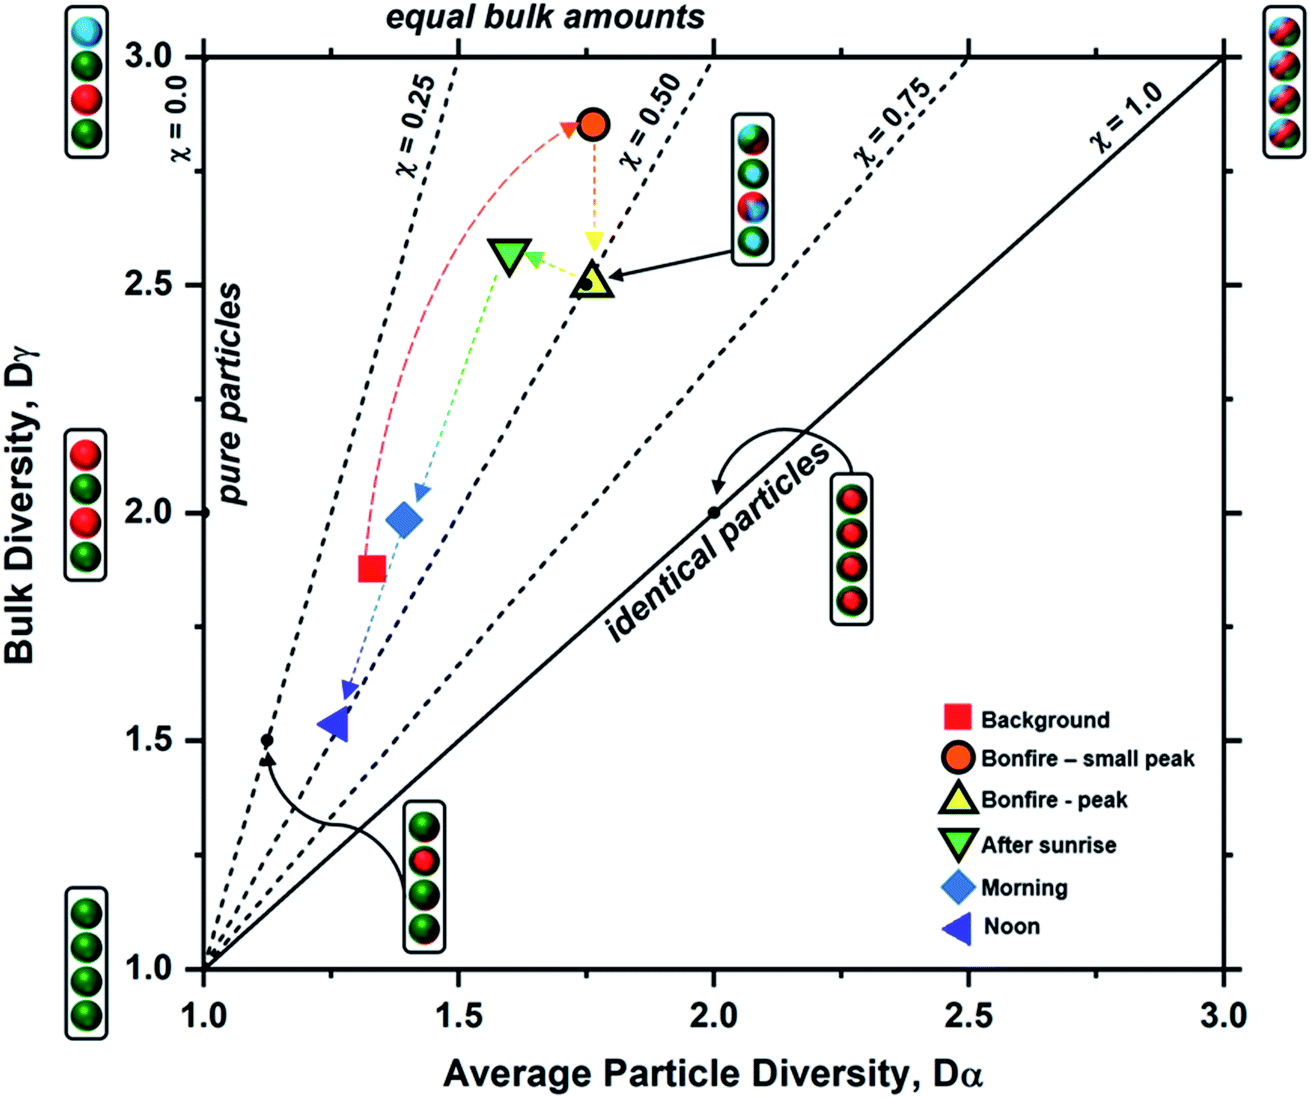
Particle mixing state can also be described in terms of the average number of species in each particle (Dα) and the number of components in bulk population (Dγ).70 These two population diversity parameters give the mixing state index (χ), which quantifies the extent of homogeneity or heterogeneity among the particle population and how representative the composition of individual particles are to the population.70 The values of χ are between 0 and 1, where 0 describes pure externally mixed particles while 1 suggests identical particles with equal distribution of components. Fig. 9 shows the mixing state diagram with the STXM-derived diversity values for the samples collected at different periods of the wood burning event. There is a stark contrast between two group of samples: (1) markers with border; (2) markers without border. The markers with border, i.e., particles collected within the BB period, showed higher Dγ among the collected samples. In comparison, the markers without border displayed (i.e., particles collected outside the BB period) have lower Dγ. However, both periods had similar Dα resulting in similar χ around 0.44 (average for background, morning, and noon) and 0.45 (average for small peak, peak, and after sunrise).
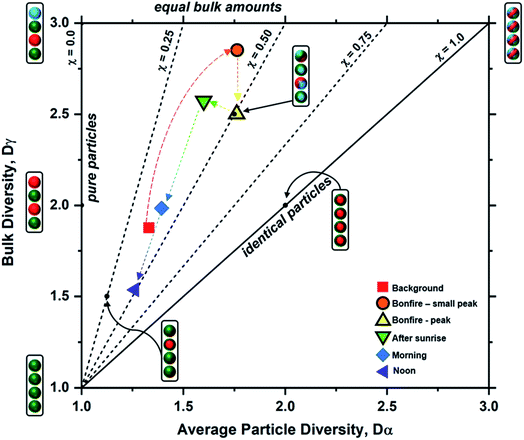 |
| | Fig. 9 Mixing state diagram utilizing the bulk diversity (Dγ) vs. average particle diversity (Dα) parameters for each sample (data points marked by legends), based on STXM maps distinguishing components of OC, EC, and IN. The colored dashed arrows indicate the progression of particle diversity as a function of time. Boundaries for the different mixing state index (χ) thresholds denoted by the black dashed and solid lines were adopted from Riemer and West et al. (2013)70 illustrating representative particle populations among seven different examples shown as cartoon illustrations. Here, the aerosol population consists of four particles (J = 4) with colors representing different chemical components (A = 3) for each case. | |
Emission of fresh particle with lower Di than the initial aerosol population will result in a decrease in Dα. However, the introduction of particles of different compositions to the existing particle population will increase Dγ. The consequential effect of this process is seen as a decrease in χ, and this is observed from the field-collected samples during the intense emission period. However, during the periods outside of the burning event, there is a lack of new particle-type contribution in the context of OC, EC, and IN. As a result, the particle complexity is shifting toward a simpler composition with minimal heterogeneity during less intense emission activities resulting in the observed decrease in both Dα and Dγ. In other words, background samples were heavily dominated by IN while morning and noon samples were overwhelmed by OC influence. On the other hand, samples within the bonfire event and shortly after (i.e., small peak, peak, and after sunrise) had substantial contribution of EC and OC along with existing IN resulting in higher Dγ.
4 Conclusion
The temporal evolution of BB aerosols was investigated during the intense fires of Lag Ba'Omer festival in Israel. Enhancements in organic mass concentration and associated particle growth were observed by in situ measurements of AMS and SMPS. The chemical aging of BB aerosols was evaluated in terms of AMS-identified mass fragments by examining the relevant elemental ratios of the organic component.
Samples of ambient particles were collected before, during, and after the burning event for offline spectromicroscopy analysis. The elemental composition of ∼26500 individual particles were identified by CCSEM/EDX and classified into five distinct particle-types using k-means clustering with carbonaceous particles overwhelmingly dominating the particle population. In addition, the characterization of individual particle internal heterogeneity, OVF, spatial mapping of the EC inclusions, and chemical mixing state were achieved using STXM/NEXAFS. The build-up of OC along with the increased contribution of OCEC implies: (1) condensational growth of smaller particles to generate more homogeneous OC particles, (2) the condensation of OC onto fresh EC particles. Furthermore, the spatial mapping and morphology of EC inclusions were evaluated based on simple parameterization of relative position and eccentricity, respectively. EC inclusions in the particles were closer to the center during the BB period while shifting to the outer regions of the particle in the following morning. This suggests that EC undergoes atmospheric aging through coagulation processes with OC or OCIN particles. Finally, the particle chemical mixing state was quantified from the mass estimates of STXM-identified components including OC, EC, and IN. The entropy-derived diversity parameters demonstrated little variability in particle-specific diversity across all samples. However, the bulk population diversity had a significant difference between particles collected during the event and samples outside the window of the burning event.
BB emissions often mix with the ambient aerosol, such as mineral dust, sea salt, anthropogenic emissions, among others resulting in a complex distribution of different particle-types.7,43,90,119 Such mixing conditions are present in aged BB plumes, and therefore, increase the uncertainty prediction of current atmospheric models since the variability of aerosols is often simplified.120,121 This results in a limited understanding of the physical and optical properties of aerosol assumed by the atmospheric and climate models. Here, we assessed the continuous evolution of BB particle mixing state and evaluated the changes in hygroscopicity and OVF, which are important climate relevant properties for CCN activation and formation of cloud droplets.114,122 In addition, the characterization of individual particle internal heterogeneity through the perspective of a mixing state framework coupled with the particle-type classification provides quantitative metrics to evaluate complex BB aerosols under intricate meteorological episodes and environmental conditions. The quantitative descriptions provided by chemical imaging techniques complemented by in situ measurements to inform particle-resolved models85 and account for individual particle complexity.
Data availability
The dataset used for this work is available for download as a zip file from https://doi.org/10.4231/TB6F-SJ55.
Author contributions
A. L. and Y. R. devised this project. Q. H., C. L., Y. R., and A. L., conducted field measurements and sample collection. J. M. T., J. W., D. P. V., S. C., M. F., K. A. J., F. R. A., A. C. M., and R. M. performed chemical imaging experiments and analyzed associated data. Q. H., C. L., N. R. analyzed real-time data acquired from SMPS and AMS. J. M. T. and A. L. wrote the manuscript with contributions from all coauthors.
Conflicts of interest
The authors declare that they have no conflict of interest.
Acknowledgements
Purdue University and STI group acknowledge funding from U.S. Department of Energy's Atmospheric System Research Program, Office of Biological and Environmental Research grant no. DE-SC0018948. WIS group acknowledge funding from the Israel Science Foundation (grant no. 928/21). The authors would like to acknowledge beamline 5.3.2.2 at the Advanced Light Source at Lawrence Berkeley National Laboratory and its beamline staff for their guidance: Matthew Markus and David Shapiro. This research utilized the CCSEM/EDX at the Environmental Molecular Sciences Laboratory located at the Pacific Northwest National Laboratory. We gratefully acknowledge NOAA Air Resources Laboratory for the provision of the HYSPLIT transport calculations and READY website (https://www.ready.noaa.gov) utilized in this publication. We also use satellite imagery from NASA Worldview application (https://worldview.earthdata.nasa.gov/), part of the NASA Earth Observing System Data and Information System. Lastly, we would like to acknowledge Dori Nissenbaum and Eli Windwer from WIS group for providing the aerial drone photos for the TOC.
References
-
J. Seinfeld and P. Spyros, Atmospheric Chemistry and Physics: from Air Pollution to Climate Change, John Wiley & Sons, Hoboken, NJ, USA, 3rd edn, 2016 Search PubMed.
- J. Chen, C. Li, Z. Ristovski, A. Milic, Y. Gu, M. S. Islam, S. Wang, J. Hao, H. Zhang, C. He, H. Guo, H. Fu, B. Miljevic, L. Morawska, P. Thai, Y. F. Lam, G. Pereira, A. Ding, X. Huang and U. C. Dumka, Sci. Total Environ., 2017, 579, 1000–1034 CrossRef CAS PubMed.
- H. Brown, X. Liu, R. Pokhrel, S. Murphy, Z. Lu, R. Saleh, T. Mielonen, H. Kokkola, T. Bergman, G. Myhre, R. B. Skeie, D. Watson-Paris, P. Stier, B. Johnson, N. Bellouin, M. Schulz, V. Vakkari, J. P. Beukes, P. G. van Zyl, S. Liu and D. Chand, Nat. Commun., 2021, 12, 277–292 CrossRef CAS PubMed.
- J. E. Penner, C. C. Chuang and K. Grant, Clim. Dynam., 1998, 14, 839–851 CrossRef.
- U. Lohmann and J. Feichter, Atmos. Chem. Phys., 2005, 5, 715–737 CrossRef CAS.
- J. S. Reid and P. V. Hobbs, J. Geophys. Res.: Atmos., 1998, 103, 32013–32030 CrossRef.
- J. S. Reid, R. Koppmann, T. F. Eck and D. P. Eleuterio, Atmos. Chem. Phys., 2005, 5, 799–825 CrossRef CAS.
- K. A. Pratt, S. M. Murphy, R. Subramanian, P. J. DeMott, G. L. Kok, T. Campos, D. C. Rogers, A. J. Prenni, A. J. Heymsfield, J. H. Seinfeld and K. A. Prather, Atmos. Chem. Phys., 2011, 11, 12549–12565 CrossRef CAS.
- S. T. Martin, M. O. Andreae, P. Artaxo, D. Baumgardner, Q. Chen, A. H. Goldstein, A. Guenther, C. L. Heald, O. L. Mayol-Bracero, P. H. McMurry, T. Pauliquevis, U. Pöschl, K. A. Prather, G. C. Roberts, S. R. Saleska, M. A. Silva Dias, D. V. Spracklen, E. Swietlicki and I. Trebs, Rev. Geophys., 2010, 48, 1–42 CrossRef.
- S. Decesari, S. Fuzzi, M. C. Facchini, M. Mircea, L. Emblico, F. Cavalli, W. Maenhaut, X. Chi, G. Schkolnik, A. Falkovich, Y. Rudich, M. Claeys, V. Pashynska, G. Vas, I. Kourtchev, R. Vermeylen, A. Hoffer, M. O. Andreae, E. Tagliavini, F. Moretti and P. Artaxo, Atmos. Chem. Phys., 2006, 6, 375–402 CrossRef CAS.
- D. R. Oros, M. R. bin Abas, N. Y. M. J. Omar, N. A. Rahman and B. R. T. Simoneit, Appl. Geochem., 2006, 21, 919–940 CrossRef CAS.
- P. Sannigrahi, A. P. Sullivan, R. J. Weber and E. D. Ingall, Environ. Sci. Technol., 2006, 40, 666–672 CrossRef CAS PubMed.
- L. L. Soto-García, M. O. Andreae, T. W. Andreae, P. Artaxo, W. Maenhaut, T. Kirchstetter, T. Novakov, J. C. Chow and O. L. Mayol-Bracero, Atmos. Chem. Phys., 2011, 11, 4425–4444 CrossRef.
- J. Wang, G. Wang, C. Wu, J. Li, C. Cao, J. Li, Y. Xie, S. Ge, J. Chen, L. Zeng, T. Zhu, R. Zhang and K. Kawamura, Environ. Pollut., 2020, 256, 113401–113409 CrossRef CAS PubMed.
- Q. Zhang, J. L. Jimenez, M. R. Canagaratna, J. D. Allan, H. Coe, I. Ulbrich, M. R. Alfarra, A. Takami, A. M. Middlebrook, Y. L. Sun, K. Dzepina, E. Dunlea, K. Docherty, P. F. DeCarlo, D. Salcedo, T. Onasch, J. T. Jayne, T. Miyoshi, A. Shimono, S. Hatakeyama, N. Takegawa, Y. Kondo, J. Schneider, F. Drewnick, S. Borrmann, S. Weimer, K. Demerjian, P. Williams, K. Bower, R. Bahreini, L. Cottrell, R. J. Griffin, J. Rautiainen, J. Y. Sun, Y. M. Zhang and D. R. Worsnop, Geophys. Res. Lett., 2007, 34, 801–807 Search PubMed.
- M. Shrivastava, M. O. Andreae, P. Artaxo, H. M. J. Barbosa, L. K. Berg, J. Brito, J. Ching, R. C. Easter, J. Fan, J. D. Fast, Z. Feng, J. D. Fuentes, M. Glasius, A. H. Goldstein, E. G. Alves, H. Gomes, D. Gu, A. Guenther, S. H. Jathar, S. Kim, Y. Liu, S. Lou, S. T. Martin, V. F. McNeill, A. Medeiros, S. S. de Sá, J. E. Shilling, S. R. Springston, R. A. F. Souza, J. A. Thornton, G. Isaacman-VanWertz, L. D. Yee, R. Ynoue, R. A. Zaveri, A. Zelenyuk and C. Zhao, Nat. Commun., 2019, 10, 1046 CrossRef PubMed.
- S. Fuzzi, M. O. Andreae, B. J. Huebert, M. Kulmala, T. C. Bond, M. Boy, S. J. Doherty, A. Guenther, M. Kanakidou and K. Kawamura, Atmos. Chem. Phys., 2006, 6, 2017–2038 CrossRef CAS.
- A. Malaguti, M. Mircea, T. M. G. La Torretta, C. Telloli, E. Petralia, M. Stracquadanio and M. Berico, Aerosol Air Qual. Res., 2015, 15, 2641–2653 CrossRef CAS.
- M. V. Johnston and D. E. Kerecman, Annu. Rev. Anal. Chem., 2019, 12, 247–274 CrossRef CAS PubMed.
- C. A. Noble and K. A. Prather, Mass Spectrom. Rev., 2000, 19, 248–274 CrossRef CAS PubMed.
- A. Zelenyuk and D. Imre, Aerosol Sci. Technol., 2005, 39, 554–568 CrossRef CAS.
- Q. Zhang, J. L. Jimenez, M. R. Canagaratna, I. M. Ulbrich, N. L. Ng, D. R. Worsnop and Y. Sun, Anal. Bioanal. Chem., 2011, 401, 3045–3067 CrossRef CAS PubMed.
- A. Zelenyuk, M. J. Ezell, V. Perraud, S. N. Johnson, E. A. Bruns, Y. Yu, D. Imre, M. L. Alexander and B. J. Finlayson-Pitts, Atmos. Environ., 2010, 44, 1209–1218 CrossRef CAS.
- T. D. Vaden, D. Imre, J. Beránek, M. Shrivastava and A. Zelenyuk, Proc. Natl. Acad. Sci. U. S. A., 2011, 108, 2190–2195 CrossRef CAS PubMed.
- A. Laskin, J. P. Cowin and M. J. Iedema, J. Electron Spectrosc. Relat. Phenom., 2006, 150, 260–274 CrossRef CAS.
- K. Adachi, S. H. Chung, H. Friedrich and P. R. Buseck, J. Geophys. Res., 2007, 112, D14202 CrossRef.
- M. Pósfai and P. R. Buseck, Annu. Rev. Earth Planet. Sci., 2010, 38, 17–43 CrossRef.
- A. Laskin, J. Laskin and S. A. Nizkorodov, Environ. Chem., 2012, 9, 163–189 CrossRef CAS.
- W. Li, L. Shao, D. Zhang, C.-U. Ro, M. Hu, X. Bi, H. Geng, A. Matsuki, H. Niu and J. Chen, J. Cleaner Prod., 2016, 112, 1330–1349 CrossRef CAS.
- A. Laskin, M. K. Gilles, D. A. Knopf, B. Wang and S. China, Annu. Rev. Anal. Chem., 2016, 9, 117–143 CrossRef PubMed.
- A. P. Ault and J. L. Axson, Anal. Chem., 2017, 89, 430–452 CrossRef CAS PubMed.
- A. Laskin, R. C. Moffet and M. K. Gilles, Acc. Chem. Res., 2019, 52, 3419–3431 CrossRef CAS PubMed.
- K. A. Katrinak, P. Rez and P. R. Buseck, Environ. Sci. Technol., 1992, 26, 1967–1976 CrossRef CAS.
- J. M. Tomlin, K. A. Jankowski, D. P. Veghte, S. China, P. Wang, M. Fraund, J. Weis, G. Zheng, Y. Wang, F. Rivera-Adorno, S. Raveh-Rubin, D. A. Knopf, J. Wang, M. K. Gilles, R. C. Moffet and A. Laskin, Atmos. Chem. Phys., 2021, 21, 18123–18146 CrossRef CAS.
- A. P. Ault, T. M. Peters, E. J. Sawvel, G. S. Casuccio, R. D. Willis, G. A. Norris and V. H. Grassian, Environ. Sci. Technol., 2012, 46, 4331–4339 CrossRef CAS PubMed.
- A. L. Bondy, D. Bonanno, R. C. Moffet, B. Wang, A. Laskin and A. P. Ault, Atmos. Chem. Phys., 2018, 18, 12595–12612 CrossRef CAS.
- R. C. Moffet, T. C. Rödel, S. T. Kelly, X. Y. Yu, G. T. Carroll, J. Fast, R. A. Zaveri, A. Laskin and M. K. Gilles, Atmos. Chem. Phys., 2013, 13, 10445–10459 CrossRef.
- M. J. Gunsch, R. M. Kirpes, K. R. Kolesar, T. E. Barrett, S. China, R. J. Sheesley, A. Laskin, A. Wiedensohler, T. Tuch and K. A. Pratt, Atmos. Chem. Phys., 2017, 17, 10879–10892 CrossRef CAS.
- J. Kirz, H. Ade, C. Jacobsen, C. -H. Ko, S. Lindaas, I. McNulty, D. Sayre, S. Williams, X. Zhang and M. Howells, Rev. Sci. Instrum., 1992, 63, 557–563 CrossRef.
- A. L. D. Kilcoyne, T. Tyliszczak, W. F. Steele, S. Fakra, P. Hitchcock, K. Franck, E. Anderson, B. Harteneck, E. G. Rightor, G. E. Mitchell, A. P. Hitchcock, L. Yang, T. Warwick and H. Ade, J. Synchrotron Radiat., 2003, 10, 125–136 CrossRef CAS PubMed.
- R. C. Moffet, T. Henn, A. Laskin and M. K. Gilles, Anal. Chem., 2010, 82, 7906–7914 CrossRef CAS PubMed.
- M. Fraund, D. Pham, D. Bonanno, T. Harder, B. Wang, J. Brito, S. de Sá, S. Carbone, S. China, P. Artaxo, S. Martin, C. Pöhlker, M. Andreae, A. Laskin, M. Gilles and R. Moffet, Atmosphere, 2017, 8, 173–201 CrossRef.
- R. C. Moffet, T. R. Henn, A. V. Tivanski, R. J. Hopkins, Y. Desyaterik, A. L. D. Kilcoyne, T. Tyliszczak, J. Fast, J. Barnard, V. Shutthanandan, S. S. Cliff, K. D. Perry, A. Laskin and M. K. Gilles, Atmos. Chem. Phys., 2010, 961–976 CrossRef CAS.
- R. J. Hopkins, K. Lewis, Y. Desyaterik, Z. Wang, A. V. Tivanski, W. P. Arnott, A. Laskin and M. K. Gilles, Geophys. Res. Lett., 2007, 34, 806–811 CrossRef.
- D. Q. Pham, R. O'Brien, M. Fraund, D. Bonanno, O. Laskina, C. Beall, K. A. Moore, S. Forestieri, X. Wang, C. Lee, C. Sultana, V. Grassian, C. D. Cappa, K. A. Prather and R. C. Moffet, ACS Earth Space Chem., 2017, 1, 551–561 CrossRef CAS.
- D. A. Knopf, K. R. Barry, T. A. Brubaker, L. G. Jahl, K. A. Jankowski, J. Li, Y. Lu, L. W. Monroe, K. A. Moore, F. A. Rivera-Adorno, K. A. Sauceda, Y. Shi, J. M. Tomlin, H. S. K. Vepuri, P. Wang, N. N. Lata, E. J. T. Levin, J. M. Creamean, T. C. J. Hill, S. China, P. A. Alpert, R. C. Moffet, N. Hiranuma, R. C. Sullivan, A. M. Fridlind, M. West, N. Riemer, A. Laskin, P. J. DeMott and X. Liu, Bull. Am. Meteorol. Soc., 2021, 102, E1952–E1971 Search PubMed.
- R. Ainbinder, S. Vinker and S. Nakar, Harefuah, 2005, 144, 386–388 Search PubMed.
-
ORNL DAAC 2020, MODIS and VIIRS Land Products Global Subsetting and Visualization Tool, ORNL DAAC, Oak Ridge, Tennessee, USA, 2020 Search PubMed.
- D. Kerret and A. Tal, Worldviews, 2018, 22, 238–262 Search PubMed.
- J. A. F. van Loenhout, K. Vanderplanken, T. Kashibadze, N. Giuashvili, A. Gamkrelidze, M. Siman-Tov, B. Adini and D. Guha-Sapir, BMC Public Health, 2021, 21, 834 CrossRef PubMed.
-
T. Staff, Environment Ministry Reports Reduced Lag B'Omer Bonfire Pollution, https://www.timesofisrael.com/environment-ministry-reports-reduced-lag-bomer-bonfire-pollution/, accessed 27 May 2022 Search PubMed.
-
Air Pollution Reduced by 90% after Lag Ba'omer Bonfire Ban – Report, https://www.jpost.com/israel-news/90-percent-reduction-in-air-pollution-reported-after-lag-baomer-bonfire-ban-627763, accessed 27 May 2022 Search PubMed.
- A. F. Stein, R. R. Draxler, G. D. Rolph, B. J. B. Stunder, M. D. Cohen and F. Ngan, Bull. Am. Meteorol. Soc., 2015, 96, 2059–2077 CrossRef.
- G. Rolph, A. Stein and B. Stunder, Environ. Model. Software, 2017, 95, 210–228 CrossRef.
- J. G. Acker and G. Leptoukh, Eos, Transactions American Geophysical Union, 2007, 88, 14 CrossRef.
- Z. Levin, J. H. Joseph and Y. Mekler, J. Atmos. Sci., 1980, 37, 882–891 CrossRef.
-
MODIS Characterization Support Team (MCST), 2017, MODIS 250 m Calibrated Radiances Product, NASA MODIS Adaptive Processing System, Goddard Space Flight Center, USA Search PubMed.
- R. E. Wolfe, G. Lin, M. Nishihama, K. P. Tewari, J. C. Tilton and A. R. Isaacman, J. Geophys. Res.: Atmos., 2013, 118, 11508–11521 Search PubMed.
-
The Israel Ministry of Environmental Protection Air Quality Data, https://www.svivaaqm.net/, accessed 25 May 2022 Search PubMed.
- S. K. Thompson, Am. Stat., 1987, 41, 42–46 Search PubMed.
- J. M. Tomlin, K. A. Jankowski, F. A. Rivera-Adorno, M. Fraund, S. China, B. H. Stirm, R. Kaeser, G. S. Eakins, R. C. Moffet, P. B. Shepson and A. Laskin, ACS Earth Space Chem., 2020, 4, 2171–2184 CrossRef CAS.
- T. P. Rebotier and K. A. Prather, Anal. Chim. Acta, 2007, 585, 38–54 CrossRef CAS PubMed.
- R. J. Hopkins, A. V. Tivanski, B. D. Marten and M. K. Gilles, J. Aerosol Sci., 2007, 38, 573–591 CrossRef CAS.
- D. A. Knopf, P. A. Alpert, B. Wang, R. E. O'Brien, S. T. Kelly, A. Laskin, M. K. Gilles and R. C. Moffet, J. Geophys. Res.: Atmos., 2014, 119, 10365–10381 CrossRef.
- M. Fraund, T. Park, L. Yao, D. Bonanno, D. Q. Pham and R. C. Moffet, Atmos. Meas. Tech., 2019, 12, 1619–1633 CrossRef CAS.
- R. C. Moffet, R. E. O'Brien, P. A. Alpert, S. T. Kelly, D. Q. Pham, M. K. Gilles, D. A. Knopf and A. Laskin, Atmos. Chem. Phys., 2016, 16, 14515–14525 CrossRef CAS.
- R. E. O'Brien, B. Wang, A. Laskin, N. Riemer, M. West, Q. Zhang, Y. Sun, X. Yu, P. Alpert, D. A. Knopf, M. K. Gilles and R. C. Moffet, J. Geophys. Res.: Atmos., 2015, 120, 9591–9605 CrossRef.
- B. L. Henke, E. M. Gullikson and J. C. Davis, At. Data Nucl. Data Tables, 1993, 54, 181–342 CrossRef CAS.
- J. L. Jimenez, M. R. Canagaratna, N. M. Donahue, A. S. H. Prevot, Q. Zhang, J. H. Kroll, P. F. DeCarlo, J. D. Allan, H. Coe, N. L. Ng, A. C. Aiken, K. S. Docherty, I. M. Ulbrich, A. P. Grieshop, A. L. Robinson, J. Duplissy, J. D. Smith, K. R. Wilson, V. A. Lanz, C. Hueglin, Y. L. Sun, J. Tian, A. Laaksonen, T. Raatikainen, J. Rautiainen, P. Vaattovaara, M. Ehn, M. Kulmala, J. M. Tomlinson, D. R. Collins, M. J. Cubison, E. J. Dunlea, J. A. Huffman, T. B. Onasch, M. R. Alfarra, P. I. Williams, K. Bower, Y. Kondo, J. Schneider, F. Drewnick, S. Borrmann, S. Weimer, K. Demerjian, D. Salcedo, L. Cottrell, R. Griffin, A. Takami, T. Miyoshi, S. Hatakeyama, A. Shimono, J.
Y. Sun, Y. M. Zhang, K. Dzepina, J. R. Kimmel, D. Sueper, J. T. Jayne, S. C. Herndon, A. M. Trimborn, L. R. Williams, E. C. Wood, A. M. Middlebrook, C. E. Kolb, U. Baltensperger and D. R. Worsnop, Science, 2009, 326, 1525–1529 CrossRef CAS PubMed.
- N. Riemer and M. West, Atmos. Chem. Phys., 2013, 13, 11423–11439 CrossRef CAS.
- G. Adler, J. M. Flores, A. Abo Riziq, S. Borrmann and Y. Rudich, Atmos. Chem. Phys., 2011, 11, 1491–1503 CrossRef CAS.
- A. P. Grieshop, J. M. Logue, N. M. Donahue and A. L. Robinson, Atmos. Chem. Phys., 2009, 9, 1263–1277 CrossRef CAS.
- Q. He, S. Tomaz, C. Li, M. Zhu, D. Meidan, M. Riva, A. Laskin, S. S. Brown, C. George, X. Wang and Y. Rudich, Environ. Sci. Technol., 2021, 55, 2878–2889 CrossRef CAS PubMed.
- N. Bluvshtein, P. Lin, J. M. Flores, L. Segev, Y. Mazar, E. Tas, G. Snider, C. Weagle, S. S. Brown, A. Laskin and Y. Rudich, J. Geophys. Res.: Atmos., 2017, 122, 5441–5456 CrossRef CAS.
- P. Lin, N. Bluvshtein, Y. Rudich, S. A. Nizkorodov, J. Laskin and A. Laskin, Environ. Sci. Technol., 2017, 51, 11561–11570 CrossRef CAS PubMed.
- N. L. Ng, M. R. Canagaratna, Q. Zhang, J. L. Jimenez, J. Tian, I. M. Ulbrich, J. H. Kroll, K. S. Docherty, P. S. Chhabra, R. Bahreini, S. M. Murphy, J. H. Seinfeld, L. Hildebrandt, N. M. Donahue, P. F. DeCarlo, V. A. Lanz, A. S. H. Prévôt, E. Dinar, Y. Rudich and D. R. Worsnop, Atmos. Chem. Phys., 2010, 10, 4625–4641 CrossRef CAS.
- C. J. Hennigan, M. A. Miracolo, G. J. Engelhart, A. A. May, A. A. Presto, T. Lee, A. P. Sullivan, G. R. McMeeking, H. Coe, C. E. Wold, W.-M. Hao, J. B. Gilman, W. C. Kuster, J. de Gouw, B. A. Schichtel, J. L. Collett, S. M. Kreidenweis and A. L. Robinson, Atmos. Chem. Phys., 2011, 11, 7669–7686 CrossRef CAS.
- A. C. Aiken, P. F. DeCarlo, J. H. Kroll, D. R. Worsnop, J. A. Huffman, K. S. Docherty, I. M. Ulbrich, C. Mohr, J. R. Kimmel, D. Sueper, Y. Sun, Q. Zhang, A. Trimborn, M. Northway, P. J. Ziemann, M. R. Canagaratna, T. B. Onasch, M. R. Alfarra, A. S. H. Prevot, J. Dommen, J. Duplissy, A. Metzger, U. Baltensperger and J. L. Jimenez, Environ. Sci. Technol., 2008, 42, 4478–4485 CrossRef CAS PubMed.
- M. R. Canagaratna, J. L. Jimenez, J. H. Kroll, Q. Chen, S. H. Kessler, P. Massoli, L. Hildebrandt Ruiz, E. Fortner, L. R. Williams, K. R. Wilson, J. D. Surratt, N. M. Donahue, J. T. Jayne and D. R. Worsnop, Atmos. Chem. Phys., 2015, 15, 253–272 CrossRef.
- L. I. Kleinman, S. R. Springston, P. H. Daum, J. Weinstein-Lloyd, M. L. Alexander, J. Hubbe, J. Ortega, M. R. Canagaratna and J. Jayne, Atmos. Chem. Phys., 2008, 1559–1575 CrossRef CAS.
- M. A. Miracolo, C. J. Hennigan, M. Ranjan, N. T. Nguyen, T. D. Gordon, E. M. Lipsky, A. A. Presto, N. M. Donahue and A. L. Robinson, Atmos. Chem. Phys., 2011, 11, 4135–4147 CrossRef CAS.
- C. L. Heald, J. H. Kroll, J. L. Jimenez, K. S. Docherty, P. F. DeCarlo, A. C. Aiken, Q. Chen, S. T. Martin, D. K. Farmer and P. Artaxo, Geophys. Res. Lett., 2010, 37, 8803–8808 Search PubMed.
- Y. Wang, M. Hu, Y. Wang, J. Zheng, D. Shang, Y. Yang, Y. Liu, X. Li, R. Tang, W. Zhu, Z. Du, Y. Wu, S. Guo, Z. Wu, S. Lou, M. Hallquist and J. Z. Yu, Atmos. Chem. Phys., 2019, 19, 7649–7665 CrossRef CAS.
- C. Li, Q. He, A. P. S. Hettiyadura, U. Käfer, G. Shmul, D. Meidan, R. Zimmermann, S. S. Brown, C. George, A. Laskin and Y. Rudich, Environ. Sci. Technol., 2020, 54, 1395–1405 CrossRef CAS PubMed.
- N. Riemer, A. P. Ault, M. West, R. L. Craig and J. H. Curtis, Rev. Geophys., 2019, 57, 187–249 CrossRef.
- W. Li, J. Sun, L. Xu, Z. Shi, N. Riemer, Y. Sun, P. Fu, J. Zhang, Y. Lin, X. Wang, L. Shao, J. Chen, X. Zhang, Z. Wang and W. Wang, J. Geophys. Res.: Atmos., 2016, 121, 13784–13798 CrossRef.
- W. Stöber, J. Aerosol Sci., 1971, 2, 453–456 CrossRef.
- A. Laskin, R. C. Moffet, M. K. Gilles, J. D. Fast, R. A. Zaveri, B. Wang, P. Nigge and J. Shutthanandan, J. Geophys. Res.: Atmos., 2012, 117, 302–314 CrossRef.
- P. Formenti, L. Schütz, Y. Balkanski, K. Desboeufs, M. Ebert, K. Kandler, A. Petzold, D. Scheuvens, S. Weinbruch and D. Zhang, Atmos. Chem. Phys., 2011, 11(16), 8231–8256 CrossRef CAS.
- J. Li, M. Pósfai, P. V. Hobbs and P. R. Buseck, J. Geophys. Res.: Atmos., 2003, 108, 8484–8496 Search PubMed.
- M. D. Zauscher, Y. Wang, M. J. K. Moore, C. J. Gaston and K. A. Prather, Environ. Sci. Technol., 2013, 47, 7633–7643 CrossRef CAS PubMed.
- K. Adachi and P. R. Buseck, Atmos. Chem. Phys., 2008, 8, 6469–6481 CrossRef CAS.
- L. Liu, S. Kong, Y. Zhang, Y. Wang, L. Xu, Q. Yan, A. P. Lingaswamy, Z. Shi, S. Lv, H. Niu, L. Shao, M. Hu, D. Zhang, J. Chen, X. Zhang and W. Li, Sci. Rep., 2017, 7, 5047 CrossRef PubMed.
- X. Bi, G. Zhang, L. Li, X. Wang, M. Li, G. Sheng, J. Fu and Z. Zhou, Atmos. Environ., 2011, 45, 3447–3453 CrossRef CAS.
- H. Zhang, W. Gu, Y. J. Li and M. Tang, J. Environ. Sci., 2020, 95, 65–72 CrossRef PubMed.
- R. C. Moffet, T. C. Rödel, S. T. Kelly, X. Y. Yu, G. T. Carroll, J. Fast, R. A. Zaveri, A. Laskin and M. K. Gilles, Atmos. Chem. Phys., 2013, 13, 10445–10459 CrossRef.
- R. E. O'Brien, B. Wang, A. Laskin, N. Riemer, M. West, Q. Zhang, Y. Sun, X. Yu, P. Alpert, D. A. Knopf, M. K. Gilles and R. C. Moffet, J. Geophys. Res.: Atmos., 2015, 120, 9591–9605 CrossRef.
- B. Wang, T. H. Harder, S. T. Kelly, D. S. Piens, S. China, L. Kovarik, M. Keiluweit, B. W. Arey, M. K. Gilles and A. Laskin, Nat. Geosci., 2016, 9, 433–437 CrossRef CAS.
- S. China, S. M. Burrows, B. Wang, T. H. Harder, J. Weis, M. Tanarhte, L. V. Rizzo, J. Brito, G. G. Cirino, P.-L. Ma, J. Cliff, P. Artaxo, M. K. Gilles and A. Laskin, Nat. Commun., 2018, 9, 1–9 CrossRef CAS PubMed.
- J. G. Radney, R. You, X. Ma, J. M. Conny, M. R. Zachariah, J. T. Hodges and C. D. Zangmeister, Environ. Sci. Technol., 2014, 48, 3169–3176 CrossRef CAS PubMed.
- S. Kecorius, N. Ma, M. Teich, D. van Pinxteren, S. Zhang, J. Gröβ, G. Spindler, K. Müller, Y. Iinuma, M. Hu, H. Herrmann and A. Wiedensohler, Atmos. Environ., 2017, 164, 259–269 CrossRef CAS.
- D. T. L. Alexander, P. A. Crozier and J. R. Anderson, Science, 2008, 321, 833–836 CrossRef CAS PubMed.
- R. K. Chakrabarty, H. Moosmüller, L.-W. A. Chen, K. Lewis, W. P. Arnott, C. Mazzoleni, M. K. Dubey, C. E. Wold, W. M. Hao and S. M. Kreidenweis, Atmos. Chem. Phys., 2010, 10, 6363–6370 CrossRef CAS.
- A. Laskin, J. Laskin and S. A. Nizkorodov, Chem. Rev., 2015, 115, 4335–4382 CrossRef CAS PubMed.
- E. F. Mikhailov, S. S. Vlasenko, I. A. Podgorny, V. Ramanathan and C. E. Corrigan, J. Geophys. Res., 2006, 111, D07209 CrossRef.
- R. Zhang, A. F. Khalizov, J. Pagels, D. Zhang, H. Xue and P. H. McMurry, Proc. Natl. Acad. Sci. U. S. A., 2008, 105, 10291–10296 CrossRef CAS PubMed.
- Y. Crouzet and W. H. Marlow, Aerosol Sci. Technol., 1995, 22, 43–59 CrossRef CAS.
- R. Kotzick, U. Panne and R. Niessner, J. Aerosol Sci., 1997, 28, 725–735 CrossRef CAS.
- T. C. Bond and R. W. Bergstrom, Aerosol Sci. Technol., 2006, 40, 27–67 CrossRef CAS.
- K. Adachi, S. H. Chung and P. R. Buseck, J. Geophys. Res., 2010, 115, 206–215 Search PubMed.
- A. C. Eriksson, C. Wittbom, P. Roldin, M. Sporre, E. Öström, P. Nilsson, J. Martinsson, J. Rissler, E. Z. Nordin, B. Svenningsson, J. Pagels and E. Swietlicki, Sci. Rep., 2017, 7, 12364 CrossRef CAS PubMed.
- S. R. Schill, D. B. Collins, C. Lee, H. S. Morris, G. A. Novak, K. A. Prather, P. K. Quinn, C. M. Sultana, A. V. Tivanski, K. Zimmermann, C. D. Cappa and T. H. Bertram, ACS Cent. Sci., 2015, 1, 132–141 CrossRef CAS PubMed.
- Z. J. Wu, J. Zheng, D. J. Shang, Z. F. Du, Y. S. Wu, L. M. Zeng, A. Wiedensohler and M. Hu, Atmos. Chem. Phys., 2016, 16, 1123–1138 CrossRef CAS.
- M. D. Petters and S. M. Kreidenweis, Atmos. Chem. Phys., 2007, 7, 1961–1971 CrossRef CAS.
- D. Q. Pham, R. O'Brien, M. Fraund, D. Bonanno, O. Laskina, C. Beall, K. A. Moore, S. Forestieri, X. Wang, C. Lee, C. Sultana, V. Grassian, C. D. Cappa, K. A. Prather and R. C. Moffet, ACS Earth Space Chem., 2017, 1, 551–561 CrossRef CAS.
- M. Psichoudaki, A. Nenes, K. Florou, C. Kaltsonoudis and S. N. Pandis, Atmos. Environ., 2018, 178, 66–72 CrossRef CAS.
- G. J. Engelhart, C. J. Hennigan, M. A. Miracolo, A. L. Robinson and S. N. Pandis, Atmos. Chem. Phys., 2012, 12, 7285–7293 CrossRef CAS.
- A. Setyan, C. Song, M. Merkel, W. B. Knighton, T. B. Onasch, M. R. Canagaratna, D. R. Worsnop, A. Wiedensohler, J. E. Shilling and Q. Zhang, Atmos. Chem. Phys., 2014, 14, 6477–6494 CrossRef.
- L. Yang, S. Mukherjee, G. Pandithurai, V. Waghmare and P. D. Safai, Sci. Rep., 2019, 9, 1–13 CrossRef PubMed.
- S. E. Bauer, A. Ault and K. A. Prather, J. Geophys. Res.: Atmos., 2013, 118, 9834–9844 CrossRef.
- L. Fierce, R. Riemer and T. C. Bond, Bull. Am. Meteorol. Soc., 2017, 98, 971–980 Search PubMed.
- Y. Deng, S. Kagami, S. Ogawa, K. Kawana, T. Nakayama, R. Kubodera, K. Adachi, T. Hussein, Y. Miyazaki and M. Mochida, J. Geophys. Res.: Atmos., 2018, 123, 9703–9723 CrossRef.
Footnotes |
| † Electronic supplementary information (ESI) available. See https://doi.org/10.1039/d2ea00037g |
| ‡ Current address: Center for Electron Microscopy and Analysis, Ohio State University, Columbus, OH 43212, USA. |
|
| This journal is © The Royal Society of Chemistry 2022 |
Click here to see how this site uses Cookies. View our privacy policy here. 
 Open Access Article
 This Open Access Article is licensed under a Creative Commons Attribution-Non Commercial 3.0 Unported Licence
 a,
Johannes
Weis
b,
Daniel P.
Veghte‡
c,
Swarup
China
a,
Johannes
Weis
b,
Daniel P.
Veghte‡
c,
Swarup
China