
 Open Access Article
 This Open Access Article is licensed under a
 Creative Commons Attribution 3.0 Unported Licence
Evaluating SOA formation from different sources of semi- and intermediate-volatility organic compounds from the Athabasca oil sands†
Jacob M.
Sommers
 ab,
Craig A.
Stroud
b,
Max G.
Adam
c,
Jason
O'Brien
b,
Jeffrey R.
Brook
de,
Katherine
Hayden
b,
Alex K. Y.
Lee
bcf,
Kun
Li
bg,
John
Liggio
b,
Cristian
Mihele
b,
Richard L.
Mittermeier
b,
Robin G.
Stevens
a,
Mengistu
Wolde
h,
Andreas
Zuend
i and
Patrick L.
Hayes
*a
ab,
Craig A.
Stroud
b,
Max G.
Adam
c,
Jason
O'Brien
b,
Jeffrey R.
Brook
de,
Katherine
Hayden
b,
Alex K. Y.
Lee
bcf,
Kun
Li
bg,
John
Liggio
b,
Cristian
Mihele
b,
Richard L.
Mittermeier
b,
Robin G.
Stevens
a,
Mengistu
Wolde
h,
Andreas
Zuend
i and
Patrick L.
Hayes
*a
aDepartment of Chemistry, Université de Montréal, Montréal, Québec H3T 1J4, Canada. E-mail: patrick.hayes@umontreal.ca
bAir Quality Research Division, Science and Technology Branch, Environment and Climate Change Canada, Toronto, Ontario M3H 5T4, Canada
cDepartment of Civil and Environmental Engineering, National University of Singapore, Singapore, 117576, Singapore
dDepartment of Chemical Engineering, University of Toronto, Toronto, M5S 3E5, Canada
eDalla Lana School of Public Health, University of Toronto, Toronto, M5T 3M7, Canada
fNational University of Singapore Environmental Research Institute, National University of Singapore, Singapore
gLaboratory of Atmospheric Chemistry, Paul Scherrer Institute (PSI), 5232 Villigen, Switzerland
hFlight Research Laboratory, National Research Council Canada, Ottawa, K1A 0R6, Canada
iDepartment of Atmospheric and Oceanic Sciences, McGill University, Montréal, H3A 0B9, Canada
First published on 27th January 2022
Abstract
As an important component of particulate matter (PM), organic aerosols (OA) have a complex and uncertain effect on climate and health. The Athabasca oil sands in Canada are a significant source of secondary organic aerosol (SOA), despite low concentrations of combustion markers. Following recent intensive aircraft campaigns evaluating emissions and transformation of pollutants from the oil sands in 2013, multiple possible sources of primary semi- and intermediate-volatility organic compounds (P-S/IVOC) have been characterized, with divergent volatility distributions. This work uses a customized box model to evaluate four published volatility distributions against field measurements with respect to the corresponding evolution of OA concentrations as well as oxygen-to-carbon (O![[thin space (1/6-em)]](https://www.rsc.org/images/entities/char_2009.gif) :C) ratios. Specifically, the volatility distributions evaluated are for oil sands ore and bitumen as well as for vapours from excavated oil sands deposits heated at 20 °C and 60 °C. The box model approach includes using an ensemble of several volatility basis set (VBS) parameterizations to model SOA. This approach allows exploration of parameterizations for SOA precursor oxidation and yields, molecular fragmentation, aging rate constants, and organic–organic phase separation. In contrast to urban regions, the model parameterizations which favoured more rapid formation of SOA typically led to biased-high OA concentrations at short photochemical ages. By comparing sensitivity studies for the SOA formation model, we were able to determine that the model is most sensitive to the parameterizations of primary IVOC oxidation, VOC oxidation and of multi-generational oxidative aging. Meanwhile, the sensitivities to the parameterizations for phase separation and fragmentation were weaker in the model. Within the ensemble of model parameterizations, the volatility distribution of vapours from excavated deposits heated to 60 °C performed the best among the four evaluated volatility distributions. This result suggests that the emissions of P-S/IVOCs are more strongly linked to the active mining and hot-water extraction of the oil sands. However, this work also highlights the need to quantify the specific sources of P-S/IVOCs within the oil sands operations, as the totality of SOA precursor emissions likely comes from a wide range of sources.
:C) ratios. Specifically, the volatility distributions evaluated are for oil sands ore and bitumen as well as for vapours from excavated oil sands deposits heated at 20 °C and 60 °C. The box model approach includes using an ensemble of several volatility basis set (VBS) parameterizations to model SOA. This approach allows exploration of parameterizations for SOA precursor oxidation and yields, molecular fragmentation, aging rate constants, and organic–organic phase separation. In contrast to urban regions, the model parameterizations which favoured more rapid formation of SOA typically led to biased-high OA concentrations at short photochemical ages. By comparing sensitivity studies for the SOA formation model, we were able to determine that the model is most sensitive to the parameterizations of primary IVOC oxidation, VOC oxidation and of multi-generational oxidative aging. Meanwhile, the sensitivities to the parameterizations for phase separation and fragmentation were weaker in the model. Within the ensemble of model parameterizations, the volatility distribution of vapours from excavated deposits heated to 60 °C performed the best among the four evaluated volatility distributions. This result suggests that the emissions of P-S/IVOCs are more strongly linked to the active mining and hot-water extraction of the oil sands. However, this work also highlights the need to quantify the specific sources of P-S/IVOCs within the oil sands operations, as the totality of SOA precursor emissions likely comes from a wide range of sources.
Environmental significanceThe oil sands in Alberta are a major source of SOA precursors. This work evaluates some of the potential sources of SOA from the oil sands within a box model framework. SOA models depend on several parameterizations which simplify the chemistry of SOA formation. Since we are uncertain about which combination of parameterizations is the most accurate, we use an ensemble of the parameterizations to account for our uncertainty. We also explore the relative impact of parameterizations for each of five mechanisms in the box model and find the oxidation of intermediate volatility organic compounds is the most important of the five mechanisms, while other mechanisms have a smaller impact on SOA concentrations. |
1. Introduction
Atmospheric aerosols are important contributors to radiative forcing of Earth's climate and have been linked to negative health outcomes.1–5 Organic aerosols (OA) make up between 20% to 90% of the submicron aerosol mass depending on location.6 OA is a complex mixture of directly emitted primary organic aerosol (POA) and secondary organic aerosol (SOA) formed from parent hydrocarbons produced by a diverse range of anthropogenic and biogenic sources.7,8 POA is often emitted as larger hydrocarbons from combustion sources including motor vehicles, biomass burning, and food cooking. SOA is often formed from lighter gaseous hydrocarbons which are processed in the atmosphere and transformed into lower volatility secondary species that partition into the particle phase.9 Since the chemical identity and properties of hydrocarbons change between sources and locations,10–20 characterizing major emission sources is an important step towards understanding regional and global aerosol emissions and SOA formation potential.The oil sands operations in the Athabasca region of North America are located near the northern borders of the province of Alberta (AB), Canada, and are the focus of this work. The emissions from the oil sands activities impact a region that extends well beyond the Athabasca region and cross the territories of many first nations as well as provincial borders.21,22 The oil sands operations are a large source of petroleum products, along with being a large source of local emissions related to the complex extraction process used in mining and refining of the oil sands raw ore.21,23,24 In 2013, an intensive air campaign was conducted as part of the joint oil sands monitoring (JOSM) program.25 The comprehensive air quality study included two ground sites near Fort Mackay, Alberta and twenty-two aircraft flights measuring emissions from individual mining operations, as well as transformation flights studying the physical and chemical evolution of emissions from the whole of the oil sands operations.26 This study found that the oil sands operations are a major source of SOA, with SOA production levels (45–84 t per day) reaching those typically observed in large cities such as Toronto or Houston.21
Liggio et al. (2016) measured bitumen vapors from a sample of earth taken from a location adjacent to active mining sites and found primary organic volatility distributions which lie largely within the range of intermediate volatility organic compounds (primary IVOC, abbreviated here as P-IVOC) with a smaller portion in the heavier semi-volatile organic compounds (primary SVOC, abbreviated as P-SVOC) range.21 Headspace samples of the bitumen vapours were measured at room temperature (20 °C, abbreviated here as “20D”), as well as at elevated temperatures (60 °C, “60D”) to represent the hot water separation of bitumen-containing sand, which is often an open-air procedure during the refinement process. At the elevated temperature, the average volatility of the headspace vapours exhibited a small shift to a less volatile overall distribution.21
Additional measurements of headspace VOC and potential aerosol mass obtained from oil sands materials collected throughout the refinement process (Li et al. 2019) described the volatility distributions of organics in raw ore (ORE), lightly refined bitumen (BIT), tailings pond effluent, naphtha, and diluted bitumen.27 The ORE and BIT sources had the lowest average volatility among the tested samples and, when oxidized through an oxidation flow reactor, had similar elemental ratios to those obtained by aircraft aerosol mass spectrometer (AMS) measurements from the oil sands.27 As a result, ore and bitumen are evaluated in this work as possible sources of non-traditional (i.e. P-S/IVOC-derived) SOA from the oil sands region. However, both the ORE and BIT samples are characterized by volatility distributions with more mass at higher volatilities than the 20D and 60D distributions.21,27 The ORE and BIT volatility distributions are very high in P-IVOC, while no P-SVOC was measured in the headspace vapours.
Here we explore the different SOA formation potentials of these four different volatility distributions using a custom-built box model. Using a box model, rather than a 3-D air quality model, provides an opportunity to rapidly test several SOA formation parameterizations, and to do so with far more chemical detail and specificity than is possible with a chemical transport model. Additionally, the box model can be used to evaluate the potential contribution of sources to total SOA concentrations since different volatility distributions can be rapidly evaluated within the box model, and the predicted SOA concentrations compared against measurements.
We use the volatility basis set (VBS) approach as the backbone of the OA modelling for this work.10,28–34 The VBS is an equilibrium gas-particle partitioning model where primary and secondary organic products are sorted by volatility across bins separated logarithmically, based on the modelled species' size and oxidation state.28 However, there are several uncertain parameterizations which describe the oxidation of SOA precursors, fragmentation of oxidized species, and partitioning of semi-volatile species, as outlined below:32–36
(1) Chamber yields: it has been established that published chamber yields are biased low relative to the formation of SOA in the ambient atmosphere.34,37 In this work, we account for biased low P-VOC oxidation yields with either multi-generational aging or wall-loss corrected yields.30,32
(2) P-IVOC oxidation mechanism: in box-models and 3-D models, P-IVOCs have been considered as a single species, or they have been speciated using measurements. SOA production from these compounds has been modelled as a single oxidation reaction which rapidly forms SOA,13,16,32,38 or P-IVOCs have been binned by volatility and allowed to age in a step-wise function where volatility is reduced more gradually.29,32,34,39 In this work, we explore the spatiotemporal effect of the slow step-wise oxidation of P-IVOCs compared to rapid oxidation of P-IVOCs that produces semi-volatile compounds in a single reaction.
(3) P-S/IVOC aging rate constant: many VBS models which incorporate chemical aging of primary semi-volatile and intermediate volatility organic compounds (P-S/IVOCs) use the aging rate constant of large unsaturated alkanes.29,40 However, the aging rate constant of P-S/IVOCs are dependent on carbon number as well as each species' oxidation state.31 Therefore in the model ensemble, we evaluate how modelled SOA concentration changes when a composition-dependent rate constant for aging is implemented.
(4) Fragmentation: fragmentation of oxidized species occurs from carbon–carbon bond-breaking within the backbone of the oxidized species. The fragmentation pathways typically result in the formation of two (or more) hydrocarbons with fewer carbon atoms than the parent. The loss of secondary products by fragmentation is explored by removing at different rates carbon mass of modelled species following each oxidation.33
(5) Organic liquid–liquid phase separation: for simplicity, many VBS models assume that all organic species are able to partition into the same organic phase;28,29,34,41 however, liquid–liquid phase separation may occur among organic species with divergent polarities due to non-ideal mixing.42–45 Therefore, this work also employs a simple parameterization based on the polarity of the modelled species to assess the effect of organic liquid–liquid phase separation on OA formation and evolution rates.46
There are several uncertain parameters within a VBS model, and there are too many possible combinations of each parameterizations to individually evaluate each for our four target volatility distributions. Hence, in this work, we choose a pair of options for each of the uncertain parameterizations for VOC oxidation, P-IVOC oxidation, fragmentation, phase separation, and IVOC aging, which allows for 25 = 32 iterations for each volatility distribution. To account for the uncertainty, and to avoid making assumptions about which parameterization is “best”, we use an ensemble of all parameterizations to evaluate the effect of the volatility distribution within the model. Within this work, we also evaluate each uncertain parameterization for a single case study that models SOA formation during a research flight. The definition of each parameterization used in this work is described in Table 1, while acronyms are summarized in Table S1.†
| Uncertainty source | Parameterization name | Description | Sample references |
|---|---|---|---|
| P-S/IVOC volatility distribution | 20D | Constrained by the 20 degree headspace of earth adjacent to Oil Sands operations. Fig. 4A | Liggio et al., 2016 (ref. 21) |
| 60D | Constrained by the 60 degree headspace of earth adjacent to Oil Sands operations. Fig. 4B | Liggio et al., 2016 (ref. 21) | |
| ORE | Constrained by the headspace of lightly processed ore from the Oil Sands. Fig. 4C | Li et al., 2019 (ref. 27) | |
| BIT | Constrained by the headspace of ore which has been processed into bitumen from the Oil Sands. Fig. 4D | Li et al., 2019 (ref. 27) | |
| VOC oxidation | WLC | Oxidation yields accounting for chamber wall-losses, with no multigenerational aging. Fig. 2C | Ma et al., 2017 (ref. 32) |
| AGE | Oxidation yields using uncorrected chamber experiments, including multigenerational aging. Fig. 2A | Tsimpidi et al., 2010 (ref. 30) | |
| P-IVOC oxidation | SLOW | Stepwise, multigenerational oxidation of IVOCs matching P/S-SVOCs. Fig. 2D | Robinson et al., 2007 (ref. 29) |
| FAST | P-IVOC oxidation into four VBS bins, followed by multigenerational aging. Fig. 2B | Jathar et al., 2014 (ref. 13) | |
| Fragmentation | F_ON | Carbon loss during oxidation at different rates for each SOA source, as described in Koo et al., 2014. Fig. 2 | Koo et al., 2014 (ref. 33) |
| F_OFF | No carbon loss during oxidation. Not displayed in figures | Tsimpidi et al., 2010 (ref. 30) | |
| Phase separation | 1P | All OA species partition into the same aerosol phase, regardless of polarity or O:C ratio of OA species. Fig. 3A |
Tsimpidi et al., 2010 (ref. 30) |
| 2P | OA species partition into either a polar or non-polar phase. Phase separation is controlled by the comparison of the modeled OA species O:C to the O:C of the background OA constrained by measurement data. Fig. 3B |
This work | |
| IVOC aging rate | FIXED | Multigenerational aging rate constant for P-S/IVOCs is fixed at 4.0 × 10⁻¹¹ cm−3 per molecule per s | Tsimpidi et al., 2010 (ref. 30) |
| VAR | Multigenerational aging rate constant for P-S/IVOCs is 1.2 × 10⁻¹² × (nC + 9nO – 10 (O:C)2) cm−3 per molecule per s |
Donahue et al., 2013 (ref. 31) |
The goal of this study is to evaluate four published volatility distributions for P-S/IVOCs from the oil sands to better understand the potential of the associated sources to contribute to the observed SOA concentrations near the oil sands. Furthermore, we account for uncertainty regarding the appropriate parameterization for models that use a VBS by using an ensemble approach where multiple parameterizations are implemented for each volatility distribution. The evaluation of each volatility distribution also permits the estimation of emission rates of P-S/IVOCs from these sources.
2. Experimental methods
2.1. Model overview
In this work, our SOA model requires several inputs, ranging from aircraft measurements in the oil sands region, to laboratory yields of SOA precursor oxidation which will be described in more detail in this section. Briefly, this model assumes that there will be equilibrium partitioning between organic aerosol and gas-phase chemical species, which occurs quasi-instantaneously between model time steps. The equilibrium is determined by the volatilities of the organic species, which are either primarily emitted, or formed by oxidation in the atmosphere of more volatile gas-phase species. Initial concentrations of species are determined from measurements of the primary emitted species taken from aircraft measurements (P-VOCs), or estimated from emission factors based on the volatility distributions evaluated in this work (P-S/IVOCs). The oxidation rates and volatilities of secondary products, described in detail below and in the ESI,† are input from previous laboratory and field measurements, as well as previous modeling work.13,29–32,34This work assumes that the sole source of atmospheric processing of SOA precursors is oxidation by hydroxyl radicals, and all organic species which make up SOA are entirely made up of carbon, oxygen, and hydrogen atoms. Ozonolysis reactions of alkenes occur alongside hydroxyl radical oxidation, but the relative importance of alkene mass is low compared to alkane mass which does not react rapidly with ozone. Anthropogenic and biogenic alkenes comprise only 3.3% of total VOC mass during the first aircraft transect downwind of the oil sands and are not major sources of SOA in the ensemble. Therefore, ozonolysis reactions are not considered in this work. Simulating the effect of oxidation on SOA concentrations is dependent on the change that each oxidation step has on the parent species. In this work, each generation of aging reduces the volatility of a semi-volatile organic species by a factor of ten.29 This model also prescribes the number of carbon atoms present in each semi-volatile organic species, as well as the volatility. Following previously published work on the relationship between organic volatility, carbon number, and oxygen-to-carbon (O:C) ratios, we derive the number of oxygen atoms in each modelled species.47 From aircraft measurements of organic aerosols at the oil sands, we derive the relationship between O:C and hydrogen-to-carbon (H:C) ratios in order to assign the number of hydrogen atoms in each species – which is combined with prescribed oxygen and carbon numbers to determine the molar mass of each species. The change in molar mass between oxidation steps determines the potential mass increase as a primary compound or secondary product is oxidized. Additionally, the phase separation parameterization in the model ensemble is driven by the difference between O:C of the measured background (measured from aircraft) and the modelled O:C ratios.
Finally, several non-organic tracers from measurements are required in this work. Black carbon (BC) is used as an inert tracer to account for dilution in the model, which affects all modelled species equally. BC, NOy, and CO2 act as tracers for emission factors for P-S/IVOCs, depending on the volatility distribution used. NOx and NOy are used to estimate the extent of oxidation during the flights, quantified as the photochemical age. Finally, OA measurements are used to evaluate the model, and the background concentrations of OA (outside of the plumes) are used to constrain the non-volatile OA in the equilibrium partitioning model.
2.2. Measurements, research flights, and Fort Mackay, AB ground site
Measurements of OA, BC, NOx, NOy, CO2 and VOCs were taken from 22 flights over the oil sands region surrounding the Athabasca river in the summer of 2013, as described in detail previously.21 Ground-site data from an air monitoring station adjacent to Fort Mackay (Air Monitoring Station-13, 57°8′57.03′′ N, 111°38′32.44′′ W, Fig. S1,† panel A) during the intensive program between August 11 and September 10, 2013 provided measurements of OA (including OA components from positive matrix factorization analysis), BC, NOx, and NOy for this study, which have also been reported in previous work.48,49During the research flights, OA was measured by high-resolution time-of-flight aerosol mass spectrometry (HR-ToF-AMS) while the aircraft flew transects of an emission plume downwind of the oil sands facilities. Two Lagrangian flights, denoted as flight 19 (September 4, 2013) and flight 20 (September 5, 2013), are the focus of this work. As shown in Fig. 1 (panels A and B), flights 19 and 20 tracked the prevailing wind direction carrying the plume from the oil sands operations, while crossing to measure transects of the same plume approximately every hour. While measurements were taken at varying altitudes, this work focuses on the altitudes which measured the peak plume concentrations of OA and BC. The measurements from the transects between 600–650 m for flight 19, and between 1100–1200 m for flight 20 in altitude were used for evaluating and constraining the box model. Fig. 1(C and D) demonstrates the increase of total OA relative to BC vs. photochemical age for both flights, clearly demonstrating the formation of SOA as previously reported by Liggio et al. (2016).21
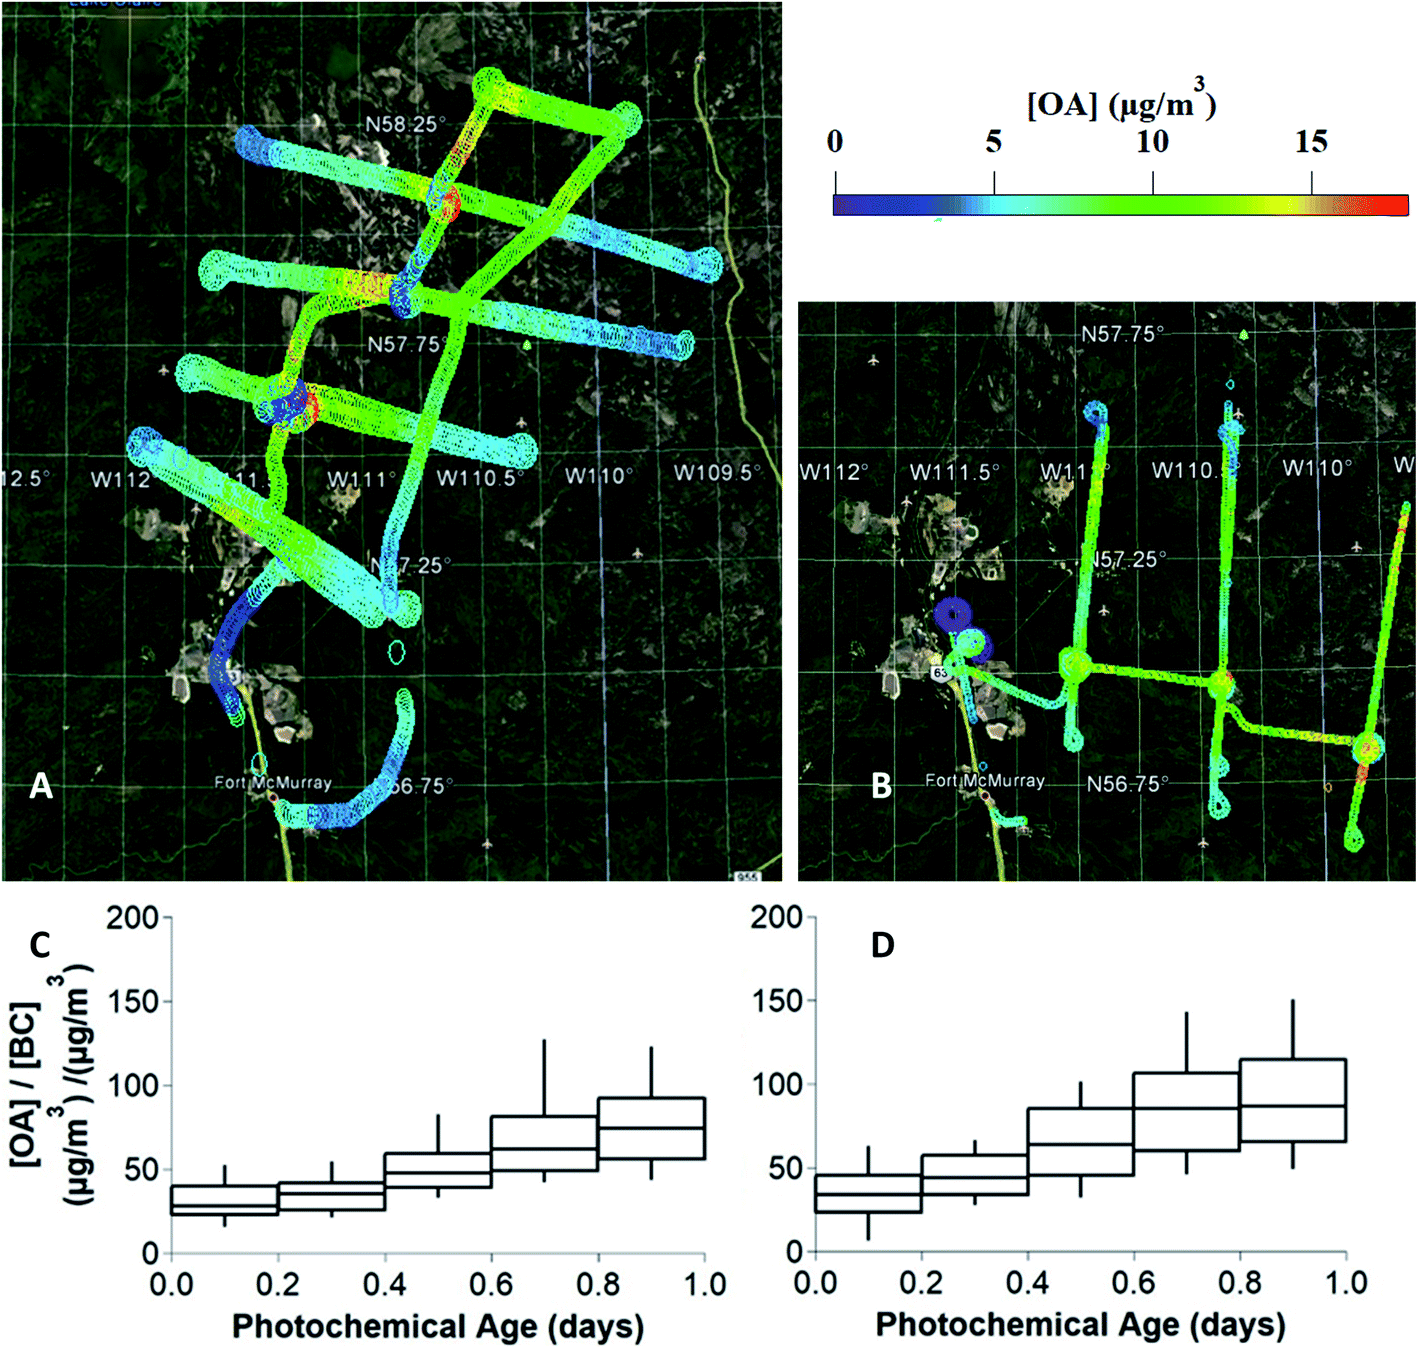 | ||
| Fig. 1 The flight tracks and concentrations of total OA for two research flights downwind of the Oil Sands region that track the formation and evolution of particulate matter. Panels (A) and (B) show the results for flights 19 and 20, respectively. In panels (C) and (D), total OA concentration, divided by black carbon (BC) concentration, used as an inert tracer, is plotted against photochemical age, described by the NOx/NOy clock, to characterize the formation of secondary OA, for flights 19 and 20, respectively. Boxes and whiskers represent the 10th, 25th, 75th, and 90th percentiles of data across both flights, where n = 1630 and 835, for flights 19 and 20, respectively. | ||
Using the measured concentrations outside of the plume, the average OA background concentration for each flight (4.5 μg m−3 for flight 19, and 3.5 μg m−3 for flight 20) was determined, as described in Fig. S2.† Previously, in Liggio et al. (2016),21 the authors applied positive matrix factorization (PMF) analysis to flight 19 HR-ToF-MS data (identified as flight 1 in the previous work) to identify and quantify the concentration of highly oxidized, biogenic SOA which dominates the total [OA] outside of the plumes. The PMF results are entirely consistent with the presence of regional background OA. In this previous work, the PMF separation was limited to in-plume and out-of-plume OA factors. We do not use them as a diagnostic for model performance since the PMF results do not provide any additional information about OA components within the plume. The AMS measures PM1.0 and thus larger particles are not quantitatively sampled by the instrument. Therefore, as described by Liggio et al. (2016),21 the measured surface area ratio of PM1.0:PM20 is used as a scaling factor for the AMS data to produce the final OA measurements that are compared to the model output.
2.3. Gas-phase oxidation model parameters
The formation and evolution of SOA was simulated for the oil sands plume using a custom-built box model that includes P-VOCs, P-IVOCs and P-SVOCs as precursors to SOA formation. The concentrations of all organic compounds, including precursors and products are calculated in 15 photochemical minute time steps over a single photochemical day. Photochemical age is described by the NOx:NOy clock,16 which is outlined in more detail in the ESI.† Several parameterizations for the oxidation and aging of the organic compounds are applied to each model run, which are briefly described below, and described in detail in the ESI.† Parameterizations within the box model are identified and described in Table 1.
Briefly, oxidation of P-VOCs is described by a VBS approach with either traditional yields followed by multi-generational aging (AGE),30 or with mass yields which retroactively correct for wall-losses in environmental chambers and do not undergo multi-generational aging (WLC).32 For both model cases, the model assumes high-NOx SVOC yields, as the oil sands are a large source of NOx emissions.49,50 P-SVOCs are always treated by a “bin-hopping” multi-generational aging pathway, where oxidation by hydroxyl radicals reduces the volatility of P-SVOCs and S-SVOCs by one order of magnitude in each oxidation step.29 P-IVOCs are either oxidized by the same “bin-hopping” approach as P-SVOCs (SLOW),29 or they oxidize as a single species in a single step into a four-bin VBS followed by multi-generational aging (FAST).41 Visually, examples of the AGE, WLC, SLOW, and FAST parameterizations are described in Fig. 2. Fragmentation in the ensemble is treated as either on (F_ON) or off (F_OFF), with F_ON described in more detail in the ESI.† Briefly, F_ON follows the carbon number loss scheme described by Koo et al. (2014),33 where volatility bins and carbon numbers are prescribed, and used to calculate the oxidation state and molar mass of each SVOC species according to the two-dimensional volatility basis set.47 Finally, the S/IVOC aging rate constant is treated as either fixed at 4.0 × 10⁻¹¹ cm−3 per molecule per s (FIXED) or variable depending on the modelled carbon and oxygen numbers (VAR).31
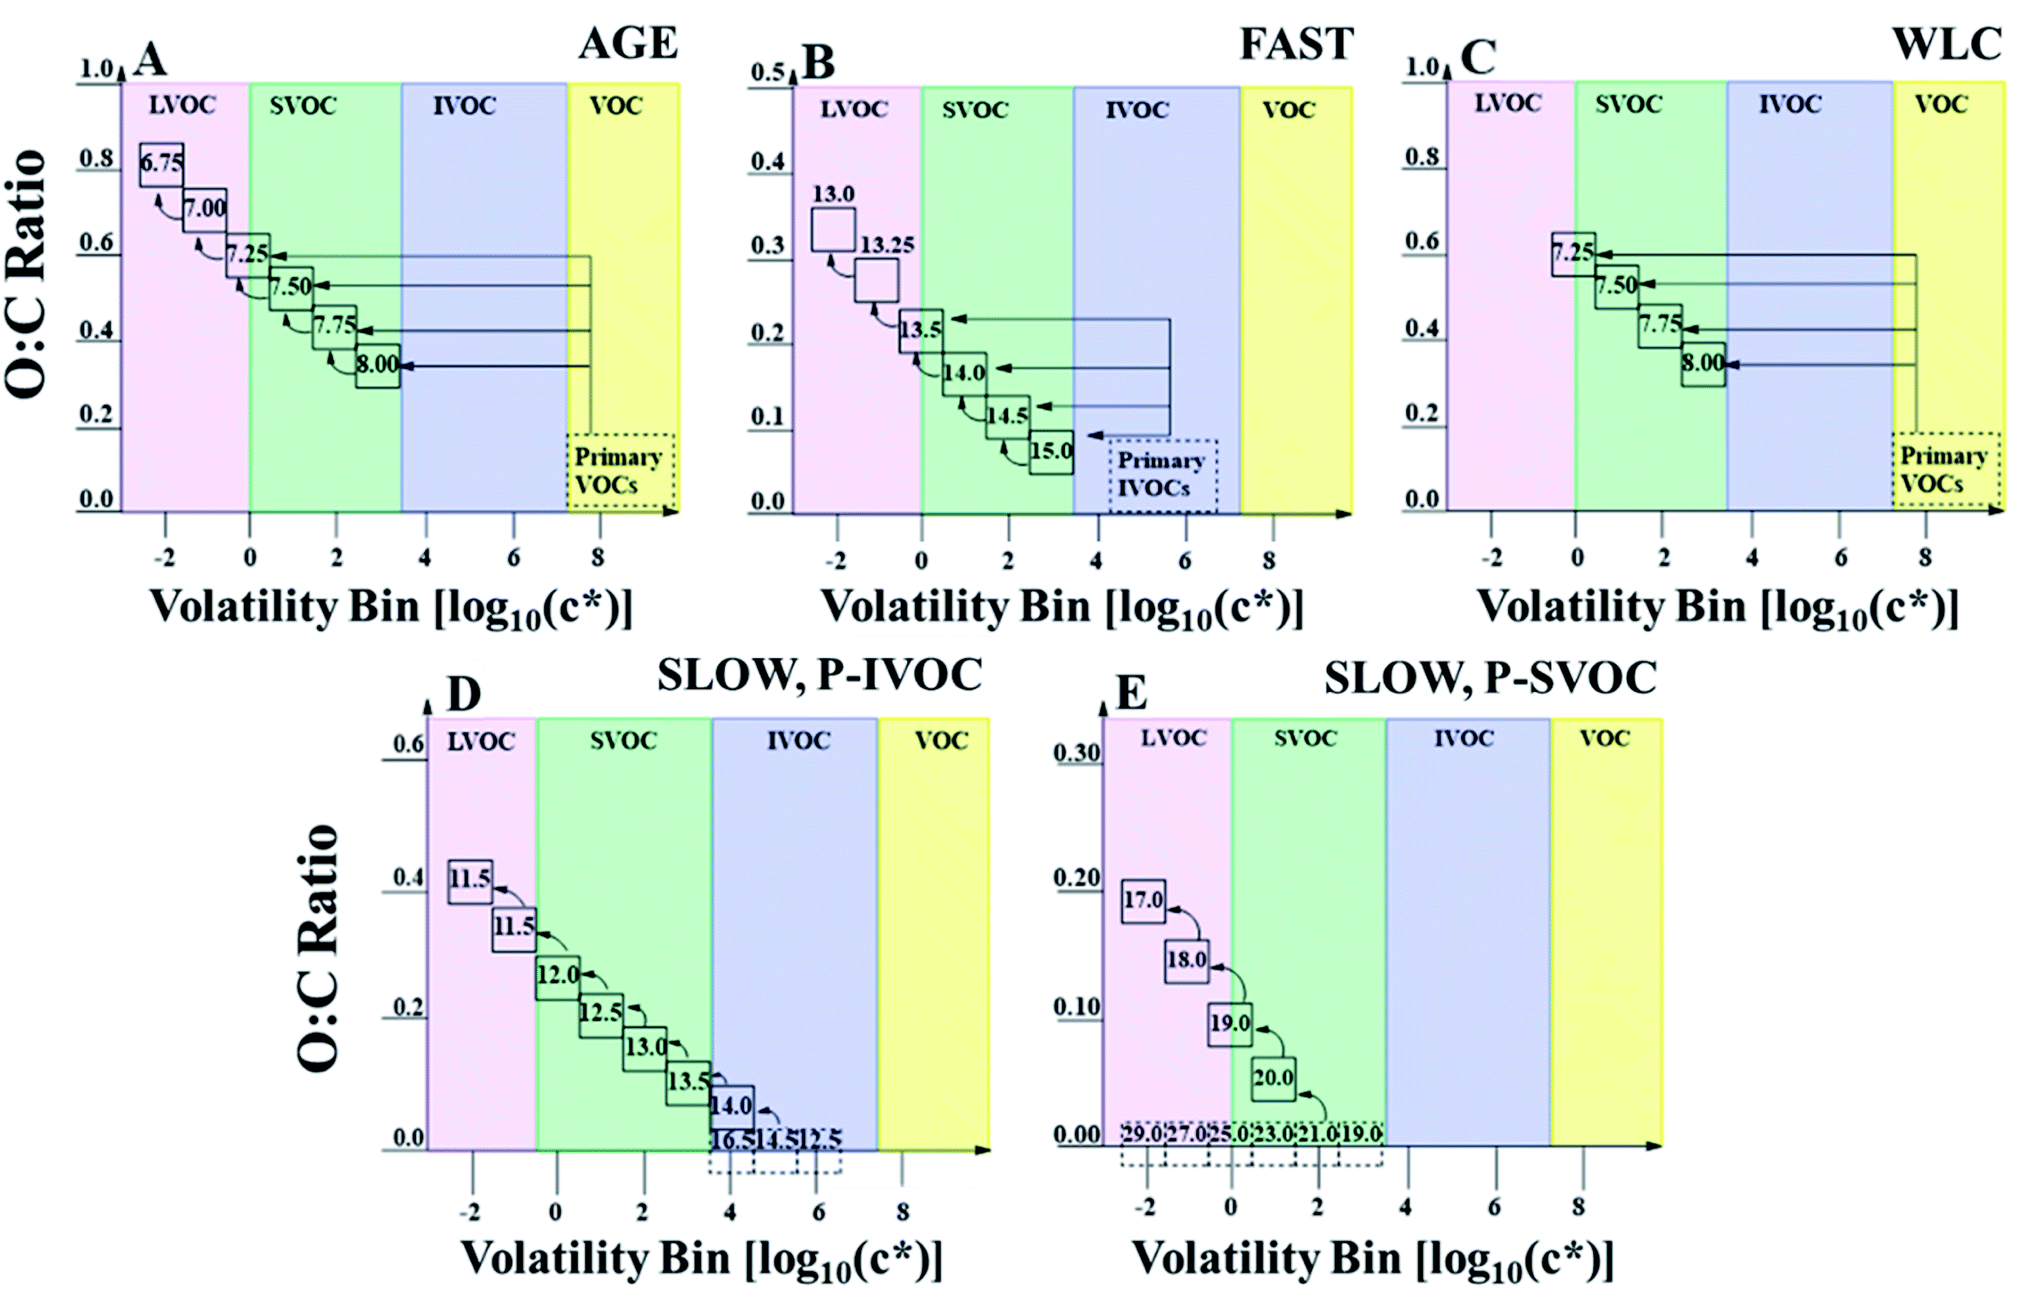 | ||
| Fig. 2 2-D VBS space defined by oxygen-to-carbon (O:C) ratio and saturation concentration [log(c*), at 298 K] for different oxidation mechanisms and primary sources of OA precursors. Dashed boxes within each panel represent primary emissions, while the full boxes represent the secondary oxidation products. Boxes are labeled with sample carbon numbers. (A) and (C) represent different parameterizations for treating traditional anthropogenic and biogenic sources of SOA. Both parameterizations depict the oxidation of an 8-carbon precursor VOC as an example. (A) Represents the AGE, or aging, parameterization; (C) represents the WLC, or wall-loss corrected, parameterization. (B) Represents the FAST parameterization, where a single P-IVOC species is assumed and oxidized into a four-bin volatility basis set, similar to the AGE mechanism for traditional VOCs. It should be noted that for (B) the carbon number corresponds to first generation aging and subsequent oxidation results in a 0.25 reduction in effective carbon number. The carbon numbers for primary VOCs and IVOCs in (A), (B), and (C) are not included as they have no impact in the model. (D) Represents the sample aging pathway of a C14.5 species by the decadal aging by hydroxyl radicals, according to the SLOW mechanism for P-IVOCs. (E) Represents the decadal aging of P/S-SVOCs by hydroxyl radicals, according to the SLOW mechanism. In (E), the full aging pathway of only the C21 species is depicted as an example, though all primary species age until the log10(c*) = −2 bin. In all runs, all emitted P-SVOC species undergo the same decadal aging scheme which begins from the saturation concentration bin of the emitted species. | ||
2.4. Partitioning and O![[thin space (1/6-em)]](https://www.rsc.org/images/entities/h3_char_2009.gif) :C
:C
Gas-particle partitioning is calculated assuming quasi-instantaneous (within a time step) equilibrium partitioning using the Donahue et al. (2006)28 reformulation of Pankow's absorptive partitioning theory: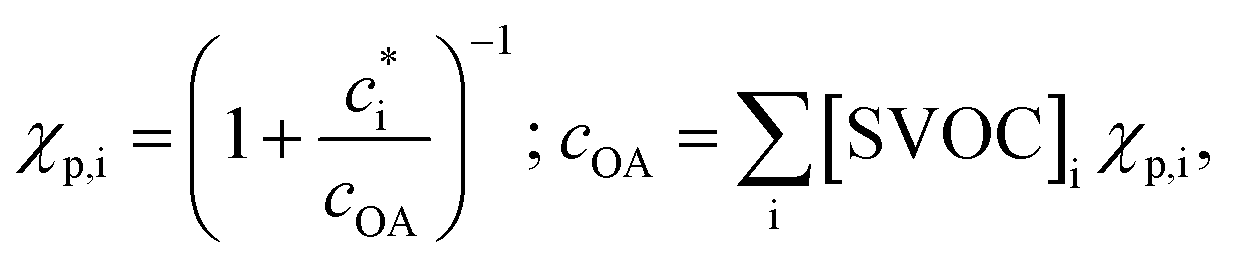 | (1) |
 is the effective saturation concentration (μg m−3); cOA is the total mass of the organic aerosol phase available for partitioning (μg m−3); and [SVOC]i represents the total concentration of all SVOCs in the volatility bin i. The background OA is present throughout the model run and it is not subject to the dilution that reduces other OA and anthropogenic VOCs within the oil sands plume between time steps. Furthermore, the temperature dependence of
  is calculated using the Clausius–Clapeyron equation:
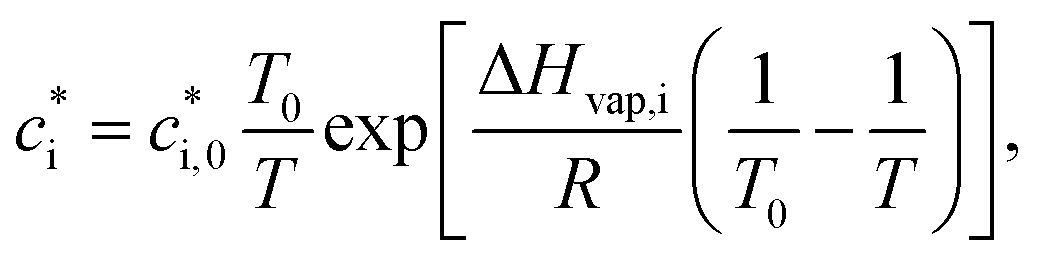 | (2) |
 is the effective saturation concentration of the lumped species i at the reference temperature (T0), 298 K; T is the ambient temperature; ΔHvap,i is the enthalpy of vaporization of lumped species i; and R is the ideal gas constant. The ΔHvap,i of each species is described in Tables S2 and S3.†29,51
One uncertainty explored in the model ensemble is the effect of liquid–liquid phase separation among organic compounds, where SVOC partitioning is limited to one of two organic phases, with segregation driven by the O:C ratio of the SVOC (Fig. 3). In eqn (1), cOA is split into polar and non-polar cOA species. We employ an O:C threshold of 0.4 units below the existing background O:C ratio to separate relatively high-O:C compounds from low-O:C compounds. Specifically, when two-phase partitioning is active, SVOCs with O:C ratios below 0.23 and 0.19, for flights 19 and 20 respectively, partition into the non-polar OA phase. It should be noted that the threshold value is highly uncertain, and the value used here is simply meant to test the sensitivity of OA properties to liquid–liquid organic phase separation. The effect of changing the O:C threshold for phase separation was also explored and is discussed in the ESI† and Section 3.3.2.
 | ||
| Fig. 3 Simplified schematic describing the partitioning of gas phase organic species. (A) Describes the single-phase scheme and (B) describes the two-phase partitioning scheme. | ||
In this work, calculating the O:C and molar mass of each modelled species requires understanding the relationship between O:C and H:C. Van Krevelen (VK) diagrams describe the changes in the oxidation of the organics during each flight by plotting H:C versus O:C, as measured by the HR-ToF-AMS.52,53 VK diagrams for OA are shown in Fig. S3(A)† for flights 19 and 20, in red and blue, respectively. The O:C and H:C of OA was determined using the measurements from Liggio et al. (2016), following the method described in Canagaratna et al. (2015).21,54 While the exact identity of every oxidation reaction that occurs within each flight is impossible to determine from O:C versus H:C relationships, VK diagrams provide useful information to compare OA oxidation trends across different field measurement campaigns.15 In the VK diagram in Fig. S3(A),† the clustering of O:C in the range of 0.4 to 0.7 is consistent with the dominance of lightly oxidized SOA, with the highest O:C ratios indicating the presence of some heavily oxidized SOA.54 The slopes of −0.40 and −0.57 for flights 19 and 20, respectively, correspond well to previously published VK diagram slopes for OA measurements in regions influenced by anthropogenic emissions and SOA formation. The similarity in VK profiles between the oil sands and previous literature suggests that while the emissions of SOA precursors from the oil sands may differ from urban locations in terms of relative and absolute concentrations, the chemistry describing the oxidation of precursors into SOA is similar and thus the models developed in our previous work can be adapted to SOA formed downwind of the oil sands.15,16,23,32,34,53,55
The linear relationship between H:C and O:C equation for each flight is used in the model to calculate the molar mass of each modelled species, as described in the sample equation below (3), for flight 19:
| Mi = nc,i × 12.01 + no,i × 16.00 + ((1.74 – 0.4 × O:Ci) × nc,i) × 1.01; | (3) |
:Ci is the oxygen-to-carbon ratio for species i. The linear equation, 1.74–0.4 × O:Ci, represents the H:C ratio, as described by the VK diagram in Fig. S3(A).†
![[thin space (1/6-em)]](https://www.rsc.org/images/entities/b_char_2009.gif) :C model.
With prescribed carbon numbers and saturation concentrations, as described in Fig. 2, we use a group-contribution theory introduced by Donahue et al. (2011) to solve for the number of oxygen atoms, and therefore O:C ratio and molar mass, all while accounting for non-linear effects.47 A sample calculation is provided in the ESI.†
:C model.
With prescribed carbon numbers and saturation concentrations, as described in Fig. 2, we use a group-contribution theory introduced by Donahue et al. (2011) to solve for the number of oxygen atoms, and therefore O:C ratio and molar mass, all while accounting for non-linear effects.47 A sample calculation is provided in the ESI.†
In previous studies using the Robinson-style aging parameterization for S/IVOCs, aging events are treated with an increase in mass of the reactant by 7.5%.30,32,34,56 In our model, the change in mass during aging reactions is calculated as the change in modelled molar mass from the reactant to the product species. This method considers functionalization with oxygen, as well as fragmentation of the carbon backbone. For example, a semi-volatile C8 species formed from VOC oxidation with a saturation concentration of 1000 μg m−3 has an average of 2.7 oxygen atoms, with a molar mass of 153.3 g mol−1. As demonstrated in Fig. 2, a single oxidation step with an average 0.25 carbon loss due to fragmentation leads to a hypothetical C7.75 species with a saturation concentration of 100 μg m−3, an average of 3.3 oxygens, and a molar mass of 158.1 g mol−1. The resulting mass increase from this reaction is therefore calculated to be 3.2%.
2.5. Initial precursor concentrations
:ΔBC emission ratio, where BC is background corrected. BC is thus used as a tracer for determining initial VOC concentration at the time of emission, as well as for dilution. In both flights, the enhancement and dilution of BC within the oil sands plume compared to the background concentration is demonstrated in Fig. S2(C and D).† In this work, we assume the formation of light-absorbing carbon will not interfere with SP2 measurements of black carbon. The dilution rate of BC was applied to all organic (gas and particle phase) matter during each time step. In the flights, anthropogenic VOCs are measured downwind of their emission sources. Anthropogenic VOCs for flight 19 are first measured during the second transect (VOC canisters measurements are missing from the first transect), when ΔBC = 0.30 μg m−3 and photochemical age = 0.36 days. Meanwhile, black carbon measurements are performed across every transect, including the first transect when photochemical age = 0.16 days and ΔBC = 0.57 μg m−3. By plotting ΔBC vs. photochemical age, we predict that the concentration of ΔBC = 0.94 μg m−3 when photochemical age = 0, assuming an exponential decay to model BC dilution. The same procedure is performed for flight 20, where ΔBC is measured during the first transect is 0.34 μg m−3 (photochemical age = 0.21 days) while the predicted ΔBC concentration at the emission source is 0.46 μg m−3. To correct VOC concentrations to their initial values, oxidation must also be considered, and here the first-order decay (eqn (4)) of a VOC is used for this calculation.| [VOC]t=0 = [VOC]t=tekt[OH], | (4) |
Biogenic monoterpenes (α-pinene and β-pinene) were added to the model using an equation that fits the empirically measured concentrations of the VOCs; these do not undergo dilution in the model. The concentrations of monoterpenes were plotted against the photochemical age in each transect, and the monoterpene concentrations were added to the model from the linear fit of the measured concentrations. The average concentration of the combined monoterpene species is provided in Table S4.† Sesquiterpenes are calculated as a function of the concentration of the monoterpenes, as described in eqn (5) where Ti represents the air temperature at the time i.57
| [SESQ]i = [TERP]i × 0.16 × e0.17(Ti−303)/e0.11(Ti−303), | (5) |
Isoprene was split into anthropogenic and biogenic sources. The background concentration of isoprene sampled outside of the oil sands plume was subtracted from the peak isoprene concentration, and the remaining isoprene concentration was treated as an anthropogenic VOC. Anthropogenic isoprene is corrected for aging, as in eqn (4), and allowed to dilute within the model. The background isoprene concentration measured outside the oil sands plume was modelled as biogenic isoprene without experiencing dilution (Table S4†), similar to the monoterpenes. In the AGE parameterization, biogenic species do not undergo multi-generational aging, following previous research.33,58
:ΔBC emission ratio was derived from ground measurement data from Air Monitoring Station-13 (starred in Fig. S1(A)†), located within the center of the Athabasca oil sands region. To obtain the initial mass of POA, this POA:ΔBC ratio is multiplied by the initial BC concentration. The mass of P-S/IVOC in each volatility bin was then set so that when the P-S/IVOCs partition into the background OA, the sum of condensed P-SVOCs is equivalent to the prescribed initial POA concentration while maintaining the relative volatility distribution of Liggio et al. (2016). It should be noted that this approach assumes that dominant sources of POA at the oil sands emit P-S/IVOCs with a volatility distribution similar to that measured by Liggio et al. (2016) for bitumen deposits.
To determine the POA:ΔBC emission ratio, we used the hydrocarbon-like OA (HOA) factor determined from the PMF analysis of the HR-ToF-AMS data from the ground site and assumed that HOA is a surrogate for POA. A linear regression analysis was performed on HOA and BC data as shown in Fig. S1(B).† The slope is equal to the emission factor. Using this method, an emission factor of 1.26 μg POA m−3/μg BC m−3 was obtained. The sources of POA, less oxidized OOA, BC, and P-IVOCs are well correlated according to principal component analysis (PCA),48 though this previous work strongly suggests that HOA and BC emissions are co-emitted by variety of activities geographically-dispersed within the oil sands operations, making direct source apportionment difficult.
The volatility distributions of the samples from the oil sands described in Li et al. (2019) are much more heavily weighted to the IVOC and VOC volatility ranges than the 20D and 60D samples described earlier (Fig. 4). In Liggio et al. (2016) and Li et al. (2019), the volatility distributions were determined by comparing the GC retention times of a solution of alkane standards to the unresolved complex mixture from the oil sands.21,27 The method for estimating c* from an unresolved complex mixture has been reported in the literature previous, in detail.59 While the chemical composition of the ORE and BIT samples are not fully speciated, their chemical oxidation was explored in an oxidation flow reactor (OFR) in Li et al. (2019).27 The OFR data suggest a similar oxidation pathway as cycloalkanes, according to the VK diagrams. The VK diagrams from ORE, BIT, and cycloalkanes were also very similar to those from the aircraft measurements. According to thermal-desorption GC-MS, the ore and bitumen samples have a maximum carbon number of 15, corresponding to an effective saturation concentration of 105. The bitumen fraction has a lower average volatility than the ore fraction, though the differences are minor. The increased volatility of the ore and bitumen samples, compared to the excavated samples from Liggio et al. (2016), means that, under ambient conditions, semi-volatile POA will not be formed by the primary evaporative emissions of these samples. As a result, the POA:ΔBC emission factor described above cannot be adapted to the ore and bitumen samples to determine the initial amount of P-S/IVOCs from these potential sources.
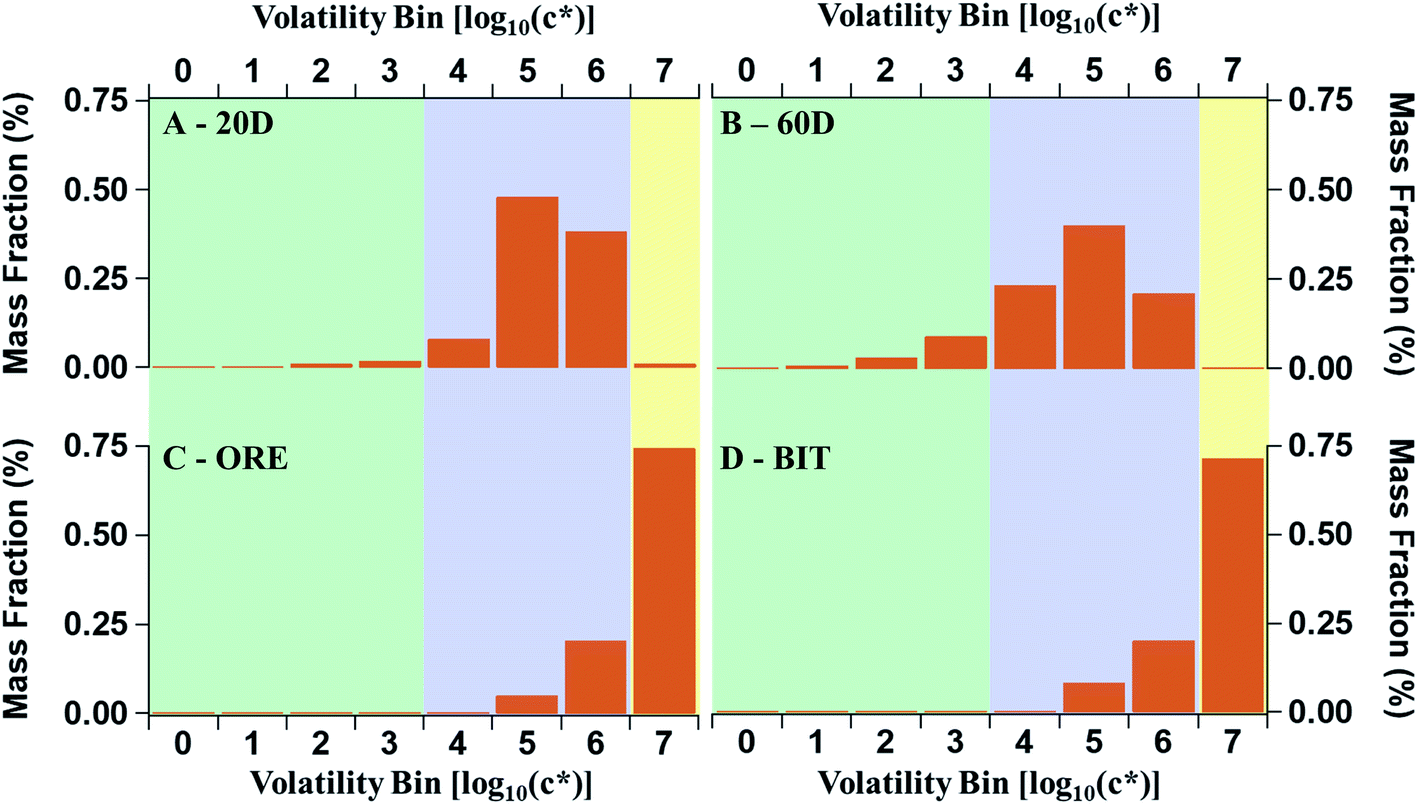 | ||
| Fig. 4 P-S/IVOC distributions according to different measurements and sources. P-S/IVOCs are binned into several saturation concentrations, c* at 298 K, to account for the average volatility of the complex mixtures. (A) and (B) are the 20 and 60 °C headspace volatility distribution of raw oil sands material, respectively, as described by Liggio et al. 2016. (C) and (D) represent the ore and bitumen headspace distributions, respectively, described in Li et al. 2019. | ||
Instead, we use a different approach to estimate the initial concentrations of P-IVOCs in the box model for the ORE and BIT parameterizations. Additional measurements of non-methane organic gases (NMOG), CO2, and NOy were taken from 30 flights over several oil sands facilities across Alberta in April and June of 2018. Flights 17, 19, 20, and 21 in 2018 include emission-tracking box flights around open pit mining facilities over the Athabasca oil sands. Downwind measurements from the above flights were used to calculate an average NMOG:(NOy + CO2) emission ratio using a two-parameter linear fit. In flights designed to determine emissions from the oil sands facilities, NMOG is moderately well correlated with NOy and CO2 (Fig. S1(C)†), and an emissions factor of NMOGppbv = 0.037 × NOy,ppbv + 0.033 × CO2,ppmv is determined. The ratio IVOC:ΔNMOG determined from the measurements of Li et al. (2019) for the ore and bitumen samples is multiplied by predicted emissions of NMOG (estimated from NOy and CO2) for the oil sands to estimate the initial IVOC concentration in each flight for the box model. More specifically, from the work of Li et al. (2019), we estimate IVOC:ΔNMOG emission ratios of 34.6 ppbvIVOC:ppmvNMOG and 22.4 ppbvIVOC:ppmvNMOG for ore and bitumen, respectively. Once the initial IVOC concentration is estimated using the two emissions ratios, the mass is distributed using the volatility distribution for ORE or BIT shown in Fig. 4. Further details about the ORE and BIT parameterizations are provided in the ESI.†
Generally, in this work, we use a VBS to explore the oxidation and partitioning of P-S/IVOC species from the oil sands. This has both inherent advantages and disadvantages. As an advantage, we have documented volatilities of P-S/IVOCs from oil sands sources available in previous literature.21,27 Additionally, a VBS approach can be simplified and portions of this model can be incorporated into chemical transport models in future work. As a disadvantage, a VBS approach has limited chemical detail, which may be better described by a more chemically speciated SOA model. However, there is a lack of detailed speciation of P-S/IVOCs from the oil sands currently available in the literature to facilitate a more complex approach. The VBS approach has been successfully developed for urban sources. For the oil sands, the VK diagram (Fig. S3A†) has a slope similar to urban settings, as previously stated in Section 2.4, which suggests that the VBS approach can also be successfully applied to modelling oil sands SOA.
3. Results and discussion
We evaluate the model in three sections. In the first section, we describe the model in general terms. In brief, we discuss the common model–measurement performance and trends, for OA concentrations and O:C ratios within the model, without specifically discussing the different volatility distributions or model parameterizations which define the input and mechanisms in the model. In the second section, we evaluate each of the four model ensembles which are driven by the different published volatility distributions of P-S/IVOCs (Fig. 4). In the third and final section, we explore the uncertain model parameterizations which are combined in each ensemble. Specifically, the relative variation in model-predicted OA is evaluated for the different parameterizations of SOA formation using a case study corresponding to a single flight.
3.1. General description of model predictions
In Fig. 5, model–measurement comparison plots for flights 19 and 20 are shown, separated by the input volatility distribution of P-S/IVOC sources. Generally, the measured OA concentrations for flight 19 exceed that of flight 20. In the model simulation, this is due to higher BC, CO2, and NOy initial concentrations in flight 19 driving higher concentrations of SOA sourced from P-IVOCs (I-SOA) – and higher concentrations of SOA sourced from P-SVOCs (S-SOA) for the models using the 20D or 60D volatility distributions. Additionally, reduced measured concentrations of traditional anthropogenic VOCs in flight 20 contribute to reduced OA concentrations. When implemented in the ensemble model, there is no volatility distribution that has a median OA concentration of the ensemble model (solid black line) that is within the measurement uncertainty for all transects of both flights. Additionally, Fig. S5† details OA normalized to background-subtracted BC to demonstrate the continued formation of SOA during a photochemical day, once the impact of dilution is accounted for.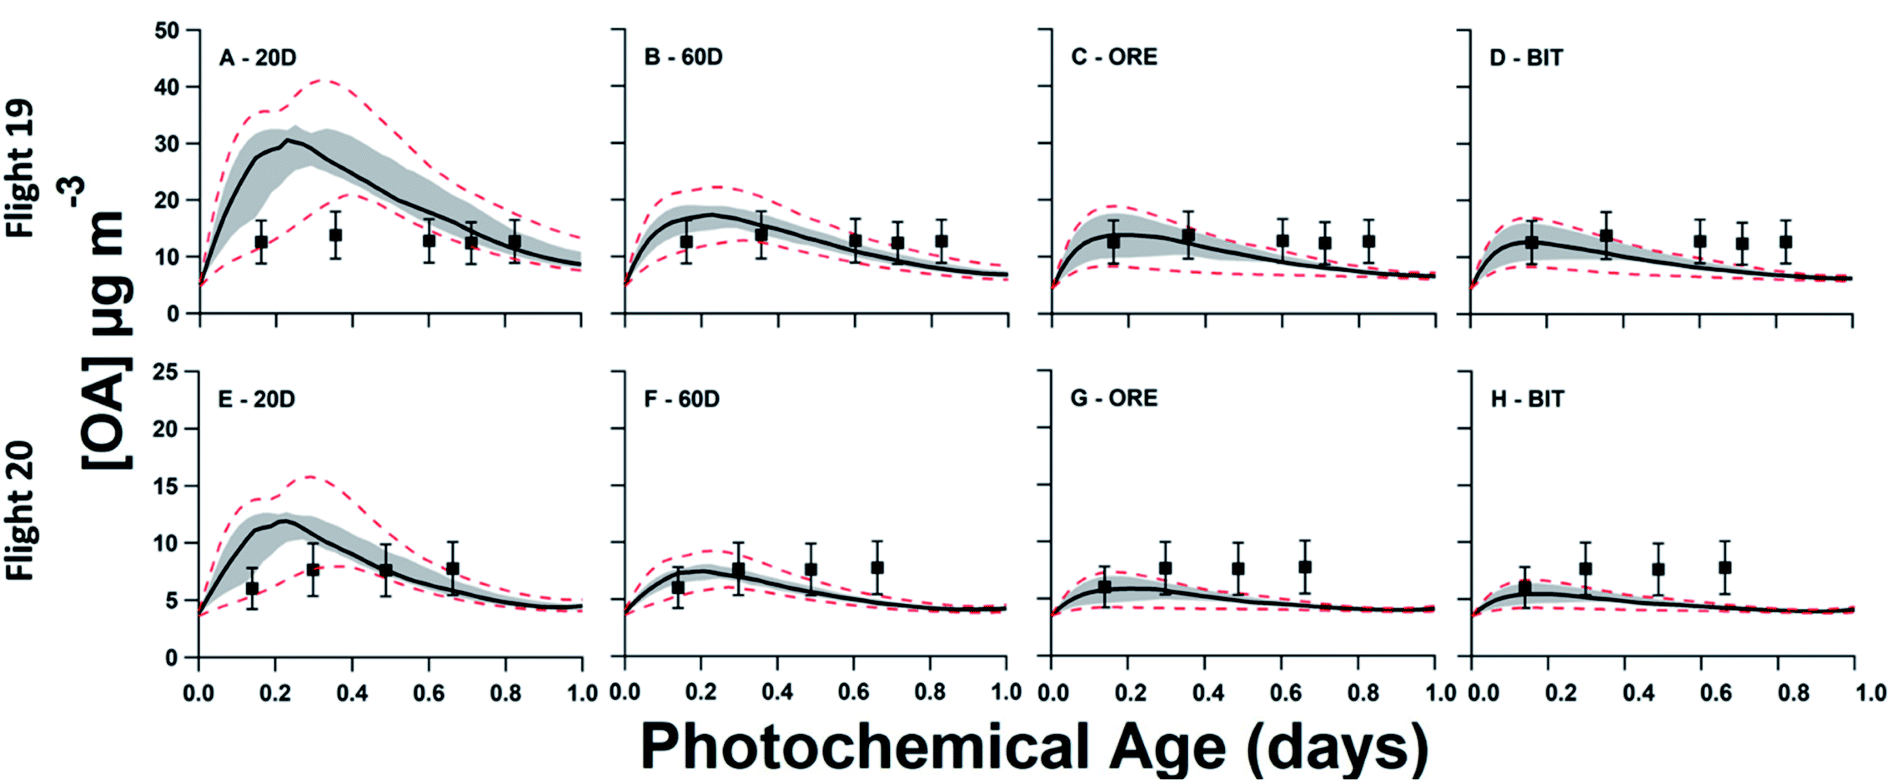 | ||
| Fig. 5 Ensemble model–measurement comparison of organic aerosol formation and evolution vs. photochemical age, comparing the four evaluated volatility distributions of P-S/IVOCs. For model results, the median (50th percentile) line is depicted as a black line, surrounded by the 25th to 75th percentile range, shaded in grey. The 95th and 5th percentile results are depicted by the dashed lines. The top row represents ensemble results for flight 19 in the 2013 JOSM campaign, while the bottom row represents results for flight 20. All measurements, described with black squares are ± 30%, representing the measurement uncertainty. (A) and (B) use the volatility distributions previously described in Liggio et al. (2016) for the bitumen deposits heated to 20 and 60 °C, respectively. (C) and (D) use the volatility distributions of emissions from raw ore and bitumen, respectively, as described in Li et al. 2019. (E) through (H) represent the same ensemble runs as (A) through (D) for flight 20. | ||
The 20D (A, E) and 60D (B, F) plots depict a bimodal evolution of OA, with a large initial peak within 0.2 photochemical days, followed by a second peak between 0.3 and 0.6 photochemical days, though the secondary peaks are more pronounced in the 20D panels. The origin of the two peaks is the inclusion of the two P-IVOC oxidation parameterizations, SLOW and FAST, in the model ensemble. The SLOW parameterization exhibits slower oxidation and I-SOA formation and is responsible for the second peak in the model ensemble OA. Meanwhile the FAST parameterization exhibits rapid oxidation of P-IVOC into IVOC-sourced SVOCs (I-SVOC). Ultimately, FAST provides higher I-SOA concentrations at short photochemical ages, while SLOW provides higher I-SOA concentrations at longer photochemical ages, which leads to the two-peak structure of the model ensemble. The ORE (C, G) and BIT (D, H) plots show little variation, with the ORE peak slightly exceeding the BIT peak, which is a result of higher P-IVOC concentrations in the highest volatility bin (log(c*) = 7), whose mass is treated identically to lower volatility bin species in the FAST parameterization.
The variation of the O:C and H:C ratios inside and outside the plume is demonstrated in Fig. S3(B).† Within the plume, the H:C ratio is higher than the out-of-plume background, while the O:C is lower within the plume than in the background. This pattern occurs as fresh, less oxidized, oil sands SOA is mixed with the more aged background SOA. In Fig. S6,† the ensemble model particle-phase O:C are plotted versus measurements taken within the plumes. Generally, the 20D volatility distribution exhibits the largest variation in O:C versus photochemical age within the ensemble, followed by the 60D volatility distribution. The larger range of predicted O:C in the 20D and 60D volatility distributions relative to ORE and BIT is caused by the larger concentrations of I-SOA and S-SOA. The low O:C ratios of POA, S-SOA, and less aged I-SOA, which are more prevalent in the model ensembles using the 20D and 60D volatility distributions, drive the lower average O:C versus the model ensembles using the ORE and BIT distributions. In most cases, the 50th percentiles of the ensembles lie within the measurement uncertainty, except at short photochemical ages for the model ensembles using the ORE and BIT distributions in flight 19.
In Fig. S7,† the components which constitute the combined O:C ratio are described for the base case study (AGE + SLOW + 1P + F_ON + FIXED) with the 60D and BIT volatility distributions. In both cases, the high O:C background is mixed with the rapidly formed V-SOA, which also has a high O:C. While the O:C ratio of POA, S-SOA, and I-SOA is very low at short photochemical ages, the concentration of those combined sources is also very low. In the 60D case, the POA + S-SOA + I-SOA fraction becomes more important as an OA source at longer photochemical ages, but this is coupled with the increased O:C ratio of the POA + S-SOA + I-SOA source. Meanwhile, in the BIT case, the POA + S-SOA + I-SOA fraction is never the dominant source of OA. As a result, the combined O:C ratio stays relatively flat for both the 60D and BIT cases (and the same pattern holds for 20D and ORE), and within the measurement uncertainty of reported O:C ratios. Therefore, while O:C predictions are not a very useful diagnostic for evaluating model parameterizations, they are still useful for developing other aspects of the model. The largely accurate O:C ratio from the model adds confidence to our ability to use modelled O:C compared to measured background O:C to drive two-phase partitioning when applying the two-phase partitioning (2P) parameterization. The modelled O:C is also used in calculating the VAR multi-generational aging rate constant for S/IVOCs.
3.2. Evaluating SOA formation from different possible volatility distributions for organic emissions from the oil sands
In Fig. 5, the ORE and BIT volatility distributions result in a model that poorly predicts OA at longer ages, with all model runs underpredicting OA concentrations at longer ages in both flights. Additionally, the 50th percentile of the model ensemble is within the range of uncertainty of the measurements only during the first 0.4 photochemical days in both flights. By comparison, the OA concentrations predicted using the 20D volatility distribution are overestimated in the short ages of both flights, although model-measurement agreement is closer for flight 20. Finally, the 50th percentile of 60D distribution runs are within the measurement error for all but the final measurement of each flight. The favorable performance of the 60D distribution in the model ensemble is confirmed by exploring the root-mean-square-error (RMSE) of all model iterations, as described in Table S8.† The average RMSE for the ensemble model with the 20D volatility distribution is 7.93 μg m−3, while that for the 60D volatility distribution is 3.04 μg m−3. The model iterations with the BIT and ORE volatility distributions have similar RMSE averages (3.64 μg m−3 and 3.36 μg m−3, respectively), as both the input volatility distributions and output OA concentrations are very similar.In Table 2, the fraction of each organic aerosol source is provided. The difference between the Liggio et al. (2016) and Li et al. (2019) volatility distributions with respect to the resulting OA is evident from the simulated POA and S-SOA. At the second transect, the 60D model ensemble, which generally performs better than the other model ensembles, simulates that the combination of POA, S-SOA, and I-SOA makes up 64% of total OA. In comparison, the BIT distribution predicts the lowest fraction, 35%, while the 20D distribution predicts the highest fraction, 81%.
| Volatility distribution | POA share of total OA (%) | S-SOA share of total OA (%) | I-SOA share of total OA (%) | V-SOA share of total OA (%) |
|---|---|---|---|---|
| 20D | 0.27 ± 0.16 | 10.3 ± 3.8 | 70.0 ± 7.8 | 19.5 ± 6.3 |
| 60D | 0.41 ± 0.23 | 23.9 ± 5.9 | 39.8 ± 8.5 | 35.8 ± 9.7 |
| ORE | 0 | 0 | 43 ± 23 | 57 ± 23 |
| BIT | 0 | 0 | 35 ± 21 | 65 ± 21 |
Also, in Table 2, the difference between 20D and 60D is largest for the relative concentration of I-SOA, which is explained by the higher initial concentration of P-IVOC in the 20D model ensemble. 60D has a lower average volatility distribution, which should allow for more POA and SOA to be formed from P-SVOCs; however, the initial P-IVOC concentrations in 60D are lower than in the 20D model ensemble (107 μg m−3vs. 369 μg m−3 in flight 19). This is a result of the ratio of P-IVOCs to POA being lower for the 60D model ensemble than the 20D ensemble in combination with the initial concentrations of P-S/IVOCs being determined using their ratio to POA multiplied by the estimated POA concentration.
The 60D volatility distribution represents emissions from processes occurring at higher than ambient temperatures, such as in situ extraction or bitumen frothing. It is the most effective volatility distribution for modeling OA concentrations, and there is some support in the literature that P-S/IVOC emissions are coming from such “hot” sources.48 Specifically, principal component analysis (PCA) from Tokarek et al. (2018) suggests that IVOC sources are most likely the mining fleet, wet tailings ponds, surface exposed bitumen, and hot-water bitumen extraction.48 The relatively low CO and BC concentrations from the oil sands, relative to the POA and P-S/IVOC emissions, are evidence against the mine fleet being a major source of P-S/IVOCs, as off-road diesel engines have higher CO and BC emission factors, relative to P-S/IVOCs.21,60,61 In Li et al. (2019), the heavily processed P-S/IVOC sources and waste products (diluted bitumen and tailings ponds) primarily emit VOCs with limited P-S/IVOC emissions.27 This would suggest tailings ponds are minor sources of direct emissions of SOA precursors. However, recent work from Drollette et al. (2020) suggests that outgassed emissions from tailings ponds may be the primary source of SOA from the oil sands, based on laboratory studies.62 In the Drollete et al. (2020) study, laboratory measurements of the composition of tailings pond samples were used in a mass flux model to estimate that tailings ponds are responsible for an order of magnitude more SOA than emissions associated with hot-water bitumen extraction. Together, these findings from previous studies suggest that surface exposed bitumen or hot-water bitumen extraction may be a major source of SOA precursors, though there is likely a combination of many sources emitting SOA precursors, and the current scientific literature does not provide a clear consensus regarding this subject.
Meanwhile, the difference in modelled SOA is notable between the 20D and 60D volatility distributions of Liggio et al. (2016) and those measured by Li et al. (2019) for mined ore and refined bitumen from the oil sands. Both BIT and ORE volatility distributions, from Li et al. (2019), are much more skewed to the highly volatile range than the samples measured in Liggio et al. (2016), as described in Fig. 4. Ultimately, the bitumen and mined ore samples, as presented in Li et al. (2019), do not have volatility distributions that are consistent with the observations of SOA formation from the oil sands region. Importantly, observations are more consistent with there being an important fraction of S-SOA, which is not found in the ORE and BIT volatility distributions.
In Drollette et al. (2020), the authors provided another volatility distribution from direct emissions of P-S/IVOCs by using a benchtop batch extraction unit to simulate the hot-water extraction process used at the oil sands.62 After applying their SOA formation model, the authors estimated that the emissions from the batch extraction would be responsible for fewer than 10% of measured SOA from the oil sands. The volatility distribution of extraction emissions is similar to ORE, with a small amount of P-SVOCs detected in the emissions as well. We applied the ensemble model in this work to compare the effect of the volatility distribution from the batch extraction unit (BEU) to the other volatility distributions, using the POA/ΔBC emission ratio method for calculating initial P-S/IVOC concentrations. In Fig. S8,† the volatility distribution and the ensemble results from the BEU are presented. In the ensemble model, the BEU volatility distribution produces similar SOA concentrations as ORE, though with slightly enhanced SOA formation across all photochemical ages. The ORE and BIT volatility distributions were collected by similar methods as the BEU, though emissions from the ORE and BIT samples were not evaluated after simulating hot water extraction. Meanwhile, the BEU and the 60D volatility distributions represent hot water extraction processes at the oil sands, though the samples were collected differently. Further studies are needed to better characterize the emissions of organics when materials from the production line at the oil sands are heated.
Finally, to highlight the differences between the volatility distributions evaluated in our work, in Fig. 6 we directly compare each of the volatility distributions studied in this work using a single set of SOA formation parameterizations and data from a single flight, specifically Flight 19. This comparison highlights the biased-high concentrations of OA from 20D, and the biased-low concentrations of OA from ORE and BIT. Meanwhile, BEU reduces the biased-low model output compared to ORE, though the model is still biased-low. Finally, 60D provides the best overall model output, though OA concentrations are slightly low at longer photochemical ages.
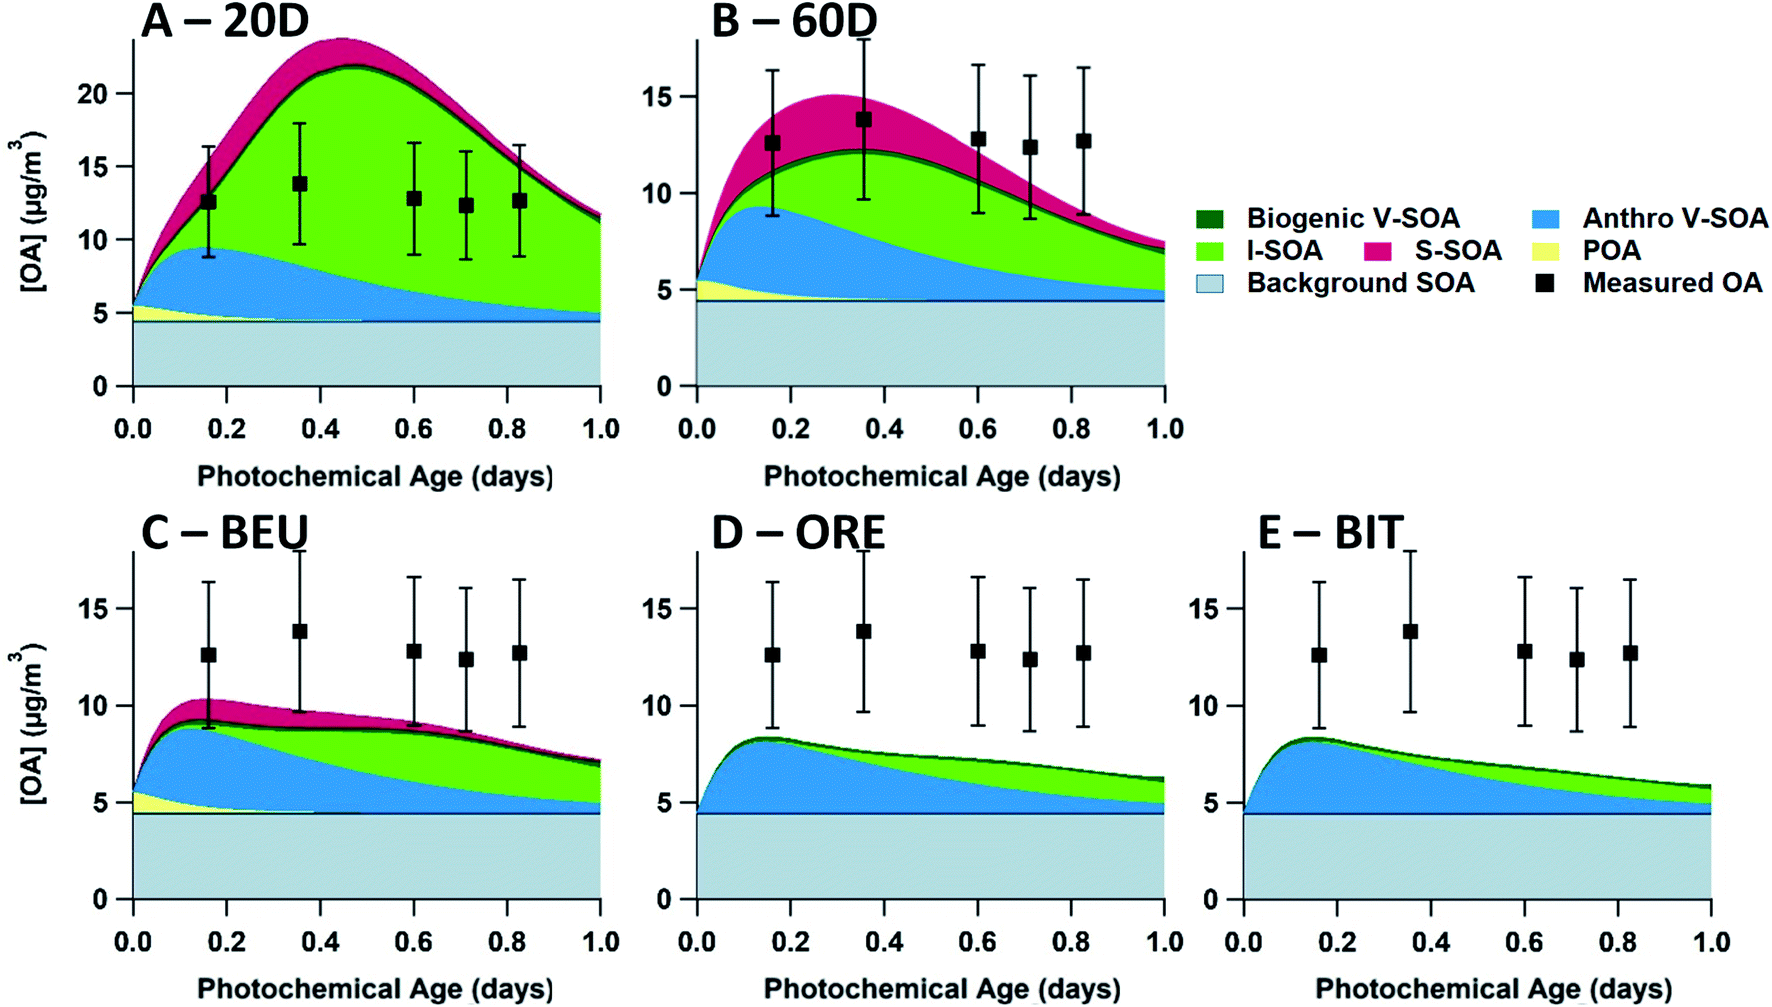 | ||
| Fig. 6 Evaluation of five volatility distributions used in the box model to initialize the P-S/IVOC emissions. Each figure uses the base case study (AGE + SLOW + 1P + F_ON + FIXED parameterizations). OA model-measurement comparisons are shown for the 20D (A), 60D (B), BEU (C), ORE (D), and BIT (E) volatility distributions during flight 19. Each measurement data point (black square) represents an aircraft transect perpendicular to the plume direction. In all runs, S-SOA represents SOA sourced from P-SVOCs, I-SOA represents SOA sourced from P-IVOCs, V-SOA represents SOA from traditional VOCs from anthropogenic and biogenic sources. Background OA represents the total OA in measurements from outside the plumes with a stable value of 4.5 μg m−3. All measurements have a ± 30% measurement uncertainty. | ||
In our study, we compare the calculated emissions of P-IVOCs from ORE to estimated P-IVOC emissions of the mine fleet. Unfortunately, there are few studies on the emissions of the diesel fleet at the oil sands. To meet NOx and PM2.5 standards, the fleet, as of 2013, is regulated using EPA Tier 1-4 standards for off-road diesel engine emissions.63 However, studies of direct emissions from oil sands vehicles have only been conducted with Tier 1 vehicles.64 Given this lack of information, it is reasonable to use published P-IVOC:ΔBC emission factors for off-road diesel vehicles in the United States, which have similar emission standards as the oil sands fleet.9,60,65 The P-IVOC:ΔBC emission factors from these previous studies of off-road diesel vehicles is 1.4 μg m−3/μg m−3, which is two orders of magnitude less than the oil sands, which has a total P-IVOC:ΔBC emission factor of 196 μg m−3/μg m−3.
3.3. Ensemble model parameterizations
In this section, we investigate the effect that each of the five uncertain parameterizations for SOA formation in the model have on the predicted OA concentration. We use as the base case the combination of SLOW + AGE + 1P + F_ON + FIXED parameterizations (Table 1), with P-S/IVOCs initiated by the 60D volatility distribution. We change only one parameterization at a time for comparison with the base case and leave the other four parameterizations the same as in the base case. The base case simulation for flight 19 is described in Fig. 7(A), along with simulations when the VOC oxidation, phase separation, fragmentation, and S/IVOC oxidation parameterizations are modified in panels B through E, respectively. The analogue for flight 20 is presented in the ESI (Fig. S9†). The P-IVOC parameterization is explored separately from the other parameterizations, in Fig. 9.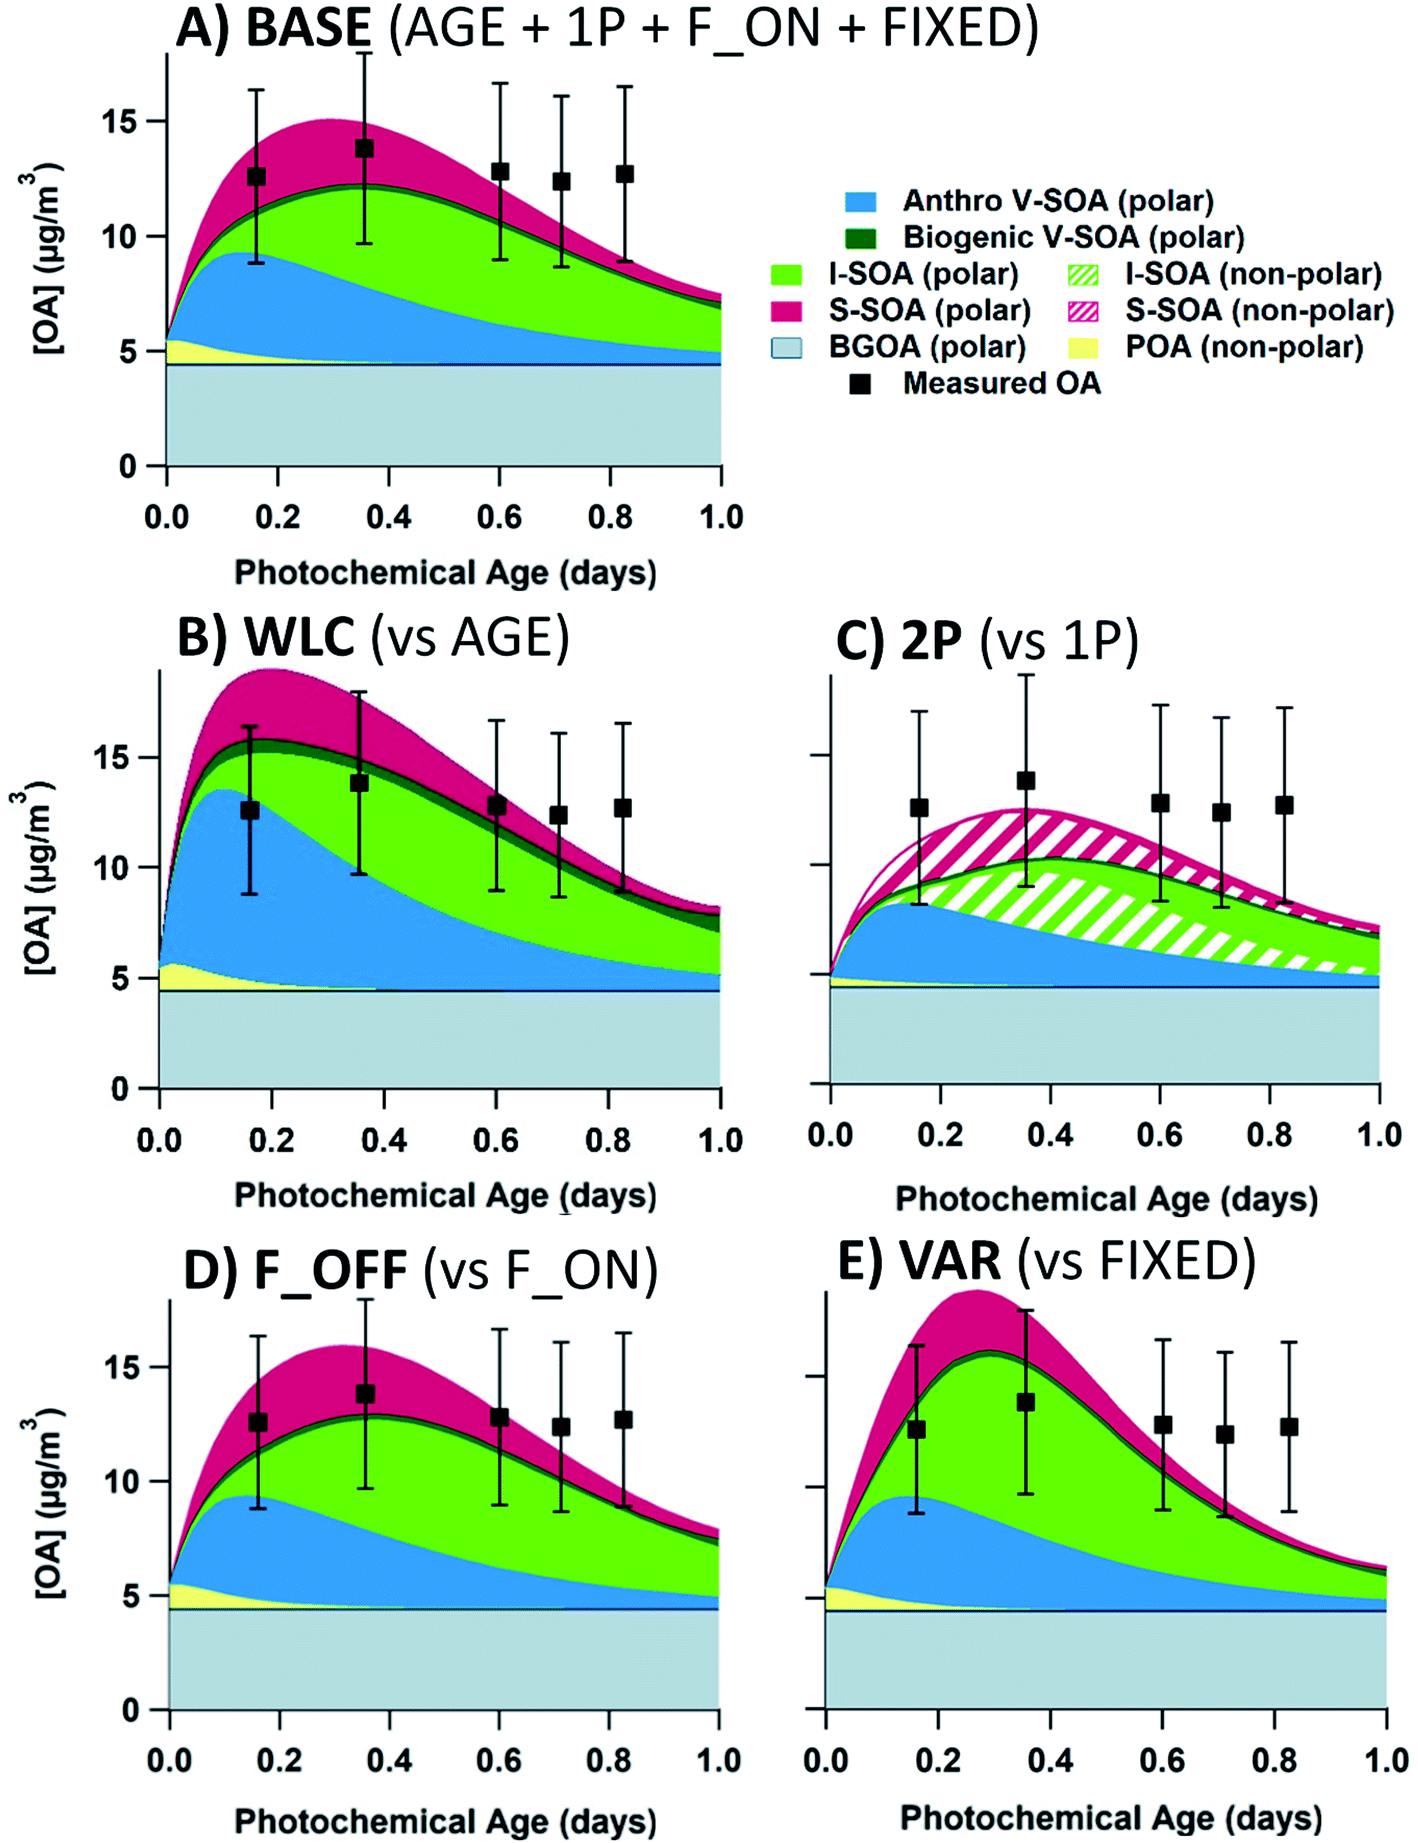 | ||
| Fig. 7 OA model-measurement comparisons of ensemble box model parameterizations compared to the base case (A). All case studies in this figure evaluate flight 19, with the 60D volatility distribution and the SLOW parameterization for P-IVOC oxidation. The base case uses the AGE + 1P + F_ON + FIXED parameterizations (Table 1). In panels (B) through (E), a single parameterization is altered, compared to the baseline. The P-VOC oxidation mechanism is changed to the WLC parameterization in (B). Phase separation is evaluated with the 2P parameterization in (C). Fragmentation is evaluated with the F_OFF parameterization in (D). S/IVOC oxidation rates are changed with the VAR parameterization in (E). Each measurement data point represents an aircraft transect perpendicular to the plume direction. In all runs, S-SOA represents SOA sourced from P-SVOCs, I-SOA represents SOA sourced from P-IVOCs, V-SOA represents SOA from traditional VOCs from anthropogenic and biogenic sources. Background OA represents the total OA in measurements from outside the plumes with a stable value of 4.5 μg m−3 for flight 19. All measurements have a ± 30% measurement uncertainty. | ||
In flight 19, the OA concentration when using the WLC parameterization is 18.5 μg m−3 at the first transect, exceeding the measured OA concentration of 12.6 μg m−3. Comparatively, for AGE, the first transect modelled OA concentration is 14.0 μg m−3. When comparing the AGE and WLC parameterizations, at short photochemical ages an increase in SOA concentrations of up to 50% is observed for WLC, which is consistent with the average biases of SOA yields from chamber experiments reported by Zhang et al. (2014).66 At the first transect, anthropogenic V-SOA makes up 58.4 and 48.2% of total SOA for the WLC and AGE model cases, respectively. In flight 20 (Fig. S9(B)†), the rapid formation of V-SOA in the WLC parameterization does not exceed measurement uncertainty, and there are no measurement transects where WLC is definitively superior to AGE. Generally, the AGE parameterization outperforms the WLC parameterization, though the differences are relatively minor. Recent field campaigns have concluded that OA formation at short photochemical ages is underestimated, possibly because models are based on chamber measurements which have not been corrected for wall-losses of SVOCs.16,32 However, for this study of SOA from the oil sands, using a corrected parameterization (i.e. WLC) actually worsens the model–measurement agreement.
:C threshold for partitioning of organic aerosol compounds into distinct liquid aerosol phases allows for a quantitative consideration of the effects of liquid–liquid phase separation on gas–particle partitioning, albeit in a simplified manner. A consequence of limited miscibility between at least two liquid phases, typically distinct hydrophobic and hydrophilic ones, is that the mass concentration of the preferred absorbing liquid phase (for a specific semi-volatile organic compound) will be reduced when compared to the predicted total organic mass in the aerosol assuming ideal mixing.68,69
Detailed calculations using a liquid–liquid equilibrium model for the mixing of background OA with SOA generated from oil sands vapour oxidation (using oxidized C12 to C25 alkanes as surrogate compounds), indicate that two liquid aerosol phases form at equilibrium (even in the absence of inorganic electrolyte components).46 The more polar phase is predicted to contain mainly oxidation products from biogenic background OA (e.g. isoprene- and monoterpene-derived SOA) as well as more oxidized oil sands SOA. The less polar phase predominantly consists of less oxidized but higher-molar-mass compounds from oil sands SOA.46
The case with two-phase partitioning for flight 19 is demonstrated in Fig. 7(C). In Fig. 7(C), all initial S-SOA (and POA) mass is partitioned into the non-polar phase, though with oxidative aging, and the dilution of less oxidized S-SOA, most S-SOA species are oxidized enough to partition into the polar phase by the final transect. At the shortest photochemical ages in both flights (see Fig. S9(C)†), most I-SOA is in the non-polar phase, though at the second and third transects, I-SOA is more evenly split between both phases. The maximum concentration of OA is reduced in the two-phase case, as the available mass for both polar and non-polar OA phases to partition into is reduced. This effect is more substantial at short photochemical ages when both phases are of about equal mass.
As a sensitivity study, the effect of the O:C threshold was studied using the full ensemble model with the 60D volatility distribution, and the resulting RMSE for the ensemble was plotted against the O:C threshold (Fig. 8A). A scan of O:C thresholds between 0.0 (only background OA in the “polar” phase) and 0.8 (all OA in the “polar” phase, which is equivalent to the one-phase partitioning parameterization, 1P) was performed. As the O:C threshold is increased, the OA-limiting effect of the two-phase solution is decreased. In other words, as the threshold increases, only the very least oxidized species (POA, lightly oxidized SOA) will be unable to partition into the larger polar phase. Fig. 8(A) demonstrates that the maximum difference between the 1P and 2P schemes exists when the O:C threshold is 0.5. The RMSE at O:C threshold = 0.5 is at its minimum of 2.64 μg m−3, while the 1P parameterization (O:C threshold > 0.7) is at 2.99 μg m−3. Notably, the reduced RMSE at certain O:C thresholds suggests that the 2P partitioning scheme more accurately represents SOA from the oil sands. However, the total effect of the liquid–liquid organic phase separation on SOA concentration is relatively minor, with a difference in RMSE that is less than 0.5 μg m−3.
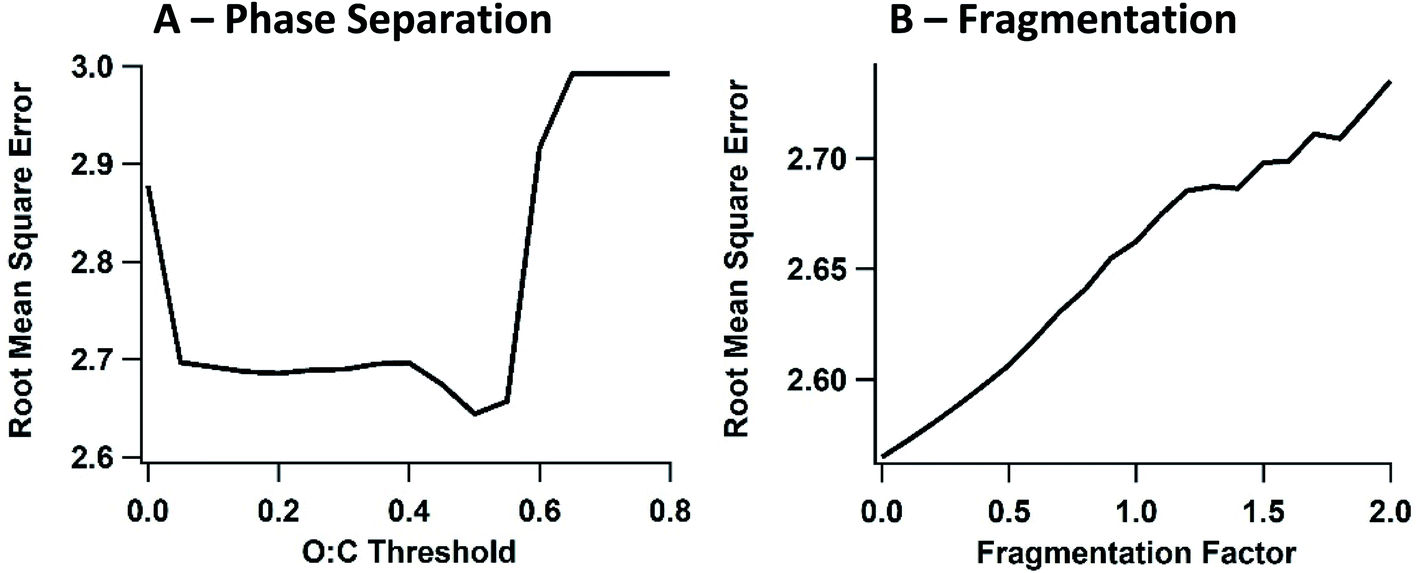 | ||
| Fig. 8 (A) Sensitivity study exploring the effect of the model cut-off for phase separation between polar and non-polar organic phases in the 2P parameterization, for the 60D volatility distribution. The O:C threshold is evaluated by root mean square error, between a threshold of 0.0 (all non-background OA is non-polar) and 0.8 (all OA is polar). (B) Sensitivity study exploring the loss of carbon atoms during decadal oxidation of SVOC and IVOC species, using the 60D volatility distribution and the model ensemble. The fragmentation factor, which varies between 0 and 2.0 times the rate of carbon atom loss in the F_ON parameterization, is plotted versus the root mean square error of the model OA prediction relative to measurements. The root mean square error is calculated using data from both flight 19 and 20. | ||
Including fragmentation in the model does not appear to have a large effect on the evolution of OA in this study. We show model results comparing the F_OFF and F_ON parameterization in Fig. 7(D). Overall, there is a very small effect on total OA concentrations, where the maximum effect occurs during the second transect in flight 19, where the F_ON parameterization has a concentration of 14.9 μg m−3, and the F_OFF parameterization has a concentration of 15.8 μg m−3.
As a sensitivity study, the effect of the magnitude of carbon loss during fragmentation steps is explored. With a similar approach as the sensitivity study for modulating the O:C threshold, the carbon number loss is scanned from 0.0 to 2.0 times the base case fragmentation loss, as demonstrated in Fig. 8(B). For example, the 0.5× run decreases the magnitude of carbon loss per oxidation step by half, so P-SVOC-sourced species lose 0.5 carbon atoms per oxidation. Similarly, the 2.0× run doubles the carbon loss per oxidation step, so P-SVOC-sourced species lose 2.0 carbon atoms per oxidation step. The same multiplier is applied to the carbon loss during oxidation for P-VOC-sourced and P-IVOC-sourced species. The more rapid reduction in carbon number with each oxidation step results in decreased total OA concentrations, and this reduces OA positive bias during flight 19, though the RMSE is worse as fragmentation increases due to greater negative bias for flight 20. However, similar to the partitioning sensitivity study, the total effect of varying the amount of fragmentation uncertainty is low, with a difference in the RMSE of less than 0.2 μg m−3. Additionally, this sensitivity study indicates that the model is relatively insensitive to the uncertainty in the calculated molecular weight, which is obtained by the parameterization of Donahue et al. (2011).47
Despite the poor results in the test case in Fig. 7(E), the VAR parameterization is occasionally an improvement compared to FIXED. In Table S8,† the performance of all model simulations, as measured by RMSE, is presented for the combined nine transects of flights 19 and 20. The VAR parameterization leads generally to slightly decreased performance for the 60D volatility distribution. However, VAR does provide an improvement over FIXED for the ORE and BIT volatility distributions, when used in conjunction with the SLOW parameterization for P-IVOC oxidation. The improvement in the ORE and BIT cases are driven by model runs where the BIT and ORE volatility distributions lead to biased-low OA concentrations at short photochemical ages when using the FIXED parameterization, and the more rapid SOA formation driven by VAR improves the OA model at those short ages without exceeding the measurements, as is the case when the 20D and 60D volatility distributions are used. Ultimately, the relative performance of the two parameterizations for the aging rates of S-SOA and I-SOA depends on the other parameterizations used in the model, and thus there is no “best” parameterization.
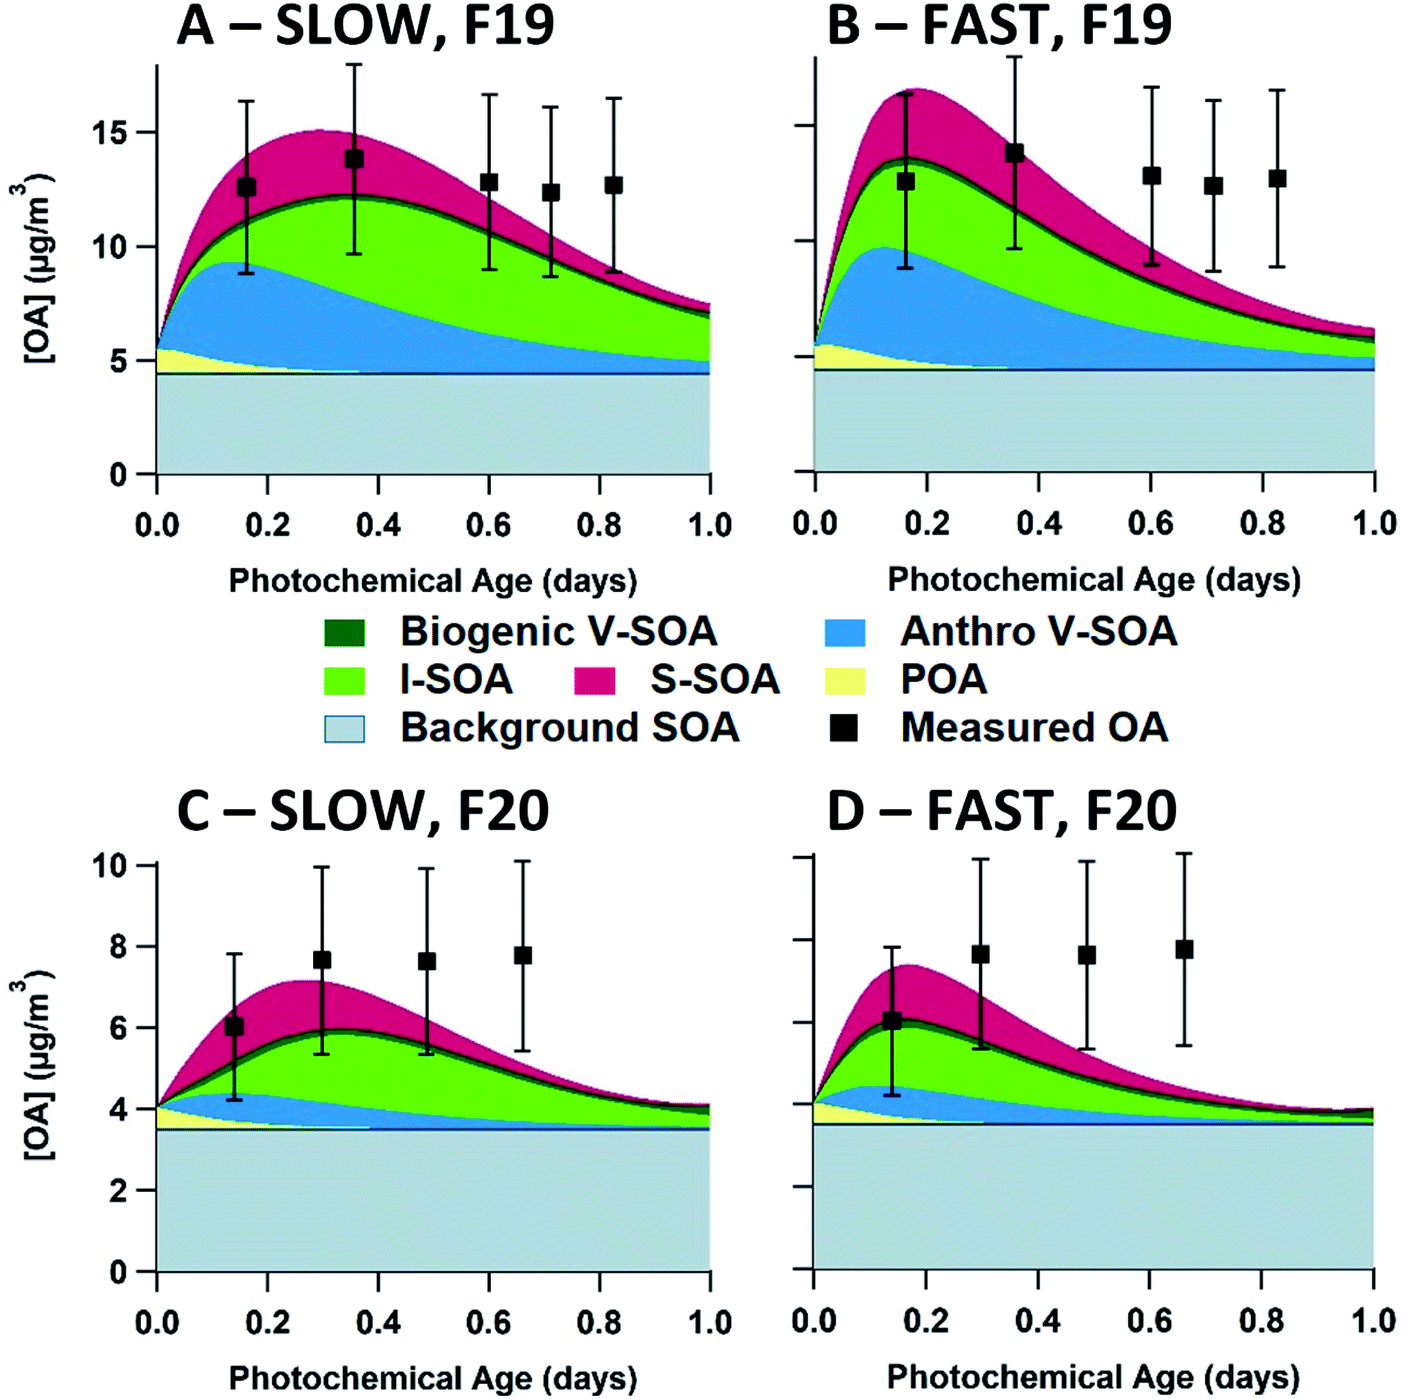 | ||
| Fig. 9 Evaluation of two P-IVOC oxidation mechanisms in SOA box model simulations using the AGE + 1P + F_ON + FIXED + 60D parameterizations. The flight 19 evaluation is on the top row, while the flight 20 evaluation is on the bottom row. OA model-measurement comparisons are shown for the SLOW (A/C) and FAST (B/D) parameterizations for P-IVOC oxidation. Each measurement data point (black square) represents an aircraft transect perpendicular to the plume direction. In all runs, S-SOA represents SOA sourced from P-SVOCs, I-SOA represents SOA sourced from P-IVOCs, V-SOA represents SOA from traditional VOCs from anthropogenic and biogenic sources. Background OA represents the total OA in measurements from outside the plumes with a stable value of 4.5 μg m−3 and 3.5 μg m−3 for flights 19 and 20, respectively. All measurements have a ± 30% measurement uncertainty. | ||
4. Conclusions
Above the Athabasca oil sands, aircraft measurements provide clear evidence that the atmospheric oxidation of organic precursors is leading to extensive SOA formation.21 As suggested by the VK diagrams presented in this work, the SOA formation at the oil sands has some similarity to that observed in urban regions, specifically, the evolution of the O:C and H:C ratios.16,17,34,53 However, the identities of the SOA precursors between the oil sands and urban sites are different. At the oil sands, the composition of emitted hydrocarbons is more heavily weighted towards IVOCs and SVOCs than is typical for urban sites, which may allow total hydrocarbon emissions to be somewhat lower at the oil sands (compared to urban sites), while still forming similar amounts of SOA mass.21 Therefore, SOA models specific to the Athabasca oil sands need to be developed that accurately parameterize both the volatility distribution of the organic precursors as well as the atmospheric oxidation of these compounds to produce SOA.
We used an ensemble of SOA model parameterizations to evaluate four volatility distributions of P-S/IVOCs measured from sources in the Alberta oil sands region. Generally, the ensemble model with the 20D volatility distribution results in model SOA that is biased-high, while the ORE and BIT volatility distributions result in model SOA that is biased-low, especially at longer photochemical ages. Meanwhile, the 60D volatility distribution performs the best at both short and long photochemical ages. However, connecting the 60D volatility distribution to a specific extraction or refinement process at the oil sands is difficult. It is possible that the P-S/IVOC emissions predicted from the 60D distribution represent the emissions from hot-water bitumen extraction. If so, then this work suggests that the emissions of P-S/IVOCs are more strongly linked to the active mining and extraction of the oil sands. However, more information is required to identify the specific sources of P-S/IVOCs within the oil sands operations, as the totality of SOA precursor emissions likely come from a wide range of sources.
In addition, there is a lack of detailed information regarding the composition of P-S/IVOCs emitted from the oil sands, which would be very valuable for constraining SOA models. For example, the P-IVOC parameterizations of FAST and SLOW were based on studies of diesel combustion emissions, which are not a major source at the oil sands, and do not necessarily have the same composition as oil sands emissions.13,29 In previous work, we have explored a more detailed approach when speciated P-S/IVOC emissions are available.32
The model ensemble in this work is comprised of five uncertain parameterizations, each having specific assumptions and associated uncertainties. Each component parameterization was individually evaluated against SOA measurements in a series of sensitivity studies to understand the relative importance of their uncertainties on SOA predictions. Within this work, the volatility distribution for P-S/IVOCs introduces the most variation in model results; however, the P-IVOC treatment provides a similar range of variation. Particularly, the SLOW and FAST parameterizations have a large impact on the spatiotemporal variation in SOA formation, and the SLOW parameterization generally provides more accurate model results. Additionally, the P-VOC oxidation parameterization (AGE vs. WLC) and the multi-generational reaction rate constant parameterization (FIXED vs. VAR) explored in this work have an important effect on the magnitude of modelled SOA concentrations, though they have a smaller effect on the “shape” of SOA evolution over time than the P-IVOC oxidation treatment.
In contrast, the SOA predictions are less sensitive to the other component parameterizations of the model. Our simple parameterization for liquid–liquid phase separation (2P) has a larger impact at short photochemical ages, when low-O:C fresh SOA cannot partition into the background OA, and a smaller impact at longer photochemical ages as the oxidation products of P-IVOCs and P-SVOCs have more time to oxidize and to reach O:C values that allow mixing with the background OA. However, when comparing the 2P parameterization against the parameterization without liquid–liquid phase separation of OA (1P), the model errors are found to be similar indicating that model accuracy does not strongly depend on how this component of the model is implemented. Similarly, the treatment of molecular fragmentation has only a minor impact on SOA model accuracy in the oil sands region, as including fragmentation (F_ON), even with very high carbon atom loss rates, does not substantially change SOA prediction accuracy relative to the parameterization without fragmentation (F_OFF).
In future work, the optimal volatility distribution for oil sands emissions and optimal SOA parameterizations (60D and SLOW + AGE + 1P + F_OFF + FIXED) can be incorporated directly into a chemical transport model such as GEM-MACH to provide more accurate 3-D predictions of OA in the oil sands region.55 Nonetheless, there are several other aspects of OA formation and evolution that should be explored with the box model approach used here to build on the work presented in this manuscript. As shown in Fig. 5, most model realizations show poorer agreement with observations at longer photochemical ages than at shorter photochemical ages. The exception is the 20D volatility distribution, which itself leads to poor agreement at shorter photochemical ages. Generally, the model predicts rapid formation of SOA, followed by a relatively rapid decline in OA concentrations, driven by dilution and evaporation. In this model, we do not account for the viscosity of OA particles, which may affect the ability for semi-volatile OA to evaporate, due to mass-transfer limitations.73 Applying a more sophisticated gas-particle partitioning model to the gas-phase SVOC formation parameterizations in this work would be informative to evaluate this possibility. Additionally, this work only accounts for the gas-phase oxidation of OA, and does not attempt to model oligomerization reactions within the particle.74,75 It may be that the extremely low volatility organics formed from these reactions would reduce the amount of OA evaporation as the plume is diluted.
Author contributions
Modeling experiments and data analysis were conceived by JMS and PLH, and carried out by JMS under the supervision of CAS and PLH. Methodology was developed by JMS, RGS, and PLH. Field and laboratory experiments and data curation were performed by MGA, JOB, JRB, KH, AKYL, KL, JL, CM, RLM, and MW. Writing the original draft was performed by JMS, AZ, and PLH. All authors contributed in part to the discussion, review, and editing of the manuscript. All authors have given approval to the final version of the manuscript.Conflicts of interest
The authors declare no competing financial interest.Acknowledgements
Funding for this work was provided by the Natural Sciences and Engineering Research Council of Canada (NSERC), Environment and Climate Change Canada (ECCC), and the Oil Sands Monitoring (OSM) Program. It is independent of any position of the OSM Program. JMS, AZ and PLH acknowledge funding support from le Fonds de recherche – Nature et technologies (FRQNT) du Québec (2016-PR-192364). JMS and PLH were also supported by a Natural Science and Engineering Research Council of Canada (NSERC) Discovery Grant (RGPIN/05002-2014). RGS and PLH were also supported by Le ministre de l'Environnement et de la Lutte contre les changements climatiques du Québec (MELCC). AKYL and MGA were supported by the National University of Singapore start-up grant (R-302-000-173-133).References
- C. A. Pope and D. W. Dockery, Health effects of fine particulate air pollution: Lines that connect, J. Air Waste Manage. Assoc., 2006, 56, 709–742 CrossRef CAS PubMed.
- A. Nel, Air Pollution-Related Illness: Effects of Particles, Science, 2005, 308, 804–806 CrossRef CAS PubMed.
- IPCC, Climate Change 2014: Synthesis Report. Contribution of Working Groups I, II and III to the Fifth Assessment Report of the Intergovernmental Panel on Climate Change, Geneva, Switzerland, 2014 Search PubMed.
- J. Ma, Atmospheric transport of persistent semi-volatile organic chemicals to the Arctic and cold condensation in the mid-troposphere – Part 1: 2-D modeling in mean atmosphere, Atmos. Chem. Phys., 2010, 10, 7303–7314 CrossRef CAS.
- H. Zhao, X. Li, Q. Zhang, X. Jiang, J. Lin, G. P. Peters, M. Li, G. Geng, B. Zheng, H. Huo, L. Zhang, H. Wang, S. J. Davis and K. He, Effects of atmospheric transport and trade on air pollution mortality in China, Atmos. Chem. Phys., 2017, 17, 10367–10381 CrossRef CAS.
- J. L. Jimenez, M. R. Canagaratna, N. M. Donahue, A. S. H. Prevot, Q. Zhang, J. H. Kroll, P. F. DeCarlo, J. D. Allan, H. Coe, N. L. Ng, A. C. Aiken, K. S. Docherty, I. M. Ulbrich, A. P. Grieshop, A. L. Robinson, J. Duplissy, J. D. Smith, K. R. Wilson, V. A. Lanz, C. Hueglin, Y. L. Sun, J. Tian, A. Laaksonen, T. Raatikainen, J. Rautiainen, P. Vaattovaara, M. Ehn, M. Kulmala, J. M. Tomlinson, D. R. Collins, M. J. Cubison, J. Dunlea, J. A. Huffman, T. B. Onasch, M. R. Alfarra, P. I. Williams, K. Bower, Y. Kondo, J. Schneider, F. Drewnick, S. Borrmann, S. Weimer, K. Demerjian, D. Salcedo, L. Cottrell, R. Griffin, A. Takami, T. Miyoshi, S. Hatakeyama, A. Shimono, J. Y. Sun, Y. M. Zhang, K. Dzepina, J. R. Kimmel, D. Sueper, J. T. Jayne, S. C. Herndon, A. M. Trimborn, L. R. Williams, E. C. Wood, A. M. Middlebrook, C. E. Kolb, U. Baltensperger and D. R. Worsnop, Evolution of Organic Aerosols in the Atmosphere, Science, 2009, 326, 1525–1529 CrossRef CAS PubMed.
- M. Hallquist, J. C. Wenger, U. Baltensperger, Y. Rudich, D. Simpson, M. Claeys, J. Dommen, N. M. Donahue, C. George, A. H. Goldstein, J. F. Hamilton, H. Herrmann, T. Hoffmann, Y. Iinuma, M. Jang, M. E. Jenkin, J. L. Jimenez, A. Kiendler-Scharr, W. Maenhaut, G. McFiggans, T. F. Mentel, A. Monod, A. S. H. Prévôt, J. H. Seinfeld, J. D. Surratt, R. Szmigielski and J. Wildt, The formation, properties and impact of secondary organic aerosol: current and emerging issues, Atmos. Chem. Phys., 2009, 9, 5155–5236 CrossRef CAS.
- J. De Gouw and J. L. Jimenez, Organic aerosols in the earth's atmosphere, Environ. Sci. Technol., 2009, 43, 7614–7618 CrossRef CAS PubMed.
- D. R. Gentner, G. Isaacman, D. R. Worton, A. W. H. Chan, T. R. Dallmann, L. Davis, S. Liu, D. A. Day, L. M. Russell, K. R. Wilson, R. Weber, A. Guha, R. A. Harley and A. H. Goldstein, Elucidating secondary organic aerosol from diesel and gasoline vehicles through detailed characterization of organic carbon emissions, Proc. Natl. Acad. Sci. U. S. A., 2012, 109, 18318–18323 CrossRef CAS PubMed.
- Y. Zhao, C. J. Hennigan, A. A. May, D. S. Tkacik, J. A. De Gouw, J. B. Gilman, W. C. Kuster, A. Borbon and A. L. Robinson, Intermediate-volatility organic compounds: A large source of secondary organic aerosol, Environ. Sci. Technol., 2014, 48, 13743–13750 CrossRef CAS PubMed.
- Y. Zhao, N. T. Nguyen, A. A. Presto, C. J. Hennigan, A. A. May and A. L. Robinson, Intermediate Volatility Organic Compound Emissions from On-Road Gasoline Vehicles and Small Off-Road Gasoline Engines, Environ. Sci. Technol., 2016, 50, 4554–4563 CrossRef CAS PubMed.
- Y. Zhao, N. T. Nguyen, A. A. Presto, C. J. Hennigan, A. A. May and A. L. Robinson, Intermediate Volatility Organic Compound Emissions from On-Road Diesel Vehicles: Chemical Composition, Emission Factors, and Estimated Secondary Organic Aerosol Production, Environ. Sci. Technol., 2015, 49, 11516–11526 CrossRef CAS PubMed.
- S. H. Jathar, T. D. Gordon, C. J. Hennigan, H. O. T. Pye, G. Pouliot, P. J. Adams, N. M. Donahue and A. L. Robinson, Unspeciated organic emissions from combustion sources and their influence on the secondary organic aerosol budget in the United States, Proc. Natl. Acad. Sci. U. S. A., 2014, 111, 10473–10478 CrossRef CAS PubMed.
- B. C. McDonald, J. A. De Gouw, J. B. Gilman, S. H. Jathar, A. Akherati, C. D. Cappa, J. L. Jimenez, J. Lee-Taylor, P. L. Hayes, S. A. McKeen, Y. Y. Cui, S.-W. W. Kim, D. R. Gentner, G. Isaacman-VanWertz, A. H. Goldstein, R. A. Harley, G. J. Frost, J. M. Roberts, T. B. Ryerson and M. Trainer, Volatile chemical products emerging as largest petrochemical source of urban organic emissions, Science, 2018, 359, 760–764 CrossRef CAS PubMed.
- P. L. Hayes, A. M. Ortega, M. J. Cubison, K. D. Froyd, Y. Zhao, S. S. Cliff, W. W. Hu, D. W. Toohey, J. H. Flynn, B. L. Lefer, N. Grossberg, S. Alvarez, B. Rappenglück, J. W. Taylor, J. D. Allan, J. S. Holloway, J. B. Gilman, W. C. Kuster, J. A. De Gouw, P. Massoli, X. Zhang, J. Liu, R. J. Weber, A. L. Corrigan, L. M. Russell, G. Isaacman, D. R. Worton, N. M. Kreisberg, A. H. Goldstein, R. Thalman, E. M. Waxman, R. Volkamer, Y. H. Lin, J. D. Surratt, T. E. Kleindienst, J. H. Offenberg, S. Dusanter, S. Griffith, P. S. Stevens, J. Brioude, W. M. Angevine and J. L. Jimenez, Organic aerosol composition and sources in Pasadena, California, during the 2010 CalNex campaign, J. Geophys. Res. Atmos., 2013, 118, 9233–9257 CrossRef.
- J. C. Schroder, P. Campuzano-Jost, D. A. Day, V. Shah, K. Larson, J. M. Sommers, A. P. Sullivan, T. Campos, J. M. Reeves, A. Hills, R. S. Hornbrook, N. J. Blake, E. Scheuer, H. Guo, D. L. Fibiger, E. E. McDuffie, P. L. Hayes, R. J. Weber, J. E. Dibb, E. C. Apel, L. Jaeglé, S. S. Brown, J. A. Thornton and J. L. Jimenez, Sources and Secondary Production of Organic Aerosols in the Northeastern United States during WINTER, J. Geophys. Res. Atmos., 2018, 123, 7771–7796 CrossRef CAS.
- R.-J. Huang, Y. Zhang, C. Bozzetti, K.-F. Ho, J.-J. Cao, Y. Han, K. R. Daellenbach, J. G. Slowik, S. M. Platt, F. Canonaco, P. Zotter, R. Wolf, S. M. Pieber, E. A. Bruns, M. Crippa, G. Ciarelli, A. Piazzalunga, M. Schwikowski, G. Abbaszade, J. Schnelle-Kreis, R. Zimmermann, Z. An, S. Szidat, U. Baltensperger, I. El Haddad and A. S. H. Prévôt, High secondary aerosol contribution to particulate pollution during haze events in China, Nature, 2014, 514, 218–222 CrossRef CAS PubMed.
- A. C. Aiken, D. Salcedo, M. J. Cubison, J. A. Huffman, P. F. DeCarlo, I. M. Ulbrich, K. S. Docherty, D. Sueper, J. R. Kimmel, D. R. Worsnop, A. Trimborn, M. Northway, E. A. Stone, J. J. Schauer, R. M. Volkamer, E. Fortner, B. de Foy, J. Wang, A. Laskin, V. Shutthanandan, J. Zheng, R. Zhang, J. Gaffney, N. A. Marley, G. Paredes-Miranda, W. P. Arnott, L. T. Molina, G. Sosa and J. L. Jimenez, Mexico City aerosol analysis during MILAGRO using high resolution aerosol mass spectrometry at the urban supersite (T0) – Part 1: Fine particle composition and organic source apportionment, Atmos. Chem. Phys., 2009, 9, 6633–6653 CrossRef CAS.
- Q. Chen, Y. Miyazaki, K. Kawamura, K. Matsumoto, S. Coburn, R. Volkamer, Y. Iwamoto, S. Kagami, Y. Deng, S. Ogawa, S. Ramasamy, S. Kato, A. Ida, Y. Kajii and M. Mochida, Characterization of Chromophoric Water-Soluble Organic Matter in Urban, Forest, and Marine Aerosols by HR-ToF-AMS Analysis and Excitation − Emission Matrix Spectroscopy, Environ. Sci. Technol., 2016, 50, 10351–10360 CrossRef CAS PubMed.
- S. S. Brown, W. P. Dubé, R. Bahreini, A. M. Middlebrook, C. A. Brock, C. Warneke, J. A. De Gouw, R. A. Washenfelder, E. Atlas, J. Peischl, T. B. Ryerson, J. S. Holloway, J. P. Schwarz, R. Spackman, M. Trainer, D. D. Parrish, F. C. Fehshenfeld and A. R. Ravishankara, Biogenic VOC oxidation and organic aerosol formation in an urban nocturnal boundary layer: Aircraft vertical profiles in Houston, TX, Atmos. Chem. Phys., 2013, 13, 11317–11337 CrossRef CAS.
- J. Liggio, S.-M. Li, K. Hayden, Y. M. Taha, C. Stroud, A. Darlington, B. D. Drollette, M. Gordon, P. Lee, P. Liu, A. Leithead, S. G. Moussa, D. Wang, J. O'Brien, R. L. Mittermeier, J. R. Brook, G. Lu, R. M. Staebler, Y. Han, T. W. Tokarek, H. D. Osthoff, P. A. Makar, J. Zhang, D. L. Plata and D. R. Gentner, Oil sands operations as a large source of secondary organic aerosols, Nature, 2016, 534, 91–94 CrossRef CAS PubMed.
- P. A. Makar, A. Akingunola, J. Aherne, A. S. Cole, Y. Aklilu, J. Zhang, I. Wong, K. Hayden, S. Li, J. Kirk, K. Scott, M. D. Moran, A. Robichaud, H. Cathcart, P. Baratzedah, B. Pabla, P. Cheung, Q. Zheng and D. S. Jeffries, Estimates of exceedances of critical loads for acidifying deposition in Alberta and Saskatchewan, Atmos. Chem. Phys., 2018, 18, 9897–9927 CrossRef CAS.
- S.-M. Li, A. Leithead, S. G. Moussa, J. Liggio, M. D. Moran, D. Wang, K. Hayden, A. Darlington, M. Gordon, R. Staebler, P. A. Makar, C. A. Stroud, R. McLaren, P. S. K. Liu, J. O. Brien, R. L. Mittermeier, J. Zhang, G. Marson, S. G. Cober, M. Wolde and J. J. B. Wentzell, Differences between measured and reported volatile organic compound emissions from oil sands facilities, Proc. Natl. Acad. Sci. U. S. A., 2017, 114, E3756–E3765 CrossRef CAS PubMed.
- C. Phillips-Smith, C. H. Jeong, R. M. Healy, E. Dabek-Zlotorzynska, V. Celo, J. R. Brook and G. Evans, Sources of particulate matter components in the Athabasca oil sands region: Investigation through a comparison of trace element measurement methodologies, Atmos. Chem. Phys., 2017, 17, 9435–9449 CrossRef CAS.
- JOSM (Joint Oil Sands Monitoring Plan), Integrated Monitoring Plan for the Oil Sands: Air Quality Component, http://publications.gc.ca/collections/collection_2011/ec/En14-45-2011-eng.pdf, accessed 2 March 2020 Search PubMed.
- M. Gordon, S. M. Li, R. Staebler, A. Darlington, K. Hayden, J. O'Brien and M. Wolde, Determining air pollutant emission rates based on mass balance using airborne measurement data over the Alberta oil sands operations, Atmos. Meas. Tech., 2015, 8, 3745–3765 CrossRef CAS.
- K. Li, J. Liggio, P. Lee, C. Han, Q. Liu and S. Li, Secondary organic aerosol formation from a-pinene, alkanes, and oil-sands-related precursors in a new oxidation flow reactor, Atmos. Chem. Phys., 2019, 19, 9715–9731 CrossRef CAS.
- N. M. Donahue, A. L. Robinson, C. O. Stanier and S. N. Pandis, Coupled partitioning, dilution, and chemical aging of semivolatile organics, Environ. Sci. Technol., 2006, 40, 2635–2643 CrossRef CAS PubMed.
- A. L. Robinson, N. M. Donahue, M. K. Shrivastava, E. a Weitkamp, A. M. Sage, A. P. Grieshop, T. E. Lane, J. R. Pierce and S. N. Pandis, Rethinking Organic Aerosols: Semivolatile Emissions and Photochemical Aging, Science, 2007, 315, 1259–1262 CrossRef CAS PubMed.
- A. P. Tsimpidi, V. A. Karydis, M. Zavala, W. Lei, L. Molina, I. M. Ulbrich, J. L. Jimenez and S. N. Pandis, Evaluation of the volatility basis-set approach for the simulation of organic aerosol formation in the Mexico City metropolitan area, Atmos. Chem. Phys., 2010, 10, 525–546 CrossRef CAS.
- N. M. Donahue, W. Chuang, S. A. Epstein, J. H. Kroll, D. R. Worsnop, A. L. Robinson, P. J. Adams and S. N. Pandis, Why do organic aerosols exist? Understanding aerosol lifetimes using the two-dimensional volatility basis set, Environ. Chem., 2013, 10, 151–157 CrossRef CAS.
- P. K. Ma, Y. Zhao, A. L. Robinson, D. R. Worton, A. H. Goldstein, A. M. Ortega, J. L. Jimenez, P. Zotter, A. S. H. Prévôt, S. Szidat and P. L. Hayes, Evaluating the impact of new observational constraints on P-S/IVOC emissions, multi-generation oxidation, and chamber wall losses on SOA modeling for Los Angeles, CA, Atmos. Chem. Phys., 2017, 17, 9237–9259 CrossRef CAS.
- B. Koo, E. Knipping and G. Yarwood, 1.5-Dimensional volatility basis set approach for modeling organic aerosol in CAMx and CMAQ, Atmos. Environ., 2014, 95, 158–164 CrossRef CAS.
- P. L. Hayes, A. G. Carlton, K. R. Baker, R. Ahmadov, R. A. Washenfelder, S. Alvarez, B. Rappenglück, J. B. Gilman, W. C. Kuster, J. A. de Gouw, P. Zotter, A. S. H. Prévôt, S. Szidat, T. E. Kleindienst, J. H. Offenberg, P. K. Ma and J. L. Jimenez, Modeling the formation and aging of secondary organic aerosols in Los Angeles during CalNex 2010, Atmos. Chem. Phys., 2015, 15, 5773–5801 CrossRef CAS.
- G. Ciarelli, S. Aksoyoglu, I. El Haddad, E. A. Bruns, M. Crippa, L. Poulain, M. Äijälä, S. Carbone, E. Freney, C. O'Dowd, U. Baltensperger and A. S. H. Prévôt, Modelling winter organic aerosol at the European scale with CAMx: Evaluation and source apportionment with a VBS parameterization based on novel wood burning smog chamber experiments, Atmos. Chem. Phys., 2017, 17, 7653–7669 CrossRef CAS.
- H. O. T. Pye, B. N. Murphy, L. Xu, N. L. Ng, A. G. Carlton, H. Guo, R. Weber, P. Vasilakos, K. W. Appel, S. H. Budisulistiorini, J. D. Surratt, A. Nenes, W. Hu, J. L. Jimenez, G. Isaacman-VanWertz, P. K. Misztal and A. H. Goldstein, On the implications of aerosol liquid water and phase separation for organic aerosol mass, Atmos. Chem. Phys., 2017, 17, 343–369 CrossRef CAS PubMed.
- R. Ahmadov, S. A. McKeen, A. L. Robinson, R. Bahreini, A. M. Middlebrook, J. A. de Gouw, J. Meagher, E.-Y. Hsie, E. Edgerton, S. Shaw and M. Trainer, A volatility basis set model for summertime secondary organic aerosols over the eastern United States in 2006, J. Geophys. Res. Atmos., 2012, 117, D06301 CrossRef.
- H. O. T. Pye and J. H. Seinfeld, A global perspective on aerosol from low-volatility organic compounds, Atmos. Chem. Phys., 2010, 10, 4377–4401 CrossRef CAS.
- A. P. Grieshop, J. M. Logue, N. M. Donahue and A. L. Robinson, Laboratory investigation of photochemical oxidation of organic aerosol from wood fires 1: measurement and simulation of organic aerosol evolution, Atmos. Chem. Phys., 2009, 9, 1263–1277 CrossRef CAS.
- R. Atkinson and J. Arey, Atmospheric Degradation of Volatile Organic Compounds Atmospheric Degradation of Volatile Organic Compounds, Chem. Rev., 2003, 103, 4605–4638 CrossRef CAS PubMed.
- S. H. Jathar, M. A. Miracolo, A. A. Presto, N. M. Donahue, P. J. Adams and A. L. Robinson, Modeling the formation and properties of traditional and non-traditional secondary organic aerosol: Problem formulation and application to aircraft exhaust, Atmos. Chem. Phys., 2012, 12, 9025–9040 CrossRef CAS.
- A. Asa-Awuku, M. A. Miracolo, J. H. Kroll, A. L. Robinson and N. M. Donahue, Mixing and phase partitioning of primary and secondary organic aerosols, Geophys. Res. Lett., 2009, 36, 1–5 CrossRef.
- K. S. Karadima, V. G. Mavrantzas and S. N. Pandis, Insights into the morphology of multicomponent organic and inorganic aerosols from molecular dynamics simulations, Atmos. Chem. Phys., 2019, 19, 5571–5587 CrossRef CAS.
- A. Zuend, C. Marcolli, T. Peter and J. H. Seinfeld, Computation of liquid-liquid equilibria and phase stabilities: Implications for RH-dependent gas/particle partitioning of organic-inorganic aerosols, Atmos. Chem. Phys., 2010, 10, 7795–7820 CrossRef CAS.
- A. Zuend and J. H. Seinfeld, A practical method for the calculation of liquid-liquid equilibria in multicomponent organic-water-electrolyte systems using physicochemical constraints, Fluid Phase Equilib., 2013, 337, 201–213 CrossRef CAS.
- A. Shanks, M.Sc. Dissertation, McGill University, 2018.
- N. M. Donahue, S. A. Epstein, S. N. Pandis and A. L. Robinson, A two-dimensional volatility basis set: 1. organic-aerosol mixing thermodynamics, Atmos. Chem. Phys., 2011, 11, 3303–3318 CrossRef CAS.
- T. W. Tokarek, C. A. Odame-Ankrah, J. A. Huo, R. McLaren, A. K. Y. Y. Lee, M. G. Adam, M. D. Willis, J. P. D. D. Abbatt, C. Mihele, A. Darlington, R. L. Mittermeier, K. Strawbridge, K. L. Hayden, J. S. Olfert, E. G. Schnitzler, D. K. Brownsey, F. V. Assad, G. R. Wentworth, A. G. Tevlin, D. E. J. J. Worthy, S.-M. M. Li, J. Liggio, J. R. Brook and H. D. Osthoff, Principal component analysis of summertime ground site measurements in the Athabasca oil sands with a focus on analytically unresolved intermediate-volatility organic compounds, Atmos. Chem. Phys., 2018, 18, 17819–17841 CrossRef CAS.
- A. K. Y. Lee, M. G. Adam, J. Liggio, S. M. Li, K. Li, M. D. Willis, J. P. D. Abbatt, T. W. Tokarek, C. A. Odame-Ankrah, H. D. Osthoff, K. Strawbridge and J. R. Brook, A large contribution of anthropogenic organo-nitrates to secondary organic aerosol in the Alberta oil sands, Atmos. Chem. Phys., 2019, 19, 12209–12219 CrossRef CAS.
- J. Zhang, M. D. Moran, Q. Zheng, P. A. Makar, P. Baratzadeh, G. Marson, P. Liu and S. M. Li, Emissions preparation and analysis for multiscale air quality modeling over the Athabasca Oil Sands Region of Alberta, Canada, Atmos. Chem. Phys., 2018, 18, 10459–10481 CrossRef CAS.
- R. Volkamer, J. L. Jimenez, F. San Martini, K. Dzepina, Q. Zhang, D. Salcedo, L. T. Molina, D. R. Worsnop and M. J. Molina, Secondary organic aerosol formation from anthropogenic air pollution: Rapid and higher than expected, Geophys. Res. Lett., 2006, 33, 7–10 CrossRef.
- C. L. Heald, J. H. Kroll, J. L. Jimenez, K. S. Docherty, P. F. DeCarlo, A. C. Aiken, Q. Chen, S. T. Martin, D. K. Farmer and P. Artaxo, A simplified description of the evolution of organic aerosol composition in the atmosphere, Geophys. Res. Lett., 2010, 37, L08803 Search PubMed.
- N. L. Ng, M. R. Canagaratna, J. L. Jimenez, P. S. Chhabra, J. H. Seinfeld and D. R. Worsnop, Changes in organic aerosol composition with aging inferred from aerosol mass spectra, Atmos. Chem. Phys., 2011, 11, 6465–6474 CrossRef CAS.
- M. R. Canagaratna, J. L. Jimenez, J. H. Kroll, Q. Chen, S. H. Kessler, P. Massoli, L. Hildebrandt Ruiz, E. Fortner, L. R. Williams, K. R. Wilson, J. D. Surratt, N. M. Donahue, J. T. Jayne and D. R. Worsnop, Elemental ratio measurements of organic compounds using aerosol mass spectrometry: Characterization, improved calibration, and implications, Atmos. Chem. Phys., 2015, 15, 253–272 CrossRef.
- C. A. Stroud, P. A. Makar, J. Zhang, M. D. Moran, A. Akingunola, S. M. Li, A. Leithead, K. Hayden and M. Siu, Improving air quality model predictions of organic species using measurement-derived organic gaseous and particle emissions in a petrochemical-dominated region, Atmos. Chem. Phys., 2018, 18, 13531–13545 CrossRef CAS.
- K. Dzepina, R. M. R. Volkamer, S. Madronich, P. Tulet, I. M. Ulbrich, Q. Zhang, C. D. Cappa, P. J. Ziemann and J. L. Jimenez, Evaluation of recently-proposed secondary organic aerosol models for a case study in Mexico City, Atmos. Chem. Phys., 2009, 9, 5681–5709 CrossRef CAS.
- D. Helmig, J. Ortega, T. Duhl, D. Tanner, A. Guenther, P. Harley, C. Wiedinmyer, J. Milford and T. Sakulyanontvittaya, Sesquiterpene Emissions from Pine Trees − Identifications, Emission Rates and Flux Estimates for the Contiguous United States, Environ. Sci. Technol., 2007, 41, 1545–1553 CrossRef CAS PubMed.
- M. C. Woody, K. R. Baker, P. L. Hayes, J. L. Jimenez, B. Koo and H. O. T. Pye, Understanding sources of organic aerosol during CalNex-2010 using the CMAQ-VBS, Atmos. Chem. Phys., 2016, 16, 4081–4100 CrossRef CAS.
- A. A. Presto, C. J. Hennigan, N. T. Nguyen and A. L. Robinson, Determination of volatility distributions of primary organic aerosol emissions from internal combustion engines using thermal desorption gas chromatography mass spectrometry, Aerosol Sci. Technol., 2012, 46, 1129–1139 CrossRef CAS.
- B. C. McDonald, A. H. Goldstein and R. A. Harley, Long-term trends in California mobile source emissions and ambient concentrations of black carbon and organic aerosol, Environ. Sci. Technol., 2015, 49, 5178–5188 CrossRef CAS PubMed.
- T. D. Gordon, D. S. Tkacik, A. A. Presto, M. Zhang, S. H. Jathar, N. T. Nguyen, J. Massetti, T. Truong, P. Cicero-Fernandez, C. Maddox, P. Rieger, S. Chattopadhyay, H. Maldonado, M. M. Maricq and A. L. Robinson, Primary gas- and particle-phase emissions and secondary organic aerosol production from gasoline and diesel off-road engines, Environ. Sci. Technol., 2013, 47, 14137–14146 CrossRef CAS PubMed.
- B. D. Drollette, D. R. Gentner and D. L. Plata, Waste containment ponds are a major source of secondary organic aerosol precursors from oil sands operations, Environ. Sci. Technol., 2020, 54, 9872–9881 CrossRef CAS PubMed.
- D. Lowell, T. Balon and D. Seamonds, Evaluation of vehicle emissions reduction options for the oil sands mining fleet, 2008, vol. 03101 Search PubMed.
- J. G. Watson, J. C. Chow, X. Wang, B. Zielinska, S. D. Kohl and S. Gronstal, Characterization of Real-World Emissions from Nonroad Mining Trucks in the Athabasca Oil Sands Region during September, 2009, 2013 Search PubMed.
- Y. Cheng, S. M. Li, J. Liggio, M. Gordon, A. Darlington, Q. Zheng, M. Moran, P. Liu and M. Wolde, Top-Down Determination of Black Carbon Emissions from Oil Sand Facilities in Alberta, Canada Using Aircraft Measurements, Environ. Sci. Technol., 2019, 54, 412–418 CrossRef PubMed.
- X. Zhang, C. D. Cappa, S. H. Jathar, R. C. McVay, J. J. Ensberg, M. J. Kleeman, J. H. Seinfeld and C. D. Cappa, Influence of vapor wall loss in laboratory chambers on yields of secondary organic aerosol., Proc. Natl. Acad. Sci. U. S. A., 2014, 111, 1–6 CrossRef PubMed.
- C. D. Cappa, S. H. Jathar, M. J. Kleeman, K. S. Docherty, J. L. Jimenez, J. H. Seinfeld and A. S. Wexler, Simulating secondary organic aerosol in a regional air quality model using the statistical oxidation model - Part 2: Assessing the influence of vapor wall losses, Atmos. Chem. Phys., 2016, 16, 3041–3059 CrossRef CAS.
- A. Zuend and J. H. Seinfeld, Modeling the gas-particle partitioning of secondary organic aerosol: The importance of liquid-liquid phase separation, Atmos. Chem. Phys., 2012, 12, 3857–3882 CrossRef CAS.
- J. F. Pankow, Gas/particle partitioning of neutral and ionizing compounds to single and multi-phase aerosol particles. 1. Unified modeling framework, Atmos. Environ., 2003, 37, 3323–3333 CrossRef CAS.
- S. H. Jathar, M. Woody, H. O. T. Pye, K. R. Baker and A. L. Robinson, Chemical transport model simulations of organic aerosol in southern California: model evaluation and gasoline and diesel source contributions, Atmos. Chem. Phys., 2017, 17, 4305–4318 CrossRef CAS PubMed.
- A. Hodzic, J. L. Jimenez, S. Madronich, M. R. Canagaratna, P. F. Decarlo, L. Kleinman and J. Fast, Modeling organic aerosols in a megacity: Potential contribution of semi-volatile and intermediate volatility primary organic compounds to secondary organic aerosol formation, Atmos. Chem. Phys., 2010, 10, 5491–5514 CrossRef CAS.
- D. S. Jo, R. J. Park, M. J. Kim and D. V. Spracklen, Effects of chemical aging on global secondary organic aerosol using the volatility basis set approach, Atmos. Environ., 2013, 81, 230–244 CrossRef CAS.
- T. D. Vaden, D. Imre, J. Beránek, M. Shrivastava and A. Zelenyuk, Evaporation kinetics and phase of laboratory and ambient secondary organic aerosol., Proc. Natl. Acad. Sci. U. S. A., 2011, 108, 2190–2195 CrossRef CAS PubMed.
- Q. Chen, Y. Liu, N. M. Donahue, J. E. Shilling and S. T. Martin, Particle-phase chemistry of secondary organic material: Modeled compared to measured O: C and H: C Elemental ratios provide constraints, Environ. Sci. Technol., 2011, 45, 4763–4770 CrossRef CAS PubMed.
- W. Hu, B. B. Palm, D. A. Day, P. Campuzano-Jost, J. E. Krechmer, Z. Peng, S. S. de Sá, S. T. Martin, M. L. Alexander, K. Baumann, L. Hacker, A. Kiendler-Scharr, A. R. Koss, J. A. de Gouw, A. H. Goldstein, R. Seco, S. J. Sjostedt, J.-H. Park, A. B. Guenther, S. Kim, F. Canonaco, A. S. H. Prévôt, W. H. Brune and J. L. Jimenez, Volatility and lifetime against OH heterogeneous reaction of ambient isoprene-epoxydiols-derived secondary organic aerosol (IEPOX-SOA), Atmos. Chem. Phys., 2016, 16, 11563–11580 CrossRef CAS.
Footnote |
| † Electronic supplementary information (ESI) available. See DOI: 10.1039/d1ea00053e |
| This journal is © The Royal Society of Chemistry 2022 |