
 Open Access Article
 This Open Access Article is licensed under a
 Creative Commons Attribution 3.0 Unported Licence
Evaluation of anthropogenic emissions of black carbon from East Asia in six inventories: constraints from model simulations and surface observations on Fukue Island, Japan†
Kohei
Ikeda
 *a,
Hiroshi
Tanimoto
a,
Yugo
Kanaya
b and
Fumikazu
Taketani
b
*a,
Hiroshi
Tanimoto
a,
Yugo
Kanaya
b and
Fumikazu
Taketani
b
aEarth System Division, National Institute for Environmental Studies, Tsukuba, Ibaraki, Japan. E-mail: ikeda.kohei@nies.go.jp
bResearch Institute for Global Change, Japan Agency for Marine-Earth Science and Technology, Yokohama, Kanagawa, Japan
First published on 15th February 2022
Abstract
Bottom-up emission inventories of black carbon (BC) are used to assess its impact on the climate and air quality using climate models and chemical transport models. However, the estimates of BC emissions from East Asia, the region with the largest anthropogenic emissions, are still uncertain. We evaluated anthropogenic BC emissions from East Asia for five global inventories and one regional inventory using a chemical transport model, GEOS-Chem, and observations at Fukue Island in western Japan. The inventories examined in this study include REASv2.1, HTAPv2, MACCity, ECLIPSEv5a, CEDS, and EDGARv4.3.2. We first compared BC emissions in East Asia for the six inventories by source region and sector. BC emissions from China were estimated to be 1.32–2.44 Tg per year for 2010 with a large difference of 85% between the maximum (CEDS) and minimum (EDGARv4.3.2). We then conducted model simulations for the six inventories using GEOS-Chem and compared them with the observations at Fukue Island. To evaluate Chinese BC emissions, we used a tagged method to select BC data strongly affected by BC transported from China and excluded data influenced by wet scavenging during transport. The comparisons after the data selection showed that the average BC concentrations in the simulations were 25–116% larger than the observed values. We estimated BC emissions from China to be 1.14 Tg per year averaged for 2009–2011 using the ratios of simulated to observed concentrations, suggesting that CEDS used in CMIP6 and ECLIPSEv5a overestimates Chinese BC emissions. Seasonal analysis suggests that the domestic sector in winter leads to the overestimation of these inventories.
Environmental significanceBlack carbon (BC) is a key component of atmospheric fine particles and contributes to global warming. Bottom-up emission inventories of BC are used as inputs for model simulations to assess its impacts on the climate and air quality. Accurate estimates of BC emissions from East Asia are essential because this region is the largest source of anthropogenic emissions. By comparing six inventories, we found that there was a large difference of approximately a factor of two between inventories in BC emissions from China. In particular, we suggest that the CEDS inventory used in CMIP6 overestimates China's BC emissions. We highlight the importance of evaluating emission inventories based on models and observations. |
1. Introduction
Black carbon (BC) aerosols have positive radiative forcing by absorbing solar radiation in the atmosphere and by reducing the surface albedo of snow and ice after their deposition.1,2 BC is considered a short-lived climate forcer that affects global and regional climate, including the Arctic.1–3 BC as a component of fine particulate matter is also a harmful air pollutant to human health.4 Therefore, reduction in BC emissions can contribute to mitigating global warming and to improving air quality.5 BC is emitted into the atmosphere by anthropogenic fuel combustion and open biomass burning. East Asia, especially China, is the region with the largest emissions of anthropogenic BC, accounting for approximately 30% of the total global anthropogenic emissions.6 Thus, BC emissions from East Asia are important for assessing the impacts on air quality and climate change using chemistry-transport models (CTMs) as well as chemistry-climate models. However, estimates of anthropogenic BC emissions from China in bottom-up inventories still have large uncertainties of approximately 200%.7 This highlights the need to evaluate China's BC emissions using observations and models.Several bottom-up inventories have been used in various modeling studies, including model intercomparison projects. In model intercomparison studies, the same inventories are usually used for multiple models, and variations in results among models have been examined. However, differences among emission inventories and how the variations affect model simulations have not been investigated well. Recently, comparisons between emission inventories have been conducted for the emissions of air pollutants such as NOx, SO2, CO, and PM10 from China,8–10 but BC was not examined in these studies. Kondo et al.11 evaluated BC emissions from China using CTMs and BC measurements at Cape Hedo on Okinawa Island in the East China Sea. They used an inventory for BC emissions developed by Zhang et al.,12 and recently developed or updated inventories were not examined. Kanaya et al.13 performed long-term observations of BC mass concentrations during 2009–2019 at Fukue Island, western Japan, and evaluated recent trends in Chinese BC emissions in several bottom-up inventories with long-term changes in emission strengths derived from observations and model simulations.
In this study, we comprehensively evaluated anthropogenic BC emissions from East Asia from six bottom-up inventories for 2010 using BC observations at Fukue Island and a global chemical transport model, GEOS-Chem. The inventories used in this study include REASv2.1,7 HTAPv2,6 MACCity,14 ECLIPSEv5a,15 CEDS,16 and EDGARv4.3.2.17 BC emissions in the six inventories were quantitatively compared for four regions over East Asia (North China, South China, the Korean Peninsula, and Japan) by source sector. We then performed model simulations for 2009–2011 with each emission inventory using the GEOS-Chem and compared them with BC observations at Fukue Island. Fukue Island is a remote island located in the westernmost part of Japan, which receives air masses transported from various regions in China with negligible local emissions.13,18,19 To evaluate BC emissions from China, we used data strongly affected by BC originating from China using a tagged method in which BC tracers were distinguished into four regions in East Asia: North China, South China, the Korean Peninsula, and Japan. In addition, we excluded data influenced by wet removal during long-range transport to avoid model uncertainties in the wet scavenging processes. Finally, we estimated annual BC emissions from China in 2010 using the simulated to observed ratios of the mean BC concentrations.
2. Methods
2.1 Observations
Continuous measurements of BC mass concentrations have been conducted at Fukue Island, a remote island located in the westernmost part of Japan since April 2009.13,19 The observation site is located at the Fukue Atmospheric Environment Observatory (Fig. 1, 32.75°N, 128.68°E; 75 m asl) in the northwestern part of Fukue Island, where direct observations of continental outflows with negligible local emissions are possible. BC mass concentrations at this site were monitored using a Multi-Angle Absorption Photometer (MAAP, model 5012; Thermo Fisher Scientific, Waltham, Massachusetts, USA). Details of the setup and the performance of the instrument have been reported in previous studies.20 Ambient air was supplied to the instrument using an air intake tube equipped with a cyclone (PM2.5 and PM1 before and after November 2011, respectively). The influence of co-existing scattering particles is minimized because reflectance measurements at two angles, in addition to transmittance, were performed to remove the scattering effect. We previously demonstrated that the mass concentrations obtained with the MAAP were in close agreement with those obtained with a continuous soot-monitoring system (COSMOS; Kanomax, Osaka, Japan) once the mass absorption cross-section was modified from the manufacturer's recommendation of 6.6 to 10.3 m2 g−1.19,20 We also confirmed that results with the MAAP using the modified mass absorption cross-section were consistent with the results obtained using a single-particle soot photometer (SP2; Droplet Measurement Technologies, Boulder, Colorado, USA) at Fukue Island.21 The uncertainty of the MAAP was estimated to be ±22%.13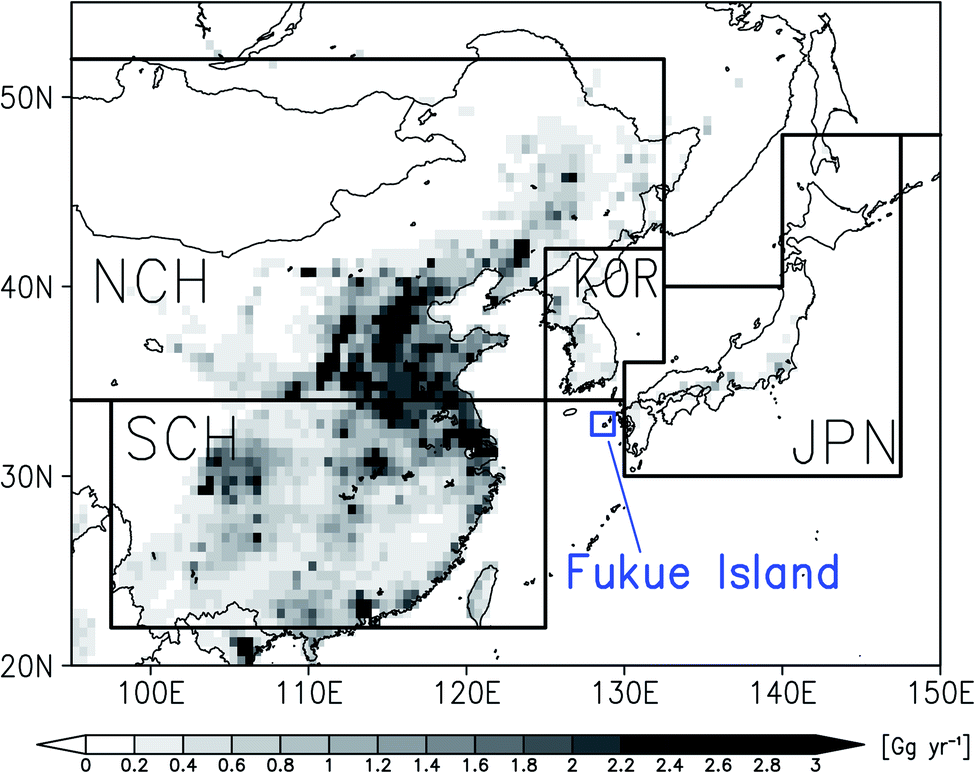 | ||
| Fig. 1 Location of Fukue Island (blue) and definition of source regions for anthropogenic BC tagging (black). The background scale is the annual BC emissions from REASv2.1 for 2008. JPN: Japan; KOR: the Korean Peninsula; NCH: North China; SCH: South China. | ||
2.2 Anthropogenic emission inventories
We considered six bottom-up emission inventories in this study (Table 1). The Regional Emission Inventory in Asia (REAS) v2.1 is a regional inventory for Asia, which includes emissions of most major air pollutants and greenhouse gases for 2000–2008.7 The regions covered in REAS include East, Southeast, South, and Central Asia and the Asian part of Russia. Monthly emissions were provided at a 0.25° × 0.25° spatial resolution. The HTAPv2 emission inventory was developed to provide global anthropogenic emissions for model simulations coordinated by the second phase of the Task Force on Hemispheric Transport of Air Pollutants (TF HTAP2).6 It consists of 0.1° × 0.1° grid maps of several gaseous and particulate species for the years 2008 and 2010 with monthly variations. HTAPv2 contains nationally reported emissions and regional scientific inventories. For Asia, the third phase of the Model Intercomparison Study for Asia (MICS-Asia III) emissions were used. MACCity is a global emission inventory that was developed as an extension of the ACCMIP historical emissions to the year 2020.14 The emissions of each year for the 1960–2000 period were calculated by a linear interpolation of the decadal ACCMIP emissions. For the 2000–2020 period, the RCP8.5 scenario of 5 year intervals was used to obtain emissions for each year through a linear interpolation. MACCity provides the monthly emissions of the main tropospheric gases and particulate species with a horizontal resolution of 0.5° × 0.5°. ECLIPSEv5a is a global emission inventory developed within the Evaluating the CLimate and Air Quality ImPacts of Short-livEd Pollutants (ECLIPSE) project using the GAINS (Greenhouse gas-Air pollution Interactions and Synergies) model.15 It provides emissions for the period from 1990 to 2010 in 5 year intervals, together with projections to 2050. The ECLIPSEv5a emissions were gridded at a 0.5° × 0.5° resolution with monthly variations. CEDS is a global historical emission inventory of reactive gases, aerosols, and greenhouse gases developed using the Community Emissions Data System (CEDS).16 The CEDS dataset (version 2017-05-18) was used for Earth system model simulations in the Coupled Model Intercomparison Project phase 6 (CMIP6). The gridded data of emissions were provided at a 0.5° × 0.5° resolution with monthly seasonality for 1900–2014. The Emissions Database for Global Atmospheric Research (EDGAR) v4.3.2 is a global inventory providing historic emissions of both air pollutants and greenhouse gases for 1970–2012.17 The methodology of bottom-up emissions estimation is consistently applied to all world countries in a sectorial structure that is also used to compute greenhouse gases by the IPCC. The EDGARv4.3.2 emissions were gridded at a 0.1° × 0.1° resolution with monthly variations.| Years | Source sectors | Horizontal resolution | Reference | |
|---|---|---|---|---|
| REASv2.1 | 2000–2008 | Power plants, industry, transport, domestic, aviation, and ships | 0.25° × 0.25° | Kurokawa et al. (2013)7 |
| HTAPv2 | 2008, 2010 | Energy, industry, residential, transport, aviation, and ships | 0.1° × 0.1° | Jannsens-Maenhout et al. (2015)6 |
| MACCity | 1960–2020 (projection starting in 2000) | Industry, energy, domestic, transport, agriculture waste burning, ships, and waste | 0.5° × 0.5° | Granier et al. (2011)14 |
| ECLIPSEv5a | 1990–2050 (5 year interval, projection starting in 2015) | Energy, industry, domestic, transport, agriculture waste burning, and waste | 0.5° × 0.5° | Klimont et al. (2017)15 |
| CEDS | 1900–2014 | Energy, industry, residential, transport, ships, and waste | 0.5° × 0.5° | Hoesly et al. (2018)16 |
| EDGARv4.3.2 | 1970–2012 | 19 sectors | 0.1° × 0.1° | Crippa et al. (2018)17 |
2.3 Model description
We conducted tagged BC simulations using a chemical transport model, GEOS-Chem version v9-02(ref. 22,23) to examine how different inventories affect BC simulations and evaluate BC emissions from East Asia for each inventory. The assimilated meteorological data to drive GEOS-Chem were obtained from the Goddard Earth Observing System (GEOS-5) provided by the NASA Global Modeling and Assimilation Office (GMAO). The horizontal resolution was 2° × 2.5° with 47 vertical layers from the surface to 0.01 hPa. In the tagged tracer simulations, we distinguished the BC tracers by source type (i.e., anthropogenic and biomass burning) and regions. The global domain was divided into 16 and 27 regions for anthropogenic and biomass burning emissions, respectively.23 East Asia was divided into four regions: Japan (JPN), the Korean Peninsula (KOR), North China (NCH), and South China (SCH) (Fig. 1).The BC simulation in GEOS-Chem and wet removal processes are described by Park et al.24 and Liu et al.25 In the standard GEOS-Chem BC simulation, 80% of BC is initially emitted as hydrophobic BC and then converted to hydrophilic BC with a constant e-folding time of 1.15 day.24 In our previous studies, we modified the aging and wet removal processes of BC in GEOS-Chem.23,26 The aging parameterization of Liu et al.,27 in which a timescale of aging from hydrophobic BC to hydrophilic BC is derived from the number concentration of OH radical, was implemented instead of using a constant aging time of 1.15 day in the standard GEOS-Chem. The monthly average OH distributions for the estimation of the BC aging time were calculated using the full-chemistry simulation of GEOS-Chem v9-02. In GEOS-Chem, the wet scavenging process distinguishes between liquid and ice clouds for in-cloud scavenging (rainout).28 The scavenging rate of hydrophobic BC by ice cloud (T < 258 K) was reduced to 5% of water-soluble aerosols for liquid clouds by following earlier studies.29 Our previous study described more details of the model evaluation in northern mid-latitudes and Arctic.23
Six simulations using the anthropogenic emission inventories described above were performed for 2009–2011 after a model spin-up of six months. These simulation years were chosen because they were the most recent years and were included in almost all emission inventories (Table 1). For REASv2.1, BC emissions in 2008 were used because they were available until 2008. We adopted the Global Fire Emissions Database (GFED) v3.1 with 0.5° × 0.5° of spatial resolution and daily temporal resolution for the biomass burning emissions.30
To evaluate BC emissions from a source region, we selected data that were not influenced by wet deposition during transport, as described in Section 3.2. We performed additional simulations in which the wet scavenging processes were switched off to estimate the effects of wet removal of BC by precipitation. In this study, the transport efficiency (TE) was used to extract data not influenced by wet removal processes.11 The TE of each BC tracer is defined as follows:
| TE (%) = Cctl/Cwetoff × 100, | (1) |
The model uncertainty of the BC simulations under conditions without the influence of wet deposition was considered based on the variation of multimodel simulations of carbon monoxide (CO), as described in a previous study.13 We estimated the model uncertainty to be ±16% from the ensemble spread of CO concentrations over the East China Sea in the model intercomparison.13,31
3 Results and discussion
3.1 Comparisons of six bottom-up inventories
We first compared total anthropogenic BC emissions in six bottom-up inventories from four regions in East Asia: North China (NCH), South China (SCH), the Korean Peninsula (KOR), and Japan (JPN). Table 2 shows the total BC emissions from each region for the year 2010 in six inventories and the relative differences between REASv2.1 and the other five inventories. Total BC emissions in China (i.e., the sum of NCH and SCH) were estimated to be 1.32–2.44 Tg per year, indicating a large difference of 85% between a maximum (CEDS) and a minimum (EDGARv4.3.2). EDGARv4.3.2 showed the smallest emissions in both NCH and SCH. The CEDS and ECLIPSEv5a estimates were the largest for NCH and SCH, respectively. The differences between the maximum and a minimum were estimated to be 86% for NCH and 83% for SCH. The HTAPv2, MACCity, and ECLIPSEv5a inventories had relatively similar estimates of the total emissions from China (1.74–1.89 Tg per year). However, the emission estimates divided into NCH and SCH showed larger differences of 53% in NCH (0.78–1.19 Tg per year) and 37% in SCH (0.70–0.96 Tg per year) between a maximum and a minimum among these three inventories. While HTAPv2 and ECLIPSEv5a estimated larger BC emissions from NCH than those from SCH, MACCity had larger emissions from SCH. The REASv2.1 inventory showed the fourth largest estimates in both NCH and SCH in the six inventories.| REASv2.1 | HTAPv2 | MACCity | ECLIPSEv5a | CEDS | EDGARv4.3.2 | |
|---|---|---|---|---|---|---|
| a CHN is the sum of NCH and SCH. | ||||||
| CHNa | 1.63 | 1.79 (9.9%) | 1.74 (6.9%) | 1.89 (15.7%) | 2.44 (49.4%) | 1.32 (−18.7%) |
| NCH | 0.88 | 0.96 (8.8%) | 0.78 (−11.1%) | 1.19 (35.4%) | 1.18 (34.1%) | 0.64 (−27.1%) |
| SCH | 0.75 | 0.84 (11.1%) | 0.96 (28.0%) | 0.70 (−7.6%) | 1.26 (67.3%) | 0.69 (−9.0%) |
| KOR | 0.030 | 0.038 (29.3%) | 0.11 (251.1%) | 0.070 (131.6%) | 0.13 (346.8%) | 0.025 (−15.3%) |
| JPN | 0.027 | 0.020 (−25.6%) | 0.072 (168.8%) | 0.028 (5.5%) | 0.062 (131.7%) | 0.018 (−33.2%) |
BC emissions from JPN and KOR were estimated to be 0.018–0.062 Tg per year and 0.025–0.13 Tg per year in six inventories. Although BC emission estimates from these regions were much smaller than those from China, the differences between a maximum and a minimum were 4-fold and 5-fold in Japan and the Korean Peninsula, respectively. The EDGARv4.3.2 inventory had the smallest estimates for both JPN and KOR. MACCity and CEDS showed the largest emissions in JPN and KOR, respectively.
Fig. 2 shows the horizontal distributions of annual BC emissions of REASv2.1, and the absolute differences compared with the other five inventories to examine the differences in the spatial distributions, especially over China. The comparisons of the horizontal distributions of seasonal BC emissions are shown in Fig. S1–S4.† The gridded BC emissions of CEDS were higher than those of REASv2.1 over the entire China, except around the Shanxi province. The MACCity emissions were lower than those of CEDS, but generally exhibited a spatial pattern similar to that of CEDS. ECLIPSEv5a showed higher BC emissions than REASv2.1 in Northern China, but lower estimates in the Yangtze River Delta region, including Shanghai. BC emissions in EDGARv4.3.2 were overall lower than those in REASv2.1 over China, but there were some higher estimates with EDGARv4.3.2 at the local scale. The differences between HTAPv2 and REASv2.1 emissions were small in NCH (+9%) and SCH (+11%), but the large differences were observed in the coastal region of SCH and at the local scale. These results indicate that even if the differences in BC emissions between the inventories are small at the national and regional scales, significant differences are found at the provincial and city scales.
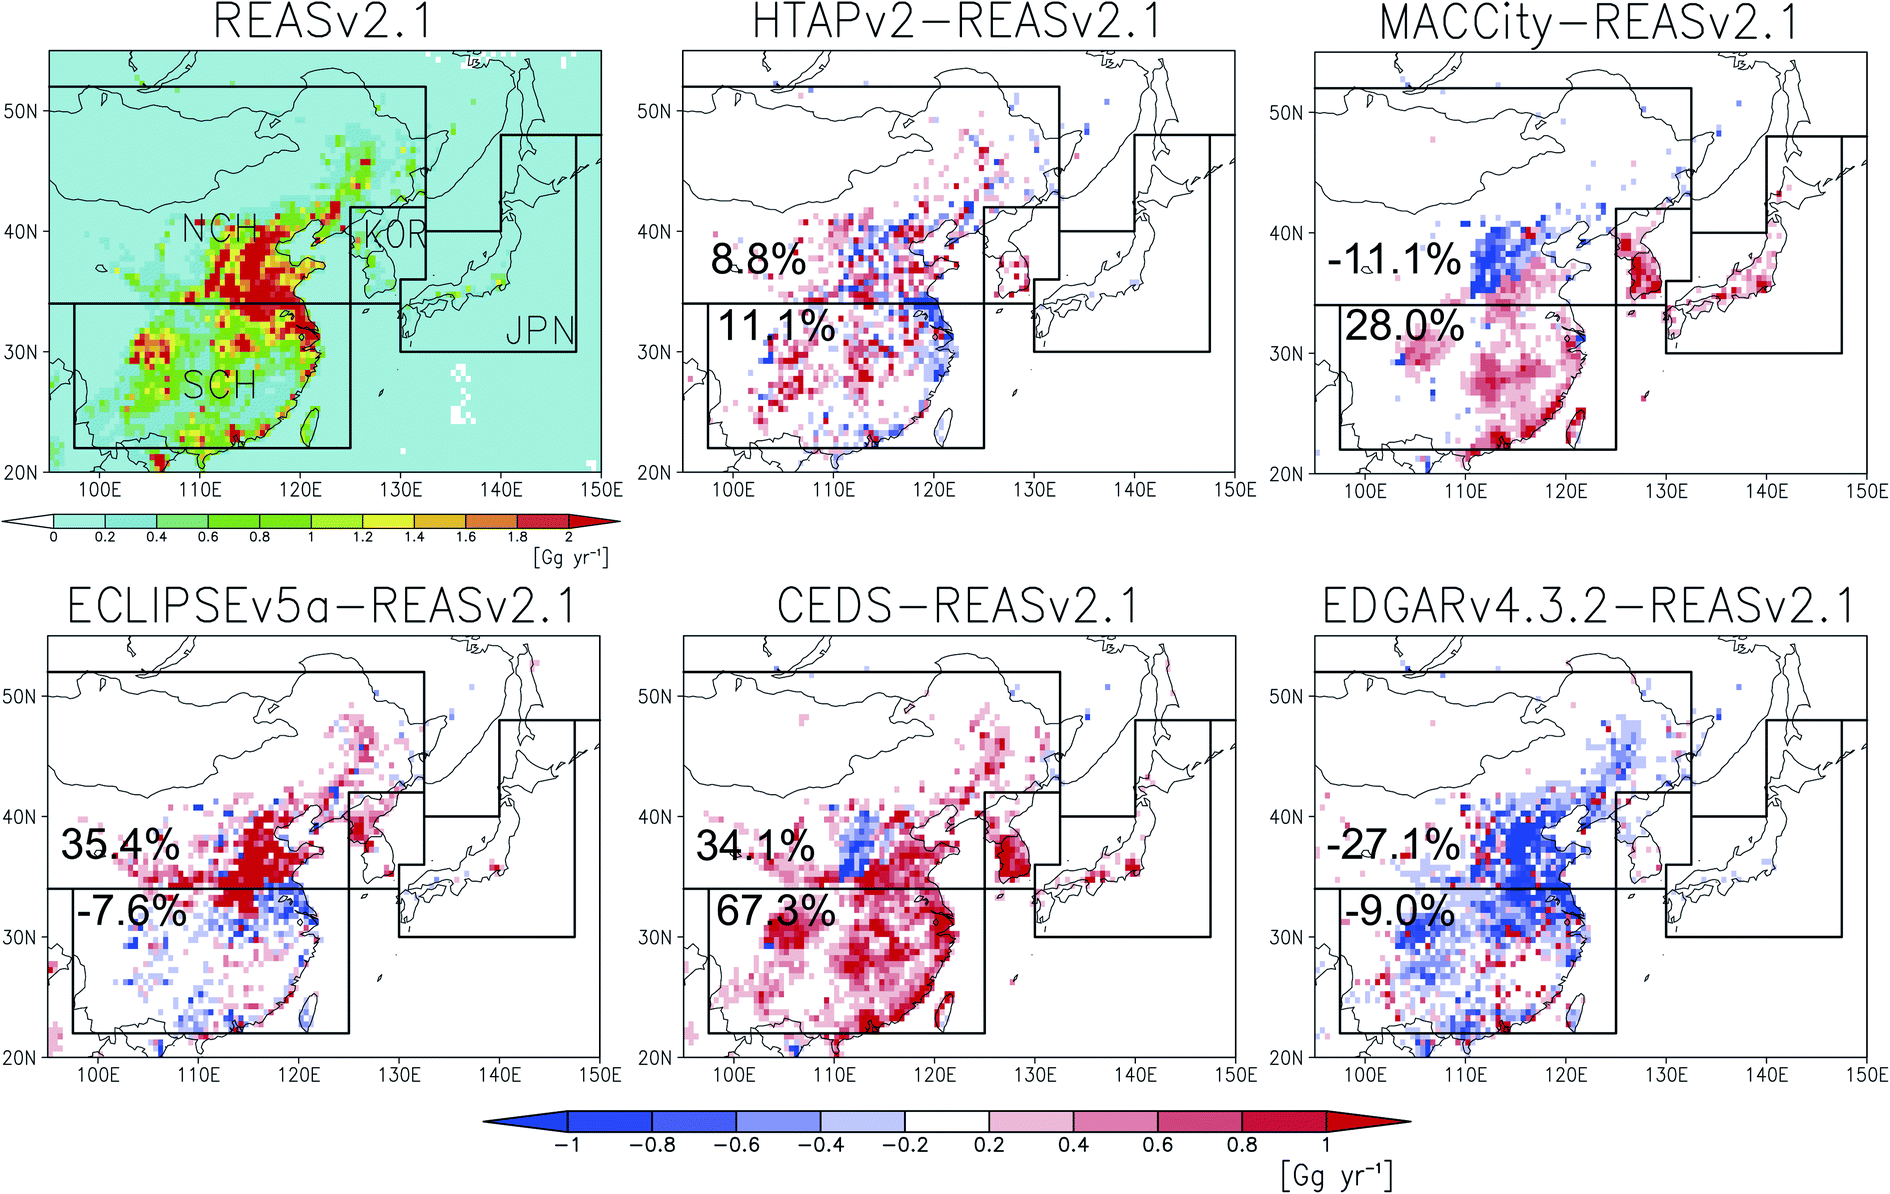 | ||
| Fig. 2 Anthropogenic BC emissions estimated by REASv2.1 for 2008 and absolute differences with HTAPv2, MACCity, ECLIPSEv5a, CEDS, and EDGARv4.3.2 for 2010. Values shown in NCH and SCH are relative differences between REASv2.1 and the other five inventories. | ||
We further compared BC emissions in NCH and SCH for the four sectors separately to examine the causes of the differences among the six inventories. Fig. 3 shows comparisons of the emission estimates in 2010 (in 2008 for REASv2.1) for four major sectors: domestic, energy, industry, and transport. The domestic sector contributed 32–70% and 35–64% of the total BC emissions in NCH and SCH, respectively. The domestic sector includes fossil fuel and biofuel combustion from residential and commercial buildings such as heating and cooking. It was the largest source sector in the HTAPv2, ECLIPSEv5a, and CEDS inventories in NCH. For SCH, the domestic sector showed the largest emissions among the five inventories, except for MACCity. The BC emissions of the domestic sector were estimated to be 0.20–0.84 Tg per year in NCH, with a large difference of more than four times between a maximum (ECLIPSEv5a) and a minimum (EDGARv4.3.2). The domestic sector was the major source of the difference in the total BC emissions from NCH between ECLIPSEv5a and EDGARv4.3.2. We also found a large difference of about two times (0.25–0.51 Tg per year) between the maximum (CEDS) and minimum (EDGARv4.3.2) in the domestic sector in SCH.
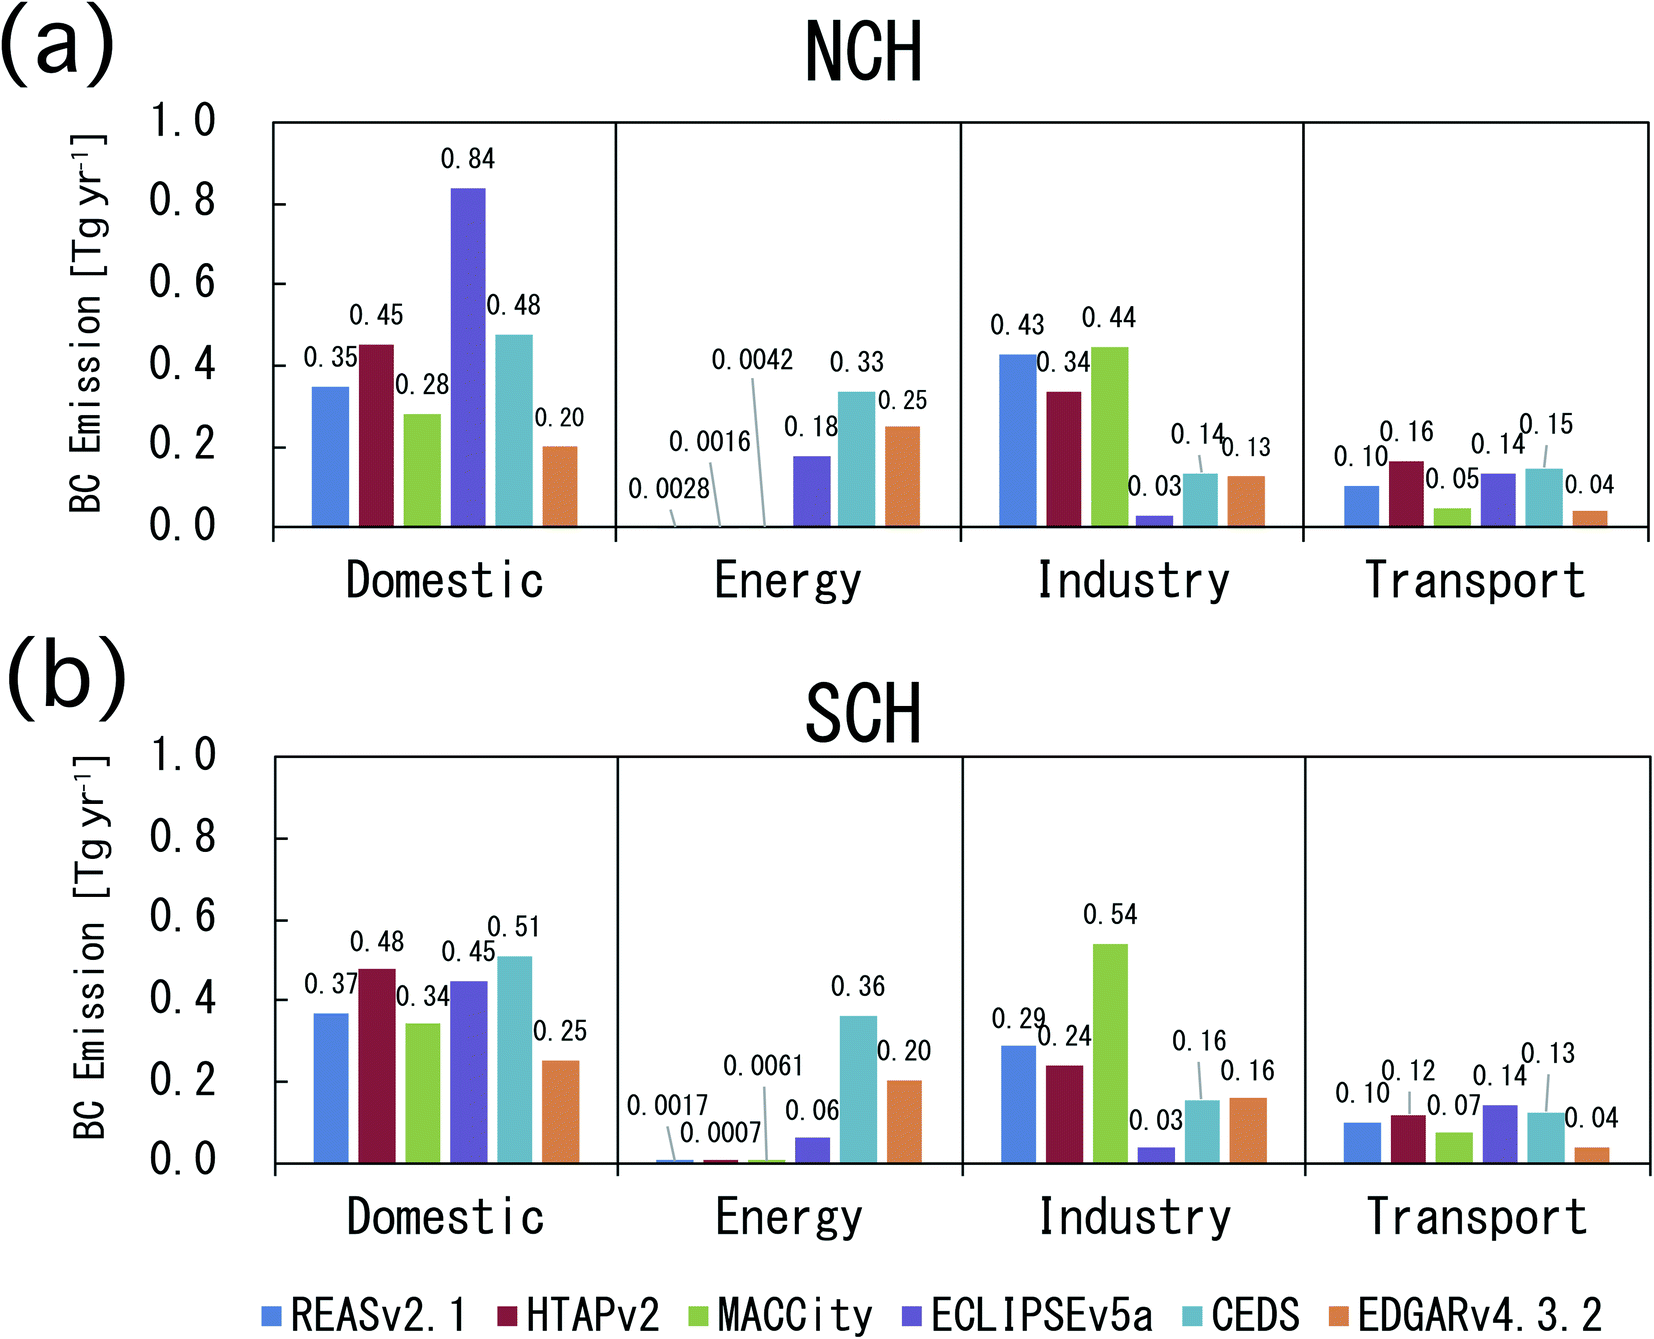 | ||
| Fig. 3 BC emissions for four source sectors (domestic, energy, industry, and transport) estimated using six inventories in (a) NCH and (b) SCH. | ||
The emissions of the energy sector of REASv2.1, HTAPv2, and MACCity were very low (<0.01 Tg per year) in NCH, whereas ECLIPSEv5a, CEDS, and EDGARv4.3.2 showed significant emissions of 0.18–0.33 Tg per year. On the other hand, for the industry sector, the REASv2.1, HTAPv2, and MAACity inventories estimated larger emissions of 0.34–0.44 Tg per year compared to the other three inventories (0.03–0.14 Tg per year). It was similar for SCH, where ECLIPSEv5a, CEDS, and EDGARv4.3.2 showed larger emissions of 0.06–0.36 Tg per year in the energy sector compared to the other three inventories (<0.01 Tg per year), while REASv2.1, HTAPv2, and MACCity estimated higher emissions of 0.24–0.54 Tg per year in the industrial sector. It is noted that the source classification differs between emission inventories. In REASv2.1 and HTAPv2, the energy sector includes only emissions from power plants,6,7 while energy production and conversion, in addition to power plants, are included in the energy sector in ECLPSEv5a, CEDS, and EDGARv4.3.2.15–17 When we compared the aggregated emissions of the energy and industry sectors, the emission estimates were 0.21–0.47 Tg per year in NCH and 0.10–0.54 Tg per year in SCH, accounting for 18–59% and 14–57% of the total BC emissions in NCH and SCH, respectively. In the energy and industry sectors, there were also large differences between the maximum and the minimum, reaching approximately two times and five times in NCH and SCH, respectively. The emissions of the transport sector were estimated to be 0.04–0.16 Tg per year and 0.04–0.14 Tg per year in NCH and SCH, respectively. Although the contributions of the transport sector to the total emissions were generally smaller (6–17% in NCH and 6–21% in SCH) than the domestic and energy/industry sectors, large differences of approximately 4-fold between a maximum and a minimum were found in both NCH and SCH.
From the comparisons of BC emissions for each sector, we found that the differences in each sector among the inventories were larger than those in the total emission estimates. This is similar to the results of previous studies that compared the emissions of other air pollutants between inventories. Saikawa et al.8 compared the emissions of air pollutants (CO, SO2, NOx, and PM10) from China among five inventories and revealed that the discrepancies for each sector were larger than those for the total emissions. Li et al.9 showed that differences at the sectorial level were higher than those of the total estimates by comparing SO2 and NOx emissions over China in the ECLIPSE and MIX inventories. In this study, we found that even if the total emission estimates were close between inventories, the emissions from each sector were different. For example, ECLIPSEv5a and CEDS estimated very similar emissions to each other in NCH (1.18 and 1.19 Tg per year), but the emission from the domestic sector in ECLIPSEv5a was 75% larger than that in CEDS. Thus, these results highlight the importance of comparing and evaluating BC emissions for each sector.
The comparisons of BC emissions of the four sectors in KOR and JPN also showed that there were large differences in each sector (Fig. S5†). For KOR and JPN, the CEDS and MACCity inventories showed much larger emissions than the others (Table 2). The energy and transport sectors in CEDS and the industry sector in MACCity contributed to larger emissions of these two inventories in KOR (Fig. S5†). For JPN, the MACCity inventory showed larger emissions from the industry and transport sectors, and the CEDS inventory had larger emissions from the domestic and energy sectors than the others (Fig. S5†).
3.2 Evaluations with observations and tagged simulations
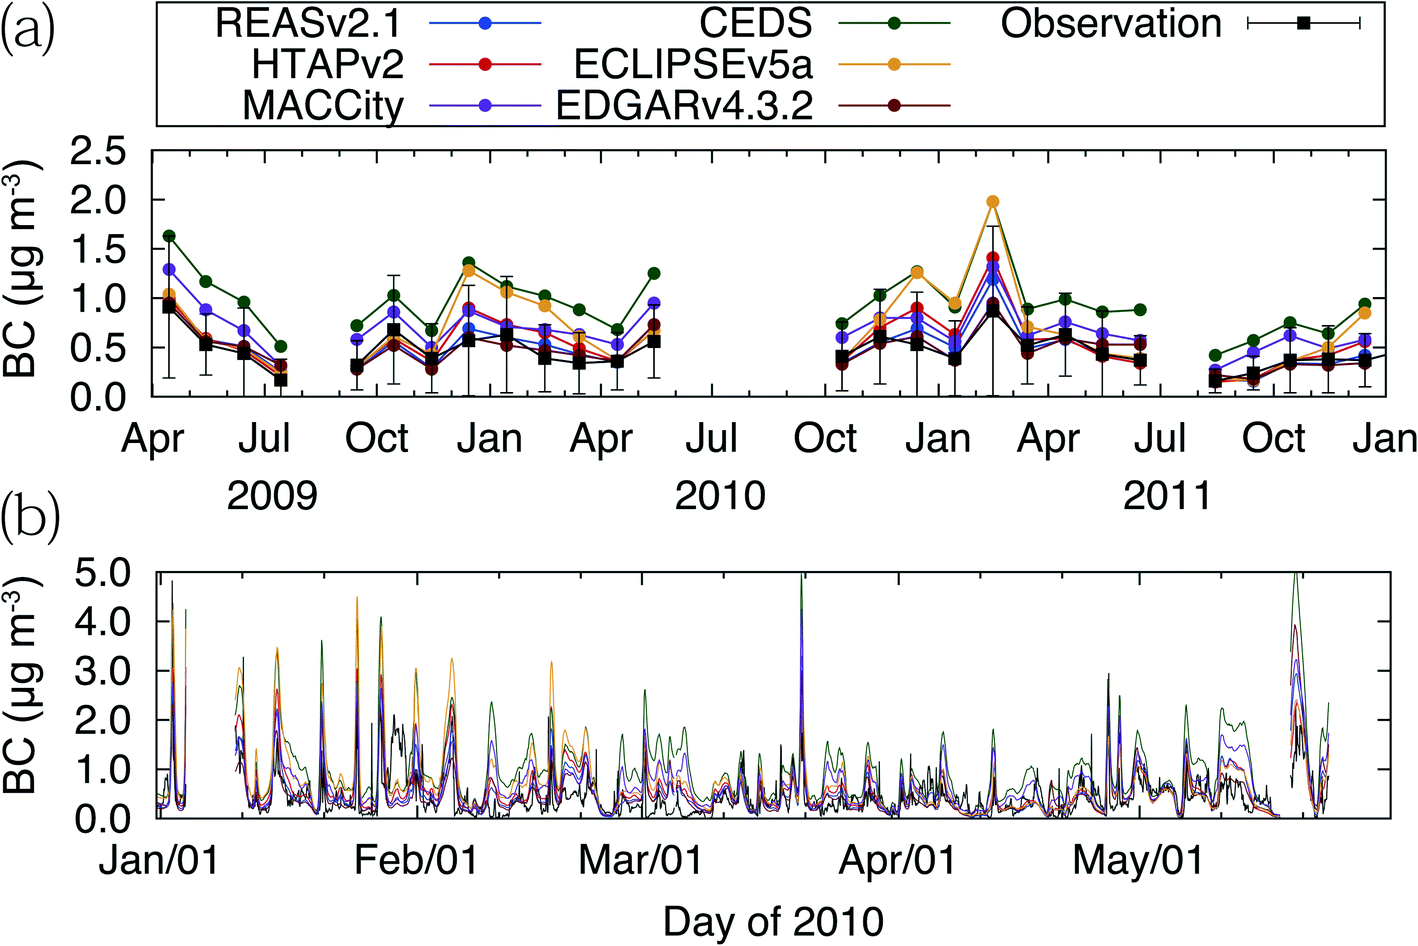 | ||
| Fig. 4 (a) Comparisons of the monthly averaged BC concentrations from observations and GEOS-Chem simulations at Fukue Island from 2009 to 2011. The error bar in (a) indicates the standard deviation of hourly BC concentrations. (b) Comparisons of the hourly BC concentrations observed and those simulated by the model in January to May 2010. | ||
| Obs. | REASv2.1 | HTAPv2 | MACCity | ECLIPSEv5a | CEDS | EDGARv4.3.2 | ||
|---|---|---|---|---|---|---|---|---|
| a Winter: December to February; spring: March to May; summer: June to August; autumn: September to November, NCH: North China; SCH: South China; KOR: the Korean Peninsula; JPN: Japan. | ||||||||
| BC | Winter | 0.534 | 0.666 | 0.825 | 0.786 | 1.184 | 1.228 | 0.549 |
| Spring | 0.532 | 0.578 | 0.581 | 0.780 | 0.629 | 1.037 | 0.568 | |
| Summer | 0.255 | 0.289 | 0.255 | 0.402 | 0.281 | 0.598 | 0.335 | |
| Autumn | 0.428 | 0.362 | 0.412 | 0.613 | 0.442 | 0.770 | 0.348 | |
| All | 0.461 | 0.493 | 0.545 | 0.676 | 0.664 | 0.942 | 0.463 | |
| Correlation coefficient (R) | All | — | 0.73 | 0.72 | 0.70 | 0.68 | 0.69 | 0.70 |
| NCH BC | All | — | 0.289 | 0.328 | 0.276 | 0.425 | 0.398 | 0.215 |
| SCH BC | All | — | 0.111 | 0.100 | 0.136 | 0.103 | 0.198 | 0.142 |
| KOR BC | All | — | 0.048 | 0.075 | 0.188 | 0.089 | 0.274 | 0.052 |
| JPN BC | All | — | 0.019 | 0.013 | 0.049 | 0.016 | 0.037 | 0.021 |
Fig. 4b shows temporal variations of observed and simulated hourly BC concentrations at Fukue Island in winter and spring (January to May 2010), when the transport from the Asian continent was frequent. The six model simulations captured hourly variations, including elevated BC concentrations. The correlation coefficients of the hourly concentrations for the whole study period were 0.68–0.73 (Table 3). These results indicate that GEOS-Chem can reproduce hourly and seasonal variations of observed BC concentrations at Fukue Island.
The average concentrations for the entire period calculated using the model were 0.463–0.942 μg m−3, with a difference of approximately two times between the maximum and minimum values (Table 3). The minimum concentration based on EDGARv4.3.2 was close to the observed average value of 0.461 μg m−3. The maximum value was simulated by the CEDS inventory and the observation was overestimated by approximately 100%. The overestimations by CEDS were found in all seasons with the ratios of modeled to observed seasonal averages of 1.80–2.30. This arises from that CEDS has the largest emissions from China (i.e., NCH + SCH) in all seasons (Fig. S6 and Table S1†). The energy and domestic sectors contributed to the largest Chinese emissions of the CEDS inventory (Fig. 3). For the other four inventories, the ratios of simulated to observed average BC concentrations were estimated to be 1.07 for REASv2.1, 1.18 for HTAPv2, 1.47 for MACCity, and 1.44 for ECLIPSEv5a. Seasonally, the model/observation ratios were highest in winter for REASv2.1, HTAPv2, and ECLIPSEv5a. In particular, ECLIPSEv5a showed a larger positive bias in winter than in all seasons, with a model/observation ratio of 2.22. This positive bias by ECLIPSEv5a in winter could be attributed to the highest domestic emissions of ECLIPSEv5a from NCH because this sector contributed to the larger emissions of ECLIPSv5a in winter (Fig. 3 and S6†).
Table 3 also shows contributions from four regions in East Asia (NCH, SCH, KOR, and JPN) to the average BC concentration for 2009–2011 at Fukue Island. BC from NCH and SCH had contributions of 0.215–0.425 μg m−3 and 0.100–0.198 μg m−3, respectively, with differences of approximately two times between the maximum and minimum values in both tracers. At Fukue, the contribution from China was dominant, with the total of BC originating from NCH and SCH having relative contributions of ∼80% for REAv2.1, HTAPv2, ECLIPSEv5a, and EDGARv4.3.2, and ∼60% for MACCity and CEDS. Therefore, the differences in the calculated total BC concentrations between the six simulations were mainly caused by the differences in the emission estimates over China. While the relative contributions of KOR were estimated to be ∼10% for REASv2.1, HTAPv2, ECLIPSEv5a, and EDGARv4.3.2, KOR had larger contributions of ∼30% for CEDS and MACCity that estimated higher emissions from the Korean Peninsula than the other four inventories. This result is consistent with Fig. 2 and Table 2 that show larger BC emissions from KOR. JPN was estimated to contribute 0.013–0.049 μg m−3, which was the smallest among the four regions in East Asia in all simulations.
Table 4 summarizes the observed and simulated results after the selection of data (RCHN > 80% and TECHN > 80%). After the selection, the number of available data was 1933–2576 h, corresponding to 10–13% of the total data. The correlation coefficients of the hourly concentrations between the observations and the simulations were estimated to be 0.64–0.73 after the data selection, similar to those for the whole period. The mean concentrations of the model were 1.257–2.144 μg m−3 for the entire period of RCHN > 80% and TECHN > 80%. The observed mean concentrations were estimated to be 0.993–1.062 μg m−3 for each simulation. The simulation using EDGARv4.3.2, which estimated the smallest emissions from China, had the closest concentration to the observation with a model/observation ratio of 1.24 (Table 4). Although the model results using REASv2.1, HTAPv2, and MACCity were somewhat larger than the observations, the model/observation ratios were within 1.5 (1.35–1.47). For ECLIPSEv5a, the model/observation ratio was estimated to be 1.79, suggesting an overestimation of BC emissions from China in this inventory. The simulation using CEDS with the highest emission estimate showed the largest model/observation ratio of 2.16. This result also suggests that the CEDS inventory overestimates Chinese BC emissions.
| REASv2.1 | HTAPv2 | MACCity | ECLIPSEv5a | CEDS | EDGARv4.3.2 | |
|---|---|---|---|---|---|---|
| Hourly data numbers | 2413 | 2221 | 1980 | 2576 | 1933 | 2378 |
| Observation (μg m−3) | 1.029 | 1.062 | 0.995 | 0.993 | 0.993 | 1.010 |
| Model (μg m−3) | 1.393 | 1.554 | 1.465 | 1.777 | 2.144 | 1.257 |
| Model/obs. ratio | 1.35 | 1.46 | 1.47 | 1.79 | 2.16 | 1.24 |
To examine how BC emissions from NCH and SCH affected the results after the data selection, the model/observation ratios were estimated separately for the cases in which the contribution of NCH was larger than that of SCH (RNCH > RSCH) or not (RSCH > RNCH). The model/observation ratios for the case of RNCH > RSCH were smaller than those of RSCH > RNCH for all five inventories except ECLIPSEv5a (Tables S2 and S3†). This result suggests that the positive biases in SCH are larger than those in NCH for REASv2.1, HTAPv2, MACCity, CEDS, and EDGARv4.3.2.
Fig. 5 shows the results of the six simulations and observations for each season after the data selection. For spring, the mean biases were less than 0.5 μg m−3 for the five inventories except CEDS, and the model/observation ratios of the seasonal averages agreed within 1.5. The simulation using CEDS showed an average concentration of 2.00 μg m−3 in spring, which was about two times larger than the observed average (1.01 μg m−3). The results in autumn were similar to those in spring, with somewhat less biases than during spring for all inventories. In winter, the BC emissions from China were the largest in all bottom-up inventories due to the increase in the emissions from the domestic sector (Fig. S6†). The seasonal mean biases were the largest during winter for the four inventories: REASv2.1, HTAPv2, ECLIPSEv5a, and CEDS. These results suggested that the domestic sector contributed the overestimation of these inventories in winter, because its emissions increased in winter and the other sectors had weak seasonal variations (Fig. S6†). For ECLIPSEv5a and HTAPv2, the model/observation ratios of the seasonal averages in winter were estimated to be 2.33 and 1.70, respectively, which were larger than those for all seasons (1.79 and 1.46). These two inventories had the largest and second largest emissions in winter among all inventories except CEDS (Fig. S6†). The CEDS inventory estimated the highest emissions in all seasons, and the simulation using this inventory had the largest positive biases among the six inventories for every season (Fig. 5).
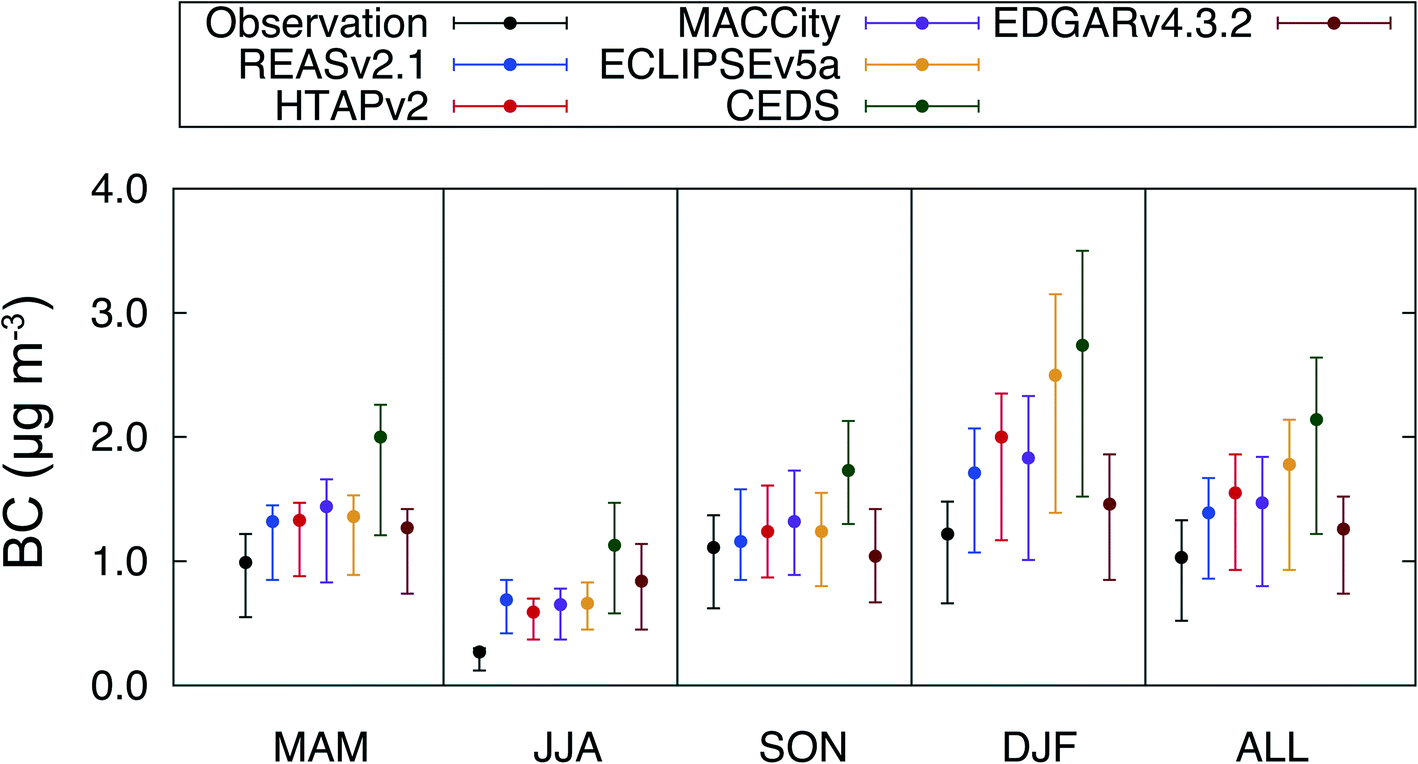 | ||
| Fig. 5 Comparison of the average (solid circles) and 25th to 75th range (error bars) of hourly BC mass concentrations observed at Fukue Island in each season and the entire period (April 2009 to December 2011) and those simulated by GEOS-Chem after the data selection with RCHN > 80% and TECHN > 80%. | ||
Fig. 6 shows the correlation between BC emissions from China for each inventory and the model/observation ratios of the averaged concentrations after data selection. The model/observation ratios were highly correlated with the Chinese BC emissions of the bottom-up inventories (R = 0.96, Fig. 6). We also estimated BC emissions from China by linear regression between the emission estimates by inventories and the model/observation ratios. For the model/observation ratio to be unity in the regression line, Chinese BC emissions were estimated to be 1.14 Tg per year, which is very similar to the average value estimated by dividing the BC emissions of each inventory by the average model/observation ratios. This estimate is for the total emissions from China, and further evaluation at the sectorial levels is needed in the future33 because there are large differences in each sector among the inventories as mentioned above (Fig. 3).
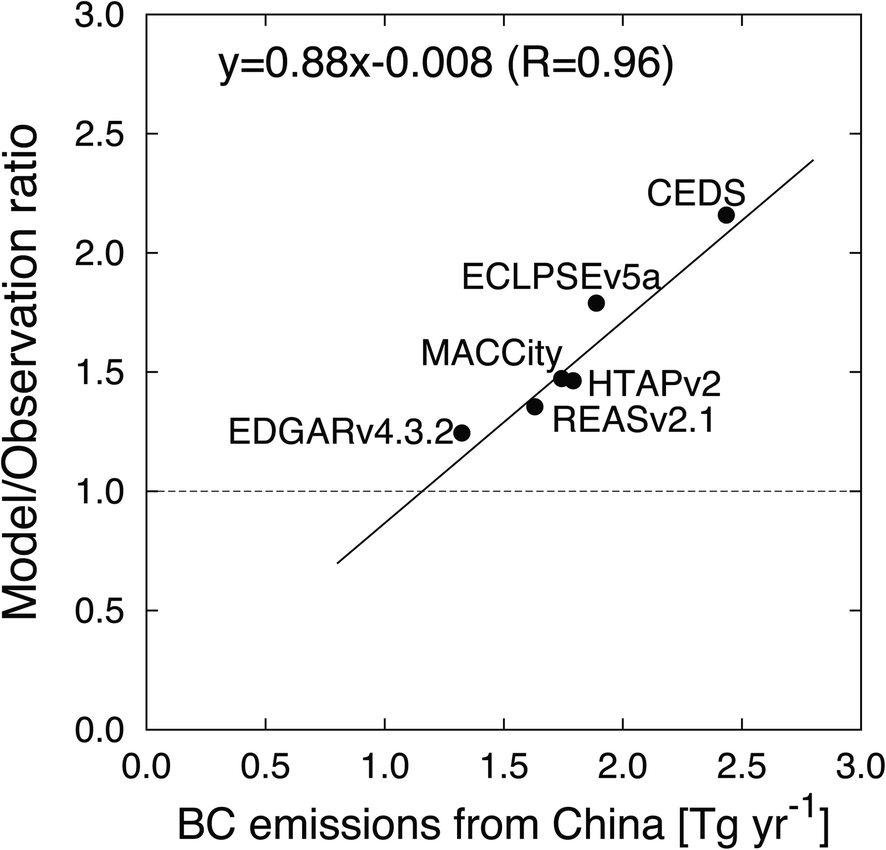 | ||
| Fig. 6 Scatterplot of BC emissions from China in bottom-up inventories and model/observation ratios of averaged BC concentrations at Fukue Island from 2009 to 2011 after the data selection with RCHN > 80% and TECHN > 80%. | ||
The estimates of BC emissions from China in the CEDS and ECLIPSEv5a inventories were much higher (1.8 and 2.2 Tg per year) than the estimate in this study. BC emissions estimated by multiplying the BC/CO emissions ratio derived from observations with CO emissions in previous studies also did not support these high emissions from China.19,36 The recently updated version of CEDS (v_2020_09_11) estimates Chinese BC emissions of 1.48 Tg per year for 2010,38 which is relatively close to our estimate in this study compared to the original value of CEDS. The ECLIPSE version 6b also estimates lower China's BC emissions of 1.33 Tg per year for 2010 compared to version 5b, which is more consistent with the estimate of the present study.39
4. Conclusions
We evaluated anthropogenic BC emissions from East Asia for five global inventories and one regional inventory using GEOS-Chem tagged BC simulations and observations at Fukue Island in western Japan. The inventories used in the present study include REASv2.1, HTAPv2, MACCity, ECLIPSEv5a, CEDS, and EDGARv4.3.2, which have been widely used in various modeling studies, including model intercomparison projects for climate and air quality. To examine the variation between bottom-up emission inventories, we first compared anthropogenic BC emissions from East Asia in six inventories by region and sector. The inventories used in the present study included REASv2.1, HTAPv2, MACCity, ECLIPSEv5a, CEDS, and EDGARv4.3.2. The total BC emissions in China for 2010 were estimated to be 1.32–2.44 Tg per year, indicating a large difference of 85% between the maximum (CEDS) and minimum (EDGARv4.3.2). The comparisons divided into North China and South China and the horizontal distributions showed that even inventories with similar total emissions at the national scale had larger differences at regional and local scales. These results highlight the importance of comparisons not only at the national scale but also at finer scales to evaluate uncertainties between emission inventories. The comparison of BC emissions from each sector indicated that the difference in the total emissions from China was mainly caused by the differences in the emissions from the domestic, industry, and energy sectors.We conducted model simulations for 2009–2011 with each emission inventory using GEOS-Chem and compared them with BC observations at Fukue Island, Japan. The model simulations reproduced the observed temporal variations, including the elevated BC concentrations on hourly and daily scales and the seasonal change quite well. In terms of absolute values, the simulated average BC concentrations at Fukue Island showed a difference of approximately two times between a maximum and a minimum because of the differences in the emission estimates over China.
We quantitatively evaluated the six bottom-up inventories and estimated BC emissions from China. This analysis was conducted by selecting hourly BC data with a dominant contribution from China (RCHN>80%) and least influenced by wet removal during transport (TECHN > 80%). The number of available data after data selection was substantial (N ∼ 2000) compared to previous studies. The comparisons after the data selection showed that the simulated average BC concentrations were 24–116% larger than the observed values. For REASv2.1, HTAPv2, MACCity, and EDGARv4.3.2, the simulated results agreed with the observations with a positive bias less than 50%. On the other hand, it was suggested that CEDS used in CMIP6 and ECLIPSEv5a overestimated BC emissions from China by 116% and 79%, respectively. Seasonal analysis suggested that the emissions from the domestic sector in winter led to the overestimation of ECLIPSEv5a and CEDS. Using the model to observation ratios, we estimated BC emissions from China to be 1.14 Tg per year averaged for 2009–2011, which was close to the lowest estimate of the bottom-up inventories. In future studies, it would be important to evaluate BC emissions from East Asia, including China, using observational data from multiple sites when available in addition to Fukue Island. It would be also desirable to evaluate bottom-up emissions of other aerosol precursors such as SO2 and NOx using ground-based and satellite observations.
Conflicts of interest
There are no conflicts of interest to declare.Acknowledgements
Financial support was given by the Environmental Research and Technology Development Fund (ERTDF) from the Ministry of the Environment, Japan (grant no. 2-1803: JPMEERF20182003). This work was supported by JSPS KAKENHI grant number JP21K12216.References
- T. C. Bond, S. J. Doherty, D. W. Fahey, P. M. Forster, T. Berntsen, B. J. DeAngelo, M. G. Flanner, S. Ghan, B. Kärcher, D. Koch, S. Kinne, Y. Kondo, P. K. Quinn, M. C. Sarofim, M. G. Schultz, M. Schulz, C. Venkataraman, H. Zhang, S. Zhang, N. Bellouin, S. K. Guttikunda, P. K. Hopke, M. Z. Jacobson, J. W. Kaiser, Z. Klimont, U. Lohmann, J. P. Schwarz, D. Shindell, T. Storelvmo, S. G. Warren and C. S. Zender, Bounding the role of black carbon in the climate system: a scientific assessment, J. Geophys. Res.: Atmos., 2013, 118, 5380–5552, DOI:10.1002/jgrd.50171.
- IPCC, Climate Change, The Physical Science Basis. Contribution of Working Group I to the Fifth Assessment Report of the Intergovernmental Panel on Climate Change, Cambridge University Press, Cambridge, United Kingdom, New York and USA, 2013 Search PubMed.
- AMAP, AMAP Assessment, Black Carbon and Ozone as Arctic Climate Forcers, Arctic Monitoring and Assessment Programme (AMAP), Norway, Oslo, 2015 Search PubMed.
- J. Lelieveld, J. S. Evans, M. Fnais, D. Giannadaki and A. Pozzer, The contribution of outdoor air pollution sources to premature mortality on a global scale, Nature, 2015, 525, 367–371, DOI:10.1038/nature15371.
- S. C. Anenberg, J. Schwartz, D. Shindell, M. Amann, G. Faluvegi, Z. Klimont, G. Janssens-Maenhout, L. Pozzoli, R. Van Dingenen, E. Vignati, L. Emberson, N. Z. Muller, J. J. West, M. Williams, V. Demkine, W. K. Hicks, J. Kuylenstierna, F. Raes and V. Ramanathan, Global air quality and health co-benefits of mitigating near-term climate change through methane and black carbon emission controls, Environ. Health Perspect., 2012, 120, 831–839, DOI:10.1289/ehp.1104301.
- G. Janssens-Maenhout, M. Crippa, D. Guizzardi, F. Dentener, M. Muntean, G. Pouliot, T. Keating, Q. Zhang, J. Kurokawa, R. Wankmüller, H. Denier van der Gon, J. J. P. Kuenen, Z. Klimont, G. Frost, S. Darras, B. Koffi and M. Li, HTAP_v2.2: a mosaic of regional and global emission grid maps for 2008 and 2010 to study hemispheric transport of air pollution, Atmos. Chem. Phys., 2015, 15, 11411–11432, DOI:10.5194/acp-15-11411-2015.
- J. Kurokawa, T. Ohara, T. Morikawa, S. Hanayama, G. Janssens-Maenhout, T. Fukui, K. Kawashima and H. Akimoto, Emissions of air pollutants and greenhouse gases over Asian regions during 2000–2008: Regional Emission inventory in Asia (REAS) version 2, Atmos. Chem. Phys., 2013, 13, 11019–11058, DOI:10.5194/acp-13-11019-2013.
- E. Saikawa, H. Kim, M. Zhong, A. Avramov, Y. Zhao, G. Janssens-Maenhout, J.-I. Kurokawa, Z. Klimont, F. Wagner, V. Naik, L. W. Horowitz and Q. Zhang, Comparison of emissions inventories of anthropogenic air pollutants and greenhouse gases in China, Atmos. Chem. Phys., 2017, 17, 6393–6421, DOI:10.5194/acp-17-6393-2017.
- M. Li, Z. Klimont, Q. Zhang, R. V. Martin, B. Zheng, C. Heyes, J. Cofala, Y. Zhang and K. He, Comparison and evaluation of anthropogenic emissions of SO2 and NOx over China, Atmos. Chem. Phys., 2018, 18, 3433–3456, DOI:10.5194/acp-18-3433-2018.
- I. Bouarar, G. Brasseur, K. Petersen, C. Granier, Q. Fan, X. M. Wang, L. L. Wang, D. S. Ji, Z. R. Liu, Y. Xie, W. Gao and N. Elguindi, Influence of anthropogenic emission inventories on simulations of air quality in China during winter and summer 2010, Atmos. Environ., 2019, 198, 236–256, DOI:10.1016/j.atmosenv.2018.10.043.
- Y. Kondo, N. Oshima, M. Kajino, R. Mikami, N. Moteki, N. Takegawa, R. L. Verma, Y. Kajii, S. Kato and A. Takami, Emissions of black carbon in East Asia estimated from observations at a remote site in the East China Sea, J. Geophys. Res., 2011, 116, D16201, DOI:10.1029/2011JD015637.
- Q. Zhang, D. G. Streets, G. R. Carmichael, K. B. He, H. Huo, A. Kannari, Z. Klimont, I. S. Park, S. Reddy, J. S. Fu, D. Chen, L. Duan, Y. Lei, L. T. Wang and Z. L. Yao, Asian emissions in 2006 for the NASA INTEX-B mission, Atmos. Chem. Phys., 2009, 9, 5131–5153, DOI:10.5194/acp-9-5131-2009.
- Y. Kanaya, K. Yamaji, T. Miyakawa, F. Taketani, C. Zhu, Y. Choi, Y. Komazaki, K. Ikeda, Y. Kondo and Z. Klimont, Rapid reduction in black carbon emissions from China: evidence from 2009–2019 observations on Fukue Island, Japan, Atmos. Chem. Phys., 2020, 20, 6339–6356, DOI:10.5194/acp-20-6339-2020.
- C. Granier, B. Bessagnet, T. Bond, A. D'Angiola, H. D. van der Gon, G. J. Frost, A. Heil, J. W. Kaiser, S. Kinne, Z. Klimont, S. Kloster, J. -F. Lamarque, C. Liousse, T. Masui, F. Meleux, A. Mieville, T. Ohara, J. -C. Raut, K. Riahi, M. G. Schultz, S. J. Smith, A. Thompson, J. van Aardenne, G. R. van der Werf and D. P. van Vuuren, Evolution of anthropogenic and biomass burning emissions of air pollutants at global and regional scales during the 1980–2010 period, Clim. Change, 2011, 109, 163–190, DOI:10.1007/s10584-011-0154-1.
- Z. Klimont, K. Kupiainen, C. Heyes, P. Purohit, J. Cofala, P. Rafaj, J. Borken-Kleefeld and W. Schöpp, Global anthropogenic emissions of particulate matter including black carbon, Atmos. Chem. Phys., 2017, 17, 8681–8723, DOI:10.5194/acp-17-8681-2017.
- R. M. Hoesly, S. J. Smith, L. Feng, Z. Klimont, G. Janssens-Maenhout, T. Pitkanen, J. J. Seibert, L. Vu, R. J. Andres, R. M. Bolt, T. C. Bond, L. Dawidowski, N. Kholod, J.-I. Kurokawa, M. Li, L. Liu, Z. Lu, M. C. P. Moura, P. R. O'Rourke and Q. Zhang, Historical (1750–2014) anthropogenic emissions of reactive gases and aerosols from the Community Emissions Data System (CEDS), Geosci. Model Dev., 2018, 11, 369–408, DOI:10.5194/gmd-11-369-2018.
- M. Crippa, D. Guizzardi, M. Muntean, E. Schaaf, F. Dentener, J. A. van Aardenne, S. Monni, U. Doering, J. G. J. Olivier, V. Pagliari and G. Janssens-Maenhout, Gridded emissions of air pollutants for the period 1970–2012 within EDGAR v4.3.2, Earth Syst. Sci. Data, 2018, 10, 1987–2013, DOI:10.5194/essd-10-1987-2018.
- K. Ikeda, K. Yamaji, Y. Kanaya, F. Taketani, X. Pan, Y. Komazaki, J. Kurokawa and T. Ohara, Sensitivity analysis of source regions to PM2.5 concentration at Fukue Island, Japan, J. Air Waste Manage. Assoc., 2014, 64, 445–452, DOI:10.1080/10962247.2013.845618.
- Y. Kanaya, X. Pan, T. Miyakawa, Y. Komazaki, F. Taketani, I. Uno and Y. Kondo, Long-term observations of black carbon mass concentrations at Fukue Island, Western Japan, during 2009–2015: constraining wet removal rates and emission strengths from East Asia, Atmos. Chem. Phys., 2016, 16, 10689–10705, DOI:10.5194/acp-16-10689-2016.
- Y. Kanaya, F. Taketani, Y. Komazaki, X. Liu, Y. Kondo, L. K. Sahu, H. Irie and H. Takashima, Comparison of black carbon mass concentrations observed by Multi-Angle Absorption Photometer (MAAP) and Continuous Soot-Monitoring System (COSMOS) on Fukue Island and in Tokyo, Japan, Aerosol Sci. Technol., 2013, 47, 1–10, DOI:10.1080/02786826.2012.716551.
- T. Miyakawa, N. Oshima, F. Taketani, Y. Komazaki, A. Yoshino, A. Takami, Y. Kondo and Y. Kanaya, Alteration of the size distributions and mixing states of black carbon through transport in the boundary layer in East Asia, Atmos. Chem. Phys., 2017, 17, 5851–5864, DOI:10.5194/acp-17-5851-2017.
- I. Bey, D. J. Jacob, J. A. Logan and R. M. Yantosca, Asian chemical outflow to the Pacific in spring: Origins, pathways, and budgets, J. Geophys. Res., 2001, 106, 23097–23113, DOI:10.1029/2001JD000806.
- K. Ikeda, H. Tanimoto, T. Sugita, H. Akiyoshi, Y. Kanaya, C. Zhu and F. Taketani, Tagged tracer simulations of black carbon in the Arctic: transport, source contributions, and budget, Atmos. Chem. Phys., 2017, 17, 10515–10533, DOI:10.5194/acp-17-10515-2017.
- R. J. Park, D. J. Jacob, P. I. Palmer, A. D. Clarke, R. J. Weber, M. A. Zondlo, F. L. Eisele, A. R. Bandy, D. C. Thornton, G. W. Sachse and T. C. Bond, Export efficiency of black carbon aerosol in continental outflow: global implications, J. Geophys. Res.: Atmos., 2005, 110, D11205, DOI:10.1029/2004JD005432.
- H. Y. Liu, D. J. Jacob, I. Bey and R. M. Yantosca, Constraints from Pb-210 and Be-7 on wet deposition and transport in a global three-dimensional chemical tracer model driven by assimilated meteorological fields, J. Geophys. Res.: Atmos., 2001, 106, 12109–12128, DOI:10.1029/2000JD900839.
- K. Ikeda, H. Tanimoto, T. Sugita, H. Akiyoshi, C. Clerbaux and P.-F. Coheur, Model and satellite analysis of transport of Asian anthropogenic pollution to the Arctic: Siberian and Pacific pathways and their meteorological controls, J. Geophys. Res.: Atmos., 2021, 126, e2020JD033459, DOI:10.1029/2020JD033459.
- J. Liu, S. Fan, L. W. Horowitz and H. Levy II, Evaluation of factors controlling long-range transport of black carbon to the Arctic, J. Geophys. Res., 2011, 116, D04307, DOI:10.1029/2010JD015145.
- Q. Wang, D. J. Jacob, J. A. Fisher, J. Mao, E. M. Leibensperger, C. C. Carouge, P. Le Sager, Y. Kondo, J. L. Jimenez, M. J. Cubison and S. J. Doherty, Sources of carbonaceous aerosols and deposited black carbon in the Arctic in winter-spring: implications for radiative forcing, Atmos. Chem. Phys., 2011, 11, 12453–12473, DOI:10.5194/acp-11-12453-2011.
- Q. Bourgeois and I. Bey, Pollution transport efficiency toward the Arctic: sensitivity to aerosol scavenging and source regions, J. Geophys. Res., 2011, 116, D08213, DOI:10.1029/2010JD015096.
- G. R. van der Werf, J. T. Randerson, L. Giglio, G. J. Collatz, M. Mu, P. S. Kasibhatla, D. C. Morton, R. S. DeFries, Y. Jin and T. T. van Leeuwen, Global fire emissions and the contribution of deforestation, savanna, forest, agricultural, and peat fires (1997–2009), Atmos. Chem. Phys., 2010, 10, 11707–11735, DOI:10.5194/acp-10-11707-2010.
- L. Kong, X. Tang, J. Zhu, Z. Wang, J. S. Fu, X. Wang, S. Itahashi, K. Yamaji, T. Nagashima, H.-J. Lee, C.-H. Kim, C.-Y. Lin, L. Chen, M. Zhang, Z. Tao, J. Li, M. Kajino, H. Liao, Z. Wang, K. Sudo, Y. Wang, Y. Pan, G. Tang, M. Li, Q. Wu, B. Ge and G. R. Carmichael, Evaluation and uncertainty investigation of the NO2, CO and NH3 modeling over China under the framework of MICS-Asia III, Atmos. Chem. Phys., 2020, 20, 181–202, DOI:10.5194/acp-20-181-2020.
- K. Ikeda, K. Yamaji, Y. Kanaya, F. Taketani, X. Pan, Y. Komazaki, J. Kurokawa and T. Ohara, Source region attribution of PM2.5 mass concentrations over Japan, Geochem. J., 2015, 49, 185–194, DOI:10.2343/geochemj.2.0344.
- Y. Kanaya, K. Yamaji, T. Miyakawa, F. Taketani, C. Zhu, Y. Choi, K. Ikeda, H. Tanimoto, D. Yamada, D. Narita, Y. Kondo and Z. Klimont, Dominance of the residential sector in Chinese black carbon emissions as identified from downwind atmospheric observations during the COVID-19 pandemic, Sci. Rep., 2021, 11, 23378, DOI:10.1038/s41598-021-02518-2.
- K. Yumimoto, I. Uno and S. Itahashi, Long-term inverse modeling of Chinese CO emission from satellite observations, Environ. Pollut., 2014, 195, 308–318, DOI:10.1016/j.envpol.2014.07.026.
- Y. Tohjima, M. Kubo, C. Minejima, H. Mukai, H. Tanimoto, A. Ganshin, S. Maksyutov, K. Katsumata, T. Machida and K. Kita, Temporal changes in the emissions of CH4 and CO from China estimated from CH4/CO2 and CO/CO2 correlations observed at Hateruma Island, Atmos. Chem. Phys., 2014, 14, 1663–1677, DOI:10.5194/acp-14-1663-2014.
- Y. Choi, Y. Kanaya, S. -M. Park, A. Matsuki, Y. Sadanaga, S. -W. Kim, I. Uno, X. Pan, M. Lee, H. Kim and D. H. Jung, Regional variability in black carbon and carbon monoxide ratio from long-term observations over East Asia: assessment of representativeness for black carbon (BC) and carbon monoxide (CO) emission inventories, Atmos. Chem. Phys., 2020, 20, 83–98, DOI:10.5194/acp-20-83-2020.
- Y. Kondo, Effects of black carbon on climate: Advances in measurement and modeling, Monogr. Environ. Earth Planets, 2015, 3, 1–85, DOI:10.5047/meep.2015.00301.0001.
- P. R. O'Rourke, S. J. Smith, E. E. McDuffie, Z. Klimont, M. Crippa, A. Mott and R. M. Hoesly, CEDS v_2020_09_11 Pre-Release Emission Data (Version v_2020_09_11) [Data set], Zenodo, 2020, http://doi.org/ DOI:10.5281/zenodo.4025316, accessed June 2021.
- ECLIPSE V6 global emission fields, https://iiasa.ac.at/web/home/research/researchPrograms/air/ECLIPSEv6.html, accessed on June 2021.
Footnote |
| † Electronic supplementary information (ESI) available. See DOI: 10.1039/d1ea00051a |
| This journal is © The Royal Society of Chemistry 2022 |