
 Open Access Article
 This Open Access Article is licensed under a Creative Commons Attribution-Non Commercial 3.0 Unported Licence
Modulation of transport properties via S/Br substitution: solvothermal synthesis, crystal structure, and transport properties of Bi13S17Br3†
Dinesh K.
Amarasinghe
a,
Philip
Yox
ab,
Gayatri
Viswanathan
 ab,
Adedoyin N.
Adeyemi
a and
Kirill
Kovnir
*ab
ab,
Adedoyin N.
Adeyemi
a and
Kirill
Kovnir
*ab
aDepartment of Chemistry, Iowa State University, Ames, Iowa 50011, USA. E-mail: kovnir@iastate.edu
bAmes National Laboratory, U.S. Department of Energy, Ames, Iowa 50011, USA
First published on 30th September 2022
Abstract
The solvothermal synthetic exploration of the Bi–S–halogen phase space resulted in the synthesis of two bismuth sulfohalides with common structural motifs. Bi13S18I2 was confirmed to have the previously reported composition and crystal structure. In contrast, the bromide analogue was shown to have a formula of neither Bi19S27Br3 nor Bi13S18Br2, in contrast to the previous reports. The composition, refined from single crystal X-ray diffraction and confirmed by elemental analysis, high-resolution powder X-ray diffraction, and total scattering, is close to Bi13S17Br3 due to the partial S/Br substitution in the framework. Bi13S18I2 and Bi13S17Br3 are n-type semiconductors with similar optical bandgaps of ∼0.9 eV but different charge and heat transport properties. Due to the framework S/Br disorder, Bi13S17Br3 exhibits lower thermal and electrical conductivities than the iodine-containing analogue. The high Seebeck coefficients and ultralow thermal conductivities indicate that the reported bismuth sulfohalides are promising platforms to develop novel thermoelectric materials.
Introduction
Bismuth chalcogenides and chalcohalides constitute an important class of thermoelectric materials with low thermal conductivity.1–6 Bi2Te3 is the state-of-the-art thermoelectric material with the highest thermoelectric performance for near-room temperature applications.3 However, the scarcity of Te and Se compared to S has called for research towards screening bismuth sulfides and bismuth sulfohalides, Bi–S–X (X = Cl, Br, and I), as alternative thermoelectric materials.1 The latter family of materials comprises the well-known BiSX series7–9 and a few other complex phases including Bi19S27X3,10–12 Bi4S2Cl5,13 Bi6.88S8.64Cl3.36, and Bi6.64S7.92Cl4.08.14 BiSX and Bi19S27X3 have been widely investigated for various applications due to their interesting pyroelectric,15 photocatalytic,16 photoelectric,17 and photothermal18 characteristics. The detailed structural analysis enabled by the growth of high-quality single crystals has shown that Bi19S27I3 is rich in Bi and has an actual composition of Bi13S18I2.19 Solution-processed Bi13S18I2 was recently reported to be an n-type thermoelectric material with a high ZT value of 1.0 at 788 K.20 The high thermoelectric performance of Bi13S18I2 was attributed to the presence of distinct electronic and phonon structure motifs, which results in a narrow bandgap and strong phonon scattering, respectively.Given the structural similarity between Bi19S27I3 and Bi19S27Br3 in the original reports,11,12 we hypothesized that the actual composition of the bismuth sulfur bromide is “Bi13S18Br2” and this phase may exhibit promising thermoelectrical properties. With that assumption in mind, we aimed at developing a suitable, facile synthetic method to access Bi13S18Br2. Previous approaches employed to obtain Bi19S27Br3 include high-temperature solid-state reaction,11 colloidal synthesis,21 microwave-assisted aqueous synthesis,22 and solvothermal methods.23 In this study, we exploited the latter method, given the ability of solvothermal conditions to stabilize metastable phases. Our low-temperature solvothermal synthesis employing ethanol as the solvent yielded single crystals suitable for structure redetermination; the composition of the single crystals was determined to be neither Bi19S27Br3 nor Bi13S18Br2. The compound indeed has 13 Bi atoms, but it also exhibits S/Br substitution in the Bi–S framework leading to the actual composition of Bi12.9(1)S17.2(1)Br2.9(1)i.e., Bi13S18−δBr2+δ, δ ∼ 0.9(1). For clarity, herein, this composition will be referred to as Bi13S17Br3.
In this article, we report the synthesis, formation mechanism, single crystal growth, crystal structure determination, and transport properties of Bi13S17Br3. The average and local crystal structures of Bi13S17Br3 are probed by structural refinements of the powder X-ray diffraction and X-ray total scattering data, respectively. Low-temperature charge and thermal transport properties are investigated and compared to those of Bi13S18I2.
Experimental
Synthesis
WARNING: Owing to the generation of high autogenic pressures and the potential release of gaseous species, solvothermal reactions should be conducted in high-strength reaction vessels. Splashing of the solvent may occur upon opening the autoclaves. Wearing of proper protective equipment including face-shields, long-sleeve hot gloves, and tight-cuff lab coats as well as placing furnaces in well-ventilated spaces such as fume hoods are highly recommended. A facile solvothermal method was developed to synthesize polycrystalline Bi13S17Br3 samples. Thiourea, CH4N2S (Fisher Scientific, 99.4%), BiBr3 (Alfa Aesar, 99%), and NaBr (Fisher Scientific, 99.9%) were used as received. Manipulation of the reactants and solvents was performed in a glovebox under an argon atmosphere. In a typical synthesis, CH4N2S (0.50 mmol), BiBr3 (0.33 mmol), and NaBr (0.50 mmol) were added into a Teflon liner containing 10 mL of ethanol (EtOH). The filling fraction was 43%. The liner was sealed inside a stainless-steel autoclave, which was then placed inside a furnace and dwelled at 180 °C for 24 h. Next, the reaction vessel was allowed to cool naturally to room temperature. The product was filtered, washed with EtOH, and dried in air. Black powders were obtained. Solvothermal recrystallization of ∼20 mg of the Bi13S17Br3 powder in 4 mL of EtOH at 180 °C yielded needle-like crystals suitable for single-crystal X-ray diffraction. In addition, samples of pristine Bi13S18I2 were synthesized for property measurements using S (Alfa Aesar, 99.5%), BiI3 (Sigma-Aldrich, 99%), and NH4I (Alfa Aesar, 98%) as the reactants. These reactions were performed at 150 °C for 24 h after mixing S (0.50 mmol), BiI3 (0.33 mmol), and NH4I (0.50 mmol) in dimethylformamide (DMF). The product was filtered, washed with EtOH, and dried in air. The sample was black in color.Powder X-ray diffraction (PXRD)
Room-temperature PXRD patterns were collected using a benchtop Rigaku Miniflex 600 operated at 40 kV and 15 mA. Cu-Kα (λ = 1.5418 Å) radiation and a Ni-Kβ filter were used. Scans were carried out in the 5–80° 2θ range.In situ synchrotron PXRD studies
The formation of Bi13S17Br3 was investigated using the in situ synchrotron PXRD data collected at beamline 17-BM-B (λ = 0.24075 Å) at the Advanced Photon Source located at Argonne National Laboratory. A mixture was prepared by finely grinding together CH4N2S (0.50 mmol), BiBr3 (0.33 mmol), and NaBr (0.50 mmol) in a glovebox. Approximately 10 mg of this mixture was loaded on-site into a silica capillary closed on one end (ID-0.9 and OD-1.1 mm), which was then filled with ∼2 μL of EtOH. A dynamic pressure of 500 psi was applied using argon gas at the open end of the capillary to mimic solvothermal conditions. The glass capillary was heated using a hot air blower placed vertically 1 cm below the closed end. Variable-temperature in situ PXRD patterns were collected in the 24–185 °C temperature range by employing a heating rate of 5 °C min−1 while focusing the incident X-ray beam at the solid and solid–solvent interface regions of the vertically mounted glass capillary.Single-crystal X-ray diffraction (SCXRD)
SCXRD experiments were carried out using a Bruker D8 Venture diffractometer with a Photon100 CMOS detector. The data were collected using Mo-Kα radiation (λ = 0.71073 Å) at 100 K. The SHELX software package was used for structure solution and refinement.24High-resolution synchrotron PXRD
The synchrotron PXRD pattern of Bi13S17Br3 was measured at the 11-BM beamline of the Advanced Photon Source at the Argonne National Laboratory. The sample was diluted with amorphous silica in a 1![[thin space (1/6-em)]](https://www.rsc.org/images/entities/char_2009.gif) :5 (sample:silica) weight ratio to minimize the effects of X-ray absorption. The diluted sample was packed in a Kapton capillary and data collection was performed in the transmission mode at room temperature using a wavelength of 0.4582 Å (27.058 keV).
:5 (sample:silica) weight ratio to minimize the effects of X-ray absorption. The diluted sample was packed in a Kapton capillary and data collection was performed in the transmission mode at room temperature using a wavelength of 0.4582 Å (27.058 keV).
Rietveld analysis
General Structure Analysis System (GSAS-II) was used to perform the Rietveld refinement of synchrotron PXRD data of Bi13S17Br3.25 A structural model obtained from SCXRD (the hexagonal space group P63) was used as the basis for the refinements. The refinements were carried out in the 3–36° 2θ range. The isotropic displacement parameters were refined for all the atoms. Atomic occupancies were not refined. Difference curves and Rwp residuals were used to evaluate the agreement between the calculated and experimental diffraction patterns. Rietveld refinement was also carried out on the PXRD pattern of Bi13S18I2 collected using the laboratory benchtop diffractometer.Synchrotron X-ray total scattering and pair distribution function (PDF) analysis
The X-ray total scattering data of polycrystalline Bi13S17Br3 loaded in Kapton capillaries were collected at the 11-ID-B beamline of the Advanced Photon Source at Argonne National Laboratory. A wavelength of 0.2115 Å (58.621 keV) was used for data collection at 298 K in the transmission mode. The normalized structure function S(Q) and pair distribution function G(r) of Bi13S17Br3 were extracted using the RAD software.26S(Q) was calculated after performing corrections for the background, absorption, and Compton scattering of the X-ray total scattering data. The Fourier transformation of S(Q) using a maximum scattering vector of 22 Å−1 resulted in the G(r). PDFgui27 was used to conduct the refinements by employing the structural model extracted from the Rietveld refinement of the Bi13S17Br3 powder as the basis. The refinements were carried out in the interatomic distance range of 1.6–16 Å to accommodate all the pairs of atoms within a unit cell. Isotropic displacement parameters were refined for all the atoms. The difference curves and Rw residuals were used to estimate the agreement between the calculated and experimental G(r)s.Energy-dispersive X-ray spectroscopy (EDS)
Elemental compositions of the samples were probed using EDS, which was carried out using an FEI Quanta 250 field emission-scanning electron microscope (SEM) with an EDS detector (Oxford X-Max 80). The analysis was conducted using the Aztec software. The powders of Bi13S17Br3 and Bi13S18I2 were placed on a conductive carbon tape on an aluminum stub. An accelerating voltage of 15 kV was utilized. Multiple sites of the powder were scanned to probe the distribution of the elements in the sample.Diffuse reflectance spectroscopy
A PerkinElmer Lambda 1050+ UV/vis/NIR spectrometer equipped with a 150 mm Spectralon-coated integrating sphere was used for solid-state diffuse reflectance measurements of Bi13S17Br3 and Bi13S18I2. The samples were finely ground and loaded into a powder holder. The powders were compacted onto the lens and kept in the holder using a press and a spring. Adjustment of the iris aperture was performed to focus the beam onto the sample-loaded holder, which was positioned at the reflectance port. The specular port was kept open during the measurements. A Spectralon reference standard was used as a blank. Tauc plots were constructed by Kubelka–Munk conversion of the acquired data to estimate the direct bandgaps of the materials.Thermogravimetric analysis (TGA)
The TGA of Bi13S17Br3 and Bi13S18I2 was carried out using a Netzsch STA 449 F1 simultaneous TGA/DSC analyzer. Approximately, 2 mg of the powder was placed in an alumina crucible and heated to 860 °C under flowing argon. The heating rate was 10 °C min−1.Spark plasma sintering
Spark plasma sintering (Dr Sinter Lab Jr. 211 Lx) was used to press compact pellets of Bi13S17Br3 and Bi13S18I2. The powder was finely ground and loaded into a 5 mm-diameter graphite die with tungsten carbide plungers. The temperature was ramped to 350 °C in 5 minutes with a gradual increase in the applied uniaxial pressure to 204 MPa. The powder was held under the final temperature and pressure conditions for 10 minutes. After 10 minutes, immediate release of the applied pressure was necessary to avoid cracking of the pellet during cooling. The resulting pellet was polished to remove graphite. The geometrical densities of the pellets were 89% and 93% of the corresponding theoretical X-ray densities of Bi13S17Br3 and Bi13S18I2, respectively.Transport properties
5 mm diameter pellets of Bi13S17Br3 and Bi13S18I2 were utilized for measuring transport properties. All measurements were conducted using the Quantum Design PPMS Evercool II. Thermal conductivities and Seebeck coefficients of the pellets were measured in the 10–300 K temperature range by employing the thermal transport option with the two-probe configuration. Electrical resistivities were measured on bars cut from the pressed pellets in the same temperature range with a four-probe configuration using alternating current in the electrical transport option.Results and discussion
Synthesis
Two low-temperature solvothermal synthetic routes were developed to obtain Bi13S17Br3 and Bi13S18I2. The optimization of the synthetic conditions revealed that single-phase bromide samples can be obtained by reacting CH4N2S, BiBr3, and NaBr in a ratio of 3:2:3 in EtOH at 180 °C for 24 h. Formation of the Bi metal as an admixture was observed in the reactions carried out at temperatures above 180 °C or using higher CH4N2S:BiBr3 ratios. Bi13S18I2 could be synthesized using S, BiI3, and NH4I in a ratio of 3:2:3 in DMF at 150 °C for 24 h. We also noticed that the reaction of S, BiBr3, and NH4Br in the same ratio in ethylene glycol at 200 °C for 24 h led to the formation of a bromide analogue, Bi13S17Br3. However, the organic residues in this product made it less thermally stable than the bromide obtained from the CH4N2S route. Therefore, the bromide phase produced by the ethylene glycol route was not further utilized for property measurements.
The in situ synchrotron PXRD data were collected to unveil the formation mechanism of Bi13S17Br3 (Fig. 1). Two different areas of the sample were analyzed in the vertically aligned capillary containing the reactant mixture and EtOH: the solid–solvent interface and the lower region of solid powder. An assumption is that in the solid area the penetration of solvent is limited. The diffraction maxima corresponding to NaBr were mainly observed in the PXRD patterns collected on the solid at temperatures below ∼40 °C; no visible peaks from BiBr3 and CH4N2S were observed (Fig. 1A). This is in line with the reports claiming the ability of CH4N2S to form soluble complexes with Bi3+ in alcoholic media.22,28–30 In addition to unreacted NaBr, the appearance of diffraction maxima corresponding to S and Na2S2 in the PXRD patterns of the solid region indicated the possible thermal decomposition of the Bi3+–CH4N2S complex and its subsequent reaction with NaBr in the 40–143 °C temperature range. The formation of BiSBr and Bi13S17Br3 was observed upon increasing the temperature from 143 to 180 °C. Unreacted NaBr was also detected in the solid in the same temperature range. NaBr, BiSBr, and Bi13S17Br3 were present in the solid region after cooling to room temperature. Unlike the solid region, no formation of S, Na2S2, and BiSBr was observed at the solid–solvent interface throughout the temperature range of interest (Fig. 1B). Instead, the dissolution of crystalline NaBr was observed upon increasing the temperature up to ∼130 °C; Bi13S17Br3 started forming at 130 °C and became the only phase present in the 150–180 °C temperature range. This is in excellent agreement with the optimized reaction temperature (180 °C) employed to synthesize phase pure Bi13S17Br3 in the laboratory. In the laboratory, a significantly larger solvent to solid ratio is used for the synthesis; thus, we consider the results from the solid–solvent interface of this in situ study to be the most representative in terms of the formation mechanism. Interestingly, no traces of Bi2S3 or Bi were observed as an intermediate or admixture in the in situ studies. Therefore, based on the in situ diffraction studies, one can assume that the decomposition of the Bi3+–CH4N2S complex is driven by either temperature or the increase in the ionic strength of the solution due to NaBr dissolution or both. At relatively high EtOH concentrations, the decomposition of the complex leads to the formation of ternary bismuth sulfur bromide without any crystalline binary intermediates. In addition, we may expect the formation of elemental Bi as an impurity in the laboratory experiments carried out at temperatures higher than 180 °C due to the thermal decomposition and/or the reduction of Bi13S17Br3. In fact, it has been reported that Bi3+ can be reduced to Bi metal in the presence of EtOH.28
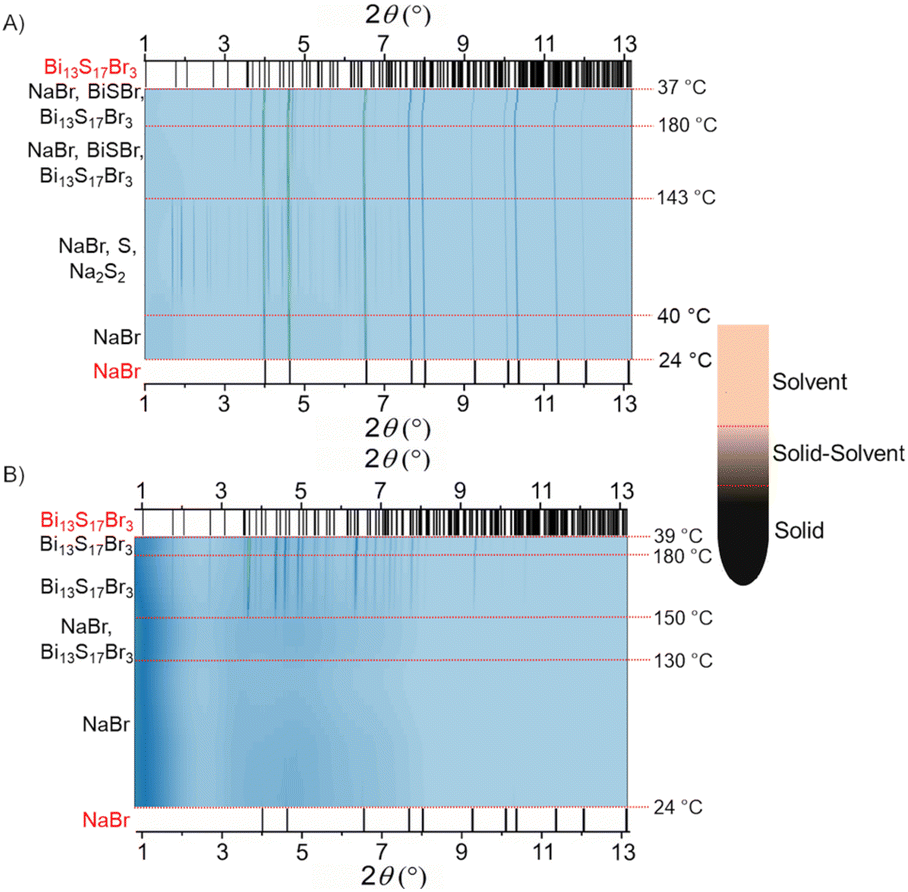 | ||
| Fig. 1 Contour plots of in situ PXRD patterns collected by exposing (A) solid and (B) solid–solvent interface regions of the CH4N2S–BiBr3–NaBr reaction mixture in EtOH to synchrotron X-ray radiation (λ = 0.24075 Å). The black vertical lines on the bottom and top of each figure correspond to the XRD peak positions of NaBr and Bi13S17Br3, respectively (labeled in red). A schematic of the capillary showing the solid, solid–solvent interface, and solvent regions is also provided. | ||
Next, we probed the elemental compositions of pristine Bi13S17Br3 and Bi13S18I2 using EDS (Fig. 2, Fig. S1, and Table S1†). Both the bromide and iodide samples exhibited hexagonal needle-like crystals of different sizes. Assuming the general formula of the two compounds to be Bi13S18X2 (X = Br, I), the theoretical atomic percentages are 39.4%, 54.5%, and 6.1% for Bi, S, and X, respectively. The iodide sample showed the experimental atomic percentages of 39.5(2)%, 53.7(2)%, and 6.8(2)% for Bi, S, and I, respectively, in close agreement with the assumed Bi13S18I2 composition. On the other hand, the experimental atomic percentages of Bi, S, and Br are 39.2(4)%, 52.4(5)%, and 8.4(4)%, respectively, for the bromide. This systematic underestimation of the S content and the overestimation of Br content were consistently observed across multiple crystals in the same sample and across different samples. This observation suggested the deviation from the general formula Bi13S18X2 for the bromide compound. Interestingly, the presence of excess bromine and deficiency in sulfur were also noticed in “Bi19S27Br3” nanowires synthesized using the colloidal method causing a discrepancy between the expected and experimental elemental ratios.21 Therefore, in our study, recrystallization of the bromide compound in EtOH was performed to isolate single crystals suitable for structure redetermination.
 | ||
| Fig. 2 SEM backscattered electron image of Bi13S17Br3 needles. | ||
Crystal structure
The crystal structure of “Bi19S27Br3” was first reported by Krämer in 1973.11 It was reported that Bi19S27Br3 crystallizes in either the P63 or the P63/m space group. A few years later, Mariolacos solved the structure in the P63 space group assigning the same composition of Bi19S27Br3.31 The analogous iodide counterpart Bi19S27I3 was also found to belong to the same space group.12,32 However, recently Groom et al. redetermined the structure of the iodide in the P3 space group proposing the new empirical formula Bi13S18I2.19 They suggested that the bromide could probably crystallize in the same space group with the formula Bi13S18Br2, which was further supported by the investigation of Li and co-workers.33 Our SCXRD investigation, on the other hand, revealed that the crystal grown by the solvothermal method (Fig. 2) belongs to the P63 space group with unit cell parameters of a = 15.473(3) and c = 4.0041(9) Å. Attempts to solve the structure in the P3 or P63/m or P21 space groups resulted in neither the improvement of the R-values nor in reducing or eliminating the observed disorder in both Bi chains and S/Br substitutions. The elimination of Br from either the S2 or S3 sites resulted in negative atomic displacement parameters (ADPs) for the corresponding sulfur site. A refinement with constrained ADPs to be equal for all S sites resulted in negligible changes in S/Br site occupancies. The details of the structure refinement and the extracted structural parameters of Bi13S17Br3 = Bi12.9(1)S17.2(1)Br2.9(1) are provided in Tables 1 and S2–S4.† Due to the presence of the disorder in both the heavy atoms sites (Bi) and the light atom sites (S), all atoms were refined isotropically. The obtained structural model was further verified by synchrotron PXRD and total scattering methods (vide infra).| Chemical formula | Bi12.9(1)S17.2(1)Br2.9(1) |
| Formula weight (g) | 3471.32 |
| Temperature (K) | 100(2) |
| Wavelength (Å) | Mo-Kα, 0.71073 |
| Crystal system | Hexagonal |
| Space group | P63 (no. 173) |
| a (Å) | 15.473(3) |
| c (Å) | 4.0041(9) |
| V (Å3) | 830.2(4) |
| Z | 1 |
| Density (g cm−3) | 6.943 |
| Data/parameters | 962/35 |
| μ (mm−1) | 72.54 |
| R int | 0.291 |
| R 1 (I > 2σ(I)) | 0.031 |
| wR2 (I > 2σ(I)) | 0.047 |
| GOF (S) | 0.971 |
| Largest peak and hole (e Å−3) | 2.09, −2.24 |
The refined chemical formula of Bi12.9(1)S17.2(1)Br2.9(1) shows an excellent agreement with the chemical composition detected from EDS (see Table S1†). The overall motifs in the Bi13S17Br3 crystal structure are similar to those of the iodide analogue, Bi13S18I2. The Bi–S framework is composed of corner- and edge-sharing BiS5 square pyramids and BiS8 distorted square antiprisms (Fig. 3A). Large channels in the framework are of two types. The channels decorated with Bi atoms from BiS5 square pyramids are filled with bromine atoms located inside trigonal prisms of 6 Bi atoms (Br@Bi6) (Fig. 3B). In turn, the hexagonal channels around the origin of the unit cell are filled with disordered Bi sites which are coordinated by 6 S atoms with a possibility of Bi–Bi bonds (Bi@S6) (Fig. 3B and D). Two S sites of Bi–S framework (shown in orange) are partially substituted with bromine atoms (Fig. 3C). Not accounting for this substitution during the initial refinement resulted in significantly higher R-values, negative displacement parameters for those S atoms, and large difference electron density peaks. Since the Bi–Br distance is expected to be longer than the Bi–S one, the S/Br substitution caused the additional splitting of the Bi site inside square antiprisms. The composition of the iodine compound can be written as Bi2+(Bi3+12S2−18)(I1−)2. Analysis of possible Bi–Bi distances shows that the formation of Bi2 dumbbells is possible and such dumbbells may be isolated from each other. In the case of the bromine compound, the composition is altered by S/Br substitution causing the average oxidation state of Bi in the chains to be reduced: Bi1.3+0.9(Bi3+12S2−17.2Br1−0.9)(Br1−)2. This compound was found to be a semiconductor (vide infra). Thus, we can assume that in the structure of iodine compound isolated Bi24+ dumbbells are present while for the bromine analogue, those dumbbells are connected in longer linear Bi fragments like Bi46+; yet, the topologically interesting34 infinite chains of ∞1[Bi+] are not achieved.
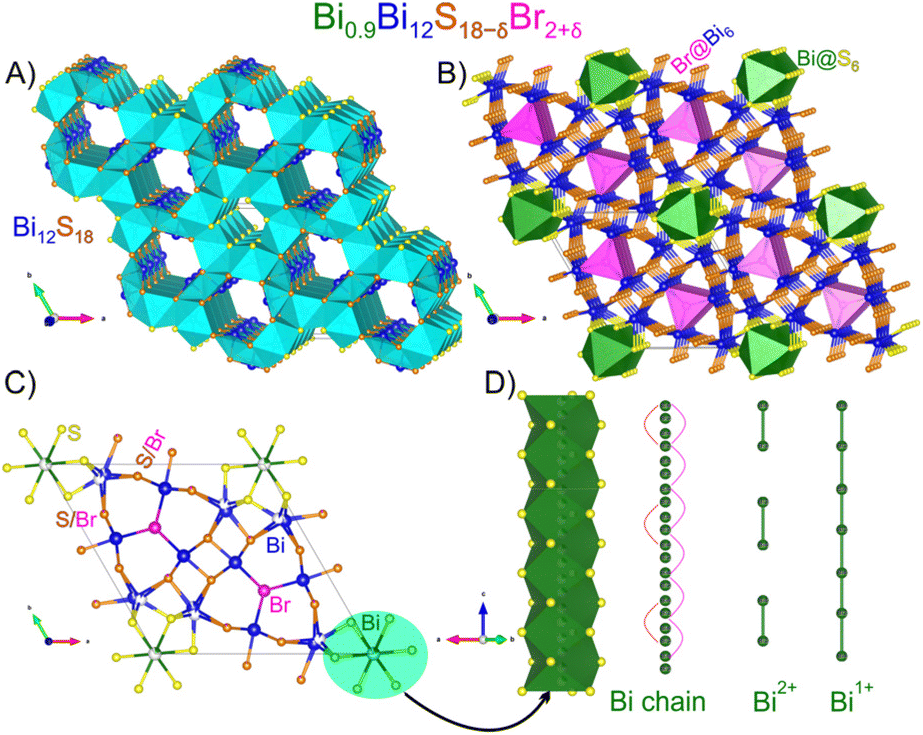 | ||
| Fig. 3 Crystal structure of Bi13S17Br3: (A) an idealized Bi12S18 framework with disorder and atoms in the channels omitted for clarity. (B) Br@Bi6 trigonal prisms (pink) and Bi@S6 octahedra (green) inside the channels are shown; (C) a view of one unit cell along [001] with atoms labeled and mixed sites shown; and (D) Bi chains inside the channel; the red and magenta lines represent the Bi–Bi bonding pairs at a distance of 2.906 Å. A hypothetical ordered version with isolated dumbbells of Bi2+ and chains of Bi+ are also shown. Framework Bi: blue; Bi in channels: green; fully occupied S: yellow; S/Br sites: orange; and fully occupied Br: pink. | ||
Next, we investigated the feasibility of the structural model derived from SCXRD to describe the average and local crystal structure of the Bi13S17Br3 bulk powder. To this end, we utilized Rietveld refinement of the synchrotron powder X-ray diffraction data and PDF analyses of the X-ray total scattering data. The Rietveld refinement was employed to analyze the average structure while the local structure was characterized using PDF. The results from this analysis are summarized in Fig. 4 and Table S5.† The Rietveld fit revealed the absence of any diffraction maxima corresponding to the secondary crystalline phases; thus, the phase purity of the bulk Bi13S17Br3 powder was confirmed (Fig. 4A). The results of Rietveld refinement (the low Rwp value and the reasonable atomic displacement parameters) confirmed that the structural model derived from the SCXRD experiment adequately describes the average crystal structure of Bi13S17Br3. The phase purity of Bi13S18I2 was also confirmed by the Rietveld analysis of the laboratory PXRD data (Fig. S2†). The refined structural model derived from the Rietveld analysis of synchrotron PXRD data of Bi13S17Br3 was utilized as the starting point to carry out a PDF analysis of the X-ray total scattering data. The corresponding structure function is shown in Fig. S3.† An adequate fit to the experimental G(r) is obtained in the 1.6–16 r range using the starting model (Fig. 4B). This demonstrates that the model obtained from SCXRD also provides an adequate picture of the intrinsic disorder observed in the local structure of Bi13S17Br3. Overall, the results of the structural analysis further highlight the validity of the SCXRD model to describe the average and local crystal structure of Bi13S17Br3.
 | ||
| Fig. 4 (A) Rietveld and (B) PDF analyses of the synchrotron X-ray diffraction and the total scattering patterns of Bi13S17Br3, respectively. Black circles, red trace, and blue trace correspond to the experimental data, calculated patterns, and difference curves, respectively. The green vertical bars in the Rietveld plot indicate the calculated positions of the diffraction maxima. Rwp/Rw residuals are included. A broad hump in the diffraction pattern is due to the dilution of the sample with amorphous silica to adjust X-ray absorption by the sample. | ||
Optical properties and thermal stability
Diffuse reflectance measurements were carried out to determine the bandgaps of Bi13S17Br3 and Bi13S18I2 (Fig. 5). The direct bandgap values of 0.92(2) and 0.91(1) eV were observed for Bi13S17Br3 and Bi13S18I2, respectively; these values indicate the semiconducting nature of both compounds. Previous studies on Bi19S27Br3 have reported direct bandgaps ranging from 0.82–1.49 eV.21,23 On the other hand, direct bandgaps in the 0.82–1.08 eV range have been reported for Bi13S18I2 and Bi19S27I3.19,35 | ||
| Fig. 5 Tauc plots for the diffuse reflectance spectra of Bi13S17Br3 (red trace) and Bi13S18I2 (black trace) and the corresponding direct bandgaps. | ||
We also studied the thermal stabilities of Bi13S17Br3 and Bi13S18I2 before conducting transport property measurements. Results from the TGA/DSC analyses of the two compounds are depicted in Fig. S4.† Thermal decomposition of the two compounds started at ∼450 °C. Interestingly, no significant differences in thermal stability were noticed for the two compounds. Based on the TGA data and flow test results, a temperature of 350 °C was chosen for SPS densification of the bromide and iodide pellets.
Transport properties
The low-temperature charge and thermal transport properties of the Bi13S17Br37 and Bi13S18I2 pellets were measured. The temperature dependence of the electrical resistivity (ρ), Seebeck coefficient (S) and thermal conductivity (κ) of the two compounds are depicted in Fig. 6. Electrical resistivities of both compounds decrease with increasing temperature in the 2–300 K range suggesting their semiconducting nature. Recently, high-temperature thermoelectric properties of bulk Bi13S18I2 were reported by Xu et al. in the 313–788 K temperature range.20 Noticeably, the electrical conductivity of Bi13S18I2 at 300 K for Bi13S18I2 in our study (2310 S m−1) is significantly larger than that obtained by Xu et al. (∼300 S m−1) at 313 K. This may be attributed to the differences in the synthetic methods (solvothermal vs. SPS processing) employed in the two studies. The resistivity of Bi13S17Br3 at 300 K (35 mΩ m) is significantly larger than that of Bi13S18I2 (0.436 mΩ m). A clear drop in the resistivity of Bi13S17Br3 is observed at ∼70 K. Below 70 K, the resistivity of Bi13S17Br3 exhibits little temperature dependence. This behavior may originate from the highly disordered nature of the Bi and S/Br sublattices. In contrast, a less-pronounced descent in the resistivity of Bi13S18I2 is noticed at ∼10 K. We employed the plot of ln(1/ρ) vs. (1/T) to determine the exact temperatures of resistivity changes in the two compounds (Fig. S5†). This analysis yielded transition temperatures of 63 and 48 K for Bi13S17Br3 and Bi13S18I2, respectively. We also attempted fitting the resistivity data collected above the transition temperatures to the Arrhenius-type equation ln(1/ρ) = ln(1/ρ0) − Ea/2kBT to extract the activation energies (Ea) of the thermal excitation of the charge carriers of the two compounds, where kB is the Boltzmann constant.36 Activation energies of 0.175 eV (Bi13S17Br3) and 0.020 eV (Bi13S18I2) were obtained, which were significantly smaller than the corresponding optical bandgaps. This indicates a complex mechanism of charge carrier generation via admixture states in the bandgap instead of simple thermal activation of the carriers over the bandgap. | ||
| Fig. 6 Transport properties of Bi13S17Br3 (red symbols) and Bi13S18I2 (black symbols). Temperature dependence of electrical resistivity, Seebeck coefficient, and thermal conductivity are shown in the top, middle, and bottom panels, respectively. | ||
Temperature dependences of the Seebeck coefficient of Bi13S17Br3 and Bi13S18I2 were reliably measured in the 80–300 K and 150–300 K temperature ranges, respectively (Fig. 6). The measurements of Seebeck coefficients with absolute values of only few μV K−1 at temperatures below 80 K (Bi13S17Br3) and 150 K (Bi13S18I2) are not reliable with the PPMS setup used in this study. The measured Seebeck coefficients were negative throughout the temperature ranges of interest for bromide and iodide indicating electrons as their major charge carriers; therefore, both compounds are n-type semiconductors. This corroborates with the n-type semiconducting behavior reported by Xu et al. for Bi13S18I2.20 Moreover, the absolute values of the Seebeck coefficients increase upon increasing the temperature and reach a value of −325 μV K−1 at 300 K for the two compounds. In the case of bromide, the saturation of the Seebeck coefficient seems to start near 300 K before the bipolar effect becomes active. In contrast, no saturation of the Seebeck coefficient of Bi13S18I2 is observed at 300 K. In fact, high-temperature property measurements have demonstrated that the Seebeck coefficient of Bi13S18I2 reaches nearly −520 μV K−1 at 400 K.20 The Goldsmid–Sharp formula (Eg = 2e|S|maxTmax) was also utilized to determine the bandgap of Bi13S17Br3 using the temperature-dependent Seebeck coefficient data.37 A bandgap of ∼0.19 eV was obtained, which is significantly different from the experimental optical bandgap but close to the Ea activation energy obtained from the resistivity data. This again suggests the complex nature of charge carrier generation in this material, where defect chemistry defines the charge carrier behavior.
An increase in the thermal conductivity of Bi13S17Br3 is observed in the 12–100 K temperature range, achieving a value of 0.37 W m−1 K−1 at 100 K (Fig. 6). Afterwards, the thermal conductivity shows almost no change until 300 K. Noticeably, Bi13S17Br3 lacks a maximum of thermal conductivity around 50 K indicating a glass-like heat transport behavior.38–41 This agrees with the high degree of the structural disorder of Bi13S17Br3, including the S/Br framework substitution which is not present in Bi13S18I2. In accordance with the more ordered structure, Bi13S18I2 thermal conductivity shows a sharper increase at low temperatures reaching a maximum value of 0.55 W m−1 K−1 at 75 K. Then, a slight decrease in the thermal conductivity of iodide is observed due to Umklapp phonon–phonon scattering in the 75–300 K temperature range achieving a value of 0.50 W m−1 K−1 at 300 K. This is in good agreement with the thermal conductivity of 0.55 W m−1 K−1 reported for bulk Bi13S18I2 at 363 K.20 As expected, the ultralow thermal conductivity of both the Bi13S17Br3 and Bi13S18I2 phases stems from factors including the presence of heavy atoms (Bi and Br/I), large unit cell, structural complexity, and disorder. In particular, Bi13S17Br3 exhibits a higher level of structural disorder than Bi13S18I2 due to the presence of more Bi vacancies and mixed S/Br sites. Therefore, these factors may be employed to rationalize the lower thermal conductivity of Bi13S17Br3 compared to Bi13S18I2. In addition, the lower density of the Bi13S17Br3 pellet compared to that of Bi13S18I2 may also contribute to the lower thermal conductivity of the former. The thermal conductivity of a solid is provided by the equation κ = κlattice + κelectronic, where κlattice and κelectronic are the lattice and electronic contributions to the thermal conductivity, respectively. κelectronic is generally estimated using the Wiedemann–Franz law, which is described using the equation κelectronic = LT/ρ; the Lorenz number (L) is determined using the Seebeck coefficient data.42 The calculated κelectronic values were negligible for both compounds, at the level of ∼0.005% of the total values due to their high electrical resistivity. Overall, our observation of a high Seebeck coefficient and low thermal conductivity in low-temperature property measurements corroborates well with the reported high thermoelectric figure-of-merit ZT for Bi13S18I2 at high temperatures. On the other hand, regardless of its high Seebeck coefficient and ultralow thermal conductivity, Bi13S17Br3 is more resistive than Bi13S18I2 at low temperatures. Therefore, tuning the carrier concentration via aliovalent doping and controlled substitution of I− for Br− may be promising strategies to enhance the thermoelectric figure-of-merit ZT of Bi13S17Br3 at least at high temperatures.
Conclusions
Solvothermal synthesis targeted at Bi13S18Br2 has yielded a new subvalent bismuth compound with a formula close to Bi13S17Br3. Single-crystal X-ray diffraction and elemental analysis were utilized to confirm the chemical composition of the new phase. In situ X-ray diffraction studies uncovered the mechanism of product formation and the appearance of Bi13S17Br3 as the only phase in the 150–180 °C temperature range, which was in good agreement with the employed synthesis temperature (180 °C). Single-crystal X-ray diffraction showed the presence of S/Br mixing in the framework sites—a unique feature not observed for the iodide analogue, Bi13S18I2. The derived structural model provided an adequate description of the average and local crystal structure of Bi13S17Br3 as ascertained by Rietveld and pair distribution function analyseis. While Bi13S17Br3 and Bi13S18I2 have similar direct bandgaps (∼0.9 eV), the former exhibits significantly higher electrical resistivity presumably due to the S/Br substitutional defects. Electrons were identified as the major charge carriers in both compounds (n-type semiconductors). Bi13S17Br3 and Bi13S18I2 exhibited ultralow thermal conductivities with the major contributions originating from the lattice component. The lower thermal conductivity displayed by the bromide compared to the iodide was rationalized using the highly disordered Bi and S/Br sublattices of the former. Manipulating the carrier concentration of Bi13S17Br3via aliovalent substitution to realize lower electrical resistivity is proposed as a future research direction.Author contributions
The manuscript was written through the contributions of all authors.Conflicts of interest
There are no conflicts to declare.Acknowledgements
This work was supported by the National Science Foundation (grant DMR-2003783). PPMS instrument used for property measurements was supported by Ames National Laboratory, U.S. Department of Energy, which operates under the Contract DE-AC02-07CH11358. The use of the Advanced Photon Source at Argonne National Laboratory was supported by the U. S. Department of Energy, Office of Science, Office of Basic Energy Sciences, under Contract No. DE-AC02-06CH11357. The authors are thankful to Dr W. Xu, Dr A. Yakovenko, Dr S. Lapidus, Dr Leighanne Gallington, and Dr Olaf Borkiewicz (APS ANL) for their help in collecting the in situ and high-resolution synchrotron powder XRD and total scattering data. The authors also thank Dr Brett Boote (ISU Chemical Instrumentation Facility) for training and assistance with the TGA/DSC measurements and Dr Julia Zaikina (ISU Chemistry) for the access to SPS and UV/Vis/NIR spectrophotometer.References
- K. Biswas, L. D. Zhao and M. G. Kanatzidis, Tellurium-Free Thermoelectric: The Anisotropic n-Type Semiconductor Bi2S3, Adv. Energy Mater., 2012, 2, 634–638 CrossRef CAS.
- Y. Min, J. W. Roh, H. Yang, M. Park, S. I. Kim, S. Hwang, S. M. Lee, K. H. Lee and U. Jeong, Surfactant-Free Scalable Synthesis of Bi2Te3 and Bi2Se3 Nanoflakes and Enhanced Thermoelectric Properties of Their Nanocomposites, Adv. Mater., 2013, 25, 1425–1429 CrossRef CAS PubMed.
- I. T. Witting, T. C. Chasapis, F. Ricci, M. Peters, N. A. Heinz, G. Hautier and G. J. Snyder, The Thermoelectric Properties of Bismuth Telluride, Adv. Electron. Mater., 2019, 5, 1800904 CrossRef.
- J. W. G. Bos, H. W. Zandbergen, M. H. Lee, N. P. Ong and R. J. Cava, Structures and Thermoelectric Properties of the Infinitely Adaptive Series (Bi2)m(Bi2Te3)n, Phys. Rev. B: Condens. Matter Mater. Phys., 2007, 75, 195203 CrossRef.
- M. Samanta, K. Pal, P. Pal, U. V. Waghmare and K. Biswas, Localized Vibrations of Bi Bilayer Leading to Ultralow Lattice Thermal Conductivity and High Thermoelectric Performance in Weak Topological Insulator n-Type BiSe, J. Am. Chem. Soc., 2018, 140, 5866–5872 CrossRef CAS PubMed.
- V. A. Kulbachinskii, V. G. Kytin, A. A. Kudryashov, A. N. Kuznetsov and A. V. Shevelkov, On the Electronic Structure and Thermoelectric Properties of BiTeBr and BiTeI Single Crystals and of BiTeI with the Addition of BiI3 and CuI, J. Solid State Chem., 2012, 193, 154–160 CrossRef CAS.
- G. P. Voutsas and P. J. Rentzeperis, The Crystal Structure of the Paraelectric Bismuth Thiochloride, BiSCl, Z. Kristallogr. - Cryst. Mater., 1980, 152, 109–118 CrossRef CAS.
- G. P. Voutsas and P. J. Rentzeperis, The Crystal Structure of Bismuth Sulfide Bromide, BiSBr, Z. Kristallogr. - Cryst. Mater., 1984, 166, 153–158 CrossRef CAS.
- S. Z. M. Murtaza and P. Vaqueiro, Rapid Synthesis of Chalcohalides by Ball Milling: Preparation and Characterisation of BiSI and BiSeI, J. Solid State Chem., 2020, 291, 121625 CrossRef CAS.
- V. Krämer, Synthesis and Crystal Data of the Bismuth Sulphide Chloride Bi19S27Cl3, Z. Naturforsch., 1974, 29b, 688–689 CrossRef.
- V. Krämer, Crystal Data on Bismuth Sulphide Bromide, Bi19S27Br3, J. Appl. Crystallogr., 1973, 6, 499 CrossRef.
- G. Miehe and V. Kupcik, The Crystal Structure of Bi(Bi2S3)9I3, Naturwissenschaften, 1971, 58, 219–220 CrossRef CAS.
- V. Krämer, Structure of the Bismuth Chloride Sulfide Bi4Cl2S5, Acta Crystallogr., Sect. B: Struct. Crystallogr. Cryst. Chem., 1979, 35, 139–140 CrossRef.
- P. F. P. Poudeu and M. Ruck, The Intergrowth Structure of Ag1.2Bi17.6S23Cl8 and its Relation to the Tubular Structure of Bi6+δS6+3δ, O6–3δ and the Pavonite homologue Ag3xBi5–3xS8–6xCl6x–1, J. Solid State Chem., 2006, 179, 3636–3644 CrossRef CAS.
- Y. Wang, X. Dai, C. Dong, W. Guo, Z. Xu, Y. Chen, H. Xiang and R. Zhang, Engineering Electronic Band Structure of Binary Thermoelectric Nanocatalysts for Augmented Pyrocatalytic Tumor Nanotherapy, Adv. Mater., 2022, 34, 2106773 CrossRef CAS PubMed.
- Z. Chen, Z. Wu, Z. Song, X. Zhang, H. Yang, Q. Jiang, T. Zhou, N. Liu and J. Hu, Crucial Effect of Halogen on the Photocatalytic Hydrogen Evolution for Bi19X3S27 (X = Cl, Br) Nanomaterials, Ind. Eng. Chem. Res., 2019, 58, 22958–22966 CrossRef CAS.
- S. Li, L. Xu, X. Kong, T. Kusunose, N. Tsurumachi and Q. Feng, Bismuth Chalcogenide Iodides Bi13S18I2 and BiSI: Solvothermal Synthesis, Photoelectric Behavior, and Photovoltaic Performance, J. Mater. Chem. C, 2020, 8, 3821–3829 RSC.
- J. Xiong, Q. Bian, S. Lei, Y. Deng, K. Zhao, S. Sun, Q. Fu, Y. Xiao and B. Cheng, Bi19S27I3 Nanorods: A New Candidate for Photothermal Therapy in the First and Second Biological Near-Infrared Windows, Nanoscale, 2021, 13, 5369–5382 RSC.
- R. Groom, A. Jacobs, M. Cepeda, R. Drummey and S. E. Latturner, Bi13S18I2: (Re)discovery of a Subvalent Bismuth Compound Featuring [Bi2]4+ Dimers Grown in Sulfur/Iodine Flux Mixtures, Chem. Mater., 2017, 29, 3314–3323 CrossRef CAS.
- B. Xu, T. L. Feng, M. T. Agne, Q. Tan, Z. Li, K. Imasato, L. Zhou, J. H. Bahk, X. L. Ruan, G. J. Snyder and Y. Wu, Manipulating Band Structure through Reconstruction of Binary Metal Sulfide for High-Performance Thermoelectrics in Solution-Synthesized Nanostructured Bi13S18I2, Angew. Chem., Int. Ed., 2018, 57, 2413–2418 CrossRef CAS PubMed.
- Y. Wu, H. Pan, X. Zhou, M. Li, B. Zhou, C. Yang, W.-H. Zhang, J. Jie and C. Li, Shape and Composition Control of Bi19S27(Br3−x,Ix) Alloyed Nanowires: the Role of Metal Ions, Chem. Sci., 2015, 6, 4615–4622 RSC.
- C. Deng, H. Guan and X. Tian, Novel Bi19S27Br3 Superstructures: Facile Microwave–assisted Aqueous Synthesis and Their Visible Light Photocatalytic Performance, Mater. Lett., 2013, 18, 17–20 CrossRef.
- Y. Chen, G. Tian, T. Feng, W. Zhou, Z. Ren, T. Han, Y. Xiao and H. Fu, Single–crystalline Bi19Br3S27 Nanorods with an Efficiently Improved Photocatalytic Activity, CrystEngComm, 2015, 17, 6120–6126 RSC.
- G. M. Sheldrick, Crystal Structure Refinement with SHELXL, Acta Crystallogr., Sect. C: Struct. Chem., 2015, 71, 3–8 CrossRef PubMed.
- B. H. Toby and R. B. Von Dreele, GSAS–II: the Genesis of a Modern Open–Source all Purpose Crystallography Software Package, J. Appl. Crystallogr., 2013, 46, 544–549 CrossRef CAS.
- V. Petkov, RAD, A Program for Analysis of X–ray Diffraction Data from Amorphous Materials for Personal Computers, J. Appl. Crystallogr., 1989, 22, 387–389 CrossRef CAS.
- C. L. Farrow, P. Juhas, J. W. Liu, D. Bryndin, E. S. Bozin, J. Bloch, T. Proffen and S. J. L. Billinge, PDFfit2 and PDFgui: Computer Programs for Studying Nanostructure in Crystals, J. Phys.: Condens. Matter, 2007, 19, 335219 CrossRef CAS PubMed.
- L. Zhu, Y. Xie, X. Zheng, X. Yin and X. Tian, Growth of Compound BiIII-VIA-VIIA Crystals with Special Morphologies under Mild Conditions, Inorg. Chem., 2002, 41, 4560–4566 CrossRef CAS PubMed.
- G. Shen, D. Chen, K. Tang, L. Huang and Y. Qian, Large-scale Synthesis of (Bi(Bi2S3)9I3)0.667 Submicrometer Needle-like Crystals via a Novel Polyol Route, J. Cryst. Growth, 2003, 249, 331–334 CrossRef CAS.
- S. H. Yu, L. Shu, J. Yang, Z. H. Han, Y. T. Qian and Y. H. Zhang, A Solvothermal Decomposition Process for Fabrication and Particle Sizes Control of Bi2S3 Nanowires, J. Mater. Res., 1999, 14, 4157–4162 CrossRef CAS.
- K. Mariolacos, The Crystal Structure of Bi(Bi2S3)9Br3, Acta Crystallogr., Sect. B: Struct. Crystallogr. Cryst. Chem., 1976, 32, 1947–1949 CrossRef.
- H. H. Otto and H. Strunz, The Crystal Chemistry and Synthesis of Lead-Bismuth-Antimony, Neues Jahrb. Mineral., Abh., 1968, 108, 1–19 CAS.
- S. Li, L. Xu, X. Kong, T. Kusunose, N. Tsurumachi and Q. Feng, Bi13S18X2-Based Solar Cells (X = Cl, Br, I): Photoelectric Behavior and Photovoltaic Performance, Phys. Rev. Appl., 2021, 15, 034040 CrossRef CAS.
- J. F. Khoury, B. Han, M. Jovanovic, R. Singha, X. Song, R. Queiroz, N.-P. Ong and L. M. Schoop, A Class of Magnetic Topological Material Candidates with Hypervalent Bi Chains, J. Am. Chem. Soc., 2022, 144, 9785–9796 CrossRef CAS PubMed.
- C. H. Ho, Y. H. Chen, Y. K. Kuo and C. W. Liu, The structure and Opto–Thermo Electronic Properties of a New (Bi(Bi2S3)9I3)2/3 Hexagonal Nano-/Micro-Rod, Chem. Commun., 2017, 53, 3741–3744 RSC.
- B. Owens-Baird, P. Yox, S. Lee, X. B. Carroll, S. G. Wang, Y. S. Chen, O. I. Lebedev and K. Kovnir, Chemically Driven Superstructural Ordering Leading to Giant Unit Cells in Unconventional Clathrates Cs8Zn18Sb28 and Cs8Cd18Sb28, Chem. Sci., 2020, 11, 10255–10264 RSC.
- H. J. Goldsmid and J. W. Sharp, Estimation of the Thermal Band Gap of a Semiconductor from Seebeck Measurements, J. Electron. Mater., 1999, 28, 869–872 CrossRef CAS.
- M. A. Avila, K. Suekuni, K. Umeo, H. Fukuoka, S. Yamanaka and T. Takabatake, Ba8Ga16Sn30 with Type-I Clathrate Structure: Drastic Suppression of Heat Conduction, Appl. Phys. Lett., 2008, 92, 041901 CrossRef.
- D. Huo, T. Sasakawa, Y. Muro and T. Takabatake, Thermoelectric Properties of a Clathrate Compound Ba8Cu16P30, Appl. Phys. Lett., 2003, 82, 2640–2642 CrossRef CAS.
- J. Wang, Y. He, N. E. Mordvinova, O. I. Lebedev and K. Kovnir, The Smaller the Better: Hosting Trivalent Rare-Earth Guests in Cu-P Clathrate Cages, Chem, 2018, 4, 1465–1475 CAS.
- J. Wang, O. I. Lebedev, K. Lee, J. Dolyniuk, P. Klavins, S. Bux and K. Kovnir, A High-Efficiency Thermoelectric Ba8Cu14Ge6P26: Bridging the Gap between Tetrel-Based and Tetrel-Free Clathrates, Chem. Sci., 2017, 8, 8030–8038 RSC.
- H.-S. Kim, Z. M. Gibbs, Y. Tang, H. Wang and G. J. Snyder, Characterization of Lorenz Number with Seebeck Coefficient Measurement, APL Mater., 2015, 3, 041506 CrossRef.
Footnote |
| † Electronic supplementary information (ESI) available: Additional tables and figures related to SEM, EDS, SCXRD, PXRD, PDF, TGA, and resistivity. CCDC 2182340. For ESI and crystallographic data in CIF or other electronic format see DOI: https://doi.org/10.1039/d2dt02295h |
| This journal is © The Royal Society of Chemistry 2022 |