 Open Access Article
Physical properties of {Ti,Zr,Hf}2Ni2Sn compounds†
V. V.
Romaka‡
ab,
G.
Rogl
 a,
V.
Buršíková
c,
J.
Buršík
 d,
H.
Michor
 e,
A.
Grytsiv
 a,
E.
Bauer
 e,
G.
Giester
 f and
P.
Rogl
 *a
*a
aInstitute of Materials Chemistry, Universität Wien, Währingerstr. 42, A-1090 Wien, Austria. E-mail: peter.franz.rogl@univie.ac.at
bLeibniz Institute for Solid State and Materials Research Dresden (IFW Dresden), Helmholtzstr. 20, D-01069 Dresden, Germany
cInstitute of Physical Electronics, Masaryk University, Kotlářská 2, 61137 Brno, Czech Republic
dInstitute of Physics of Materials, Czech Academy of Sciences, Žižkova 22, 61662 Brno, Czech Republic
eInstitute of Solid State Physics, TU Wien, Wiedner Hauptstr. 8-10, A-1040 Wien, Austria
fInstitute of Mineralogy and Crystallography, Universität Wien, Althanstr. 14, A-1090 Wien, Austria
First published on 24th November 2021
Abstract
Physical properties, i.e. electrical resistivity (4.2–800 K), Seebeck coefficient (300–800 K), specific heat (2–110 K), Vickers hardness and elastic moduli (RT), have been defined for single-phase compounds with slightly nonstoichiometric compositions: Ti2.13Ni2Sn0.87, Zr2.025Ni2Sn0.975, and Hf2.055Ni2Sn0.945. From X-ray single crystal and TEM analyses, Ti2+xNi2Sn1−x, x ∼ 0.13(1), is isotypic with the U2Pt2Sn-type (space group P42/mnm, ternary ordered version of the Zr3Al2-type), also adopted by the homologous compounds with Zr and Hf. For all three polycrystalline compounds (relative densities >95%) the electrical resistivity of the samples is metallic-like with dominant scattering from static defects mainly conditioned by off-stoichiometry. Analyses of the specific heat curves Cpvs. T and Cp/T vs. T2 reveal Sommerfeld coefficients of γTi2Ni2Sn = 14.3(3) mJ mol−1 K−2, γZr2Ni2Sn = 10(1) mJ mol−1 K−2, γHf2Ni2Sn = 9.1(5) mJ mol−1 K−2 and low-temperature Debye-temperatures: θLTD = 373(7)K, 357(14)K and 318(10)K. Einstein temperatures were in the range of 130–155 K. Rather low Seebeck coefficients (<15 μV K−1), power factors (pf < 0.07 mW mK−2) and an estimated thermal conductivity of λ < 148 mW cm−1 K−1 yield thermoelectric figures of merit ZT < 0.007 at ∼800 K. Whereas for polycrystalline Zr2Ni2Sn elastic properties were determined by resonant ultrasound spectroscopy (RUS): E = 171 GPa, ν = 0.31, G = 65.5 GPa, and B = 147 GPa, the accelerated mechanical property mapping (XPM) mode was used to map the hardness and elastic moduli of T2Ni2Sn. Above 180 K, Zr2Ni2Sn reveals a quasi-linear expansion with CTE = 15.4 × 10⁻⁶ K−1. The calculated density of states is similar for all three compounds and confirms a metallic type of conductivity. The isosurface of elf shows a spherical shape for Ti/Zr/Hf atoms and indicates their ionic character, while the [Ni2Sn]n− sublattice reflects localizations around the Ni and Sn atoms with a large somewhat diffuse charge density between the closest Ni atoms.
1. Introduction
Since the discovery of a band gap in {Ti,Zr,Hf}NiSn compounds and consequently the high thermoelectric potential of these half-Heusler type alloys, the three ternary systems {Ti,Zr,Hf}–Ni–Sn have moved into the focus of thermoelectric research. For the metallurgical optimization of the thermoelectric figure of merit ZT of the half-Heusler alloys, a thorough investigation of the ternary systems was necessary. Whereas for Ti–Ni–Sn and Zr–Ni–Sn phase relations were derived from 600 °C to the liquidus surface, crystal structures and homogeneity regions of all ternary compounds were assembled and thermodynamic CALPHAD calculations were based on these experimental findings,1,2 the only phase diagram sources available for the Hf–Ni–Sn system are an isothermal section at 600 °C (ref. 3) and a thermodynamic CALPHAD estimation.4 The high significance of the phase diagram studies is documented in the high thermoelectric performance of {Ti,Zr,Hf}NiSn grades exploiting the grain refining effects of spinodal decomposition combined with precipitation mechanisms from a supersaturated temperature dependent solid solution, which altogether led to ZT = 1.5 for {Ti,Zr,Hf}NiSn and ZT = 1.2 for Hf-free grades {Ti,Zr}NiSn.5,6 It is interesting to note that in all three ternary systems {Ti,Zr,Hf}–Ni–Sn, we observe a two-phase equilibrium: {Ti,Zr,Hf}Ni2Sn (Heusler phase) + {Ti,Zr,Hf}2Ni2Sn and for Zr–Ni–Sn also a 3-phase equilibrium: ZrNiSn (half Heusler phase) + ZrNi2Sn (Heusler phase) + Zr2Ni2Sn. Although the latter phase has been characterized with respect to the crystal structure, little is known about the physical properties of this phase. Whilst the crystal structure of Zr2Ni2Sn and Hf2Ni2Sn has been determined from X-ray single crystal studies7,8 to derive as an ordered Zr3Al2-type (space group P42/mnm) from the simpler subcell with the Mo2FeB2-type (space group P4/mbm; ordered U3Si2-type), only X-ray powder data have been available for Ti2Ni2Sn claiming isotypism with the U2Pt2Sn-type (ternary ordered version of the Zr3Al2-type).1,9 R. Pöttgen et al.7 and Zumdick et al.8 furthermore reported on the electrical resistivity and magnetic susceptibility of both Zr2Ni2Sn and Hf2Ni2Sn (4.2 to 300 K), however, without quantification of the measured data. The 119Sn Mössbauer data were interpreted for Zr2Ni2Sn and Hf2Ni2Sn.8 On checking the Internet for elastic properties we came across the data for Hf2Ni2Sn produced using the program ELATE,10 which unfortunately used the outdated crystal data set with the Mo2FeB2-type subcell.The present paper with respect to the absence of reliable X-ray single crystal structure data for Ti2Ni2Sn attempts (a) to provide X-ray single crystal and transmission electron microscopy (TEM) data on the structure of Ti2Ni2Sn and (b) physical property data for the detailed characterization of the three T2Ni2Sn phases (T = Ti, Zr, Hf) and (c) to back the experimentally derived properties by DFT eDOS data and (d) electron density data to shed light on the chemical bonding.
2. Experimental
Pure elements in the form of Van Arkel Ti-ingot (99.99 mass%), Zr-rod (99.8 mass%), Hf-pieces (99.8 mass%), Ni-rod (99.95 mass%), and Sn-shot or bars (99.9 mass%) were used as starting materials to prepare alloys with various compositions close to T2Ni2Sn. Details on sample preparation, ball-milling and hot-pressing conditions are given in ref. 5. Due to the non-congruent melting behavior and the homogeneity region of the T2Ni2Sn phases (extending in the direction of T2+xNi2Sn1−x) a large number of samples (about 10 g) for physical property measurements were prepared from the nominal composition T42Ni40Sn18 by argon arc melting, subsequent ball-milling and densification via hot pressing in graphite dies. For the Ti-samples an additional annealing step was added for 3 days at 1000 °C; the samples were sealed in evacuated quartz vials, which were backfilled to 300 mbar Ar (the samples wrapped in protective Mo-foil). From the cylinders obtained (∅ = 10 mm, h ∼ 8 mm), specimens were cut with a diamond saw to the specification of the corresponding measurement technique.The microstructure and chemical composition of the alloys were analyzed with a SEM (scanning electron microscope: Zeiss Supra 55 VP equipped with an EDX detector operated at 20 kV) on the sample surfaces that were ground on SiC papers and polished with Al2O3 powders (down to 0.3 μm) via standard procedures. Quantitative evaluation of the compositions was performed with the INCA – software.11
X-ray powder diffraction profiles were collected from a HUBER-Guinier image plate with monochromated CuKα1-radiation (λ = 0.154056 nm). For Rietveld refinements the FULLPROF program was applied.12 Precise lattice parameters were calculated by least-squares fits with the program STRUKTUR13 to the indexed θ-values employing 99.9999% Ge as the internal standard (aGe = 0.5657906 nm).
A small and rather spherical specimen (∼35 × 40 × 50 μm3) suitable for the X-ray single crystal structure analysis of Ti2Ni2Sn was isolated by mechanical fragmentation of an arc-melted alloy Ti44Ni40Sn16. After inspection with an AXS D8-GADDS texture goniometer, which assured the high crystal quality, unit cell dimensions and Laue symmetry of the single crystal specimens, X-ray intensity data were collected at room temperature on a four-circle APEX II diffractometer equipped with a CCD area detector and an Incoatec Microfocus Source IμS (30 W, multilayer mirror, Mo-Kα; λ = 0.071069 nm; detector distance of 3 cm; full sphere; 2° < 2θ < 70°). Besides the general treatment of absorption effects using the multi-scan technique (SADABS; redundancy of integrated reflections >9),14 no individual absorption correction was necessary because of the rather regular crystal shape and small dimensions of the investigated specimens. The crystal structure was solved by applying direct methods (program SHELXS-97) and refined against F2 (program SHELXL-97-2) with the program OSCAIL.15 Finally, the crystal structure was standardized with the program STRUCTURE TIDY.16
Thin lamellae (lateral dimensions about 10 × 7 μm2) for the TEM study were prepared from the as cast alloy Ti44Ni40Sn16 using a focused ion beam (FIB) technique with a TESCAN LYRA 3 XMU FEG/SEM×FIB scanning electron microscope. A JEOL JEM-2100F transmission electron microscope (TEM) with FEG operated at 200 kV was employed to get information about the crystal symmetry and lattice parameters of selected phases.
The measured density, dA, was derived from Archimedes’ principle on the hot-pressed cylinders in distilled water. X-ray-density dX = MZ/VL was calculated from Z as the number of formula units within the unit cell, M as the molar mass in [g mol−1], V as the volume and L as Loschmidt's number. The relative density, drel = (dA/dX) × 100.
The electrical resistivity in the range from 4.2 to 300 K was measured on cuboids (8 × 2 × 2 mm3) using a conventional 4He cryostat via an a.c. four-point technique employing a Lake Shore Resistance Bridge 370 AC. The temperature of the sample was determined by using Ge and Pt100 resistive sensors in the temperature ranges T < 35 K and T > 35 K, respectively. Above room temperature the electrical resistivity, ρ, and the Seebeck coefficient, S, were measured simultaneously with a ZEM-3 equipment (ULVAC-Riko, Japan). The error for both resistivity measurements and the Seebeck coefficient is 3%. The specific heat of the samples with masses of 2.3 to 3.7 g was measured with a homemade calorimeter employing an adiabatic step heating method at temperatures from 2 to 110 K.
The mechanical properties of the T2Ni2Sn compounds were measured by means of a Hysitron TI950 triboindenter with a maximum indentation load of 10 mN. Instead of standard quasistatic nanoindentation the accelerated mechanical property mapping mode (XPM) uses a large number (up to 20 × 20) of indents on a surface area of 60 × 60 μm2 to map the local indentation response of the tested materials. The XPM mode allows one to obtain hardness and elastic modulus maps with high spatial resolution and low acquisition times. Compared to the most often used quasistatic indentation the XPM measuring method is substantially faster: the time necessary to perform one indent is more than one order of magnitude shorter. Faster measurements reduce the possible effects of thermal drift. Several maps were established using a Berkovich-type diamond indenter with a tip diameter of ∼50 nm. Indenter tip calibration was performed on a certified fused silica sample (Bruker) exhibiting reduced modulus Er = (69.7 ± 0.9) GPa, Poisson ratio ν = 0.16, and indentation hardness HIT = (9.2 ± 0.7) GPa. At least 100 indentation tests were carried out on the standard at different indentation depths in the load range from 100 μN to 10 mN.
For Zr2Ni2Sn resonant ultrasound spectroscopy (RUS),17 was employed to derive elastic properties, Young's modulus, E, and Poisson ratio, ν, via the eigenfrequencies of the sample (cube of 2 × 2 × 2 mm3) and the knowledge of the sample mass and dimensions (for details see ref. 18–20). For a fine-grained polycrystalline matrix, the bulk modulus B, the shear modulus G and the elastic constant C11 are obtained from relation (1).
 | (1) |
The accuracy of the measurement technique depends on the quality (density, perfect shape) of the samples. C12, the modulus for dilation on compression, can be calculated from eqn (2)
| G = (C11 − C12)/2. | (2) |
Isotropic compounds are suitable for determining θD from the sound velocity, using Anderson's eqn (3):21
 | (3) |
 | (4) |
The thermal expansion from 4.2 to 300 K was measured with a miniature capacitance dilatometer using the tilted plate principle on the cubes used for RUS (for details see ref. 23–25).
DFT calculations were carried out using the Elk v4.3.06 package26 – an all-electron full-potential linearized augmented-plane wave (FP-LAPW) code with the Perdew–Burke–Enzerhoff exchange–correlation functional in generalized gradient approximation (GGA).27 The k-point mesh was determined automatically based on a sphere with a given radius and resulted in a total of 196 k-points. The appropriate values of the muffin-tin radii were selected automatically at the initial stage of the calculations. The Rmin(MT) × {|G + k|} value was set to 8, where Rmin(MT) is the minimum muffin-tin radius used in the system to keep a reasonable balance between the accuracy and required time of calculations. The manual optimization of the lattice parameters was performed by fitting the universal equation of state.28 The enthalpy of formation (ΔHf) at T = 0 K was calculated using the total energies at the ground state of the corresponding constituents and compounds studied. The distribution of the total and partial densities of states (DOS) was calculated by a tri-linear method using a 2000 k-point grid for integrating functions in the Brillouin zone and 1000 energy points in the DOS plot. The interstitial DOS is included in the total DOS distribution, while the partial DOS for each atom type was obtained only within the volume of the appropriate muffin-tin sphere. The distribution of the charge density (ρ) was calculated by using an 80 × 80 × 80 point grid and plotted by the VESTA software package.29
3. Results and discussion
3.1. Crystal structures of the {Ti,Zr,Hf}2Ni2Sn compounds
Whereas the crystal structures of Zr2Ni2Sn and Hf2Ni2Sn have been elucidated from detailed single crystal X-ray data7,8 to be isotypic with the ordered Zr3Al2-type (space group P42/mnm; structures listed as the U2Pt2Sn-type in Pearson's Crystal Data Base30), the corresponding crystal structure data for Ti2Ni2Sn are hitherto only available from X-ray powder data. For Zr2Ni2Sn and Hf2Ni2Sn the ordered Zr3Al2-type (U2Pt2Sn-type) suffices to describe weak but well visible superstructure reflections,7,8 rendering older descriptions of the structure of Zr2Ni2Sn obsolete, which inferred the smaller Mo2FeB2-type (ordered U3Si2-type, intergrowth of CsCl-type and AlB2-type structural units31). From these analyses7,8 it is obvious that the ordered Zr3Al2-type is an (a = b, 2c) superstructure of the ordered U3Si2-type (space group P4/mbm) in a group–subgroup relation relaxing the z-parameters of the Ni-atoms. Our recent phase diagram analysis of the system Zr–Ni–Sn![[thin space (1/6-em)]](https://www.rsc.org/images/entities/char_2009.gif) 2 revealed an incongruent formation of Zr2+xNi2Sn1−x from a pseudo-binary peritectic reaction: L + Zr5NiSn3 ↔ Zr2Ni2Sn at 1406 °C. At an almost constant Ni-content (∼40 at%) a small homogeneity region extends towards lower Sn-contents: Zr2+xNi2Sn1−x. Therefore the nominal composition for the single phase material was placed at a slightly non-stoichiometric composition Zr42Ni40Sn18 (in at%). After hot-pressing the crushed arc melted buttons, metallographic (SEM) inspection arrived at a practically homogeneous material for which a Rietveld refinement confirmed the structure type of U2Pt2Sn (RF = 0.034) with only a minute amount of 1 vol% of ZrNi2Sn (Heusler type). For details of the Rietveld refinement of Zr2+xNi2Sn1−x (x = 0.025, derived from SEM-EDX) see Fig. S1 in the ESI.† The situation is quite similar for isotypic Hf2+xNi2Sn1−x: Rietveld refinement results for a practically single-phase sample at x = 0.055 (derived from SEM-EDX) are summarized in Fig. S2 in the ESI.† For the Hf–Ni–Sn system neither a reliable liquidus–solidus surface nor a SEM-EDX defined isothermal section is reported yet.
2 revealed an incongruent formation of Zr2+xNi2Sn1−x from a pseudo-binary peritectic reaction: L + Zr5NiSn3 ↔ Zr2Ni2Sn at 1406 °C. At an almost constant Ni-content (∼40 at%) a small homogeneity region extends towards lower Sn-contents: Zr2+xNi2Sn1−x. Therefore the nominal composition for the single phase material was placed at a slightly non-stoichiometric composition Zr42Ni40Sn18 (in at%). After hot-pressing the crushed arc melted buttons, metallographic (SEM) inspection arrived at a practically homogeneous material for which a Rietveld refinement confirmed the structure type of U2Pt2Sn (RF = 0.034) with only a minute amount of 1 vol% of ZrNi2Sn (Heusler type). For details of the Rietveld refinement of Zr2+xNi2Sn1−x (x = 0.025, derived from SEM-EDX) see Fig. S1 in the ESI.† The situation is quite similar for isotypic Hf2+xNi2Sn1−x: Rietveld refinement results for a practically single-phase sample at x = 0.055 (derived from SEM-EDX) are summarized in Fig. S2 in the ESI.† For the Hf–Ni–Sn system neither a reliable liquidus–solidus surface nor a SEM-EDX defined isothermal section is reported yet.
The light homologue Ti2+xNi2Sn1−x was found to form in a ternary peritectic reaction, L + Ti5NiSn3 + TiNi2Sn ↔ Ti2Ni2Sn at 1151 °C,1 with a rather small field of primary crystallization; these two facts may explain why so far no single crystal was obtained in crystal structure analysis. X-ray powder diffraction data, however, have claimed isotypism with the U2Pt2Sn-type.1,9
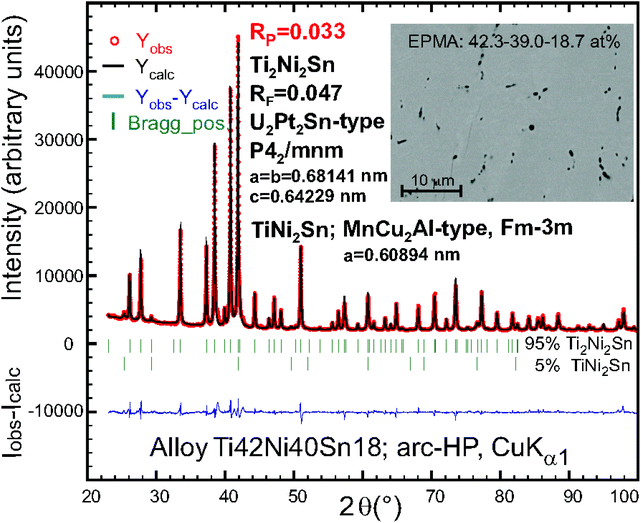
The Rietveld refinement for Ti42Ni40Sn18 (nominal composition in at% of an arc melted, ball-milled and hot-pressed sample; see Fig. 1) indicated the U2Pt2Sn-type structure besides a small amount of the TiNi2Sn-Heusler phase. It should be mentioned that a test with the Mo2FeB2-type could not satisfactorily describe the X-ray powder intensities. A small single crystal suitable for X-ray structural analysis was isolated by the mechanical fragmentation of an arc-melted alloy Ti44Ni40Sn16. A full structural analysis in the space group P42/mnm of the highest symmetry arrived at RF2 = 0.0082 with a residual electron density as low as 0.40 e− Å−3 confirming the ordered Zr3Al2-type (U2Pt2Sn-type) and isotypism with Zr and Hf homologues (crystallographic details are summarized in Table 1).
| Parameter/compound | Ti2+xNi2Sn1−x, x ∼ 0.13(1) |
| Composition from EDX in at% (±0.8 at%) | Ti41.6Ni40.0Sn18.4 |
| Compos. from refinement in at% | Ti42.6Ni40Sn17.4 |
| Formula from refinement | Ti2.13NiSn0.87 |
| Linear absorption coeff. in mm−1 | 25.55 |
| Density in Mg m−3 | 7.42 |
| a [nm]; c [nm] | 0.68114(2); 0.64017(2) |
| Reflections in refinement | 411 ≥ 4σ(Fo) of 417 |
| Number of variables | 20 |
| R F 2 = ∑|Fo2 − Fc2|/∑Fo2 | 0.0082 |
| R Int | 0.064 |
| wR2 | 0.0172 |
| GOF | 1.318 |
| Mosaicity | 0.49 |
| Extinction (Zachariasen) | 0.0116(3) |
| Residual density e− per nm3 × 103; max; min | 0.40 (0.096 nm from Ni1); −0.39 |
| Atom parameters | |
| Ti1: 4g(x, −x, 0); x; occ. | x = 0.31466(4); 1.00 Ti1 |
| U 11 = U22; U33 | 0.0064(1); 0.0059(1) |
| U 23 = U13 = 0; U12 | −0.0001(1) |
| Ti2: 4f (x, x, 0); x; occ. | x = 0.14755(4); 1.00 Ti2 |
| U 11 = U22; U33 | 0.0069(1); 0.0064(1) |
| U 23 = U13 = 0; U12 | −0.0011(1) |
| Ni1: 8j (x, x, z); x; z; occ. | x = 0.37209(2); z = 0.20838(3); 1.00 Ni1 |
| U 11 = U22; U33 | 0.0059(1); 0.0069(1) |
| U 23 = U13 = 0; U12 | −0.0009(1) |
| Sn1/Ti3: 4d (0, ½, ¼); occ. | 0.87(1) Sn1 + 0.13 Ti3 |
| U 11 = U22; U33; U23 = U13 = U12 = 0 | 0.0053(1); 0.0117(1) |
| Principal mean square atomic displacements | Ti1: 0.0065; 0.0063; 0.0059 |
| Ti2: 0.0080; 0.0064; 0.0058 | |
| Ni1: 0.0069; 0.0068; 0.0050 | |
| Sn1: 0.0117; 0.0053; 0.0053 | |
It should be noted that the composition of the single crystal from refinement Ti2.13Ni2Sn0.87 (![[triple bond, length as m-dash]](https://www.rsc.org/images/entities/char_e002.gif) Ti42.6Ni40Sn17.4 in at%) agrees reasonably well with the EDX data of Ti41.6Ni40Sn18.4. The interatomic distances are listed in Table S1 (in the ESI†) and essentially comply with the sum of the metal radii32 (RTi = 0.1462 nm, RNi = 0.1246 nm, RSn = 0.1545 nm). As a general result of our specimens, Rietveld refinements and SEM data in all cases are consistent with a small amount of the 4th group element T in the Sn-site (Wyckoff site 4d (0, ½, ¼)) in a random distribution Sn/T yielding slightly non-stoichiometric formulae {Ti,Zr,Hf}2+xNi2Sn1−x. The implication of this non-stoichiometry is a minor T for Sn substitution in the distorted CsCl-slabs TSn, which together with distorted AlB2-type slabs TNi2 form the U2Pt2Sn-type structure.
Ti42.6Ni40Sn17.4 in at%) agrees reasonably well with the EDX data of Ti41.6Ni40Sn18.4. The interatomic distances are listed in Table S1 (in the ESI†) and essentially comply with the sum of the metal radii32 (RTi = 0.1462 nm, RNi = 0.1246 nm, RSn = 0.1545 nm). As a general result of our specimens, Rietveld refinements and SEM data in all cases are consistent with a small amount of the 4th group element T in the Sn-site (Wyckoff site 4d (0, ½, ¼)) in a random distribution Sn/T yielding slightly non-stoichiometric formulae {Ti,Zr,Hf}2+xNi2Sn1−x. The implication of this non-stoichiometry is a minor T for Sn substitution in the distorted CsCl-slabs TSn, which together with distorted AlB2-type slabs TNi2 form the U2Pt2Sn-type structure.
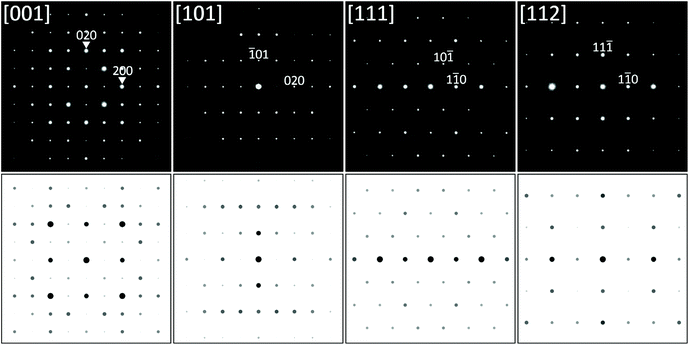
Selected area electron diffraction (SAED) patterns were collected by TEM from thin lamellae of the Ti2+xNiSn1−x phase (using the arc-melted alloy Ti44Ni40Sn16). With full confirmation of the U2Pt2Sn-type tetragonal lattice all diffraction patterns were fully indexed using the parameters listed in Table 1. No further superstructure spots were detected. Fig. 2 shows several examples of low index zone axis diffraction patterns recorded at various sample tilts together with simulated SAED patterns using software JEMS.33,34
Although Wang et al.35 confirmed the existence of Ti2Ni2Sn at T ≥ 600 °C, they claimed instability below 235 °C. This statement is similar to an earlier report36 on instability below 500° C, which has been revised later9 and was convincingly explained by retarded reaction/diffusion kinetics at low temperatures. A long term experiment with slow cooling the Ti42Ni40Sn18 alloy (5 K h−1) from 1000 °C to 200 °C and additional annealing for 1 month at 200 °C revealed changes neither in XPD intensities nor in the EDX microstructure. The Ti2+xNiSn1−x phase can thus safely be considered to be stable also at low temperatures.
3.2. Physical properties
According to the characterization by XPD and EDX, as shown in Fig. 1, S1, S2† and Table 2, the large samples T2+xNi2Sn1−x used for physical property measurements are close to single phase conditions with only minor amounts of secondary phases (see micrographs in Fig. 1, S1 and S2†). The three samples, Ti2.13Ni2Sn0.87, Zr2.025Ni2Sn0.975 and Hf2.055Ni2Sn0.945, revealed relative densities of 97.7%, 99.1% and 94.4% (Table 2), respectively. These data are important because physical and even more so mechanical properties strongly depend on the sample's density. For simplicity we will use the formula T2Ni2Sn throughout the following chapters.| Parameter/compound | Ti2+xNi2Sn1−x | Zr2+xNi2Sn1−x | Hf2+xNi2Sn1−x | Ref. |
|---|---|---|---|---|
| a Calculated from nano-indentation data with νRUS of Zr2Ni2Sn. b Elastic properties analysed with the program ELATE10 using the Mo2FeB2-type subcell only. | ||||
| Formula from EDX (±0.8 at%) | Ti42.3Ni39.0Sn18.7, x = 0.115 | Zr40.5Ni39.9Sn19.6, x = 0.025 | Hf41.1Ni40.4Sn18.5, x = 0.055 | This work |
| Lattice param. [nm] | a = b = 0.68142(1), c = 0.64229(1) | a = b = 0.70663(1), c = 0.68233(1) | a = b = 0.70597(1), c = 0.67545(1) | This work |
| Density | ||||
| X-ray density dX [Mg m−3] | 7.27 | 8.17 | 11.84 | This work |
| meas. density dA [Mg m−3] | 7.10 | 8.09 | 11.18 | This work |
| rel. density dr in % | 97.7 | 99.1 | 94.4 | This work |
| Elastic moduli | ||||
| E eff (nanoindentation) [GPa] | 230 | 205 | 215 | This work |
| E(RUS)/E(nanoindent.)[GPa] | —/209a | 171/186a | —/195a | This work |
| Poisson number ν (RUS) | 0.31a | 0.31 | 0.31a | This work |
| Bulk mod. B [GPa] | —/180a | 147/160a | —/168a | This work |
| Shear mod. G [GPa] | —/80a | 66/71a | —/75a | This work |
| C 11 [GPa] | —/287a | 234/255a | —/268a | This work |
| E (Voigt–Reuss–Hill) [GPa] | — | — | 175.3–169.4–172.4 |
10![[thin space (1/6-em)]](https://www.rsc.org/images/entities/char_2009.gif) b b |
| ν (Voigt–Reuss–Hill) [GPa] | — | — | 0.294–0.301–0.297 |
10![[thin space (1/6-em)]](https://www.rsc.org/images/entities/char_2009.gif) b b |
| B (Voigt–Reuss–Hill) [GPa] | — | — | 141.9–141.7–141.8 |
10![[thin space (1/6-em)]](https://www.rsc.org/images/entities/char_2009.gif) b b |
| G (Voigt–Reuss–Hill) [GPa] | — | — | 67.7–65.12–66.42 |
10![[thin space (1/6-em)]](https://www.rsc.org/images/entities/char_2009.gif) b b |
| Hardness | ||||
| H IT [GPa] | 11 | 10 | 11 | This work |
| Debye and Einstein temp. | ||||
| θ D (Anderson) [K] | — | 309 | — | This work |
| θ D (Bl.G-resistivityfit) [K] | 318 | 298 | 273 | This work |
| θ D (Bl.G-resistivityfit) [K] | — | 223 | — | 7 |
| θ D/θE (Debye/Einst-Cp) [K] | 370/154 | 354/147 | 319/129 | This work |
| θ LTD | 373 | 357 | 318 | This work |
| θ D/θE (thermal exp.) [K] | — | 331/128 | — | This work |
| Magnetic properties | ||||
| Susceptibility at RT [emu mol−1] | — | — | 3.18 × 10⁻⁴ | 8 |
| [emu mol−1] | — | 2.3(1) × 10−4 | — | 7 |
![[thin space (1/6-em)]](https://www.rsc.org/images/entities/char_2009.gif) :
:![[thin space (1/6-em)]](https://www.rsc.org/images/entities/char_2009.gif) 2
2![[thin space (1/6-em)]](https://www.rsc.org/images/entities/char_2009.gif) :
:![[thin space (1/6-em)]](https://www.rsc.org/images/entities/char_2009.gif) 1 stoichiometry within the samples of the present investigation. Zr2Ni2Sn resistivity data reported earlier,7 shown as an inset in Fig. 3, appear closer to current Ti2Ni2Sn and Hf2Ni2Sn data and thus indicate some variabilities of the absolute electrical resistivity most likely depending on stoichiometry, sample density and possibly also on thermal history (annealing).
1 stoichiometry within the samples of the present investigation. Zr2Ni2Sn resistivity data reported earlier,7 shown as an inset in Fig. 3, appear closer to current Ti2Ni2Sn and Hf2Ni2Sn data and thus indicate some variabilities of the absolute electrical resistivity most likely depending on stoichiometry, sample density and possibly also on thermal history (annealing).
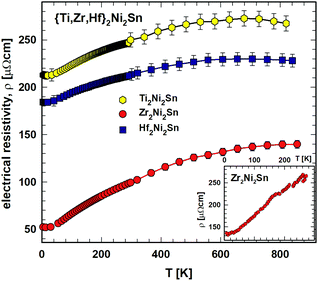 | ||
| Fig. 3 {Ti,Zr,Hf}2Ni2Sn: electrical resistivity, ρ, vs. temperature, T, with the respective fit (see text). Inset: electrical resistivity, ρ(T), for Zr2Ni2Sn from ref. 7. | ||
For the practical use of these compounds as thermoelectric materials the quality measure is the figure of merit ZT = S2T/ρλ, where S is the Seebeck coefficient, ρ is the electrical resistivity and λ is the thermal conductivity. Fig. 4 depicts the temperature (300 K–800 K) dependent Seebeck coefficient, S(T). For all three compounds the Seebeck coefficient is rather low. Whereas for Ti2Ni2Sn and Hf2Ni2Sn S(T) is increasing with increasing temperature, Zr2Ni2Sn exhibits a flat maximum at around 800 K. The power factor, calculated as pf = S2/ρ, is influenced mainly by the Seebeck coefficient and is therefore also increasing with increasing temperature (see Fig. 4). It reaches pf = 0.075 mW m−1K−2 for Ti2Ni2Sn at 840 K, pf = 0.06 mW m−1K−2 at 840 K for Hf2Ni2Sn and pf = 0.04 at 807 K for Zr2Ni2Sn.
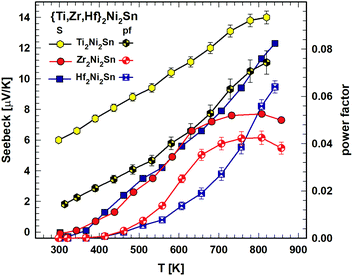 | ||
| Fig. 4 {Ti,Zr,Hf}2Ni2Sn: Seebeck coefficient, S, vs. temperature, T (left scale) and power factor, pf, vs. temperature, T (right scale). | ||
To estimate the thermal conductivity we took for λmin a theoretical value (2.32 mW cm−1 K−1) of a glass that was derived from formula (5):37
 | (5) |
| Cp = Cel + Cph ∼ γT + βT3 with β = 12Rπ4n/5θD3 | (6) |
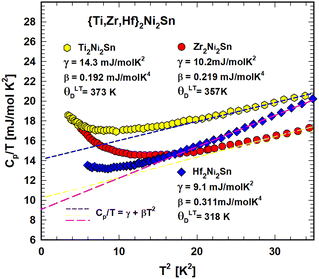
Fig. 5 depicts the temperature dependent heat capacity (2 < T < 140 K) as Cp(T) of Ti2Ni2Sn, Zr2Ni2Sn and Hf2Ni2Sn. The Cp(T) dependence is smooth without any significant feature of a phase transition in the measured temperature range, but the Cp/T vs. T2 curve (Fig. 6) shows a slight upturn below ∼12 K indicating a contribution from a very small amount of magnetic impurities. By excluding this upturn and applying eqn (6), the heat capacity of Ti2Ni2Sn, Zr2Ni2Sn and Hf2Ni2Sn could be fitted (dashed lines) at temperatures from 16 K2 to 60 K2. This analysis yields Sommerfeld coefficients of γ = 14.3(3) mJ mol−1 K−2, γ = 10(1) mJ mol−1 K−2 and γ = 9.1(5) mJ mol−1 K−2, respectively. The values obtained are comparable with those calculated from the reported magnetic susceptibility data of Zr2Ni2Sn![[thin space (1/6-em)]](https://www.rsc.org/images/entities/char_2009.gif) 7 and Hf2Ni2Sn.8 From the Sommerfeld constant γ = π2NAkB2DOS(EF)/3 and measured Pauli magnetic susceptibility χP = μB2NADOS(EF), we may use the relation between χP (emu mol−1) and γ (mJ mol−1 K−2): χP = 1.37148 × 10⁻⁵γ. Taking into account the Landau diamagnetic susceptibility (χL), the measured susceptibility is χ = SχP + χL = SχP − χP/3, and a realistic Stoner enhancement factor S ∼ 2 yields the Sommerfeld constants of the order of 10 mJ mol−1 K−2 for these compounds, which compares reasonably well with the present experimental values. With β = 0.192 mJ mol−1 K−4 for Ti2Ni2Sn, β = 0.219 mJ mol−1 K−4 for Zr2Ni2Sn and β = 0.311 mJ mol−1 K−4 for Hf2Ni2Sn the corresponding Debye temperatures could be extracted viaeqn (6) in the low temperature (LT) range: θLTD = 373(7) K, 357(14) K and 318(10) K.
7 and Hf2Ni2Sn.8 From the Sommerfeld constant γ = π2NAkB2DOS(EF)/3 and measured Pauli magnetic susceptibility χP = μB2NADOS(EF), we may use the relation between χP (emu mol−1) and γ (mJ mol−1 K−2): χP = 1.37148 × 10⁻⁵γ. Taking into account the Landau diamagnetic susceptibility (χL), the measured susceptibility is χ = SχP + χL = SχP − χP/3, and a realistic Stoner enhancement factor S ∼ 2 yields the Sommerfeld constants of the order of 10 mJ mol−1 K−2 for these compounds, which compares reasonably well with the present experimental values. With β = 0.192 mJ mol−1 K−4 for Ti2Ni2Sn, β = 0.219 mJ mol−1 K−4 for Zr2Ni2Sn and β = 0.311 mJ mol−1 K−4 for Hf2Ni2Sn the corresponding Debye temperatures could be extracted viaeqn (6) in the low temperature (LT) range: θLTD = 373(7) K, 357(14) K and 318(10) K.
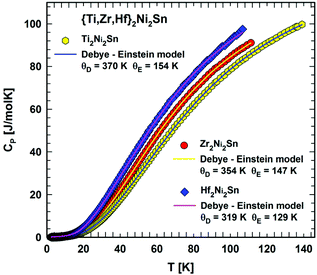 | ||
| Fig. 5 Temperature dependent heat capacity, Cp, for {Ti,Zr,Hf}2Ni2Sn. The respective line shows a fit according to eqn. (7). | ||
To explore the phonon spectrum a more detailed description is necessary: CP = Cel + Cph
 | (7) |
3.3. Mechanical properties
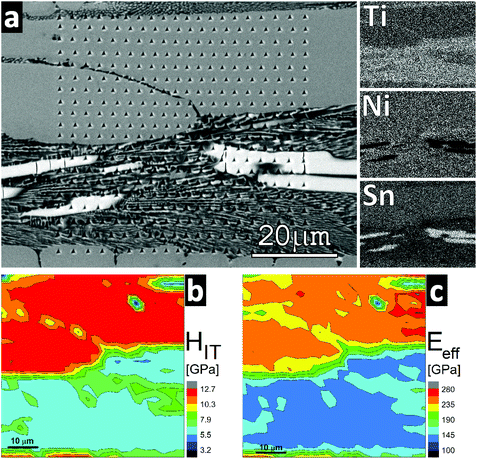
Not only the thermoelectric materials’ mechanical properties (hardness, elastic moduli and thermal expansion) are of importance, but also they govern any technical use per se or in composites etc. Therefore several high resolution maps of mechanical properties were established from various parts of the sample surfaces of T2+xNi2Sn1−x (T = Ti, Zr, Hf) using the XPM nanoindentation mode. The maps consisted of data obtained from the analysis of 225 to 400 loading/unloading curves. The hardness (HIT) and reduced elastic modulus (Er) were calculated from the curves using the standard evaluation procedure according to Oliver and Pharr.38 From measured Er the so-called effective indentation modulus Eeff was calculated by introducing the material parameters of the diamond indenter. With the knowledge of the Poisson ratio ν also the Young's modulus (E) of the sample can be determined from nanoindentation. The relationship between Er, Eeff and E may be expressed using the following formula: | (8) |
Fig. 7 displays the maps of hardness (HIT) and effective elastic modulus (Eeff) obtained on the Ti2+xNi2Sn1−x sample under as cast conditions revealing several phases on the mechanical property maps. According to the analytical electron microscopy results the majority phase Ti2+xNi2Sn1−x was the hardest phase (HIT = 11 ± 1 GPa; Eeff = 230 ± 20 GPa). The Sn-rich phase (the brightest phase in Fig. 7(a); i.e. Ti5NiSn3) exhibited a hardness around 7 ± 1 GPa and an effective elastic modulus around 150 ± 12 GPa. The fine mixture of the Sn-rich phase including a phase close to TiNi (in bottom half of the maps) exhibited HIT = 5 ± 1 GPa and Eeff = 120 ± 10 GPa.
In contrast to the case of Ti2+xNi2Sn1−x, the mechanical property maps obtained from the hot-pressed alloys T2+xNi2Sn1−x (T = Zr and Hf) yielded rather uniform values reflecting the experimental error caused mainly by the surface roughness of the samples (which is a significant source of error in the case of nanoindentation). The hardness obtained for both Zr and Hf – containing samples was similar: in the range from 10 to 11 GPa. The effective elastic modulus was slightly higher in the case of Hf2+xNi2Sn1−x (Eeff = 215 ± 15 GPa), whereas in the case of Zr2+xNi2Sn1−x the average value was 205 ± 10 GPa.
For Zr2Ni2Sn the result of resonant ultrasound spectroscopy, RUS, yielded a Young's modulus E = 171 ± 0.7 GPa and a Poisson ratio of ν = 0.31 ± 0.04. All other elastic moduli were calculated according to eqn (1) and (2), providing a shear modulus G = 65.5 GPa, a bulk modulus B = 147 GPa and modulus for dilation on compression C12 = 103 GPa. These values are in the same range as those calculated via the program ELATE10 for Hf2Ni2Sn with E = 175.3 GPa, 169.4 GPa and 172.4 GPa and ν = 0.294, 0.301 and 0.297, respectively for values according to Voigt, Reuss and Hill. Unfortunately, these data were all calculated for the Mo2FeB2-type and not for the appropriate structural data with the U2Pt2Sn-type.8 Using the Poisson ratio value of νRUS = 0.31 obtained for Zr2Ni2Sn, it was possible to derive the elastic moduli of {Zr,Hf}2Ni2Sn from Eeff according to eqn (1) and (8). The value of 186 ± 9 GPa (Zr2Ni2Sn) is slightly higher than the value obtained by means of RUS. The possible reason for this difference is that the nanoindentation results are measured in shallow depths (i.e. the indentation response is obtained from small volumes of the sample, where the probability of defect occurrence is low) compared to the RUS measurements, which is a bulk test. A summary of all elastic moduli from RUS and nanoindentation, as derived for the three compounds T2+xNi2Sn1−x, is presented in Table 2.
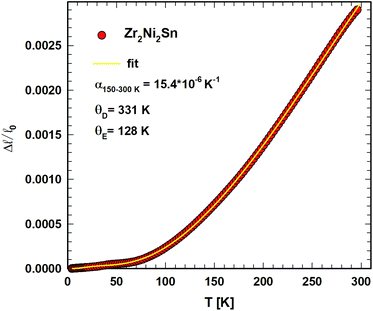
The temperature dependent length change Δ![[small script l]](https://www.rsc.org/images/entities/i_char_e146.gif) /
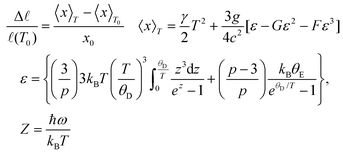
/![[small script l]](https://www.rsc.org/images/entities/i_char_e146.gif) 0 of Zr2Ni2Sn shows a slight anomaly in the range of 45 K, presumably referring to small magnetic contributions. To analyze the thermal expansion as a function of temperature, the semiclassical model of Mukherjee et al.39 was applied. This treatment takes into account three- and four-phonon interactions, considering the Debye model for acoustic phonons and the Einstein approximation for optical modes. The length change Δ
0 of Zr2Ni2Sn shows a slight anomaly in the range of 45 K, presumably referring to small magnetic contributions. To analyze the thermal expansion as a function of temperature, the semiclassical model of Mukherjee et al.39 was applied. This treatment takes into account three- and four-phonon interactions, considering the Debye model for acoustic phonons and the Einstein approximation for optical modes. The length change Δ![[small script l]](https://www.rsc.org/images/entities/i_char_e146.gif) /
/![[small script l]](https://www.rsc.org/images/entities/i_char_e146.gif) (T0) is given by eqn (9)
(T0) is given by eqn (9)
 | (9) |
3.4. DFT modelling
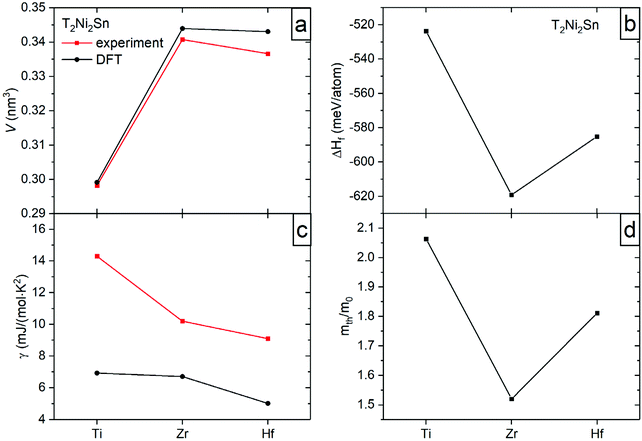
For DFT modelling, the fully ordered structures of the Ti2Ni2Sn, Zr2Ni2Sn, and Hf2Ni2Sn compounds were taken. At the first stage of calculations, the crystal structure of each compound was optimized by minimizing the total energy of the consecutive variation of the lattice volume, c/a ratio, and fractional atomic coordinates. The resulting lattice parameters and volume are in good agreement with the experimental data (Table 3). The calculated lattice volume of the series (Fig. 9a) significantly increases from Ti to Zr, and then slightly decreases from Zr to Hf, which is explained by the difference in their atomic/covalent/ionic radii.| a (nm) | c (nm) | V (nm3) | γ (mJ mol−1 K−2) | m th/me | ΔHf (meV per atom) | |
|---|---|---|---|---|---|---|
| Ti2Ni2Sn | 0.68168 | 0.64379 | 0.29916 | 6.93 | 2.06349 | −523.65516 |
| Zr2Ni2Sn | 0.70662 | 0.68893 | 0.34399 | 6.71 | 1.52012 | −619.1403 |
| Hf2Ni2Sn | 0.70925 | 0.68202 | 0.34308 | 5.024 | 1.81131 | −585.14954 |
The calculated enthalpy of formation (Table 3 and Fig. 9b) is negative for all studied intermetallics with the lowest value for the Zr compound. The enthalpies obtained are in good agreement with those reported in ref. 1, 2, 4 and 40.
The distribution of the total density of states is very similar for all compounds and predicts their metallic type of conductivity (Fig. 10). The corresponding Sommerfeld constants γe = DOS(EF)kBπ2/3 are in good agreement with the experimental data (Fig. 9c). The ratio of the thermal effective mass to the electron mass (mth/me = γexp/γcalc.) is within the range of a typical metal and shows a minimum for the Zr compound (Fig. 9d). The experimentally observed enhancement of the effective electron mass can be referred, besides the electron – phonon interaction, primarily to off-stoichiometry effects, as the highest enhancement is observed for the Ti-sample with the largest off-stoichiometry and highest residual resistivity (the opposite holds for the Zr case).
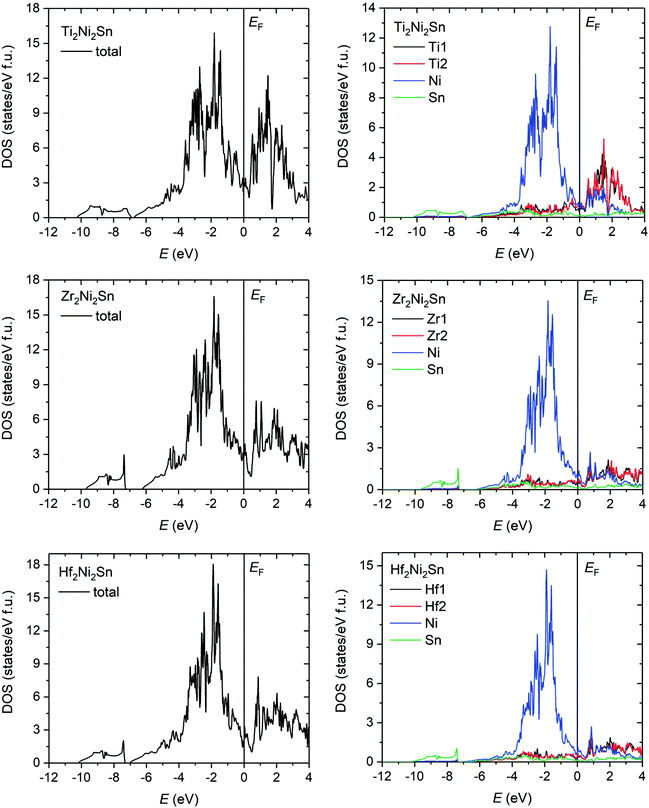 | ||
| Fig. 10 Distribution of the total and partial density of states of Ti2Ni2Sn, Zr2Ni2Sn, and Hf2Ni2Sn. The Fermi level (EF) is shifted to 0 eV. | ||
Even though the Fermi level is positioned on a local maximum for the whole series, there is a well-recognized minimum just above the Fermi level. The valence band is formed mainly by the s- and p-states of Sn and the d-states of Ni, while the states above the Fermi level are contributed mostly by the Ti/Zr/Hf empty d-states. However, a strong overlap of Sn p-, Ni d-, and partially occupied Ti d-states is observed in the energy region from −5 to 0 eV, which is broader than those in the case of the corresponding half- and full-Heusler compounds. Another notable feature is the energy gap between the s-states of Sn (from −10 to −7 eV) and the rest of the valence band spectrum, which is significantly larger for the Zr compound due to the more localized s-states of Sn in Zr2Ni2Sn.
The charge density distribution in Fig. 11 indicates an increase between the closest Ni atoms, which, however, is not well localized. Comparatively smaller saddle points of the charge density are observed between Ni and Sn and between Ni and Ti/Zr/Hf atoms. For the Ti2Ni2Sn compound, the Ni–Sn interactions resulted in a more localized charge density, than the rest of the series. Different Ni–T (T = Ti, Zr, Hf) distances within the deformed TNi6 trigonal prism resulted in a relatively more localized charge density for the shorter ones. Comparing these distances with the sum of the corresponding atomic and covalent radii32 (in nm: Rat(Ni) = 0.1246, Rcov(Ni) = 0.115, Rat(Ti) = 0.1462, Rcov(Ti) = 0.132, Rat(Zr) = 0.1602, Rcov(Zr) = 0.145, Rat(Hf) = 0.159, Rcov(Hf) = 0.144; Rat(Sn) = 0.1545; Rcov(Sn) = 0.1399), one can see that the shorter T–Ni distances are closer to the sum of covalent, and the longer – the sum of atomic radii.
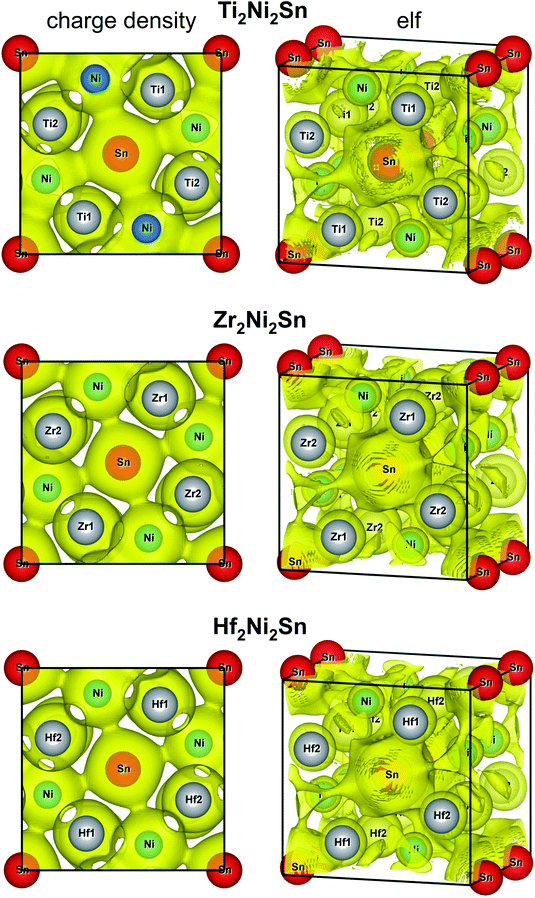 | ||
| Fig. 11 Iso-surface of the charge density at 0.256 Å−3 (left) and the electron localization function at 0.4 (right) of the Ti2Ni2Sn, Zr2Ni2Sn, and Hf2Ni2Sn compounds. | ||
More information on the bonding features was obtained through the analysis of the charge density and electron localization function (elf) (Fig. 11, right panels). The iso-surface of elf at the same value for all studied compounds shows a spherical shape for the Ti/Zr/Hf atoms and indicates their ionic character, which corresponds to their unoccupied d-states above the Fermi level. The [Ni2Sn]n− sublattice is characterized by a complex elf distribution with some localizations around the Ni and Sn atoms. This is caused by a significantly higher electronegativity of Ni and Sn in comparison with Ti/Zr/Hf, and as a result stronger electron density attraction toward the Ni and Sn atoms.
A comparison of the charge density and elf distribution of the T2Ni2Sn series with the V2FeB2 compound (partially ordered U3Si2-type structure)41 shows that the increase of the charge density between the closest Ni atoms corresponds to the similar but significantly stronger elf values between the pair of boron atoms in the equivalent crystallographic site.
Conclusion
Exploiting the knowledge on liquidus surface data and solidification paths for T2Ni2Sn compounds in the ternary systems Ti–Ni–Sn and Zr–Ni–Sn, single-phase materials with slightly non-stoichiometric compositions could be prepared: Ti2.13Ni2Sn0.87, Zr2.025Ni2Sn0.975 and Hf2.055Ni2Sn0.945. X-ray single crystal analyses and transmission electron microscopy clearly defined the crystal structure of Ti2+xNi2Sn1−x, x ∼ 0.13(1), to be isotypic with the U2Pt2Sn-type (space group P42/mnm, ternary ordered version of the Zr3Al2-type), i.e. a (a,2c)-type superstructure of the ordered U3Si2-type.The electrical resistivities as a function of temperature measured on the polycrystalline samples of the three compounds demonstrate metallic-like behavior at lower temperatures, with dominant scattering obviously from static defects provided by off-stoichiometry and grain boundaries.
With a rather low Seebeck coefficient (<15 μV K−1), only low power factors (pf < 0.07 mW m−1K−2) have been obtained yielding (with an estimated minimum thermal conductivity of λmin ∼ 2.32 mW cm−1 K−1 and a calculated electron part of the thermal conductivity) a thermoelectric figure of merit lower than ZT ∼ 0.007 at about 800 K. Whereas the mechanical properties of T2+xNi2Sn1−x (T = Ti, Zr or Hf) are comparable to {Ti,Zr,Hf}NiSn half Heusler alloys, hardness and thermal expansion (measured for Zr2Ni2Sn α = 15.4 × 10⁻⁶ K−1 above 180 K) are significantly higher than the corresponding values for {Ti,Zr,Hf}NiSn half Heusler phases. Although the mechanical properties of the T2Ni2Sn compounds are all comparable to those of our advanced thermoelectrics {Ti,Zr,Hf}NiSn with ZT up to 1.5 (ref. 5 and 6) (for a summary of the mechanical property data of half Heusler alloys, see ref. 20), the ZT values of the T2Ni2Sn phases are negligible. Under the assumption that the influences of electrical and thermal conductivity cancel out, the low Seebeck coefficient of T2Ni2Sn may reduce the overall ZT of a corresponding composite 95% (Ti,Zr,Hf)NiSn + 5% T2Ni2Sn already by about 10%. Therefore it is advisable to keep the concentration of these phases in any {Ti,Zr,Hf}NiSn-based thermoelectric composite as low as possible.
The distribution of the DFT-derived total density of states is very similar for all three compounds T2Ni2Sn and confirms their metallic type of conductivity. The corresponding Sommerfeld constants are consistent with the experimental data and the ratio of the thermal effective mass to the electron mass (mth/me = γexp/γcalc.) is within the range of typical metals. The valence band is formed mainly by the s and p states of Sn and the d-states of Ni, with a strong overlap of Sn p, Ni d, and partially occupied Ti d states in the region from −5 to 0 eV, and is broader than those for the corresponding half- and full-Heusler compounds.
The calculated distributions of the charge density and electron localization function (elf) indicate the ionic character (unoccupied d-states above EF) of the Ti/Zr/Hf atoms. The elf of the [Ni2Sn]n− sublattice reflects some localizations around the Ni and Sn atoms with a large somewhat diffuse charge density between the closest Ni atoms. It is worth noting that the Ni–Sn interactions for Ti2Ni2Sn resulted in a more localized charge density than for the rest of the series.
Author contributions
All authors have contributed equally to the work.Conflicts of interest
The authors declare that they have no known competing financial interests or personal relationships that could have appeared to influence the work reported in this paper.Acknowledgements
The contributions of Dr M. Gürth, Dr P. Sauerschnig and particularly of Daniel Langerreiter in his bachelor work at the early stages of this manuscript and the contributions of Dr Herbert Müller (thermal expansion) and Dr Stephan Puchegger (RUS) are cordially acknowledged. The authors thank U. Nitzsche for technical assistance in running DFT calculations on the ITF/IFW computer cluster. Dr V. Romaka is thankful for the support from the Austrian Federal Ministry of Science and Research (BMWF) within the Ernst Mach fellowship program and the German Federal Ministry of Education and Research (BMBF) within the UKRATOP project (01DK18002). This research was supported by MEYS, Czech Republic via the bilateral Mobility project 8J21AT015 co-sponsored by Austrian WTZ-CZ16/2021. This paper is dedicated to Dr. Helmut Holleck, in memoriam.References
- M. Gürth, A. Grytsiv, J. Vrestal, V. V. Romaka, G. Giester, E. Bauer and P. Rogl, On the constitution and thermodynamic modelling of the system Ti–Ni–Sn, RSC Adv., 2015, 112(5), 92270–92291 RSC.
- P. Sauerschnig, A. Grytsiv, J. Vrestal, V. V. Romaka, B. Smetana, G. Giester, E. Bauer and P. Rogl, On the constitution and thermodynamic modelling of the system Zr-Ni-Sn, J. Alloys Compd., 2018, 742, 1058–1082 CrossRef CAS.
- Yu. V. Stadnyk and L. P. Romaka, Phase equilibria in the Hf–Ni–Sn ternary system and crystal structure of the Hf2Ni2Sn compound, J. Alloys Compd., 2001, 316, 169–171 CrossRef CAS.
- A. Berche, J. C. Tédenac and P. Jund, Phase diagram and enthalpy of formation of Hf-Ni-Sn, Comput. Mater. Sci., 2016, 125, 271–277 CrossRef CAS.
- M. Gürth, G. Rogl, V. V. Romaka, A. Grytsiv, E. Bauer and P. Rogl, Thermoelectric high ZT half-Heusler alloys Ti1−x-yZrxHfyNiSn, Acta Mater., 2016, 104, 210–222 CrossRef.
- G. Rogl, P. Sauerschnig, Z. Rykavets, V. V. Romaka, P. Heinrich, B. Hinterleitner, A. Grytsiv, E. Bauer and P. Rogl, (V,Nb)-doped half Heusler alloys based on {Ti,Zr,Hf}NiSn with high ZT, Acta Mater., 2017, 131, 336–348 CrossRef CAS.
- R. Pöttgen and R. Dronskovsky, Structure and Properties of Zr2Ni2In and Zr2Ni2Sn, J. Solid State Chem., 1997, 128, 289–294 CrossRef.
- M. F. Zumdick, R. Pöttgen, R. Müllmann, B. D. Mosel, G. Kotzyba and B. Künnen, Synthesis, crystal structure, and properties of Hf2Ni2In, Hf2Ni2Sn, Hf2Cu2In and Hf2Pd2In with ordered Zr3Al2 type structure, Z. Anorg. Allg. Chem., 1998, 624, 251–256 CrossRef CAS.
- V. V. Romaka, P. Rogl, L. Romaka, Yu. Stadnyk, N. Melnychenko, A. Grytsiv, M. Falmbigl and N. Skryabina, Phase equilibria, formation, crystal and electronic structure of ternary compounds in Ti–Ni–Sn and Ti–Ni–Sb ternary systems, J. Solid State Chem., 2013, 197, 103–112 CrossRef CAS.
- R. Gaillac and F. X. Coudert, ELATE, Elastic terms analysis, J. Phys.: Condens. Matter, 2012, 8(6), 275201 Search PubMed.
- INCA Energy-300 and INCA Wave 700, Oxford Instruments Analytical Ltd, UK, 2000 Search PubMed.
- J. Rodriguez-Carvajal, Recent developments of the program FULLPROF, Phys. B, 1993, 55, 192 Search PubMed . See also: T. Roisnel and J. Rodriguez-Carvajal, Mater. Sci. Forum, 2001, 118, 378–381 Search PubMed.
- W. Wacha, Diploma thesis, Vienna University of Technology, Vienna, Austria, 1989.
- Bruker Advanced X-ray solutions. APEX2 User Manual. Version 1.22.2004, Bruker AXS Inc. For APEXII, SAINT and SADABS see 2008, Bruker Analytical X-ray Instruments, Inc., Madison, Wisconsin, USA Search PubMed.
- G. M. Sheldrick, SHELX – Program for Crystal Structure Refinement, Acta Crystallogr., Sect. A: Found. Crystallogr, 2008, 64, 112–122 RSC; Windows version OSCAIL by P. McArdle, K. Gilligan, D. Cunningham, R. Dark and M. Mahon, CrystEngComm, 2004, 6, 303–309 RSC.
- E. Parthé, L. Gelato, B. Chabot, M. Penzo, K. Censual and R. Gladyshevskii, TYPIX – Standardized Data and Crystal Chemical Characterization of Inorganic Structure Types, Springer-Verlag, Berlin, Heidelberg, 1994, vol. 1, p. 186 CrossRef. See also L. M. Gelato and E. Parthé, STRUCTURE TIDY - a computer program to standardize crystal structure data, J. Appl. Crystallogr., 1987, 20, 139–143 CrossRef.
- A. Migliori, J. Sarrao, W. M. Visscher, T. M. Bell, M. Lei, Z. Fisk and R. G. Leisure, Resonant ultrasound spectroscopic techniques for measurement of the elastic moduli of solids, Phys. B, 1993, 183, 1–24 CrossRef CAS.
- L. Zhang, G. Rogl, A. Grytsiv, S. Puchegger, J. Koppensteiner, F. Spieckermann, H. Kabelka, M. Reinecker, P. Rogl, W. Schranz, M. Zehetbauer and M. A. Carpenter, Mechanical properties of filled antimonide skutterudites, Mater. Sci. Eng., B, 2010, 170, 26–31 CrossRef CAS.
- G. Rogl and P. Rogl, Mechanical properties of skutterudites, Sci. Adv. Mater., 2011, 3, 1–22 CrossRef.
- G. Rogl, A. Grytsiv, M. Gürth, A. Tavassoli, C. Ebner, A. Wünschek, S. Puchegger, V. Soprunyuk, W. Schranz, E. Bauer, H. Müller, M. Zehetbauer and P. Rogl, Mechanical properties of half-Heusler alloys, Acta Mater., 2016, 107, 178–195 CrossRef CAS.
- O. L. Anderson, A simplified method for calculating the Debye temperature from elastic constants, J. Phys. Chem. Solids, 1963, 24, 909 CrossRef CAS.
- E. Schreiber, O. L. Anderson and N. Soga, Elastic Constants and their Measurements, Mc Graw Hill, New York, 1973 Search PubMed.
- M. Rotter, H. Müller, E. Gratz, M. Dörr and M. Löwenhaupt, A miniature capacitance dilatometer for thermal expansion and magnetostriction, Rev. Sci. Instrum., 1998, 69, 2742–2746 CrossRef CAS.
- G. Brändli and R. Griessen, Two capacitance dilatometers, Cryogenics, 1973, 13, 299–302 CrossRef.
- J. Genossar and M. Steinitz, A tilted plate capacitance displacement sensor, Rev. Sci. Instrum., 1990, 61, 2469–2470 CrossRef CAS.
- Elk Program package; http://elk.sourceforge.net/.
- J. P. Perdew, K. Burke and M. Ernzerhof, Generalized gradient approximation made simple, Phys. Rev. Lett., 1996, 77(18), 3865–3868 CrossRef CAS PubMed.
- P. Vinet, J. H. Rose and J. S. Ferrante Jr., Universal features of the equation of state of solids, J. Phys.: Condens. Matter, 1989, 1, 1941–1964 CrossRef CAS.
- K. Momma and F. Izumi, VESTA 3 for three-dimensional visualization of crystal, volumetric and morphology data, J. Appl. Crystallogr., 2011, 44, 1272–1276 CrossRef CAS.
- P. Villars and K. Censual, Pearson's Crystal Data: Crystal Structure Database for Inorganic Compounds, ASM International, Materials Park, Ohio, USA, Release 2019/20 Search PubMed.
- V. I. Zaremba, L. D. Gulai, Ya. M. Kalychak and L. G. Akselrud, Crystal structure of compounds with Mo2FeB2-type structure in {Zr,Hf}-{Co,Ni,Cu}-In systems, Kristallografiya, 1995, 40(2), 369 CAS.
- W. B. Pearson, The Crystal Chemistry and Physics of Metals and Alloys, Wiley-Interscience, New York, USA, 1972 Search PubMed. The 12-coordinated metallic radii in Table 4-4 of this book have been taken from: E. Teatum, K. Gschneidner and J. Waber, Report LA-2345, US Department of Commerce, Washington, D.C., USA, 1960 Search PubMed.
- P. Stadelmann, JEMS: Java Electron Microscopy Software, available from: http://www.jems-swiss.ch/, 2021 Search PubMed.
- P. A. Stadelmann, EMS - a software package for electron diffraction analysis and HREM image simulation in materials science, Ultramicroscopy, 1987, 21(2), 131–145 CrossRef CAS.
- M. Wang, H. S. Liu, G. M. Cai and Z. P. Jin, Measurement of phase equilibria in Ti−Ni−Sn system, Trans. Nonferrous Met. Soc. China, 2018, 28, 819–828 CrossRef CAS.
- Y. V. Stadnyk and R. V. Skolozdra, 770 K isothermal section of the Ti−Ni−Sn system, Inorg. Mater., 1991, 27(10), 1884–1885 Search PubMed.
- D. G. Cahill and R. O. Pohl, Heat flow and lattice vibrations in glasses, Solid State Commun., 1989, 70(10), 927–930 CrossRef.
- W. C. Oliver and G. M. Pharr, An improved technique for determining hardness and elastic modulus using load and displacement sensing indentation experiments, J. Mater. Res., 1992, 7, 1564–1583 CrossRef CAS.
- G. D. Mukherjee, C. Bansal and A. Chatterjee, Thermal expansion study of ordered and disordered Fe3Al: An effective approach for the determination of vibrational entropy, Phys. Rev. Lett., 1996, 76(11), 1876–1879 CrossRef CAS PubMed.
- A. Berche, J. C. Tédenac and P. Jund, Phase stability of nickel and zirconium stannides, J. Phys. Chem. Solids, 2017, 103, 40–48 CrossRef CAS.
- P. Rogl, V. Romaka, J. Bursik, H. Michor, M. Reissner, G. Giester and V. Homolova, Structure and properties of a novel boride (V0.92Fe0.08)2FeB2 with partially ordered U3Si2-type, J. Alloys Compd., 2018, 746, 638–647, DOI:10.1016/j.jallcom.2018.02.323.
Footnotes |
| † Electronic supplementary information (ESI) available. See DOI: 10.1039/d1dt03198h |
| ‡ Present address: Chair of Inorganic Chemistry, TU Dresden, Bergstrasse 66, 01069 Dresden, Germany. |
| This journal is © The Royal Society of Chemistry 2022 |

