
 Open Access Article
 This Open Access Article is licensed under a
 Creative Commons Attribution 3.0 Unported Licence
Remote monitoring of volatiles by ion mobility spectrometry with wireless data transmission and centralized data analysis†
Hsuan-Ting
Ou
a,
Krzysztof
Buchowiecki
a and
Pawel L.
Urban
 *ab
*ab
aDepartment of Chemistry, National Tsing Hua University, 101, Section 2, Kuang-Fu Rd., Hsinchu, 300044, Taiwan
bFrontier Research Center on Fundamental and Applied Sciences of Matters, National Tsing Hua University, Taiwan. E-mail: urban@mx.nthu.edu.tw
First published on 12th September 2022
Abstract
Volatile organic compounds (VOCs) are omnipresent in daily life, industry, and science. Among many VOCs, some can affect the food quality while others are environmental pollutants. We previously developed a portable pen-probe ion-mobility spectrometry (IMS)-based analyzer for in situ detection of VOCs emanating from surfaces and wireless transmission of the acquired spectra. In the current work, we have improved the platform with regard to its analytical performance and connectivity. The acquired data can be transmitted to a central computer via a long-range wide-area network, in the absence of a mobile phone network. When the data are deposited on the cloud, a program written in Python performs data treatment in order to spot abnormal spectral patterns. The ion-mobility spectra are binned and subjected to principal component analysis (PCA). The PCA scoring plots are updated and available for viewing on a dedicated website as soon as new data are transmitted from the field. Field analysis, relying on a distributed network of such IMS-based sensing devices and centralized data treatment, can potentially shorten the response time to emerging events. The limits of detection for pyrrolidine, trimethylamine, 1,4-diaminobutane, 1,5-diaminopentane, 2,4-lutidine, and (−)-nicotine are in the range of 0.18–21.71 nmol. The resolving power values are in the range of 38.8–69.1. The platform was tested by following a food degradation process.
Introduction
Portable analytical devices are increasingly popular due to their intrinsic features such as ease of use, fast analysis, real-time analysis, and no requirement for sample pretreatment.1–3 Some of such devices can perform remote monitoring of chemical compounds or chemical reactions. They can often be built using low-cost microcontroller boards (MCBs) and electrochemical sensors.4,5 Due to these advantages, the portable devices are utilized in various application fields, including gas detection,6 environmental water monitoring,7 detection of analytes in solid samples,2 therapeutic drug monitoring,8 clinical diagnostics,9 and food quality control.10 Some wireless devices take advantage of mobile phone networks enabling real-time data transmission for monitoring processes remotely.11 However, mobile phone networks may be absent in remote rural areas. Other wireless communication techniques enable transmitting information by various radio frequencies. One of them is the long-range wide area network (LoRaWAN), which uses the LoRa electronic modules.12 It consumes little power and enables long-range data transmission (in general, kilometers).13 The transmission speed can reach a few kbps,13 which is sufficient for many Internet-of-Things applications. No mobile phone base stations are required. The incorporation of wireless and portable devices is extremely convenient due to the possibility to perform remote monitoring, in situ analysis, and real-time data analysis without direct access to the Internet.Ion-mobility spectrometry (IMS) is an instrumental technique that can be used for the rapid detection of gas-phase analytes even at ambient pressure and temperature.14 A typical IMS system separates the ions based on their size and charge as they migrate through a chamber. The chamber is supplied with an electric field. Selection of ion source depends on the physical properties of the analytes.15 Various types of IMS techniques have been developed, which can be classified based on the type of ion handling (time dispersion, spatial dispersion, and ion confinement).16 Time-dispersive IMS techniques include drift-tube IMS (DTIMS),17 traveling wave IMS (TWIMS),18 and overtone mobility spectrometry (OMS).19,20 Space-dispersive IMS techniques include high-field asymmetric IMS (FAIMS)21 and differential mobility analyzer (DMA).22 On the other hand, trapped IMS (TIMS)23 and ion cyclotron mobility spectrometry rely on ion confinement.24 Due to their simplicity, DTIMS systems are among the most commonly used apparatuses. IMS has a very wide range of applications in preliminary chemical analysis (screening), including the detection of chemical warfare agents,25 monitoring of trace explosives26 as well as other applications related to public safety.27 IMS has also been applied in the detection of illicit drugs,28 environmental monitoring,29 breath analysis for clinical diagnosis,30 and food quality analysis.31,32 Different from conventional gas chromatography (GC) and mass spectrometry (MS), IMS instruments are typically small, and they can be portable enabling in situ analysis. In recent years, several designs of homemade IMS systems have been disclosed. For instance, a prototype of the FAIMS system was installed on a multicopter to enable the detection of explosives and drugs in hard-to-reach places.33 In general, IMS provides numerous advantages including: atmospheric pressure operation, short analysis time, and low cost. Its disadvantages include low accuracy in the identification of analytes and low peak-to-peak resolution.
Manual analysis of large data sets can be tedious. Hence, statistical methods such as multivariate analysis are often considered. Multivariate analysis has the capability to organize and visualize large amounts of data. Such methods are classified as supervised learning or unsupervised learning.34,35 The supervised learning methods, such as partial least square discriminant analysis (PLS-DA) and linear discriminant analysis (LDA), include two stages. In the first stage, the datasets are manually labeled and trained with algorithms. After the training, the trained model can be used for the prediction of the unknown in the second stage.36 In contrast to supervised learning, unsupervised learning algorithms are used against data that are unlabeled. In other words, unsupervised learning has to allow the model to distinguish the data on its own, based on the features of the data without prior manual classification. There are different types of unsupervised learning methods, including principal component analysis (PCA) and hierarchical cluster analysis (HCA).37 Although supervised learning requires manual classification, which is more time-consuming, the pre-classification makes the algorithm determine the output with higher accuracy than the unsupervised learning.36,38 These days, multivariate analysis has been widely used in chemical research, especially in the field of clinical diagnosis.39
We aim to demonstrate the concept of centralized multivariate analysis of analytical data acquired by a portable IMS-based platform (Fig. 1). The raw datasets are transmitted to the central server either via the Internet from the mobile phone network or LoRaWAN communication. The received datasets are processed on the server in real-time, and the statistical analysis results are immediately posted on the dedicated website, ready for viewing and interpretation. It is envisioned that “normal” and “abnormal” spectra can readily be distinguished, pointing to significant changes in the chemical composition of the analyzed matrices.
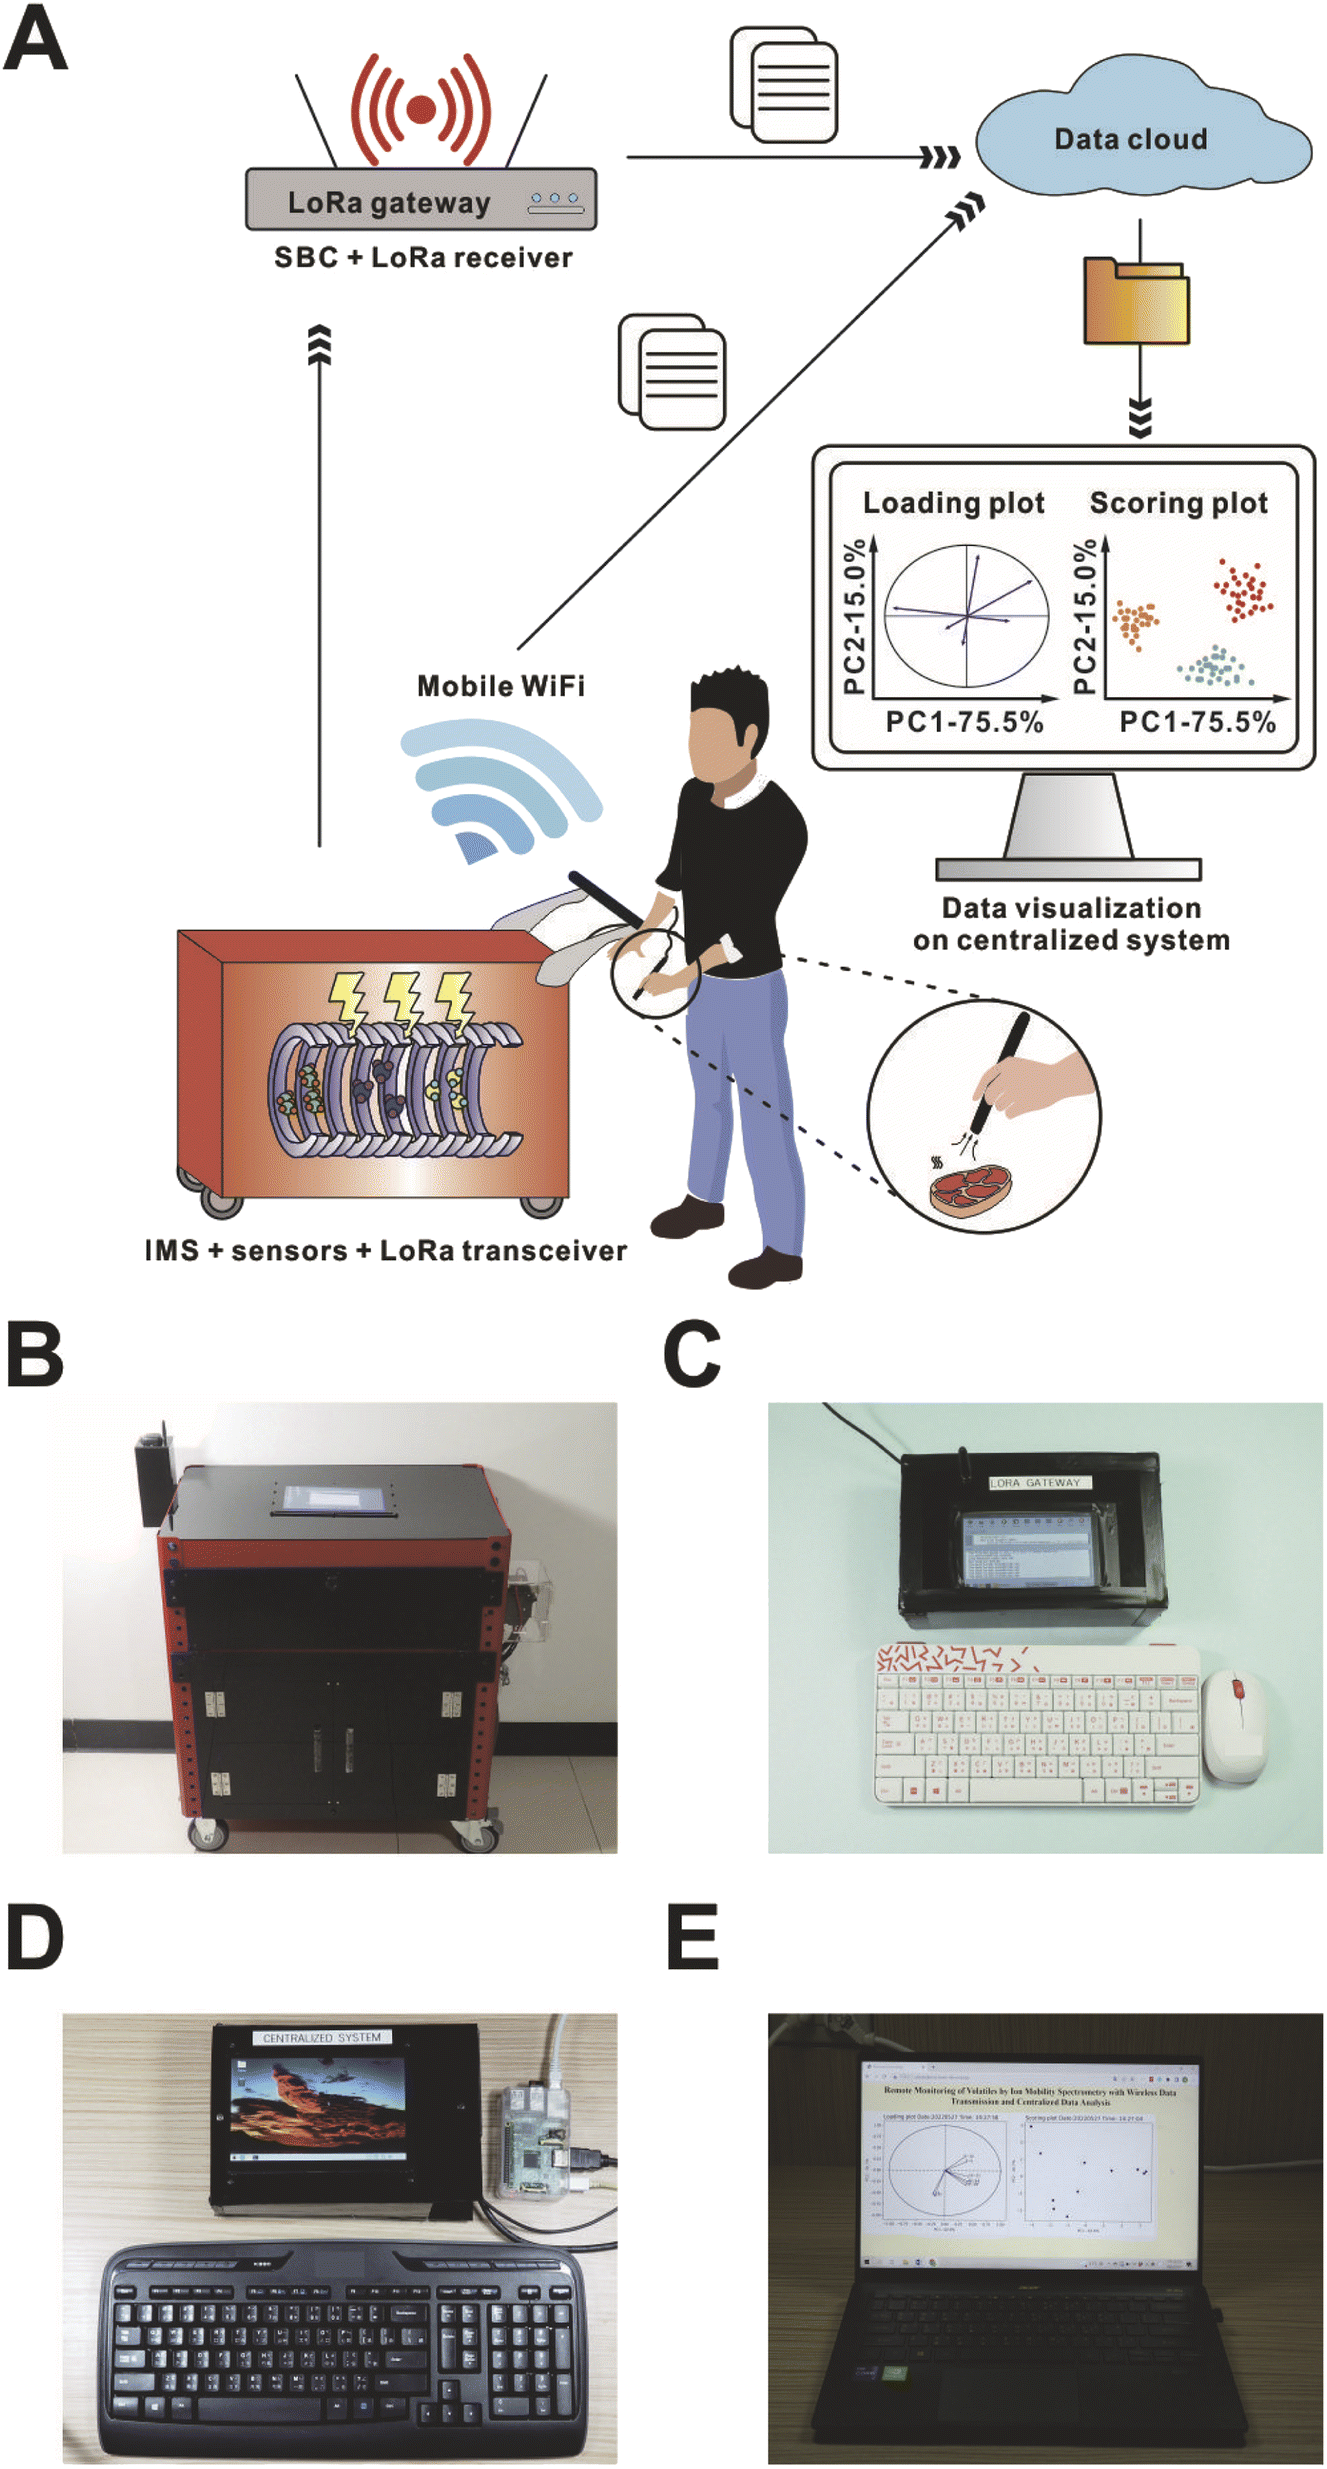 | ||
| Fig. 1 Integration of IMS-based portable analyzer with centralized data analysis system: (A) general concept; (B) portable IMS-based platform; (C) LoRa gateway; (D) centralized system server; (E) website displaying the final results. | ||
Experimental section
Chemicals
Water (LC-MS grade) was purchased from Merck (Darmstadt, Germany). 1,5-Diaminopentane (98%) and pyrrolidine (>99%) were purchased from Acros Organics (Geel, Belgium). (−)-Nicotine free base (99%) and trimethylamine solution (45% in water) were purchased from Sigma-Aldrich (St. Louis, MO, USA). 1,4-Diaminobutane was purchased from Thermo Fisher Scientific (Tewksbury, MA, USA). 2,4-Lutidine (>98%) was purchased from TCI (Tokyo, Japan). The real samples (chicken breast, Mozambique tilapia (Oreochromis mossambicus), and white shrimp (Litopenaeus vannamei)) were purchased from the local supermarket (Hsinchu City, Taiwan).Prototype of the portable ion-mobility spectrometer
A prototype of a portable drift tube ion-mobility spectrometer—utilizing multiple low-cost electronic components—was developed previously.3 The drift tube and the detector (Faraday plate) were fabricated based on the report by Reinecke and Clowers.40 The system was powered by a lithium battery (24 V, 50 Ah; model no. BT-024-050-A; Inner-Energy Technology Company, Taoyuan City, Taiwan). In our previous work, the atmospheric pressure chemical ionization (APCI) source was kept in an open-space holder.3 However, the ionization efficiency was low due to the open-space layout of the ion source. In the present study, we re-designed the ion source holder (Fig. S1†). An enclosure was placed in front of the acrylic spacer, next to the first electrode of the drift tube, which is in contrast to the previous design where the holder did not directly attach to the acrylic spacer but was separated by a 1.5 cm slit. The APCI needle protruded from the center of the enclosure, and was placed 5 mm in front of the first electrode of the drift tube. The sample vapor tubing outlet was located 5 mm from the tip of the needle, and the tubing was perpendicular to the needle (Fig. S1†). The air compressor (model no. AMP1204; Air-Mart Industrial, Taichung, Taiwan) delivered air, which was used as the drift gas. In principle, small gas cylinders can be used instead of the air compressor;41 however, they can supply gas only for a short period of time during field operation, which is inconvenient. The drift gas passed through the molecular sieve 5A moisture trap (model no. 20618; Supelco, Bellefonte, PA, USA) and a mass flow controller (model no. F-201CL-013-1 K0-A; Bronkhorst, Ruurlo, The Netherlands), which controlled the flow rate by adjusting the applied voltage. A T-junction adapter (stainless steel male branch tee; 1/8 in, 1/8 in, 1/4 in; male national pipe thread (NPT); SS-200-3-4TTM; Swagelok, Solon, OH, USA) was connected after the mass flow controller to split the gas flow into two directions (Fig. S2†). One end was used to supply drift gas while the other end was used for monitoring the relative humidity and temperature of drift gas. A digital temperature and humidity sensor (model no. DHT22-Module; Centenary Materials Company, Hsinchu City, Taiwan)—connected to the Arduino MCB (Arduino Uno R3; Centenary Materials Company; MCB1)—was fitted in a plastic box (length: 79 mm; width: 69 mm; height: 23 mm; MagicJack Department Store, Hsinchu City, Taiwan), connected to the T-junction, to enable monitoring of drift gas temperature and humidity (Fig. S2†). A micropump (model no. NMP015; DRF Corporation, Taipei City, Taiwan) was used for sample introduction.Similar to the previous version of the mobile platform,3 the current version took advantage of a mobile phone WiFi router to achieve Internet connectivity. Furthermore, a long-range (LoRa) radio frequency communication module (Lora RFM9X; Taiwan IoT Studio, Tainan City, Taiwan; LoRa1) was connected to the Arduino MCB (Arduino Due; Centenary Materials Company; MCB2) to achieve wireless data transmission in the absence of mobile phone network. The radio frequency was set to 434 MHz. A global positioning system (GPS) module (model no. Adafruit Ultimate GPS Breakout v3 – 66 channel w/10 Hz; Deryuan Technology, New Taipei City, Taiwan) was placed in a plastic box and fixed onto a special acrylic holder (Fig. S3†), which was manufactured by the NTHU workshop (Hsinchu City, Taiwan). Note that it is necessary to keep the GPS module box at least ∼20 cm away from the top layer of the trolley to avoid electronic interference, and to obtain the geolocation data. The GPS module was powered and controlled by MCB1. A digital temperature sensor (model no. Tsys01; ClosedCube, London, UK) was placed beside the drift tube to monitor the temperature around the drift tube. The top layer of the trolley accommodated a single-board computer (Tinker Board S; Asus, New Taipei City, Taiwan; SBC1) and a display (10.1 inches HDMI capacitive touch LCD; Waveshare, New Taipei City, Taiwan).
Programs for system control and data acquisition
A graphical user interface (GUI) was previously established in Processing 3 software (version 3.5.3; Processing Foundation, Boston, MA, USA).3 The GUI provides numerous buttons with different functions that allow the users to operate the system easily. In this study, we incorporated new functions into the GUI to enhance the functionality of the device. First, the switch button for the “Cooling Fan” controlled three fans installed upon the drift tube to cool down the drift tube (Fig. S4†), and to minimize peak shifts. Second, we created three resolution modes (high, medium, low) that correspond to three different pulse widths of the ion gate: 200 μs, 330 μs, and 500 μs.At last, two different methods were adopted to monitor the usage of the moisture trap. Note that the humidity affected the formation of protonated clusters and the drift time of reactant ion peak (RIP) significantly.42,43 The first method was based on the humidity of drift gas. The time to the expiration for the moisture trap (L, days left) was estimated based on the following empirical equation:
| L = H × (−2.3) + 69.2 | (1) |
The program for data acquisition was written in a variant of C++ using Arduino IDE. A Python program (“Data acquisition”) was used on the SBC1 for retrieving the spectral data, which were acquired by the MCB2, as well as retrieving the geolocation, and the relative humidity and temperature of drift gas acquired by MCB1. The ion-mobility spectrum was plotted on the screen based on the data processed by the “Data acquisition” program. The spectrum was saved as a .png file and .txt file along with the additional information on the SBC1. Apart from the items that have already been mentioned in our previous publication,3 the relative humidity (%) and the temperature (°C) of drift gas were inserted in the fifth line of the output .txt file. At the same time, the .txt file was uploaded to Dropbox from SBC1 and the spectral data were almost simultaneously transmitted through LoRa1, even in the absence of a mobile phone network.
Hardware for centralizing the data analytics
A Raspberry Pi (Raspberry Pi 3 A+; SBC2) was used as a gateway to receive spectrum data via LoRa and upload the data file to the cloud (Fig. 1). First, an Arduino MCB (Arduino Uno R3; Centenary Materials Company; MCB3) was powered by the SBC2. Then, a LoRa electronic module (Lora RFM9X; Taiwan IoT Studio, Tainan City, Taiwan; LoRa2), connected to MCB3, was used to receive the data transmitted from LoRa1. The third SBC (Raspberry Pi 1 B+; SBC3) was adopted as the server for real-time data processing and data visualization.Programs for remote monitoring and data analytics
In order to achieve remote monitoring and real-time data analysis, LoRa2 was utilized for wireless data transmission, while the SBC2 (along with the “LoRa gateway” program) was used as a gateway to receive and upload the datasets to the cloud. Another Python program (“Centralized data analysis”), which ran on the SBC3, consolidated and analyzed the spectral data. As soon as the file was uploaded to the cloud via the “LoRa gateway” program, the “Centralized data analysis” program performed data treatment in order to spot abnormal spectral patterns (Fig. 1). Firstly, multiple files were downloaded and the ion-mobility spectra were binned. There were 30 bins in total (1 ms interval as 1 bin). We refrained from using narrower bins to minimize the detrimental effect of changing conditions (e.g. temperature) on the data quality. Eight consecutive bins—corresponding to the drift times from 6 ms to 14 ms—have been selected as eight variables because sample-related peaks typically appeared in this time range. These variables were further subjected to PCA.Sampling
The developed platform was tested with six standard compounds (pyrrolidine, trimethylamine, 2,4-lutidine, 1,4-diaminobutane, 1,5-diaminopentane, and (−)-nicotine). Sampling was performed as previously described.3 The pen-probe was held ∼1 cm away from a piece of filter paper. Later, a 10 μL aliquot of the analyte solution in water was pipetted onto the filter paper. The button on the pen-probe or the “start acquisition” button was pressed after 10 s exposure of the sample in the atmosphere.Results and discussion
Proof-of-concept
The prototype of centralized analysis system based on IMS (Movie S1†) was developed by taking advantage of off-the-shelf universal electronic components, following the recent notion.4,5,44–47 To demonstrate the spectral data can be transmitted through the LoRa electronic module, and uploaded to the cloud in the absence of mobile phone network coverage, the WiFi function of the SBC1 was switched off. Initially, the micropump was switched on from the GUI to prepare for the sample introduction, and the DHT-22 was started for monitoring the temperature and humidity of drift gas. The high-voltage power supplies for the drift tube and the ion source were switched on as well. Before clicking the “start acquisition” button, or the button installed on the pen-probe for data acquisition, the resolution mode had to be selected to determine the pulse width; medium-resolution mode was selected for the following tests. Also note that the “LoRa gateway” and “Centralized data analysis” programs had to be started before the analysis to ensure the operation of the gateway and the centralized server, so that the data transmission and the data visualization could be accomplished. When a spectrum was recorded, it was displayed on the SBC1's screen, and the data transmission via LoRa1 began. After LoRa2 received the data, the data were saved as a .txt file and uploaded to the cloud by the SBC2. Eventually, the “Centralized data analysis” program on the SBC3 downloaded all the data files from the cloud and performed the data analysis with PCA (Fig. 2).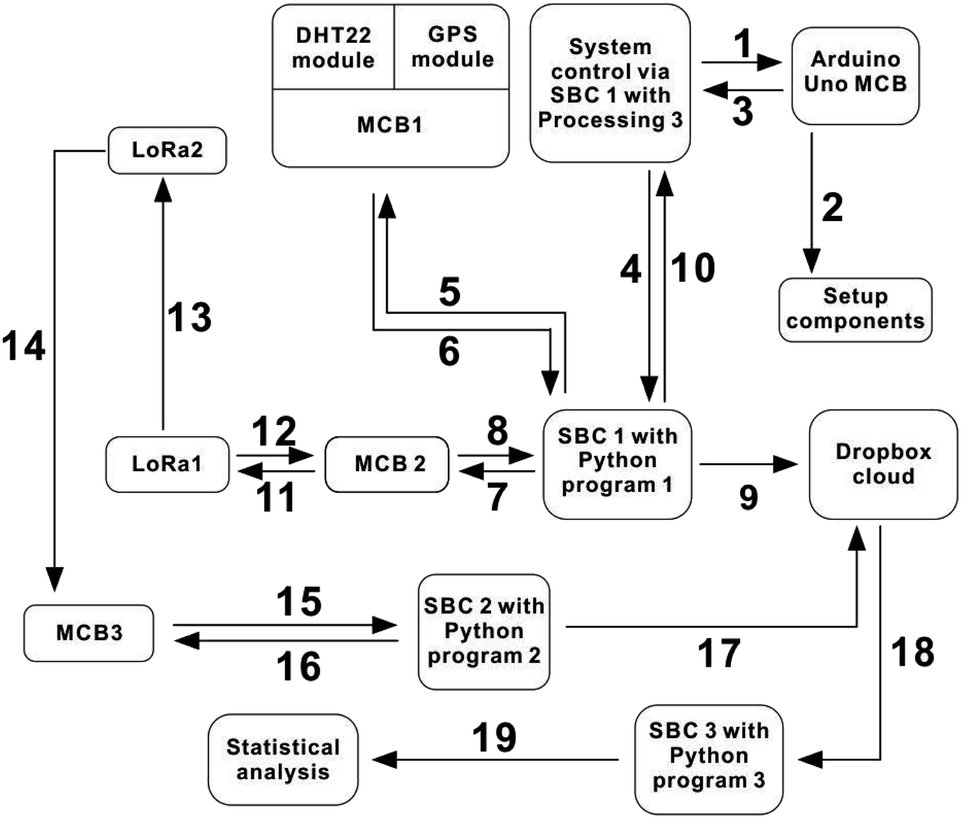 | ||
| Fig. 2 Interactions between different modules of the system. (1) Control the switch of electronic components by GUI; (2) execute the command from Arduino; (3) display the status of each component; (4) acquire data; (5) request geolocation, humidity, and temperature; (6) acquire geolocation, humidity, and temperature; (7) request spectrum data; (8) acquire spectrum data; (9) collect data and upload to Dropbox for data storage; (10) acquire the notice of command; (11) request spectrum data; (12) acquire spectrum data; (13) transmit data; (14) acquire spectrum data; (15) request spectrum data; (16) acquire spectrum data; (17) collect data and upload to Dropbox for data storage; (18) download data file from Dropbox; (19) perform data analysis by using multivariate statistical analysis. | ||
PCA provided two different plots (scoring plot and loading plot). The loading plot indicates the variables that dominate the separation in the scoring plot.48 The similarity of the data points can be observed from the clusterization in the scoring plot. Note that the “Centralized data analysis” program downloaded all of the data files from the cloud to perform PCA. However, PCA cannot be conducted if the number of data files is not greater than two. Thus, the “Centralized data analysis” program conducted PCA after over two data files were downloaded, and the following data files were included in the PCA executed in an infinite loop. After every iteration of data analysis, the scoring plot and the loading plot were displayed and posted on the self-built website (Fig. S5†).
Characterization of the platform
The influence of drift gas flow rate (just before the drift tube) and the sample gas flow rate on the dimer signal of 2,4-lutidine (10.23 ms) was tested (Fig. S6†), and the following values were selected for further measurements: 0.746 and 1.2 L min−1, respectively. Although the lower sample flow rate could provide better sensitivity, the higher flow rate was selected to avoid the carryover, elimination of which would be quite time-consuming. A typical blank ion-mobility spectrum features a prominent RIP. The RIP is commonly related to protonated water clusters (H+(H2O)n).15 Once an analyte (M) is introduced, the analyte gets protonated giving rise to monomer (MH+), dimer (M2H+), or trimer (M3H+) ions.49 The formation of protonated clusters depends on the amount of analyte that is introduced to the ion source (Fig. 3). The putative monomer peak is assigned based on the decreasing intensity of the RIP and the increasing intensity of an analyte peak with increasing amount/concentration of the analyte. On the other hand, the dimer peak is assigned based on the decreasing intensity of the monomer peak and the increasing intensity of the analyte peak. Further, the drift time of the analyte-related peak is taken into account for the assignment of the monomer and dimer. Reduced mobility values were calculated for the monomer and dimer peaks of the six compounds, and compared with the literature values (Table S1†), although the experimental conditions were not identical.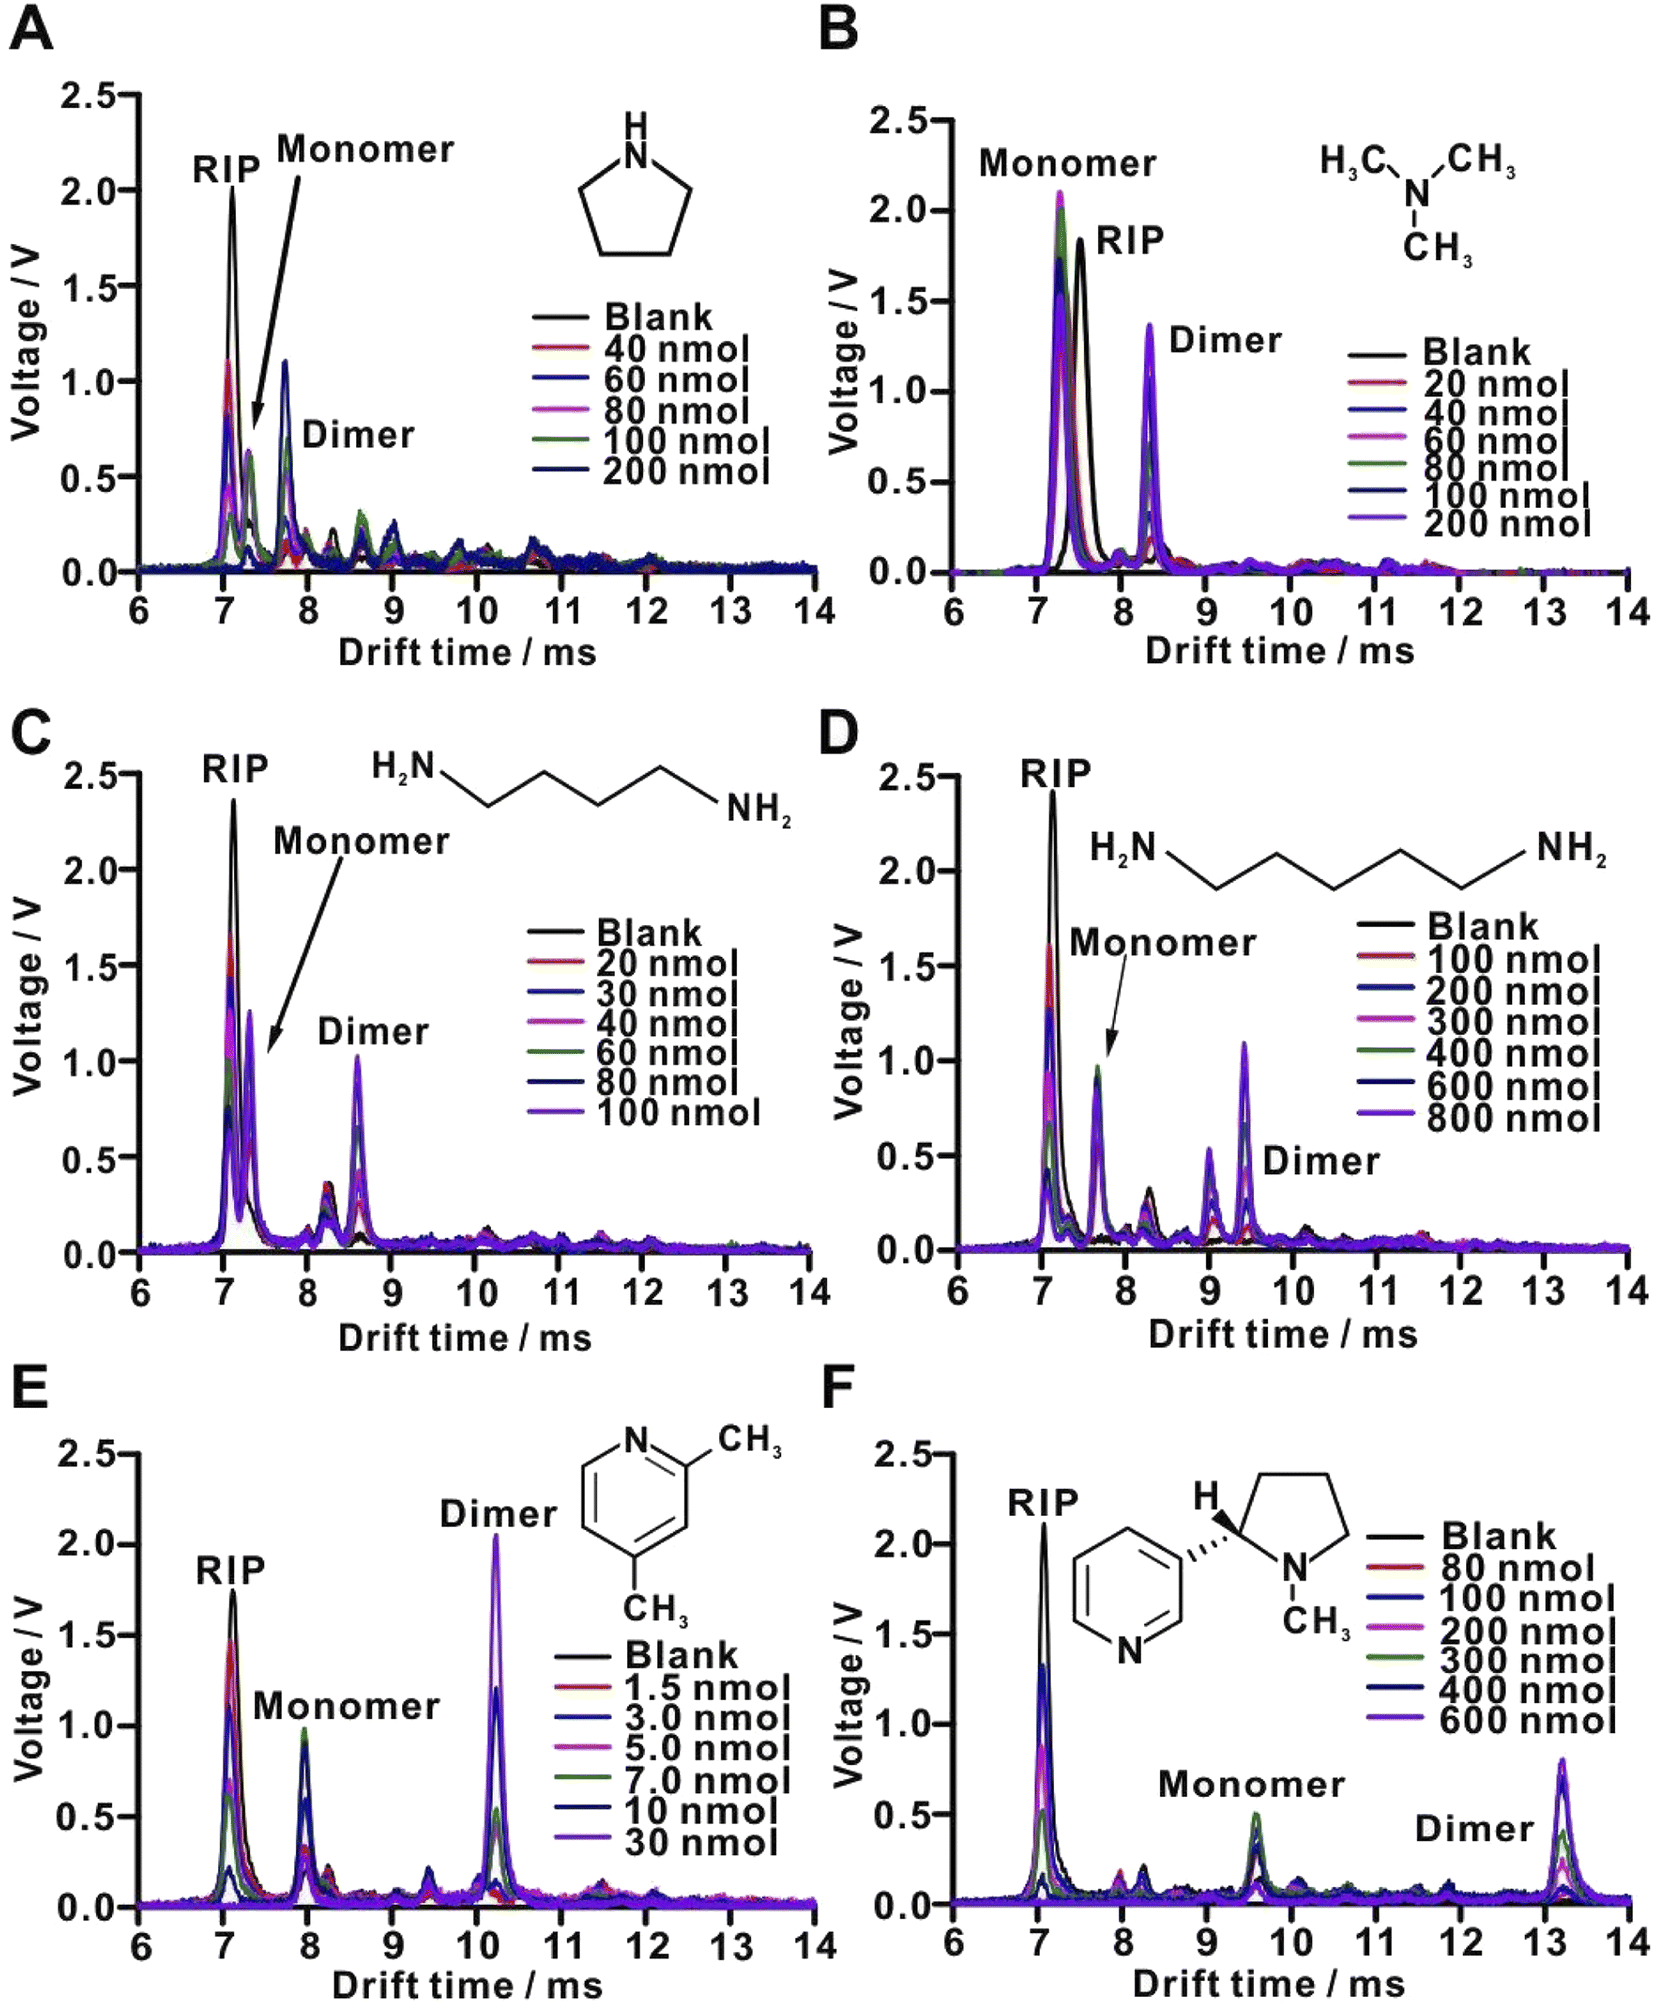 | ||
| Fig. 3 Baseline-subtracted ion-mobility spectra of selected standard compounds: (A) pyrrolidine; (B) trimethylamine; (C) 1,4-diaminobutane; (D) 1,5-diaminopentane; (E) 2,4-lutidine; (F) (−)-nicotine. See Table S1† for the identification of peaks. | ||
Next, we verified the feasibility of the real-time PCA analysis conducted on the binned datasets recorded by the portable IMS unit. The amounts of six selected analytes were in the range of 30–600 nmol. The six compounds were analyzed individually along with seven instrumental blanks in a cycle. The instrumental blank analysis was performed before the analysis of each test compound to ensure the system could be operated without carryover (cf. Fig. S7†). The PCA scoring plot—generated by the “Centralized data analysis” program—displays six clusters, which correspond to the six compounds (Fig. 4). The plots show the capability of the entire system to classify different compounds in real time.
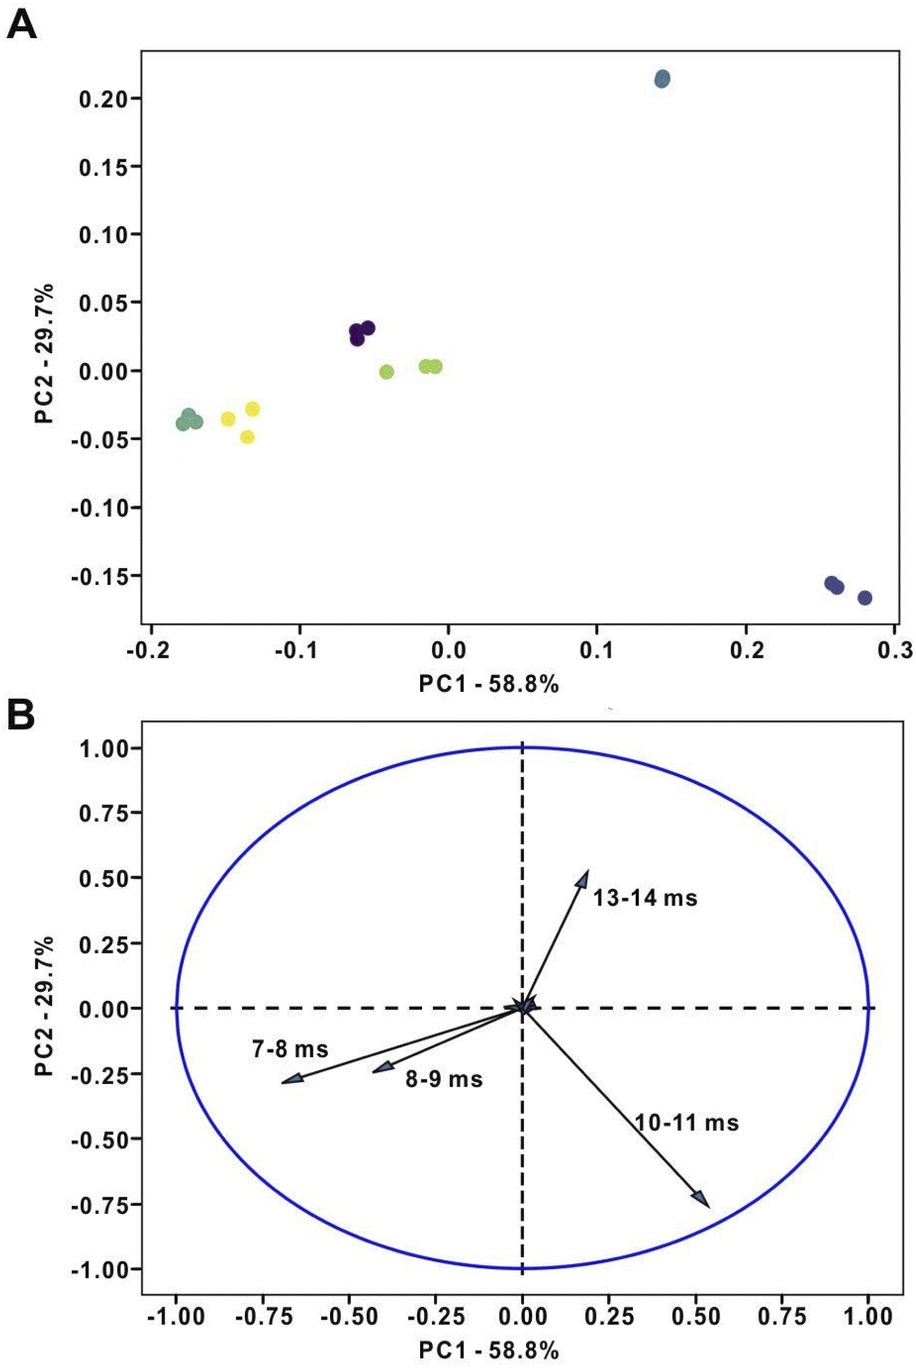 | ||
| Fig. 4 Multivariate statistical analysis of datasets obtained for standard compounds. (A) PCA scoring plot and (B) loading plot: dark blue – 600 nmol (−)-nicotine; purple – 600 nmol 1,5-diaminopentane; yellow – 80 nmol 1,4-diaminobutane; green – 200 nmol pyrrolidine; navy blue – 30 nmol 2,4-lutidine; cyan – 200 nmol trimethylamine. | ||
The limits of detection (LODs) were calculated based on the signal-to-noise ratios (S/N) of the dimer peak. The noise was determined by using the root mean square (RMS) value of the baseline (after subtraction of baseline average) in the range without any peaks (20 ms to 30 ms). The intensity of the peak was converted to the amplitude by subtracting the averaged baseline, and the S/N ratio of the peak was determined by dividing the peak amplitude by the RMS value. The LOD was then expressed as the sample amount for which the S/N ratio is equal to 3. The LODs of the six compounds are in the nanomole range (Table 1). Note that these values correspond to the amounts of the analytes that are placed on the surface of filter paper. The LODs of three compounds (pyrrolidine, 2,4-lutidine, and (−)-nicotine) are 12–20 times lower than in the previous report,3 which is mainly attributed to the installation of the new ion source holder (Fig. S1†). The holder covers the corona needle to preserve the process of ionization that takes place in a closed region, which confines the ions near the drift tube inlet and improves the ion transfer efficiency.
| Compound name | Formula | Drift time/ms | Resolving power | LOD/nmol | Calibration equation | R 2 | Repeatability (RSD)/% (n = 10) | Reproducibility (RSD)/% (n = 30) |
|---|---|---|---|---|---|---|---|---|
| Pyrrolidine | C4H9N | 7.73 ± 0.02 | 42.1 ± 4.9 | 10.75 ± 1.33 | Peak area = 1.29 × 10⁶nanalyte | 0.959 | 9.00 | 9.81 |
| Trimethylamine | C3H9N | 8.30 ± 0.01 | 66.2 ± 0.1 | 10.99 ± 1.39 | Peak area = 1.06 × 10⁶nanalyte | 0.985 | 8.82 | 8.92 |
| 1,4-Diaminobutane | C4H4N2 | 8.60 ± 0.01 | 59.0 ± 8.9 | 2.67 ± 0.19 | Peak area = 1.29 × 10⁶nanalyte | 0.994 | 1.61 | 9.38 |
| 1,5-Diaminopentane | C5H14N2 | 9.42 ± 0.01 | 69.1 ± 7.2 | 3.23 ± 0.54 | Peak area = 2.48 × 10⁵nanalyte | 0.984 | 7.78 | 8.31 |
| 2,4-Lutidine | C7H9N | 10.23 ± 0.01 | 64.1 ± 9.4 | 0.18 ± 0.06 | Peak area = 1.67 × 10⁷nanalyte | 0.980 | 3.76 | 8.57 |
| (−)-Nicotine | C10H14N2 | 13.22 ± 0.02 | 49.8 ± 1.0 | 21.71 ± 9.17 | Peak area = 3.75 × 10⁵nanalyte | 0.979 | 6.93 | 8.73 |
The resolving powers of six compounds were calculated based on the dimer peaks by dividing the centroid by the full-width-at-half-maximum (FWHM). The centroid and the FWHM of the peak were determined by PeakFit software (version 4.12; Systat Software, San Jose, CA, USA). The resolving powers of the six compounds are in the range of 38 to 64 (Table 1). Notably, the resolving powers of the three compounds (pyrrolidine, 2,4-lutidine, and (−)-nicotine) are greater than in the previous report,3 which is mainly attributed to the increase of drift gas flow rate from 0.5 L min−1 to 0.746 L min−1. The increased flow rate likely leads to increased declustering/drying of the ions being monitored due to more air flow through a dry gas medium and less influence of outside air intrusion into the tube. Resolving power is also affected by the length of the drift tube, electric field, and ion injection pulse width. Notably, in the report by Reinecke and Clowers, the resolving power of 2,4-lutidine was 82.40 In the present work, we chose 330 μs as ion injection pulse width to enhance the S/N ratio. However, this long ion injection time contributes to the peak broadening and the loss of resolving power (for further considerations see ref. 50).
Calibration plots were prepared for six standard compounds, 5–6 amount levels, 3 replicates. The calibration plots were fitted with linear functions (Fig. S8†). The R2 values for the six standard compounds fall within the range of 0.959–0.994 (Table 1), which shows good linearity between the peak area and the amount of the analyte. Furthermore, the repeatability (relative standard deviation (RSD): 1.61–9.00%; n = 10; on one day) and the reproducibility (RSD: 8.31–9.81%; n = 30; three replicates per day on ten consecutive days) were determined (Table 1; analytes amounts: 30–200 nmol). They show that the operation of the platform is reasonably stable.
Application of the centralized system in the monitoring of food freshness
Food quality is always considered as an important factor for consumers. Food spoilage occurs due to chemical reactions attributed to microbial activity.51 Notably, the foodstuffs emit significant odor, which is due to various VOCs. Here, chicken breast, Mozambique tilapia (Oreochromis mossambicus), and white shrimp (Litopenaeus vannamei) were selected for the demonstration of monitoring the food spoilage process. The three real samples were stored at ∼4–8 °C. The emitted VOCs were sampled periodically by the mobile IMS platform. Each sample was measured three times every 24 hours. After one week of measurements, the spectra showed a significant difference from the first day to the seventh day (Fig. S9†). Further, the trimethylamine (TMA) standard was applied for the putative identification of real-sample analysis (Fig. S10†). Although the spectra from the TMA standard overlap with the real-sample spectra, ion mobility measurement is not sufficient for molecular identification.52 However, it was reported that biogenic amines, such as 1,4-diaminobutane, 1,5-diaminopentane, and TMA, are among the VOCs released during the food degradation process.53,54 Thus, in the present case, TMA may be the dominant compound released during the food degradation process. The PCA scoring plots showed the separation between the data points, which represent different levels of the food spoilage process (Fig. 5). Meanwhile, the sum of two principal components (PC1 and PC2) retained 98.3%, 99.8%, and 95.4% of the original data variance for the three foodstuffs (chicken breast, Mozambique tilapia, and white shrimp), respectively. In other words, the PCA calculation with spectral data binning is feasible for data classification because the loss of information is less than 5%. Based on the changes of the spectra and the PCA scoring plots, the evaluation of food quality can be achieved. In addition, the PCA scoring plots can be considered as an index to predict the level of food decomposition.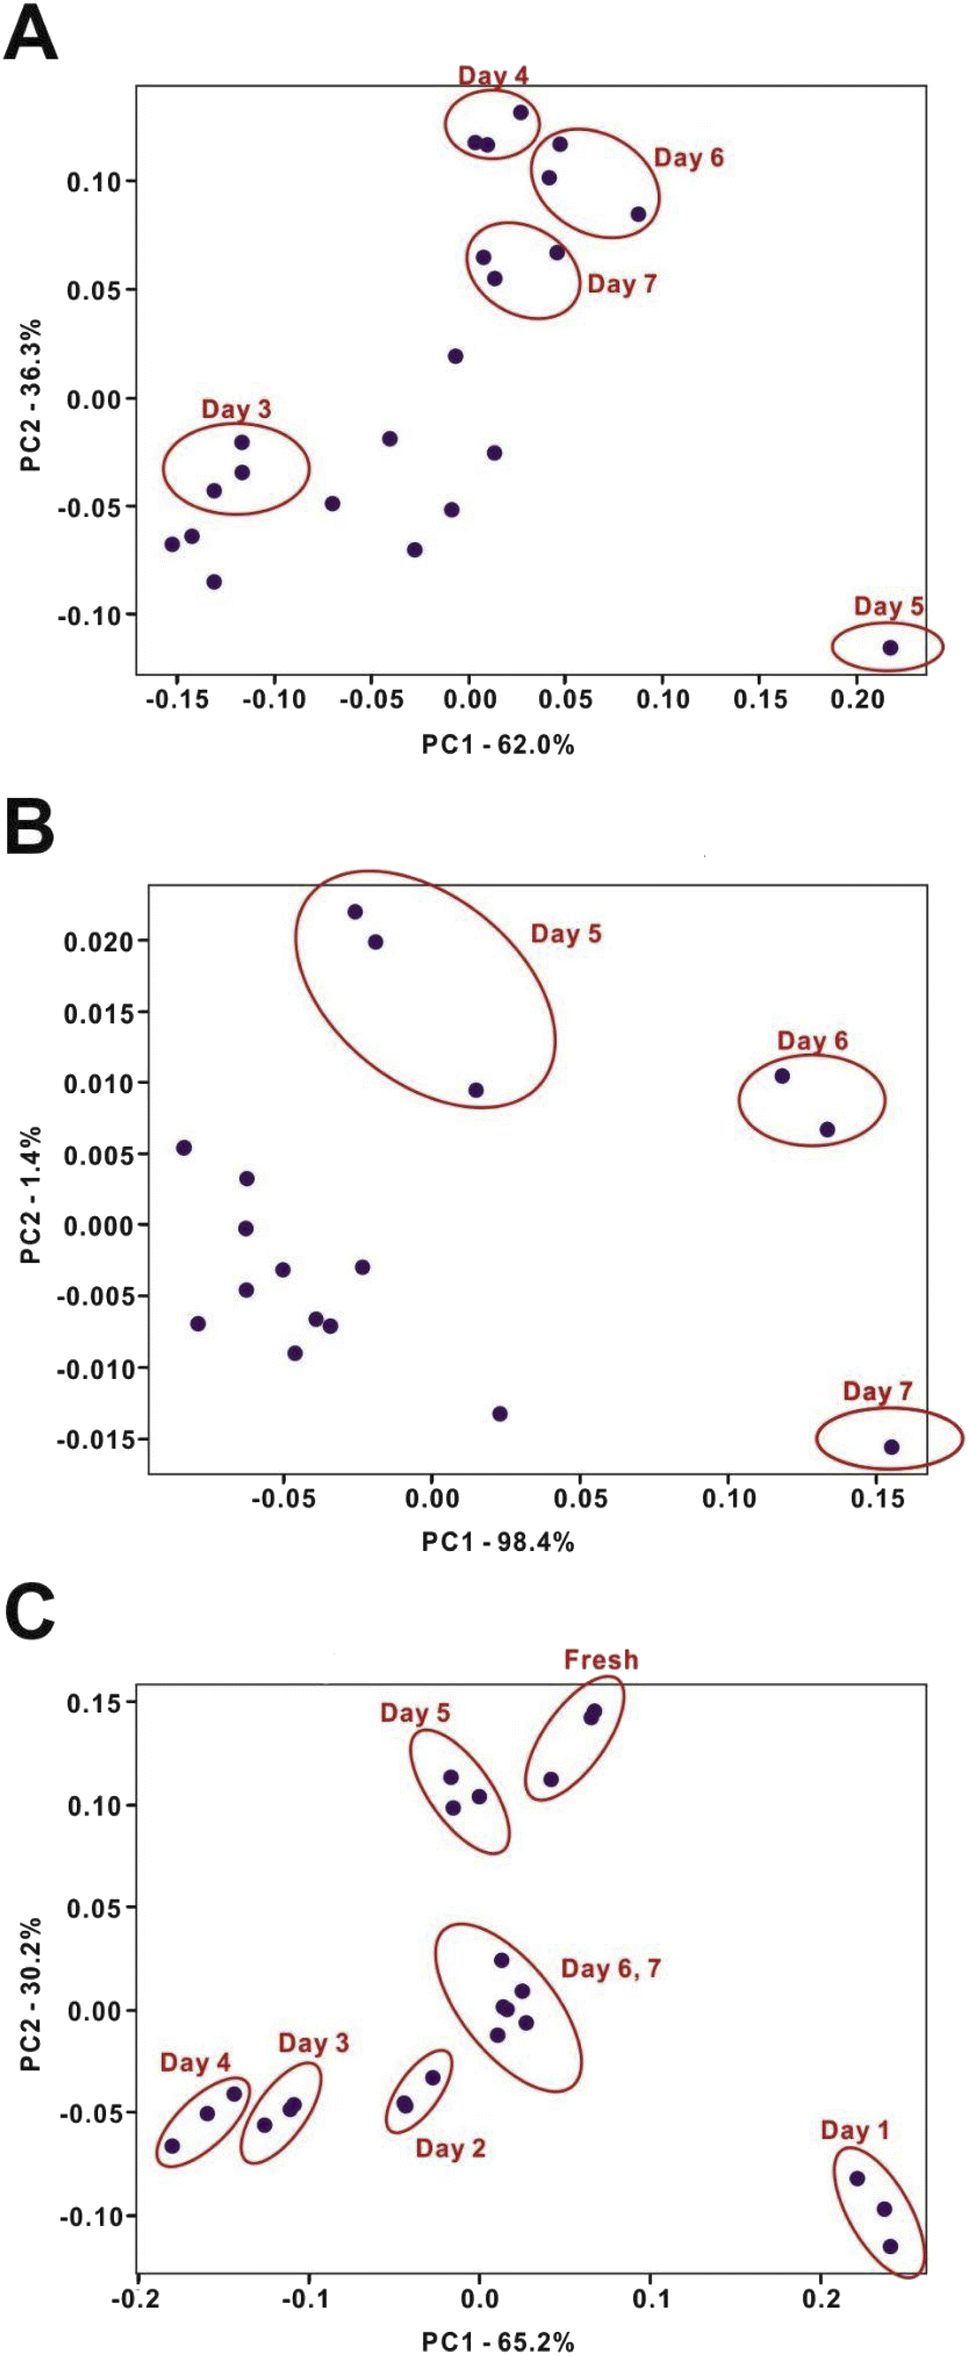 | ||
| Fig. 5 Multivariate statistical analysis of datasets obtained for food samples undergoing spoilage. (A) Chicken breast; (B) Mozambique tilapia; (C) white shrimp. | ||
Conclusions
We have developed an analytical system incorporating data acquisition by an ion-mobility spectrometer, data transmission, centralized data analysis, and visualization in real time. The system makes use of PCA for the classification of spectral data. Raw data files—containing spectral data and other information (geolocation, ambient temperature, temperature and humidity of drift gas)—can be transmitted to the cloud and the spectral data can even be transmitted in the absence of a mobile phone network. It was shown that selected foodstuffs can be classified according to the spoilage level. Due to the integration of chemical data and geolocation data, the centralized analytical system can potentially be applied to map and analyze the localization of chemical data recorded for samples analyzed in different areas. In future, it would also be appealing to combine the portable IMS system with portable mass spectrometer to provide information-rich flow of data to the centralized data analysis platform.Data availability statement
The code has been uploaded to GitHub (https://github.com/NTHU-UrbanLab/IMS-wireless), and the datasets supporting this article have been uploaded to Figshare (https://doi.org/10.6084/m9.figshare.21027835.v1).Conflicts of interest
There are no conflicts to declare.Acknowledgements
We acknowledge the Ministry of Science and Technology (MOST), Taiwan (grant numbers 109-2113-M-007-013-MY3, 110-2628-M-007-004-MY4, and 111-2634-F-007-007), the National Tsing Hua University (111QI009E1), the Frontier Research Center on Fundamental and Applied Sciences of Matters as well as the Featured Areas Research Center Program within the framework of the Higher Education Sprout Project established by the Ministry of Education (MOE), Taiwan (111QR001I5).References
- W. R. de Araujo, T. M. G. Cardoso, R. G. da Rocha, M. H. P. Santana, R. A. A. Muñoz, E. M. Richter, T. R. L. C. Paixão and W. K. T. Coltro, Portable Analytical Platforms for Forensic Chemistry: A Review, Anal. Chim. Acta, 2018, 1034, 1–21 CrossRef CAS.
- Y.-T. Chao, G. R. D. Prabhu, K.-C. Yu, J.-Y. Syu and P. L. Urban, BioChemPen for a Rapid Analysis of Compounds Supported on Solid Surfaces, ACS Sens., 2021, 6, 3744–3752 CrossRef CAS PubMed.
- C.-P. Shih, K.-C. Yu, H.-T. Ou and P. L. Urban, Portable Pen-Probe Analyzer Based on Ion Mobility Spectrometry for in Situ Analysis of Volatile Organic Compounds Emanating from Surfaces and Wireless Transmission of the Acquired Spectra, Anal. Chem., 2021, 93, 2424–2432 CrossRef CAS PubMed.
- G. R. D. Prabhu, T.-H. Yang, C.-Y. Hsu, C.-P. Shih, C.-M. Chang, P.-H. Liao, H.-T. Ni and P. L. Urban, Facilitating Chemical and Biochemical Experiments with Electronic Microcontrollers and Single-Board Computers, Nat. Protoc., 2020, 15, 925–990 CrossRef CAS.
- G. R. D. Prabhu and P. L. Urban, Elevating Chemistry Research with a Modern Electronics Toolkit, Chem. Rev., 2020, 120, 9482–9553 CrossRef CAS PubMed.
- R. Bogue, Remote Chemical Sensing: A Review of Techniques and Recent Developments, Sens. Rev., 2018, 38, 453–457 CrossRef.
- K. Lukyanenko, I. Denisov, V. Sorokin, A. Yakimov, E. Esimbekova and P. Belobrov, Handheld Enzymatic Luminescent Biosensor for Rapid Detection of Heavy Metals in Water Samples, Chemosensors, 2019, 7, 16 CrossRef CAS.
- S. Bian, B. Zhu, G. Rong and M. Sawan, Towards Wearable and Implantable Continuous Drug Monitoring: A Review, J. Pharm. Anal., 2021, 11, 1–14 CrossRef PubMed.
- L. Bissonnette and M. G. Bergeron, Portable Devices and Mobile Instruments for Infectious Diseases Point-of-Care Testing, Expert Rev. Mol. Diagn., 2017, 17, 471–494 CrossRef CAS PubMed.
- G. Rateni, P. Dario and F. Cavallo, Smartphone-Based Food Diagnostic Technologies: A Review, Sensors, 2017, 17, 1453 CrossRef PubMed.
- M. K. Hasan, M. Shahjalal, M. Z. Chowdhury and Y. M. Jang, Real-Time Healthcare Data Transmission for Remote Patient Monitoring in Patch-Based Hybrid OCC/BLE Networks, Sensors, 2019, 19, 1208 CrossRef PubMed.
- J. Haxhibeqiri, E. De Poorter, I. Moerman and J. Hoebeke, A Survey of LoRaWAN for IoT: From Technology to Application, Sensors, 2018, 18, 3995 CrossRef PubMed.
- A. Lavric, LoRa (Long-Range) High-Density Sensors for Internet of Things, J. Sensors, 2019, 2019, 3502987 CrossRef.
- G. A. Eiceman, Z. Karpas and H. H. Hill Jr, Ion Mobility Spectrometry, CRC Press, Boca Raton, 3rd edn, 2014 Search PubMed.
- R. Cumeras, E. Figueras, C. E. Davis, J. I. Baumbach and I. Gràcia, Review on Ion Mobility Spectrometry. Part 1: Current Instrumentation, Analyst, 2015, 140, 1376–1390 RSC.
- J. C. May and J. A. McLean, Ion Mobility-Mass Spectrometry: Time-Dispersive Instrumentation, Anal. Chem., 2015, 87, 1422–1436 CrossRef CAS PubMed.
- G. A. Harris, S. Graf, R. Knochenmuss and F. M. Fernández, Coupling Laser Ablation/Desorption Electrospray Ionization to Atmospheric Pressure Drift Tube Ion Mobility Spectrometry for the Screening of Antimalarial Drug Quality, Analyst, 2012, 137, 3039–3044 RSC.
- A. A. Shvartsburg and R. D. Smith, Fundamentals of Traveling Wave Ion Mobility Spectrometry, Anal. Chem., 2008, 80, 9689–9699 CrossRef CAS PubMed.
- R. T. Kurulugama, F. M. Nachtigall, S. Lee, S. J. Valentine and D. E. Clemmer, Overtone Mobility Spectrometry: Part 1. Experimental Observations, J. Am. Soc. Mass Spectrom., 2009, 20, 729–737 CrossRef CAS.
- S. J. Valentine, S. T. Stokes, R. T. Kurulugama, F. M. Nachtigall and D. E. Clemmer, Overtone Mobility Spectrometry: Part 2. Theoretical Considerations of Resolving Power, J. Am. Soc. Mass Spectrom., 2009, 20, 738–750 CrossRef CAS PubMed.
- I. A. Buryakov, E. V. Krylov, E. G. Nazarov and U. K. Rasulev, A New Method of Separation of Multi-Atomic Ions by Mobility at Atmospheric Pressure Using a High-Frequency Amplitude-Asymmetric Strong Electric Field, Int. J. Mass Spectrom. Ion Processes, 1993, 128, 143–148 CrossRef CAS.
- P. Intra and N. Tippayawong, An Overview of Differential Mobility Analyzers for Size Classification of Nanometer-Sized Aerosol Particles, J. Sci. Technol., 2008, 30, 243–256 Search PubMed.
- M. E. Ridgeway, M. Lubeck, J. Jordens, M. Mann and M. A. Park, Trapped Ion Mobility Spectrometry: A Short Review, Int. J. Mass Spectrom., 2018, 425, 22–35 CrossRef CAS.
- S. I. Merenbloom, R. S. Glaskin, Z. B. Henson and D. E. Clemmer, High-Resolution Ion Cyclotron Mobility Spectrometry, Anal. Chem., 2009, 81, 1482–1487 CrossRef CAS PubMed.
- M. A. Mäkinen, O. A. Anttalainen and M. E. T. Sillanpää, Ion Mobility Spectrometry and Its Applications in Detection of Chemical Warfare Agents, Anal. Chem., 2010, 82, 9594–9600 CrossRef PubMed.
- G. A. Eiceman and J. A. Stone, Peer Reviewed: Ion Mobility Spectrometers in National Defense, Anal. Chem., 2004, 76, 390A–397A CrossRef CAS PubMed.
- R. G. Ewing, D. A. Atkinson, G. A. Eiceman and G. J. Ewing, A Critical Review of Ion Mobility Spectrometry for the Detection of Explosives and Explosive Related Compounds, Talanta, 2001, 54, 515–529 CrossRef CAS.
- J. R. Verkouteren and J. L. Staymates, Reliability of Ion Mobility Spectrometry for Qualitative Analysis of Complex, Multicomponent Illicit Drug Samples, Forensic Sci. Int., 2011, 206, 190–196 CrossRef CAS.
- I. Márquez-Sillero, E. Aguilera-Herrador, S. Cárdenas and M. Valcárcel, Ion-Mobility Spectrometry for Environmental Analysis, Trends Anal. Chem., 2011, 30, 677–690 CrossRef.
- T. Perl, E. Carstens, A. Hirn, M. Quintel, W. Vautz, J. Nolte and M. Jünger, Determination of Serum Propofol Concentrations by Breath Analysis Using Ion Mobility Spectrometry, Br. J. Anaesth., 2009, 103, 822–827 CrossRef CAS PubMed.
- M. Hernández-Mesa, D. Ropartz, A. M. García-Campaña, H. Rogniaux, G. Dervilly-Pinel and B. Le Bizec, Ion Mobility Spectrometry in Food Analysis: Principles, Current Applications and Future Trends, Molecules, 2019, 24, 2706 CrossRef.
- W. Vautz, D. Zimmermann, M. Hartmann, J. I. Baumbach, J. Nolte and J. Jung, Ion Mobility Spectrometry for Food Quality and Safety, Food Addit. Contam., 2006, 23, 1064–1073 CrossRef CAS PubMed.
- Y. Kostyukevich, D. Efremov, V. Ionov, E. Kukaev and E. Nikolaev, Remote Detection of Explosives Using Field Asymmetric Ion Mobility Spectrometer Installed on Multicopter, J. Mass Spectrom., 2017, 52, 777–782 CrossRef CAS PubMed.
- C. Chatfield and A. J. Collins, Introduction to Multivariate Analysis, Routledge, 2018 Search PubMed.
- N. H. Timm, Applied Multivariate Analysis, Springer, New York, NY, 2014 Search PubMed.
- S. Chourasiya and S. Jain, A Study Review on Supervised Machine Learning Algorithms, Int. J. Comput. Mater. Sci. Eng., 2019, 6, 16–20 CrossRef.
- M. Kyan, P. Muneesawang, K. Jarrah and L. Guan, Unsupervised Learning: A Dynamic Approach, Wiley-Blackwell, Hoboken, NJ, 2014 Search PubMed.
- P. Cunningham, M. Cord and S. J. Delany, Supervised Learning, in Machine Learning Techniques for Multimedia, 2008, pp. 21–49 Search PubMed.
- J. H. Young, M. Sans, N. Katta, N. Giese, W. Yu, C. Nagi, J. Suliburk, J. Liu, A. Bensussan, R. J. DeHoog, K. Y. Garza, B. Ludolph, A. G. Sorace, A. Syed, A. Zahedivash, T. E. Milner and L. S. Eberlin, Nondestructive Tissue Analysis for Ex Vivo and in Vivo Cancer Diagnosis Using a Handheld Mass Spectrometry System, Sci. Transl. Med., 2017, 9, eaan3968 CrossRef PubMed.
- T. Reinecke and B. H. Clowers, Implementation of a Flexible, Open-Source Platform for Ion Mobility Spectrometry, HardwareX, 2018, 4, e00030 CrossRef.
- C.-H. Chen, G. R. D. Prabhu, K.-C. Yu, D. P. Elpa and P. L. Urban, Portable Fizzy Extraction Ion-Mobility Spectrometry System, Anal. Chim. Acta, 2022, 1204, 339699 CrossRef CAS PubMed.
- M. Mäkinen, M. Sillanpää, A.-K. Viitanen, A. Knap, J. M. Mäkelä and J. Puton, The Effect of Humidity on Sensitivity of Amine Detection in Ion Mobility Spectrometry, Talanta, 2011, 84, 116–121 CrossRef PubMed.
- Z. Izadi, M. Tabrizchi, H. Borsdorf and H. Farrokhpour, Humidity Effect on the Drift Times of the Reactant Ions in Ion Mobility Spectrometry, Anal. Chem., 2019, 91, 15932–15940 CrossRef CAS PubMed.
- P. L. Urban, Universal Electronics for Miniature and Automated Chemical Assays, Analyst, 2015, 140, 963–975 RSC.
- P. Urban, Open Hardware: Self-Built Labware Stimulates Creativity, Nature, 2016, 532, 313 CrossRef CAS PubMed.
- G. R. D. Prabhu and P. L. Urban, The Dawn of Unmanned Analytical Laboratories, Trends Anal. Chem., 2017, 88, 41–52 CrossRef CAS.
- P. L. Urban, Prototyping Instruments for the Chemical Laboratory Using Inexpensive Electronic Modules, Angew. Chem., Int. Ed., 2018, 57, 11074–11077 CrossRef CAS PubMed.
- I. T. Jolliffe and J. Cadima, Principal Component Analysis: A Review and Recent Developments, Philos. Trans. R. Soc., A, 2016, 374, 20150202 CrossRef PubMed.
- N. Jurado-Campos, R. Garrido-Delgado, B. Martínez-Haya, G. A. Eiceman and L. Arce, Stability of Proton-Bound Clusters of Alkyl Alcohols, Aldehydes and Ketones in Ion Mobility Spectrometry, Talanta, 2018, 185, 299–308 CrossRef CAS PubMed.
- W. F. Siems, C. Wu, E. E. Tarver, H. H. Hill Jr, P. R. Larsen and D. G. McMinn, Measuring the Resolving Power of Ion Mobility Spectrometers, Anal. Chem., 1994, 66, 4195–4201 CrossRef CAS.
- J. M. Lorenzo, P. E. Munekata, R. Dominguez, M. Pateiro, J. A. Saraiva and D. Franco, Main Groups of Microorganisms of Relevance for Food Safety and Stability, Innovative Technologies for Food Preservation, Elsevier, 2018, pp. 53–107 Search PubMed.
- R. Cumeras, E. Figueras, C. E. Davis, J. I. Baumbach and I. Gràcia, Review on Ion Mobility Spectrometry. Part 2: Hyphenated Methods and Effects of Experimental Parameters, Analyst, 2015, 140, 1391–1410 RSC.
- G. M. Bota and P. B. Harrington, Direct Detection of Trimethylamine in Meat Food Products Using Ion Mobility Spectrometry, Talanta, 2006, 68, 629–635 CrossRef CAS PubMed.
- M. Alikord, A. Mohammadi, M. Kamankesh and N. Shariatifar, Food Safety and Quality Assessment: Comprehensive Review and Recent Trends in the Applications of Ion Mobility Spectrometry (IMS), Crit. Rev. Food Sci. Nutr., 2021, 1–34 Search PubMed.
Footnote |
| † Electronic supplementary information (ESI) available. See https://doi.org/10.1039/d2dd00080f |
| This journal is © The Royal Society of Chemistry 2022 |