 Open Access Article
Creative Commons Attribution 3.0 Unported Licence
In situ formation of Ni(CO)4 contaminant during IR analyses using a metal-containing reaction cell
Frederic C.
Meunier
 *
*
Univ Lyon, Université Claude Bernard Lyon, CNRS, IRCELYON, 2 Av. Albert Einstein, 69626 Villeurbanne, France. E-mail: fcm@ircelyon.univ-lyon1.fr
First published on 7th November 2022
Abstract
The formation of ppm levels of volatile Ni(CO)4 occurred in the presence of 1 kPa CO over a worn commercial cell used for diffuse reflectance FT-IR, but not on a more recent cell. The presence of Ni(CO)4 led to nickel deposition on Au and Cu-based catalysts evidenced by the presence of specific Ni–CO IR bands. In contrast, no Ni–CO IR bands could be observed on plain silica, suggesting that specific sites are required to decompose Ni(CO)4. The unambiguous evolution of the carbonyl signal on Au/SiO2 could be used as a test to assess the presence of ppm levels of Ni(CO)4 in in situ and operando IR cells.
Nickel tetracarbonyl was discovered by Mond et al. in 1890 (ref. 1) and is at the core of the Mond process used for nickel refining.2 The nickel ore is first reduced with hydrogen and then exposed to carbon monoxide at temperatures around 50 °C to produce the highly volatile Ni(CO)4 (eqn (1) and (2)). The latter step allows separating Ni from the other elements present in the ore. The maximum rate of formation of Ni(CO)4 is actually around 130 °C and favored by higher CO pressures.3 The collected Ni(CO)4 is then heated up at temperatures between 200–250 °C, where it decomposes into CO and Ni0 (eqn (3)).
| NiO + H2 → Ni + H2O, T > 300 °C | (1) |
| Ni + CO → Ni(CO)4, 20 °C < T < 180 °C | (2) |
| Ni(CO)4 → Ni + 4CO, T > 200 °C | (3) |
The Mond process is yet only used when high purity nickel is sought, because of the acute toxicity4,5 of this compound. In spite of its toxicity, Ni(CO)4 is routinely used in laboratories to prepare organometallic complexes6 and thin films.7
The description of the Mond process emphasizes that Ni(CO)4 may form whenever Ni-based catalysts are reduced and exposed to CO at temperatures below 200 °C. In fact, Hadjiivanov and co-workers8 showed that Ni(CO)4 formed already at −188 °C when SiO2-supported Ni nanoparticles (about 4 nm in diameter) were exposed to 0.2 kPa of CO. This compound remained physisorbed up to −40 °C, displaying an IR band at 2048 cm−1 (Table 1). Gaseous Ni(CO)4 (2058 cm−1) was released when the temperature was further increased.
| Species | Wavenumber (cm−1) | Ref. |
|---|---|---|
| Gaseous Ni(CO)4 | 2058 | 8 |
| Physisorbed Ni(CO)4 | 2048 | 8 |
| Ni2–CO (bridged CO) | 1950–1900 | 8–11 |
| Ni–(CO)2 or 3 (subcarbonyl) | 2080–2050 | 8, 11, 14 |
| Ni–CO on Ni nanoparticles or Ni–Cu alloys, from high to low coverages | 2050–1995 | 9, 11, 14 |
| Au–CO on Au metallic nanoparticles | 2120–2100 | 25, 26 |
| Cu–CO on Cu metallic nanoparticles | 2110–2080 | 27 |
The corrosion rate of Ni nanoparticles typically increases with lower coordinations of the Ni atoms8 and high CO surface coverages,12,13 as Ni has to be coordinated by four CO molecules to form Ni(CO)4. Adsorbed carbon, formed through CO dissociation or disproportionation catalyzed by Ni, limits this rate and has hindered the understanding of the processes taking place at Ni surfaces.13
It is reasonable to propose that in most (if not all cases) the adsorption of CO on Ni nanoparticles around room temperature will inevitably result in the formation of some gaseous or adsorbed Ni(CO)4. In view of the discussion above, the use of CO as reactant or molecular probe on metallic Ni nanoparticles should be restricted to temperatures above 200 °C to prevent the corrosion of the metal and dissemination of Ni compounds in reactor lines and exhaust gases.
Yet, Pereira and Martin11 exposed a Ni/SiO2 catalysts to 1 kPa of CO at 25 °C, reporting various adsorbed species observed by IR, such as subcarbonyls Ni–(CO)2 or 3 at 2082 cm−1, linear Ni–CO at 2040 cm−1 and bridged Ni2–CO at 1920 cm−1, but not Ni(CO)4.
Mirodatos and co-workers14 exposed a Ni/SiO2 to 1 kPa of CO at room temperature and observed all the carbonyl species aforementioned, including adsorbed Ni(CO)4 with a band at around 2045 cm−1. Ni tetracarbonyl and subcarbonyls were proposed to be instrumental in the sintering of Ni nanoparticles, by facilitating the transport of Ni atoms from small to larger particles (Ostwald ripening).14,15
Derrouiche and Bianchi16 adsorbed 1 or 2 kPa of CO between room temperature and 340 °C on Ni/Al2O3 catalysts. These authors reported important modifications (restructuring) of the Ni surface, but did not mention the possible corrosion by Ni(CO)4, while Ni subcarbonyls were present. The disproportionation of CO leading to carbon deposition was also observed. The heat of adsorption at zero coverage of linear and bridged CO were found to be both around 150 kJ mol−1, stressing that CO adsorption is very strong on metallic Ni. Adsorption isobars indicated essentially full CO coverage up to 300 °C.
IR spectra collected on Ni nanoparticles at 300 °C under CO/He (ref. 16) or CO/H2 (ref. 10 and 16) (methanation conditions) exhibited a strong band of linear CO at ca. 2050 cm−1. The presence of adsorbed or gaseous Ni(CO)4 at these temperatures can be safely excluded. This observation stress the difficulty in discriminating bands in the 2060–2040 cm−1 region at low temperatures, as those could be assigned both to Ni(CO)4 (gaseous or adsorbed) and linearly adsorbed Ni–CO (Table 1).
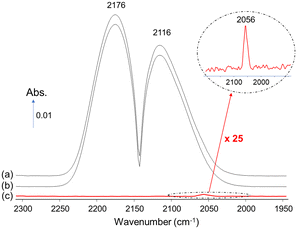
Another insidious aspect of Ni(CO)4 is that it can arise from the experimental setup and contaminate initially Ni-free samples. We commented17 on a study by Zheng et al.18 dealing with the reactivity of CO over Ni-free mixed oxides of CeO2 and ZrO2. We concluded that that their feed had been contaminated with Ni(CO)4, as evidenced by the presence of a band near 2055 cm−1 (Fig. 1) (note: the typical precision on wavenumbers is ±2 cm−1). This contaminant eventually led to the deposition of Ni nanoparticles over ceria, explaining the broader bands centered at 2007 cm−1, that should be assigned to CO adsorbed on metallic Ni nanoparticles and not to any CO adsorbed on ceria as had been proposed by Zheng et al.18
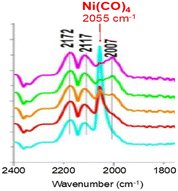 | ||
| Fig. 1 In situ DRIFTS spectra recorded over ceria under 1 kPa CO (bands at 2172 and 2117 cm−1) showing the presence of Ni(CO)4 (band at 2055 cm−1) (adapted from ref. 17 with permission, © 2019 Elsevier B.V.). | ||
The concentration of Ni(CO)4 appeared to be quite high in view of the relative intensities of the CO(g) signal (CO pressure = 1 kPa) and that of Ni(CO)4. Assuming that the molar extinction coefficient of the CO(g) band and that of each carbonyl ligand in Ni(CO)4 are identical, the approximate concentration of Ni(CO)4 was about 0.3 kPa.
Ni(CO)4 can also be formed in situ, for instance inside a spectroscopic cell whose steel had been corroded by NOx, as we reported earlier in a paper retractation.19 The formation of Ni(CO)4 was actually only observed if the cell had been brought above 300 °C under H2, so that the oxidized nickel present could be reduced to the metallic state, and then exposed to CO at low temperature, to favor multiple CO adsorption on Ni0 and Ni(CO)4 formation. The presence of O2 also prevented the contamination, likely due to the passivation of metallic nickel through oxidation. The corrosion of Ni0 by CO can occur at temperatures as low as −188 °C as aforementioned8 and is likely to be a problem more common than thought, as suggested in a recent paper.20
The present contribution aims at describing explicitly the main observations reported on a 1 wt% Au/SiO2 discussed in our earlier retractation note, as well as providing additional data collected on 6 wt% Cu/ZrO2. It will be shown that Ni(CO)4 will be observed only in the case of the corroded cell, leading to modifications of the DRIFTS spectra collected over both supported metals. It will also be noted that a support like silica does not lead to the formation of visible Ni carbonyl adsorbate bands, while exposed to Ni(CO)4.
The preparation method and detailed characterization of the 1 wt% Au/SiO2 (ref. 21) and 6 wt% Cu/ZrO2 (ref. 22) were detailed in the earlier references. In brief, the silica support was a commercial (Zeosil, surface area of 175 m2 g−1), which was first functionalized by grafting APTMS (3-amino-propyltrimethoxysilane) according to a method reported elsewhere.23 Monoclinic ZrO2 (surface area of 131 m2 g−1) was obtained from MEL Chemicals. The metals were added using wet impregnation of Cu(NO3)2 and HAuCl4·3H2O. High purity He (99.999%), H2 (99.999%) and 5% CO/He were supplied by Air Liquide. The gas stream was further purified by using a cold trap set at liquid nitrogen temperature.
The Diffuse Reflectance FT-IR (DRIFTS) Praying Mantis assembly from Harrick was used and placed in a Bruker TENSOR 27 spectrometer fitted with a DTGS detector. DRIFTS spectra were recorded at 50 °C, following reduction in 50% H2/He of the samples for 30 min at 300 and 350 °C for the Au/SiO2 and Cu/ZrO2, respectively. The DRIFTS background was recorded at 50 °C under He after sample reduction, just before introducing CO. The DRIFTS cell effluent was analyzed by transmission IR using a 10 cm-pathlength gas cell (from Harrick) kept at 65 °C, located in a Bruker TENSOR 27 spectrometer fitted with a DTGS detector.
Fig. 2 shows a picture of the DRIFTS cells used, which were both bought from Harrick and made of 316 stainless-steel (Praying Mantis™ High Temperature Reaction Chamber).24 The older cell (Fig. 2A) had been used earlier with NO–O2 mixtures and presented clear signs of wearing, in contrast to the newer cell (Fig. 2B).
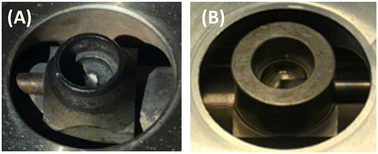 | ||
| Fig. 2 Pictures of the crucibles of the Harrick high temperature reaction chambers: (A) older cell previously used with NOx and (B) newer cell. | ||
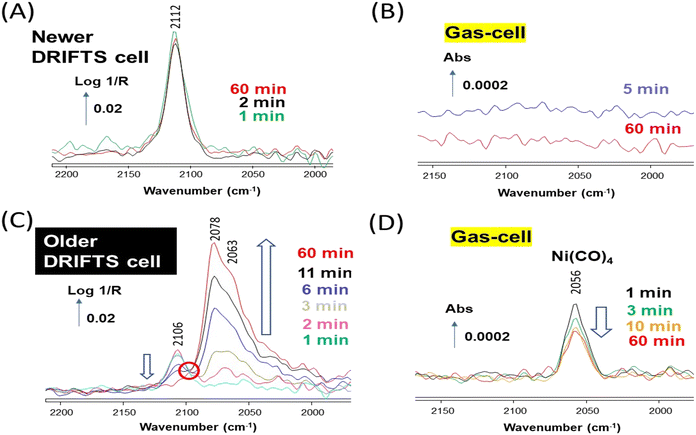
The Au/SiO2 sample was first investigated using the newer DRIFTS cell. The sample was reduced in situ at 300 °C and then exposed to 1% CO/He at 50 °C. A single band at 2112 cm−1 was observed, which was stable over 60 min (Fig. 3A). This band is assigned to CO adsorbed on low coordination sites (e.g., edges and corners) of Au nanoparticles.25,26 The newer DRIFTS cell effluent, which was monitored using a transmission gas-cell directly located after the DRIFTS cell, showed no other bands than those of gas-phase CO (Fig. 3B, the contribution of CO(g) was subtracted).
The Au/SiO2 sample was then investigated using the older DRIFTS cell, applying the same experimental procedure. A band at 2106 cm−1 was initially observed, also assigned to CO adsorbed on Au low coordination sites (Fig. 3C). In contrast to the case of the newer cell, the IR signal rapidly evolved. The intensity of the Au–CO band gradually disappeared, while large bands around 2078–2063 cm−1 were formed. The two processes appeared correlated as an isosbestic point around 2100 cm−1 was observed (circled in red in Fig. 3C). The older DRIFTS cell effluent showed a clear band at 2056 cm−1 over the whole duration of the experiment, which can be assigned to the gaseous compound Ni(CO)4 (ref. 8) (Fig. 3D, the contribution of CO(g) was subtracted).
This set of experiment confirms our earlier retractation paper19 and the work by Yao et al.20 that the evolution of the Au–CO signal from a band at 2110 cm−1 towards one at ca. 2070 cm−1 was related to the presence of traces of Ni(CO)4. Note that in neither contributions had the actual observation of gaseous Ni(CO)4 bands been reported. The bands around 2070 cm−1 are due to nickel carbonyl species, likely subcarbonyls Ni(CO)2 or 3 (Table 1), present at the surface of the Au–Ni alloy formed. The total disappearance of the Au–CO signal at 2106 cm−1 indicated that Ni eventually occupied the corresponding sites, i.e., edges and corners of the alloy nanoparticles.
Our data also show that the Ni(CO)4 was formed in situ on the older cell walls, as our 1% CO/He feed was free of any Ni(CO)4 as demonstrated by the absence of bands below 2100 cm−1 in the case of the experiments carried out with the newer DRIFTS cell (Fig. 3A and B).
It is also important to stress that Ni(CO)4 was only observed if a reductive treatment had been performed in the older cell (data not shown). This observation indicates that the Ni present on the cell walls needed to be reduced to the metallic state to be able to form the tetracarbonyl compounds, similarly to the Mond process (eqn (1)–(3)). This also explains why Ni(CO)4 cannot be observed when co-feeding CO and O2, since the latter readily oxidises Ni0.
The difficulty in spotting the gas-phase signal of Ni(CO)4, which overlaps with that of CO, is exemplified in Fig. 4. The spectrum of 1% CO/He stream recorded after passing through the “reduced” older DRIFTS (Fig. 4a) and that obtained by-passing the cell (Fig. 4b) both essentially displayed the typical rovibrational spectrum of CO. The spectrum obtained by subtracting the latter from the former evidences the presence of Ni(CO)4 in the case of the older cell (Fig. 4c). It is clear that the actual concentration of Ni(CO)4 formed was far lower than that of CO. The approximate concentration of Ni(CO)4 was about 4 ppm, assuming that the molar extinction coefficient of the CO(g) band and that of each carbonyl ligand in Ni(CO)4 are identical. Such weak gas-phase signals are hard to spot if not carefully sought. It is thus worth noting the greater sensitivity of the DRIFTS method on Au/SiO2 (Fig. 3C), which appears as a suitable means to evidence the presence of contamination by Ni carbonyls.
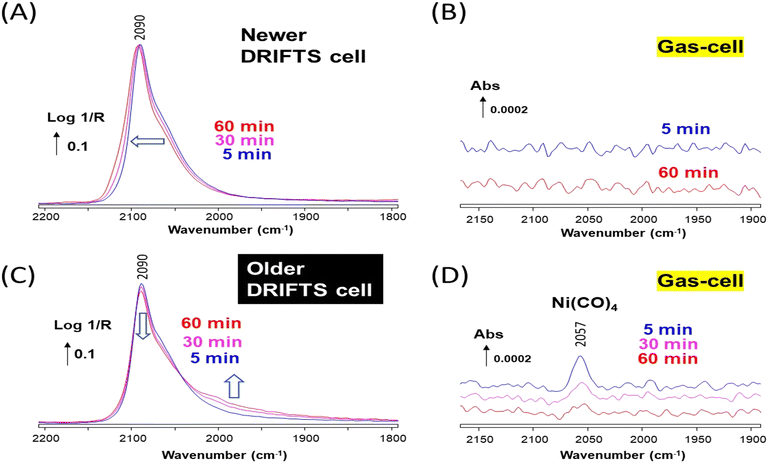
Similar experiments were carried out over a Cu/ZrO2 sample. The sample reduced at 350 °C then exposed to 1% CO/He at 50 °C in the newer cell exhibited a strong band at 2090 cm−1 (Fig. 5A), assigned to CO adsorbed on metallic Cu nanoparticles.27 The asymmetry of the band indicated that various sites and particles sizes were present. The shape of the DRIFTS band gradually evolved over time, which is only assigned to particle reconstruction, since no nickel carbonyl could be observed over the duration of the experiment (Fig. 5B). The global shift towards higher wavenumbers of the band shoulder suggests that the surface was becoming more defective in the presence of CO.27
The same Cu/ZrO2 sample studied in the older DRIFTS cell showed initially an essentially identical band at 2090 cm−1 (Fig. 5C), but this time Ni(CO)4 was observed in the cell effluent (Fig. 5D). The DRIFT also evolved, but in a different manner as compared to the case of the newer cell. The band maximum decreased in intensity and a shoulder grew on the low wavenumber side, below 2050 cm−1.
The evolution of the DRIFTS band following the removal of CO was monitored to better ascertain the differences brought about by the presence of Ni(CO)4 on Cu/ZrO2. A significant difference in the desorption rates of CO from Cu and Ni is expected, since the heat of adsorption is significantly different on these two metals (ca. around 82 kJ mol−1 for Cu–CO (ref. 28) and 150 kJ mol−1 for Ni–CO (ref. 16)). The band intensity rapidly decreased and blue-shifted from 2090 to 2095 cm−1 in the case of the Ni-free newer cell (Fig. 6A). This type of carbonyl band decay is typical of Cu nanoparticles.27 The same behavior of the main Cu–CO band at 2090 cm−1 was observed in the case of the Ni-contaminated older cell, but the Ni-related shoulder was stable and clearly appeared as a band located at 2005 cm−1 (Fig. 6B). Such stable signal at 2005 cm−1 is typical of Ni–CO (linear monocarbonyl), either on pure Ni or Ni–Cu alloys.9,11 These data thus clearly show that some Ni atoms have been deposited at the surface of the Cu/ZrO2 material in the case of using the older DRIFTS cell.
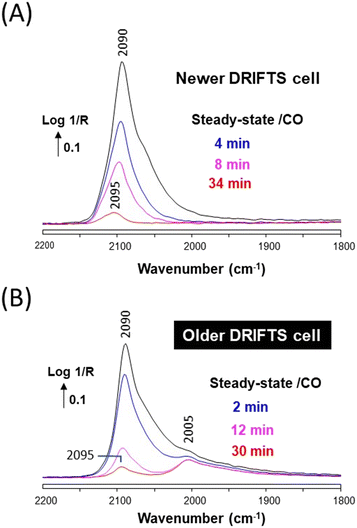 | ||
| Fig. 6 (A) In situ DRIFTS spectra recorded in the newer cell over Cu/ZrO2 under a He stream at 50 °C and various times after removing CO. (B) Same recorded in the older DRIFTS cell. | ||
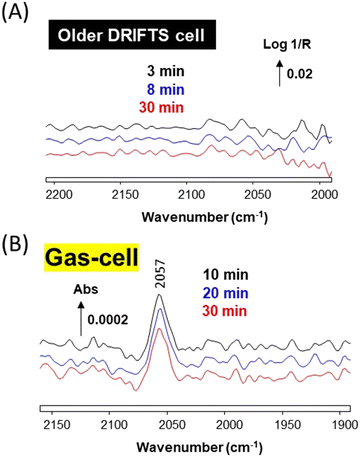
Another experiment was conducted over plain silica, to determine whether or not Ni(CO)4 would decompose on a simple oxide. SiO2 (from the same batch used to prepare the Au/SiO2 catalyst) was reduced in situ at 300 °C and then exposed to CO in both the newer cell (data not shown) and the older cell (Fig. 7). In both cases no Ni carbonyl surface bands could be observed by DRIFTS (Fig. 7A), despite the fact that Ni(CO)4 bands could be observed in the effluent of the older cell (Fig. 7B). This stresses that some specific catalytic sites are required to decompose Ni(CO)4 at 50 °C, such as those found on Au or Cu nanoparticles, while plain silica is unable to carry out this decomposition. Zecchina and co-workers29 have reported that strong Lewis sites of alumina were able to decompose Ni(CO)4 by decarbonylation, albeit slowly at 50 °C.
It must be stressed that iron pentacarbonyl Fe(CO)5 was not observed (this compound is characterized by two strong IR bands at 2024 and 2000 cm−1).30 This observation may be rationalized by the fact that any iron oxide present at the surface of the corroded older cell is harder to reduce that NiO. In fact, Popov et al.31 reported reduction temperatures of 420 °C and 560 °C for NiO and Fe2O3, respectively.
In conclusion, if was shown that a corroded stainless steel DRIFTS cell can lead to the formation of ppm levels of Ni(CO)4. This contaminant will decompose on Au to lead to a clear new set of Ni subcarbonyl bands and to a shoulder of Ni monocarbonyl on Cu (Fig. 8). No decomposition was observed at 50 °C on plain silica, stressing that specific metallic (or Lewis acid29) sites are required to enable decarbonylation under these conditions. We propose that IR monitoring of Au/SiO2 could be used as a test to characterise the presence of trace amounts of Ni(CO)4, because of its high sensitivity and clarity in the interpretation of the corresponding IR spectrum. The Au–CO signal is stable around 2110 cm−1 in the absence of Ni(CO)4, while new Ni–(CO)x bands are formed below 2080 cm−1 in its presence. Such simple discrimination is not possible in the cases of most other metal carbonyls, which all already present bands below 2080 cm−1.
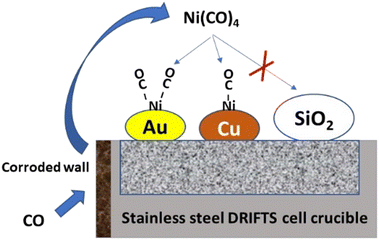 | ||
| Fig. 8 Schematic representation of the contamination from Ni(CO)4 and species formed on various solids. | ||
Author contributions
FCM designed the project and carried out the experiments and analysis and wrote the manuscript.Conflicts of interest
There are no conflicts to declare.Acknowledgements
Anaelle Paredes-Nunez and Taha Elgayyar are acknowledged for the preparation of the Cu/ZrO2 and Au/SiO2, respectively.Notes and references
- L. Mond, C. Langer and F. Quincke, J. Chem. Soc., Trans., 1890, 57, 749–753 RSC.
- https://en.wikipedia.org/wiki/Mond_process .
- K. Lascelles, L. G. Morgan, D. Nicholls and D. Beyersmann, Ullmann's Encyclopedia of Industrial Chemistry, Weinheim: Wiley-VCH, DOI:10.1002/14356007.a17_235.pub2.
- F. W. Sunderman, C. L. Range, F. W. Sunderman Jr., A. J. Donnelly and G. W. Lucyszyn, Am. J. Clin. Pathol., 1961, 36, 477–491 CrossRef CAS PubMed.
- Z. Shi, Sci. Total Environ., 1994, 148, 293–298 CrossRef CAS PubMed.
- M. Keßler, L. Hartmann, H.-G. Stammler, B. Neumann, G.-V. Röschenthaler and B. Hoge, Inorg. Chem., 2022, 61, 10833–10843 CrossRef PubMed.
- M. Smolarek, H. Kierzkowska-Pawlak, R. Kapica, M. Fronczak, M. Sitarz, M. Leśniak and J. Tyczkowski, Catalysts, 2021, 11, 905 CrossRef CAS.
- M. Mihaylov, K. Hadjiivanov and H. Knozinger, Catal. Lett., 2001, 76, 59–63 CrossRef CAS.
- Y. Yao and D. W. Goodman, Phys. Chem. Chem. Phys., 2014, 16, 3823–3829 RSC.
- D. Lorito, H. Li, A. Travert, F. Maugé, F. C. Meunier, Y. Schuurman and C. Mirodatos, Catal. Today, 2018, 299, 172–182 CrossRef CAS.
- E. B. Pereira and G. A. Martin, Appl. Catal., A, 1993, 103, 291–309 CrossRef CAS.
- P. de Groot, M. Coulon and K. Dransfeld, Surf. Sci., 1980, 94, 204–220 CrossRef CAS.
- G. Greiner and D. Menzel, J. Catal., 1982, 77, 382–396 CrossRef CAS.
- M. Agnelli, H. M. Swaan, C. Marquez-Alvarez, G. A. Martin and C. Mirodatos, J. Catal., 1998, 175, 117–128 CrossRef CAS.
- M. Agnelli, M. Kolb and C. Mirodatos, J. Catal., 1994, 148, 9–21 CrossRef CAS.
- S. Derrouiche and D. Bianchi, Appl. Catal., A, 2006, 313, 208–217 CrossRef CAS.
- F. C. Meunier, J. Catal., 2019, 372, 388–388 CrossRef CAS.
- Y. Zheng, K. Li, H. Wang, Y. Wang, D. Tian, Y. Wei, X. Zhu, C. Zeng and Y. Luo, J. Catal., 2016, 344, 365–377 CrossRef CAS.
- R. Atwi, T. Elgayyar, F. C. S. Aires, A. Tuel and F. C. Meunier, Top. Catal., 2021, 64, 1054–1055 CrossRef CAS.
- Y. Yao, L. Chen, X. Mao, Y. Yang, J. Chen and L. Zhou, J. Phys. Chem. C, 2021, 125, 8606–8619 CrossRef CAS.
- R. Atwi, T. Elgayyar, F. J. C. S. Aires, A. Tuel and F. C. Meunier, Top. Catal., 2020, 63, 1596–1605 CrossRef CAS.
- F. C. Meunier, I. Dansette, K. Eng and Y. Schuurman, Catalysts, 2022, 12, 793 CrossRef CAS.
- C.-H. Tu, A.-Q. Wang, M.-Y. Zheng, X.-D. Wang and T. Zhang, Appl. Catal., A, 2006, 297, 40–47 CrossRef CAS.
- https://harricksci.com/content/Data_Sheet_HVC_High_Temp_Praying_Mantis_Reaction_Chamber.pdf .
- Y. Jugnet, F. J. C. S. Aires, C. Deranlot, L. Piccolo and J. C. Bertolini, Surf. Sci., 2002, 521, L639–L644 CrossRef CAS.
- D. C. Meier, V. Bukhtiyarov and D. W. Goodman, J. Phys. Chem. B, 2003, 107, 12668–12671 CrossRef CAS.
- P. Hollins, Surf. Sci. Rep., 1992, 16, 51–94 CrossRef CAS.
- O. Dulaurent, X. Courtois, V. Perrichon and D. Bianchi, J. Phys. Chem. B, 2000, 104, 6001–6011 CrossRef CAS.
- K. M. Rao, G. Spoto and A. Zecchina, Langmuir, 1989, 5, 319–325 CrossRef CAS.
- P. Portius, M. Bühl, M. W. George, F.-W. Grevels and J. J. Turner, Organometallics, 2019, 38, 4288–4297 CrossRef CAS.
- A. G. Popov, A. V. Smirnov, E. E. Knyazeva, V. V. Yuschenko, E. A. Kalistratova, K. V. Klementiev, W. Grünert and I. I. Ivanova, Microporous Mesoporous Mater., 2010, 134, 124–133 CrossRef CAS.
| This journal is © The Royal Society of Chemistry 2022 |

