 Open Access Article
Electrochemical control of the RWGS reaction over Ni nanoparticles deposited on yttria stabilized zirconia†
Dimitrios
Zagoraios
,
Nikoletta
Kokkinou
,
Georgios
Kyriakou
 and
Alexandros
Katsaounis
 *
*
Department of Chemical Engineering, University of Patras, Caratheodory 1 St, 26504, Patras, Greece. E-mail: alex.katsaounis@chemeng.upatras.gr
First published on 3rd February 2022
Abstract
Transition metal oxides are promising candidates for the activation of the reverse water gas shift (RWGS) reaction. The in situ formation and stabilization of these oxides appears to be a key challenge in achieving 100% selectivity towards CO in a CO2 hydrogenation reaction system. In the present study, electrochemistry is utilized to modify the catalyst work function, thus the strength of the bonds of the adsorbed species (EPOC effect) as well as to in situ form and stabilize nickel oxide on an oxygen ion conductor/solid electrolyte. Both actions, electrochemical promotion of catalysis (EPOC) and electrochemical oxidation appear to promote the RWGS activity. The electro-oxidation of nickel is investigated using cyclic voltammetry (CV) measurements, revealing the formation of surface NiOx species at the metal-electrolyte-gas three-phase boundaries (tpb). Application of positive polarization is the driving force for the in situ electro-oxidation of the Ni particles due to oxygen ion (i.e., O2−) migration from the solid electrolyte to the catalyst surface through the tpb. The present results aim to further extend the applicability of the EPOC effect in the modern heterogeneous catalysis industry as a powerful tool for in situ catalyst activation and regeneration.
Introduction
The ever-increasing demand for energy along with the heedless use of carbon-based fuels over the past decades, has led to a rapid increase in the carbon dioxide (CO2) concentration in the atmosphere.1 Consequently, the rising levels of CO2 threaten the sustainability of the natural environment leading to both climate and economic crisis. Recent assessments suggest that the Earth's atmosphere is more sensitive to CO2 emissions than previously thought.2 More specifically, scientists have achieved a narrower range of uncertainty in future climate projections. Essentially, the researchers have narrowed the range of estimates of Earth's climate sensitivity by more than 43%, offering a better sense of exactly how much the Earth will warm as the CO2 levels are rising in the atmosphere. Besides providing new insights and understanding in climate change, that work also underlines that new eco-friendly technologies have to be developed.In line with this, substantial effort is being devoted in reducing greenhouse gas emissions globally, with a great deal of scientific interest focusing specifically on the mitigation of the CO2 levels emitted into the atmosphere.3 CO2 recycling is often suggested as an efficient and sustainable way to convert this pollutant into valuable products in an eco-friendly manner. In this respect, the production of useful chemicals and fuels via the heterogenous catalytic hydrogenation of atmospheric CO2 with renewable hydrogen (H2) is progressively gaining ground as one of the most effective CO2 mitigation strategies.4–8
The majority of the work reported in the literature for the hydrogenation of CO2 is carried out under atmospheric pressure resulting in methane (CH4) and carbon monoxide (CO) as the main reaction products. Moreover, notable research efforts have been devoted in the production of alcohols and/or higher hydrocarbons at elevated pressures over a variety of supported catalysts based on transition metals.7,8 Methane forms via the Sabatier reaction (eqn (I)), while CO is produced though the reverse water gas shift (RWGS) reaction (eqn (II)).
 | (I) |
 | (II) |
Among the variety of catalysts used for CO2 hydrogenation, transition metal oxides are found to promote the RWGS reaction over the methanation reaction via a catalyst redox process, resulting in extra oxygen vacancies.14–16 A recent literature review highlights the effectiveness of oxide catalysts toward the RWGS reaction in terms of their oxygen storage capacity.17 Transition metals can reversibly store and release oxygen, an ability that is associated with the variation of their oxidation state under reaction conditions. Similarly to Fe and Co, Ni is a cheap non-noble transition metal that can form active oxides promoting the RWGS reaction.18 According to the literature, depending on the valence state of Ni the selectivity of the CO2 hydrogenation reaction can be tuned. This behavior is attributed to the binding strength of the CO produced on the catalytic active sites which can be further correlated to the work function variation among the different Ni oxides.19,20 Specifically, the activation energy for further hydrogenation of CO to methane increases as a function of the oxidation state of Ni, with Ni oxides leading to higher selectivity compared to metallic nickel. Hence, adjusting the Ni oxidation state under reaction conditions is one of the major challenges for achieving high selectivity for the RWGS reaction at low temperatures.
A promising method to obtain high RWGS activity is through the use of the electrochemical promotion of catalysis (EPOC) effect and the in situ electro-oxidation of non-noble transition metals.21 More specifically, the EPOC effect, also known as non-faradaic electrochemical modification of catalytic activity (NEMCA) is a highly utilized tool in heterogeneous catalysis over the past 40 years.22–27 This effect is commonly studied with a simple and straightforward experimental set up involving three metal electrodes deposited onto a solid electrolyte/ion conductor as shown in Fig. S1.† Application of an electrical potential between the working (WE) and counter (CE) electrodes results to a migration (backspillover) of ionic species originating from the solid electrolyte onto the catalyst surface. Consequently, this leads to an ionic current flowing across the WE and CE, which is equal to the electrical current flowing through the external circuit (Fig. S1†). In the case that promoters (i.e., ions) are generated in situ by anodic (i.e., positive) polarization of the interface, an “effective” double layer that extends across the catalyst surface is formed. The presence of this double layer leads to a uniform electric field on the catalytic metal particles, which strongly influences the chemical adsorption properties of molecules on the WE.28 Of primary importance in understanding the EPOC effect, is the modification of the work function of the WE, which is a result of the rearrangement of electron density of the metal energy states. When the work function of the WE is altered, the Fermi level of the catalyst is also changed, which strongly influences the chemisorption bond strength between the reactant molecules and the catalytically active sites. The latter manifests a remarkable enhancement or suppression of the reaction catalytic rate which is often accompanied with a drastic change in the product selectivity.29,30
According to the up-to-date literature, the EPOC effect is not limited to a specific solid electrolyte, catalytic system, or reaction type.23 Electrochemical promotion studies were recently carried out over thin films of nano-sized metal particles supported on a p-type semiconductor.31,32 The results are more than encouraging, opening a new era for the utilization of this effect in industry, especially for catalytic reactions involving nanodispersed catalysts. Of equal importance have been recent studies utilizing non-noble transition metal catalysts deposited onto solid electrolytes with oxygen ion conductors.21,33
In view of the fact that both activity and selectivity of the RWGS reaction are enhanced over transition metal oxides, an intriguing strategy would be the development of a process that would in situ (i.e., under reaction conditions) form and regenerate such oxides on the catalytic surface. In this study the RWGS reaction was studied over Ni nanoparticles (Ni NPs) deposited on an oxygen-ion/solid electrolyte (YSZ). Cyclic voltammetry (CV) was utilized as a powerful tool to investigate and confirm the electro-oxidation of Ni upon positive polarization. This is one of the few EPOC studies where CV is used to explore this phenomenon. Our results demonstrate that oxygen ions can electro-oxidize the Ni particles leading to an increase of the RWGS catalytic reaction rate up to 40%, due to the in situ formation of NiOx species. The rate enhancement is strongly affected by the partial pressure of H2 in the gas mixture, posing a rapid reduction of the active Ni oxides after electrical potential interruption. Our results suggest that this particular response is related to the structure of the formed catalyst film leading to an increased three-phase boundaries (tpb) length, favoring a faster diffusion of the promoting ions onto the surface and the pronounced electro-oxidation of Ni, respectively.
Experimental
Preparation of the samples
A schematic of the three-electrode electrochemical cell used in this study is depicted in Fig. S2.† A pellet of 8 mol% Y2O3-stabilized ZrO2 (YSZ), provided by Ceraflex, was used as an oxygen-ion conductor. The diameter and thickness of the YSZ pellet were 17 and 1.5 mm, respectively. The reference (RE) and counter (CE) electrodes were initially deposited on one side of the solid electrolyte (e.g., YSZ) by brush painting of an inert gold (Au) organometallic paste (Metalor, A1118), following a calcination in air at 700 °C for 1 h (with an intermediate step at 450 °C for 30 min). The working electrode (WE) consisted of free-standing (i.e., unsupported) Ni nanoparticles (Ni NPs) prepared by the polyol method, as already described in a previous study.21 The appropriate amounts of the metal precursor (nickel(II) nitrate hexahydrate) were mixed with ethylene glycol, which acted as both the solvent and the reducing agent, and a base (tetraethylammonium hydroxide) and were refluxed for 1 h at 165 °C, resulting in a colloidal solution (Cfinal = 0.002 grNi mL−1). The WE film (1 cm2) was formed by dropwise deposition of the Ni NPs (opposite to the counter electrode) by a micropipette from the colloidal solution with intermediate drying at 100 °C. The final Ni loading was 0.5 mg. Prior to any experiment each sample was pretreated in 10% O2/He at 350 °C for 1 h, followed by a reduction process in 15% H2/He at the same temperature for 3 h. Blank experiments using Au as the working electrode instead of Ni NPs (i.e. Au/YSZ/Au), were carried out to study the catalytic contribution of the Au electrodes and the electrocatalytic production of CO under positive or negative polarization. In all cases the Au electrodes were deposited as described above and the loading was approximately 0.5 mg cm−2.Electrochemical reactor
The electrocatalytic experiments were carried out at ambient pressure in a continuous flow single chamber reactor.24,25 The quartz reaction chamber was placed directly into a high temperature furnace equipped with a temperature controller. Each sample was fixed between ceramic holders at the center of the reactor, where inert gold wires were attached to each of the three electrodes for the external electrical connection to a potentiostat/galvanostat (AMEL 2053), as well as a K-type thermocouple was adjusted near to the WE. The overall gas flow rate was controlled by electronic mass flow controllers (Brooks Instrument mass flow controllers, model: B5878) using certified standards of 5% CO2 in He and 15% H2 in He. Ultrapure (99.999%) He was fed as the carrier gas to further adjust the inlet gas composition at the desired values. An online infrared gas analyzer (Futzi Electric ZRE) was used to directly quantify the concentration of CO, CH4, and CO2 in the reactor effluent. Cyclic voltammetry measurements were performed using an electrochemical interface (AMEL 7800) electrically connected with a potentiostat/galvanostat (AMEL 2053). Unless otherwise noted, reaction rates were normalized per gram of Ni. The experiments were repeated three times with the exception of the transient experiments (repeated twice) with a deviation of less than 5%.Physicochemical measurements
The prepared fresh colloidal solution, where the free-standing Ni NPs were dispersed, was initially characterized by transmission electron microscopy (TEM). For that purpose, a portion of the colloidal solution was suspended in ethanol followed by sonication for several minutes. Then, one drop of this dilute suspension was placed onto a carbon-coated copper grid and characterized by JEOL JEM2100 operating at 200 kV. Scanning electron microscopy (SEM) images of the used Ni NPs/YSZ sample were obtained using a JEOL 6300 microscope, equipped with an Oxford energy-dispersive spectrometer (EDS) for the elemental analysis. The images were taken under a magnification of 300![[thin space (1/6-em)]](https://www.rsc.org/images/entities/char_2009.gif) 000 times with a distinctive limit of 3.5 nm (W.D. = 8 mm, 30 kV per SEI).
000 times with a distinctive limit of 3.5 nm (W.D. = 8 mm, 30 kV per SEI).
Results and discussion
Pre- and post-physicochemical characterization
Fig. 1a displays a characteristic TEM image of the as-prepared free-standing Ni NPs. Although some Ni particles have an irregular shape, most of them can be considered as spheres. Fig. 1b shows the particle size distribution histogram determined after the analysis of several TEM images. The average particle size (i.e., diameter) was found to be 28 nm ± 11 nm, whereas smaller nanoparticles (i.e., 1–5 nm) are distinguished being part of bigger nanoparticles (up to 50 nm).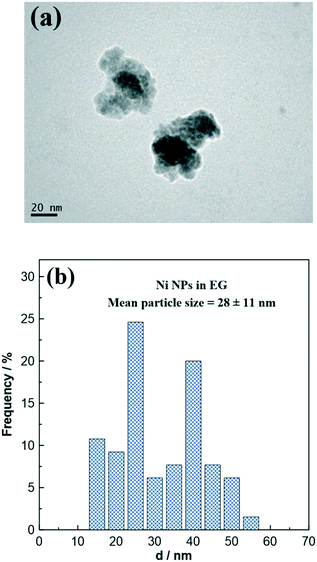 | ||
| Fig. 1 (a) TEM image of as-prepared free-standing Ni NPs and (b) the particle size distribution histogram. | ||
The distribution pattern (Fig. 1b) can be divided into two regions: (a) the region of the smaller particles (with a diameter ranging from 15 to 35 nm) and (b) the region of the larger particles (with a diameter ranging from 35 to 55 nm). It is worth noting that almost 60% of Ni particles belong to the first region. A possible explanation for this behavior is that Ni nanoparticles can exhibit magnetic properties, which increases their tendency to agglomerate over time in the colloidal solution.34
The use of free-standing NPs as working electrode in EPOC studies has been already reported in the literature.21,33,35–37 In contrast to the traditionally used organometallic pastes, the main advantage of free-standing NPs includes the uniform metal dispersion on the solid electrolyte as well as thin and highly porous catalytic films.26 In this regard, the used sample was characterized through scanning electron microscopy (SEM). Fig. 2 presents an on-top SEM image and the corresponding EDS-SEM mapping image of the working electrode surface after reaction. Interestingly, the mapping image (Fig. 2b) displays well-shaped Ni islands onto the YSZ surface, exhibiting sufficient film porosity and ample tpb length, as compared to the classical paste-coated electrodes, where electrochemical reactions can take place.24 These results are utilized below for the interpretation of the CV experiments and the concomitant electro-oxidation of Ni particles at the tpb.
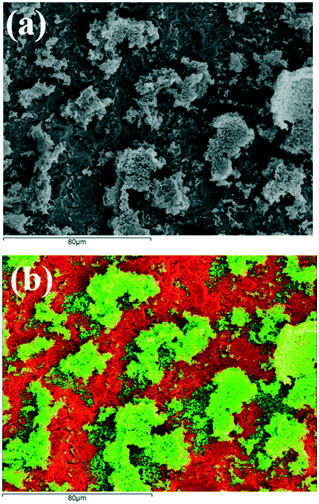 | ||
| Fig. 2 (a) On-top SEM image and (b) the corresponding EDS-SEM mapping image of used Ni NPs/YSZ sample (Ni: green color, Zr: red color). | ||
Electrochemical promotion experiments
Electrocatalytic experiments and reaction kinetic studies were carried out under both oxidizing and reducing reaction conditions in the temperature range of 360–420 °C. Under these experimental conditions, only CO production was observed, suggesting that the RWGS is the dominant reaction taking place during CO2 hydrogenation, in agreement with previous EPOC studies over non-noble transition metals.21,33 The reaction kinetics data in Fig. 3 demonstrate that the RWGS reaction is positive order with respect to both CO2 (electron acceptor) and H2 (electron donor) reactant partial pressures (PCO2, PH2). Therefore, according to the chemical and electrochemical promotional rules,38 the reaction is expected to exhibit an inverted volcano-type behavior under closed circuit conditions. Thus, the catalytic rate of CO production should be enhanced both under positive and negative applied potential. From a mechanistic point of view, both reactants (i.e., CO2 and H2) are strongly adsorbed on the surface of the WE, and thus any change of the coverage will affect the catalytic rate.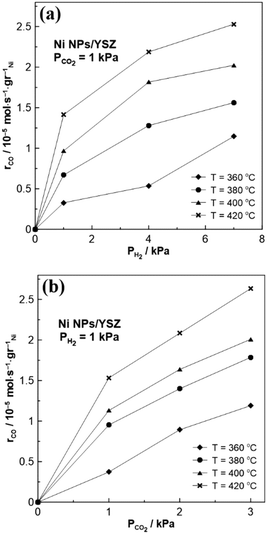 | ||
| Fig. 3 Effect of (a) PH2 and (b) PCO2 on the catalytic rate of the RWGS reaction on the Ni NPs/YSZ sample. | ||
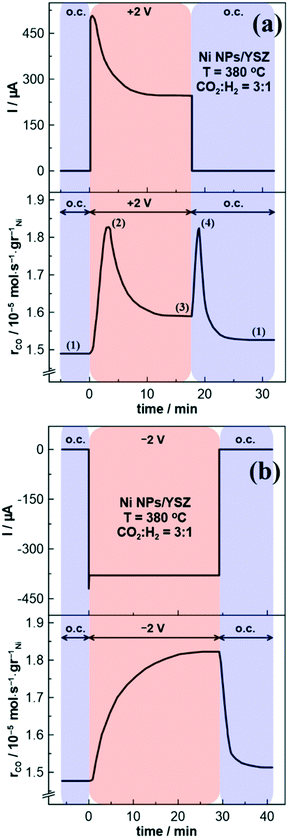
Typical potentiostatic transient experiments of the Ni NPs/YSZ sample are presented in Fig. 4. Indeed, under both positive (Fig. 4a) and negative (Fig. 4b) polarization the catalytic rate of the CO formation per metal (Ni) gr (i.e., rCO) is enhanced, with the expected inverted volcano type behavior being observed. Interestingly, in the case of positive potential application the rCO undergoes a first maximum (marked with number (2) in Fig. 4a) that decays over time, which is then followed by a second spike and finally stabilizes in a new steady state value (after t ∼ 18 min), which is higher than the one observed under open circuit (o.c.) conditions. A similar trend is also seen on the effect of the electrical current versus time (Fig. 4a, top), reaching a plateau at around 250 μA. Of particular interest is also the second-rate peak which appears after the potential interruption and results into a new sharp increase of the rCO (denoted with the number (4) in Fig. 4a). Although the catalytic rate rapidly increases up to a new maximum, the current instantly decreases to zero. As shown in Fig. 5, this notable deviation from the classical EPOC transient behavior (i.e., where the catalytic rate changes gradually and monotonically to a new steady state value upon application or interruption of a potential) does not seem to be limited to any reaction parameters (i.e., temperature, CO2/H2 ratio or polarization time). Nevertheless, the transient response of the rCO under negative polarization (Fig. 4b) is consistent with the standard EPOC behavior.
 | ||
Fig. 5 Potentiostatic transient experiments under various reaction temperatures (360, 380 and 400 °C) and CO2/H2 ratios, (a) 2![[thin space (1/6-em)]](https://www.rsc.org/images/entities/char_2009.gif) : :![[thin space (1/6-em)]](https://www.rsc.org/images/entities/char_2009.gif) 1, (b) 1 1, (b) 1![[thin space (1/6-em)]](https://www.rsc.org/images/entities/char_2009.gif) : :![[thin space (1/6-em)]](https://www.rsc.org/images/entities/char_2009.gif) 4 and (c) 1 4 and (c) 1![[thin space (1/6-em)]](https://www.rsc.org/images/entities/char_2009.gif) : :![[thin space (1/6-em)]](https://www.rsc.org/images/entities/char_2009.gif) 7. 7. | ||
A general conclusion drawn from Fig. 5 is that the second rate peak tends to decrease by increasing both the operating temperature and the partial pressure of H2.
Moreover, higher electropromoted catalytic rate values are observed at elevated reaction temperatures due to the higher ionic conductivity of YSZ. Interestingly, this notable transient response of Ni has been also reported for other free-standing transition metals with multiple oxidation states such as Co and Fe.21,33
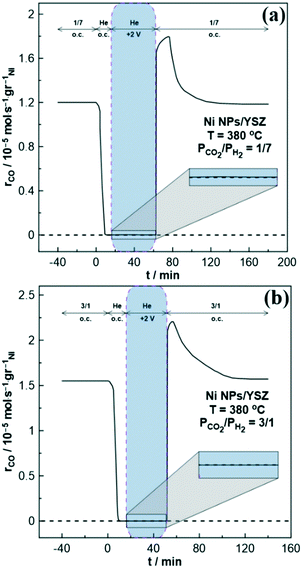
For instance, in the case of the Fe NPs/YSZ system, Panaritis et al.33 attributed the first- and second-rate peaks to the electro-oxidation of an inactive iron carbide (i.e., FeCx) and the subsequent change of the Fe valence state, respectively. Besides, in one of our previous studies,21 we suggested that upon anodic polarization the migrating O2− (from YSZ) can cause an electrochemical oxidation of Co at the tpb, affecting the ratio of the formed metal oxides, and thus the activity and selectivity of the RWGS reaction. Therefore, it is intriguing to examine if and how the above reported mechanisms match with the present results on the Ni electrode. Fig. 4a has been color-coded to separately analyze each different rate response. Firstly, we are focusing on the first-rate peak (marked with the number (2) in Fig. 4a). To investigate a possible formation of Ni carbide (i.e., NiCx), potentiostatic transient experiments were performed under inert (He) atmosphere (Fig. 6).
For that purpose, the catalyst surface was initially exposed to either reducing (Fig. 6a) or oxidizing (Fig. 6b) reaction conditions for several minutes, then the gas mixture was switched to He, while after a couple of minutes a positive potential of +2 V was applied. Finally, the reactor was fed with reactant gas mixture at open circuit conditions, resulting in CO production. These experiments aimed to clarify the presence or absence of NiCx that could be formed during the reaction and it can be electro-oxidized by means of O2− migrating from the electrolyte to the WE during potentiostatic transient experiments resulting in CO production. Regardless of the reaction conditions, no CO (Fig. 6) or CO2 (not shown here) formation was observed and therefore the proposed mechanism of Panaritis et al.33 cannot describe the first-rate peak of the Ni/YSZ sample. This result is also consistent with the literature, where the formation of nickel carbide requires particularly high pressure and/or temperature.39
Hence, the first maximum in the CO catalytic rate (Fig. 4a and 5) is most likely associated with an increase in the valence state of Ni (as in the case of Co (ref. 21)), which increases the selectivity of the reaction towards CO.19 Indeed, in the case of carbonyl metals (such as Ni) the produced CO molecule from the RWGS reaction is linked through a carbon (i.e., “linear CO”) to NiO (i.e., Ni2+ ions), rather than through two adjacent surface atoms (i.e., “bridged CO”).40 Therefore, CO in “linear form” is reversibly chemisorbed, resulting in a weaker bond with the surface,40 and thus an easier desorption to the gas-phase (i.e., higher activity toward the RWGS reaction). Although the observed increase of the CO production rate (under anodic polarization) could be also ascribed to the electro-oxidation of CO2 on the Au electrode, blank experiments with Au/YSZ/Au sample showed that the catalytic contribution of the Au electrodes is relatively small while the rate increase under positive or negative polarization is negligible (Fig. S3†). In addition, the presence of the second peak upon potential interruption strongly suggests that the dominant process should be the thermocatalytic one which is accompanied with change of the catalyst oxidation state. Note that if the electrocatalytic production of CO was mainly responsible for the rate increase, then potential interruption would cause the monotonous decrease of the CO production rate (without the presence of a peak).
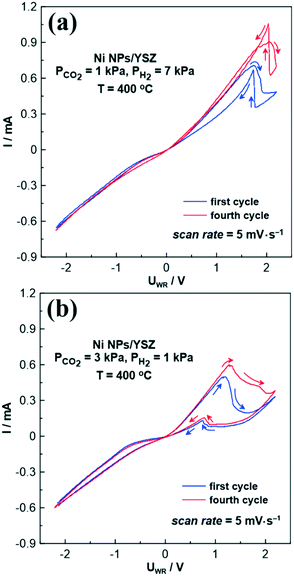
In order to corroborate the above mechanism, where nickel oxide is formed during anodic polarization, cyclic voltammetry experiments were performed. Fig. 7 presents the corresponding cyclic voltammograms (CVs) for Ni NPs on YSZ under both reducing (Fig. 7a) and oxidizing (Fig. 7b) reaction conditions at 400 °C and a scan rate of 5 mV s−1. Although up to 7 cycles were recorded, Fig. 7 displays only the first and the fourth cycle, since after the fourth cycle stable CV curves were always obtained. For clarity the direction of each CV is indicated with arrows and it is further separated into the anodic (from −2.2 V to +2.2 V) and cathodic (from +2.2 V to −2.2 V) scan.
Regardless of the reaction conditions (oxidizing or reducing), the obtained cyclic voltammograms (Fig. 7) consist of two oxidation peaks: one in the anodic (i.e., forward) and one in the cathodic (i.e., backward) scan. Focusing on the reducing conditions (Fig. 7a), a broad oxidation peak is observed at around +1.7 V at the anodic scan, which is related to the electro-oxidation of Ni at the tpb (eqn (III)).41 This results in the formation of surface Ni oxide, which is considered to be highly active towards the RWGS reaction.16,19,42 Further increase of the applied potential (from +1.7 V to +2.2 V) in the forward (i.e., anodic) scan leads to a small increase in the observed current due to the oxygen evolution reaction.
| Ni + O2−(YSZ) → NiO + 2e− | (III) |
According to the literature, an increase of the current in the cathodic branch of a cyclic voltammogram is an unusual behavior.43 This phenomenon could be either ascribed to a change in electrode phase or to the oxidation of intermediate carbon species. The latter is often observed in the electro-oxidation of alcohols,44–46 where the oxidation intermediates (during the anodic scan) are further oxidized to CO2, leading to new oxidation peaks in the cathodic branch of the cyclic voltammogram. However, this mechanism could not describe our system, as the only reactant that can be oxidized is H2, forming H2O. Therefore, this unexpected peak in the cathodic scan is most likely related to a structural change of the working electrode's surface,43 and more specifically to an H2-aided thermal decomposition/reduction of the Ni oxides. Note that despite the fact that we refer to the cathodic branch of the CV, the current increases due to the increase of the electrical conductivity of the working electrode (i.e., NiOx → Ni0). Therefore, during the anodic scan, NiO is electrochemically formed at the tpb (by O2− ions supply), while in the cathodic scan NiO is thermally decomposed to metallic Ni due to the reducing power of gaseous H2. Consequently, the first peak is affiliated in an electrocatalytic process that takes place at the tpb, whereas the second peak is affiliated in a thermocatalytic process that takes place at the metal/gas interface  . The above behavior is known in the literature as oxide instability,47–49 with the characteristic feature of a sharp increase in the observed current during the backward scan. In agreement with our findings on the redox behavior of the Ni/YSZ system, the literature also suggests that positive electrical currents can lead to the formation of NiO at the Ni/YSZ interface, resulting in an oxidation peak in the CV, which is then reduced in the backward scan direction leading to a current increase.50
It is worth noting, that in the case of the fourth cycle of the CV (Fig. 7a) the oxidation peak at the cathodic scan overlaps with the oxidation peak at the anodic scan, as greater amounts of Ni can be oxidized during the forward scan and reduced during the backward scan over time. An almost similar behavior is also shown in the case of the oxidizing conditions (Fig. 7b). However the oxidation peak in the cathodic branch of the CVs is lower than that observed under reducing conditions, due to excess CO2 in the gas mixture. This is also attributed to the presence of broader oxidation peaks in the anodic scan, as Ni can be easier electro-oxidized by the migrating O2−, due to the minimization of the reducing effect caused by H2.
In order to confirm that the oxidation peak in the anodic branch of the cyclic voltammograms (Fig. 7) is related to the electro-oxidation of Ni to NiO, cyclic voltammetry experiments were also performed under inert (He) atmosphere (Fig. 8 and S4†). These experiments took place after exposing the electrode for several hours (4–5 hours) to the reaction conditions, and then the reactor was fed with pure He. Indeed, in the absence of reactants (and especially of H2), only one broad oxidation peak is observed, which increases over time (Fig. S4†), indicating the gradual oxidation of the Ni electrode. Interestingly, no oxidation peak (i.e., current increase) in the cathodic branch of the CVs is detected, suggesting that H2 plays a crucial role in the oxide stability. In addition, Fig. 8 and S4† verify once more that no electro-oxidation of C or CO (by O2−) is taking place. As already mentioned, CVs at inert (He) atmosphere were performed after exposing the sample to a reaction mixture, to assess whether carbon deposition occurs during the reaction and NiCx formed on the catalytic surface. The electro-oxidation of these species via O2− supply is described by charge transfer reactions at the tpb, which would result in extra oxidation peaks in the cyclic voltammograms. However, by comparing the CVs in Fig. 8, the CV under He atmosphere depicts only one oxidation peak, which is purely attributed to the electro-oxidation of Ni. Furthermore, the CV curve under pure He atmosphere displays almost 2-times lower current values compared to the corresponding values under reaction conditions (Fig. 8). This behavior is attributed to the lower electrode conductivity and thus the restricted electrochemically O2− supply to the surface, correlated with the absence of H2. Besides, a considerable shift to higher oxidation potential values is observed by increasing the partial pressure of H2 in the gas mixture (Fig. 8), indicating an extra energy demand for the oxidation of Ni to overcome the reducing power of H2.
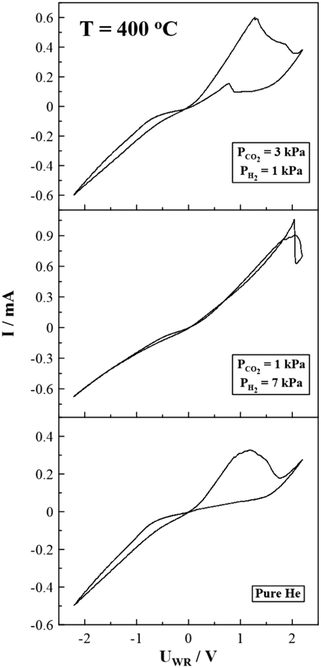 | ||
| Fig. 8 Steady state cyclic voltammograms under oxidizing, reducing and inert (i.e., He) reaction conditions, T = 400 °C, scan rate = 5 mV s−1. | ||
Taking into account, that upon anodic polarization oxygen ions can electro-oxidize Ni particles at the tpb to form NiO, we are now able to interpret the transient behavior of the electrical current in Fig. 4a. As mentioned above the observed current value exhibits a maximum, while it reaches a plateau at around 15 min under positive polarization. This maximum is attributed both to the electrons that are withdrawn from the metal as O2− reaches the surface (i.e., increase in the metal work function), and the electrons that are produced at the tpb through eqn (III). However, since surface NiO is formed, eqn (III) reaches an equilibrium and the working electrode becomes less conductive, thus a decrease in the current value is observed before its stabilization at approximately 250 μA. Therefore, this instability affects the transient response of the CO catalytic rate in Fig. 4a and 5, as we described above in detail.
The CO2/H2 ratio and the operating temperature notably affect both the shape and the position of the two oxidation peaks, as the oxidation and reduction kinetics are significantly changed (Fig. S5 and S6†). In general, at low reaction temperature and/or reducing conditions, the electro-oxidation of Ni is kinetically restricted due to the low ionic conductivity of YSZ and high partial pressure of H2 in the gas mixture, respectively. This results in lower oxidation currents and narrow peaks (Fig. S5 and S6†). The latter confirms the role of H2, that decelerates the oxidation of Ni and destabilizes the formed NiO upon potential termination. Therefore, from the CV experiments it can be concluded that upon anodic polarization an in situ electro-oxidation of the Ni electrode is taking place, resulting to the formation of the active NiO and thus in the first-rate peak in the rate transients (Fig. 4a and 5).
A critical point that needs to be addressed is the reason behind the higher activity of NiO compared to that of Ni0 towards to the RWGS reaction. Based on the literature, NiO has a higher work function than metallic Ni,20 which weakens the binding energy of CO and increases the activation barrier for further CO hydrogenation,19 thus leading to a higher CO selectivity. Greiner et al.20 correlated the work function of a wide range of transition metals oxides with both their cation's oxidation state and electronegativity and concluded that work function tends to decrease with decreasing cation's oxidation state. Thus, in the present study the work function of the catalyst increases both through the positive potential application (via the EPOC effect), and the corresponding formation of Ni oxide at the tpb (via electro-oxidation). Hence, both processes (EPOC effect and electrochemical formation of nickel oxide) should simultaneously change the catalytic rate of CO formation, resulting in a gradual and monotonical rate enhancement to a new steady state. However, according to our results (Fig. 4a and 5), the catalytic rate passes through a maximum (denoted with the number (2) in Fig. 4a) before it stabilizes to a new steady state (higher than the o.c. rate value). There are two possible explanations for this trend. First, upon continuous pumping of oxygen ions onto the surface (i.e., application of a positive potential) Ni is gradually electro-oxidized (in agreement with the reported CV results), forming a quite stable insulating oxide layer hindering the electrical conductivity of the film. Thus, the ionic current flow (i.e., backspillover O2−) is decreased (as in Fig. 4a, top), altering steadily the density of the “effective” double layer (as well the electric filed strength),51 thus suppressing/lowering the EPOC efficiency. A second assumption is the formation of inactive and non-conductive Ni hydroxides. Gabaly et al.50 suggested that application of high (>1 V) anodic potentials in a Ni/YSZ system results in NiOOH formation on the electrode surface. Therefore, prolonged positive polarization of the electrode in combination with the high applied potential values possibly lowers the rCO due to the presence of NiOOH. Nevertheless, the final rate increase (marked with the number (3) in Fig. 4a) is non-faradaic since oxygen ions (i.e., O2−) are not reactants for the RWGS reaction, thus any positive potential-induced catalytic rate change is electrochemical promotion.52
Focusing now on the second-rate peak, it is suggested that a reverse process occurs compared to the one described for the first-rate maximum. Both potential interruption and the following gradual reduction of NiO (and NiOOH) by H2 leads to a decrease in the work function of the catalyst. According to the observed reaction kinetics (Fig. 3), the CO catalytic rate is expected to be enhanced as the reaction exhibits an inverted volcano behavior. Interestingly, the higher the partial pressure of H2 in the reaction mixture, the lower is the observed maximum after the potential removal (Fig. 5). To understand the intensity and the efficiency of this effect, the percentage (%) rate increase parameter is calculated for both rate peaks, as recently described in the literature.21 The effect of the reactants ratio on the observed (%) rate increase is presented in Fig. 9, while the corresponding effect of the operating temperature on this parameter is presented in Fig. S7.† Based on these results it is evident that the partial pressure of H2 in the reaction gas mixture determines the enhancement of the catalytic rate, as well as the extent of the whole phenomenon.
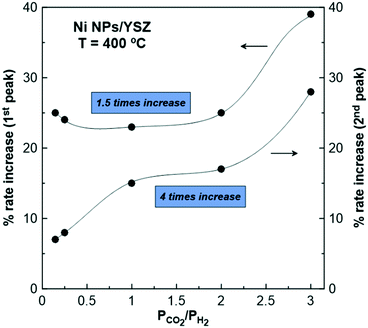 | ||
| Fig. 9 Effect of the reaction mixture ratio (PCO2/PH2) on the % rate increase of the first- and second-rate peaks of CO formation upon positive polarization (+2 V) and T = 400 °C. | ||
Fig. 9 demonstrates that the % rate increase parameter is monotonically increased as the partial pressure of gaseous H2 decreases in the reaction mixture (i.e., under oxidizing conditions). This behavior is attributed to the facile stabilization of Ni oxides, due to their slow and restricted reduction by the excess CO2 in the gas mixture. Comparing the % rate increase of the first- and second-rate peak, the latter is always lower since it is mainly affected by H2.
Furthermore, it is important to analyze the processes that are taking place during the transient experiments. It is clear that in the case of the first-rate peak both the oxygen ion supply (i.e., positive polarization) and the presence of H2 control the efficiency of the catalytic rate maximum. On the other hand, the second-rate peak is affected mainly by the partial pressure of H2, as it appears right after the potential interruption (i.e., when the electrochemically induced migration of O2− is terminated). Therefore, it is expected that the first-rate peak is higher than the second one since the addition of ionic promoters enhance (via the EPOC effect) the catalytic activity of the RWGS reaction (i.e., inverted volcano behavior). Meanwhile, potential interruption (i.e., termination of oxygen ion supply) results in a rapid reduction of the active Ni oxides via H2, hindering their re-oxidation, and consequently the RWGS activity. The latter is obvious in Fig. S7a,† where no rate increase is observed at T = 420 °C and reducing conditions (PCO2 = 1 kPa, PH2 = 7 kPa), since the kinetics of oxide reduction are favored.
In summary, migrating oxygen ions apart from being part of the “effective” double layer, are also able to effectively electro-oxidize the Ni (i.e., a non-noble transition metal) electrode. This ability could be correlated to the structure of the working electrode (Fig. 2) that promotes the electrochemical reaction between Ni and O2− at the tpb (eqn (III)). More specifically, the tpb length of the working electrode used in this study seems to be higher compared to the classical EPOC studies (i.e., electrodes prepared by calcination of organometallic pastes), where almost the 99% of the metal electrode is electrochemically inactive (i.e., absence of tpb).53 The latter is attributed to the formation of a continuous film consisting of large metal particles and high electrode polarizability, due to the high calcination temperature. Moreover, according to the EPOC literature, the tpb length was found to be proportional to the exchange current density (io) of the catalyst–electrolyte interface,53 thus the higher the io (i.e., low electrode polarizability) the higher is the tpb length. Hence, io depends crucially on the catalyst film porosity and on catalyst crystallite size and morphology. In this study, exchange current density values up to 260 μA cm−2 were observed (determined from a Tafel plot, Fig. S8†), which are significantly higher (up to 200 times) to those reported in the literature over platinum paste electrodes,54 indicating higher tpb length. Therefore, both the electrode deposition technique and the use of metal nanoparticles contribute to the formation of an ideal electrocatalytic surface, which is needed for the formation of the active NiO toward the RWGS reaction. Besides the high importance of the nature of the catalytic metals used in EPOC studies, the effective electrooxidation of the working electrode requires the presence of a porous surface area with a high tpb length.
Conclusions
The in situ electrochemical oxidation of a non-noble transition metal was simultaneously investigated by electrochemical promotion and cyclic voltammetry experiments. Fine tuning of Ni at high oxidation states (under reaction conditions) is a key parameter in promoting the RWGS selectivity. However, H2 acts as an inhibitor of this process, as it reduces the surface nickel oxides. According to our results, upon anodic polarization an up to 40% CO rate increase is observed, as NiO is electrochemically formed at the tpb. CV measurements reveal that the electro-oxidation of Ni via O2− (from YSZ) is a reversible process, improving sufficiently the catalytic properties of Ni toward the RWGS activity. The EPOC effect is proved to be a remarkable tool for the in situ (re)generation of non-noble transition metal oxides, affecting both the catalytic activity and selectivity of the RWGS reaction.Author contributions
The experimental work was performed by DZ and NK. Design of the experiments and data analysis were performed by D. Z., G. K. and A. K. The paper was written by D. Z., G. K. and A. K.Conflicts of interest
There are no conflicts to declare.Acknowledgements
This research has been co-financed by the European Union and Greek national funds through the Operational Program Competitiveness, Entrepreneurship and Innovation, under the call RESEARCH – CREATE – INNOVATE (project code: T1EDK-01631, CO2 TO FUELS). The authors are also thankful to the Laboratory of Electron Microscopy and Microanalysis of University of Patras for SEM and TEM measurements and the Mechanical Workshop of University of Patras for the construction of the reactor.References
- G. P. Peters, R. M. Andrew, J. G. Canadell, P. Friedlingstein, R. B. Jackson, J. I. Korsbakken, C. Le Quéré and A. Peregon, Nat. Clim. Change, 2020, 10, 3–6 CrossRef.
- S. Sherwood, M. J. Webb, J. D. Annan, K. C. Armour, P. M. Forster, J. C. Hargreaves, G. Hegerl, S. A. Klein, K. D. Marvel, E. J. Rohling, M. Watanabe, T. Andrews, P. Braconnot, C. S. Bretherton, G. L. Foster, Z. Hausfather, A. S. von der Heydt, R. Knutti, T. Mauritsen, J. R. Norris, C. Proistosescu, M. Rugenstein, G. A. Schmidt, K. B. Tokarska and M. D. Zelinka, Rev. Geophys., 2020, 58, 1–184 CrossRef PubMed.
- F. Nocito and A. Dibenedetto, Curr. Opin. Green Sustain. Chem., 2020, 21, 34–43 CrossRef.
- D. Porosoff, B. Yan and J. G. Chen, Energy Environ. Sci., 2016, 9, 62–73 RSC.
- H. Yang, C. Zhang, P. Gao, H. Wang, X. Li, L. Zhong, W. Wei and Y. Sun, Catal. Sci. Technol., 2017, 7, 4580–4598 RSC.
- W. Li, H. Wang, X. Jiang, J. Zhu, Z. Liu, X. Guo and C. Song, RSC Adv., 2018, 8, 7651–7669 RSC.
- A. Modak, P. Bhanja, S. Dutta, B. Chowdhury and A. Bhaumik, Green Chem., 2020, 22, 4002–4033 RSC.
- P. Sharma, J. Sebastian, S. Ghosh, D. Creaser and L. Olsson, Catal. Sci. Technol., 2021, 11, 1665–1697 RSC.
- S. Kattel, P. Liu and J. G. Chen, J. Am. Chem. Soc., 2017, 139, 9739–9754 CrossRef CAS PubMed.
- S. Kattel, B. Yan, Y. Yang, J. G. Chen and P. Liu, J. Am. Chem. Soc., 2016, 138, 12440–12450 CrossRef CAS PubMed.
- C. Yang, S. Liu, Y. Wang, J. Song, G. Wang, S. Wang, Z. J. Zhao, R. Mu and J. Gong, Angew. Chem., Int. Ed., 2019, 58, 11242–11247 CrossRef CAS PubMed.
- Q. Zhang, J. Kang and Y. Wang, ChemCatChem, 2010, 2, 1030–1058 CrossRef CAS.
- L. Deng, X. Ai, F. Xie and G. Zhou, Chem. - Asian J., 2021, 16, 949–958 CrossRef CAS PubMed.
- L. F. Bobadilla, J. L. Santos, S. Ivanova, J. A. Odriozola and A. Urakawa, ACS Catal., 2018, 8, 7455–7467 CrossRef CAS.
- A. R. Puigdollers, P. Schlexer, S. Tosoni and G. Pacchioni, ACS Catal., 2017, 7, 6493–6513 CrossRef.
- L. Wang, S. Zhang and Y. Liu, J. Rare Earths, 2008, 26, 66–70 CrossRef.
- X. Chen, Y. Chen, C. Song, P. Ji, N. Wang, W. Wang and L. Cui, Front. Chem., 2020, 8, 1–21 CrossRef PubMed.
- A. V. Puga, Catal. Sci. Technol., 2018, 8, 5681–5707 RSC.
- B. Zhao, B. Yan, Z. Jiang, S. Yao, Z. Liu, Q. Wu, R. Ran, S. D. Senanayake, D. Weng and J. G. Chen, Chem. Commun., 2018, 54, 7354–7357 RSC.
- M. T. Greiner, L. Chai, M. G. Helander, W. M. Tang and Z. H. Lu, Adv. Funct. Mater., 2012, 22, 4557–4568 CrossRef CAS.
- D. Zagoraios, S. Tsatsos, S. Kennou, C. G. Vayenas, G. Kyriakou and A. Katsaounis, ACS Catal., 2020, 10, 14916–14927 CrossRef CAS.
- C. G. Vayenas, S. Bebelis, I. V. Yentekakis and H. G. Lintz, Catal. Today, 1992, 11, 303–438 CrossRef CAS.
- C. G. Vayenas and C. G. Koutsodontis, J. Chem. Phys., 2008, 128, 182506–182518 CrossRef PubMed.
- C. G. Vayenas, S. Bebelis, C. Pliangos, S. Brosda and D. Tsiplakides, Electrochemical Activation of Catalysis: Promotion, Electrochemical Promotion and Metal-Support Interactions, Kluwer Academic/Plenum Publishers, New York, 2001 Search PubMed.
- P. Vernoux, L. Lizarraga, M. N. Tsampas, F. M. Sapountzi, A. De Lucas-Consuegra, J. L. Valverde, S. Souentie, C. G. Vayenas, D. Tsiplakides, S. Balomenou and E. A. Baranova, Chem. Rev., 2013, 113, 8192–8260 CrossRef CAS PubMed.
- A. Caravaca, J. González-Cobos and P. Vernoux, Catalysts, 2020, 10, 1276–1305 CrossRef CAS.
- A. Katsaounis, J. Appl. Electrochem., 2010, 40, 885–902 CrossRef CAS.
- C. G. Vayenas, S. Brosda and C. Pliangos, J. Catal., 2003, 216, 487–504 CrossRef CAS.
- M. Stoukides and C. G. Vayenas, J. Catal., 1981, 70, 137–146 CrossRef CAS.
- D. Grigoriou, D. Zagoraios, A. Katsaounis and C. G. Vayenas, Catal. Today, 2021, 363, 122–127 CrossRef CAS.
- D. Zagoraios, A. Athanasiadi, I. Kalaitzidou, S. Ntais, A. Katsaounis, A. Caravaca, P. Vernoux and C. G. Vayenas, Catal. Today, 2020, 355, 910–920 CrossRef CAS.
- D. Zagoraios, C. Panaritis, A. Krassakopoulou, E. A. Baranova, A. Katsaounis and C. G. Vayenas, Appl. Catal., B, 2020, 276, 119148–119159 CrossRef CAS.
- C. Panaritis, J. Zgheib, S. A. H. Ebrahim, M. Couillard and E. A. Baranova, Appl. Catal., B, 2020, 269, 118826–118836 CrossRef CAS.
- Y. M. Hajar, M. S. E. Houache, U. Tariq, P. Vernoux and E. A. Baranova, ECS Trans., 2017, 77, 51–66 CrossRef CAS.
- H. A. E. Dole, A. C. G. S. A. Costa, M. Couillard and E. A. Baranova, J. Catal., 2016, 333, 40–50 CrossRef CAS.
- I. Kalaitzidou, D. Zagoraios, S. Brosda, A. Katsaounis, P. Vernoux and C. G. Vayenas, Mater. Today: Proc., 2018, 5, 27345–27352 CAS.
- C. Panaritis, C. Michel, M. Couillard, E. A. Baranova and S. N. Steinmann, Electrochim. Acta, 2020, 350, 136405–136411 CrossRef CAS.
- S. Brosda, C. G. Vayenas and J. Wei, Appl. Catal., B, 2006, 68, 109–124 CrossRef CAS.
- M. Singleton and P. Nash, J. Phase Equilib., 1989, 10, 121–126 CAS.
- M. Courtois and S. J. Teichner, J. Catal., 1962, 1, 121–135 CrossRef.
- S. Souentie, C. Falgairette and C. Comninellis, J. Electrochem. Soc., 2010, 157, 49–52 CrossRef.
- B. Lu and K. Kawamoto, Mater. Res. Bull., 2014, 53, 70–78 CrossRef CAS.
- M. Lovric and Š. Komorsky-lovric, Electrochem. Commun., 2018, 86, 48–52 CrossRef CAS.
- D. Y. Chung, K. J. Lee and Y. E. Sung, J. Phys. Chem. C, 2016, 120, 9028–9035 CrossRef CAS.
- A. M. Hofstead-Duffy, D. J. Chen, S. G. Sun and Y. J. Tong, J. Mater. Chem., 2012, 22, 5205–5208 RSC.
- Y. Zhao, X. Li, J. M. Schechter and Y. Yang, RSC Adv., 2016, 6, 5384–5390 RSC.
- M. Warczak, M. Pisarek and A. Sadkowski, Corros. Sci., 2014, 89, 6–12 CrossRef CAS.
- J. F. McAleer and L. M. Peter, J. Electrochem. Soc., 1982, 129, 1252–1260 CrossRef CAS.
- M. Fan and F. La Mantia, Electrochem. Commun., 2013, 37, 91–95 CrossRef CAS.
- F. El Gabaly, K. F. McCarty, H. Bluhm and A. H. McDaniel, Phys. Chem. Chem. Phys., 2013, 15, 8334–8341 RSC.
- C. G. Vayenas and S. Brosda, Top. Catal., 2014, 57, 1287–1301 CrossRef CAS.
- D. Theleritis, S. Souentie, A. Siokou, A. Katsaounis and C. G. Vayenas, ACS Catal., 2012, 2, 770–780 CrossRef CAS.
- C. G. Vayenas, A. Ioannides and S. Bebelis, J. Catal., 1991, 129, 67–87 CrossRef CAS.
- S. Bebelis and C. G. Vayenas, J. Catal., 1989, 118, 125–146 CrossRef CAS.
Footnote |
| † Electronic supplementary information (ESI) available. See DOI: 10.1039/d1cy02140k |
| This journal is © The Royal Society of Chemistry 2022 |

