
 Open Access Article
 This Open Access Article is licensed under a
 Creative Commons Attribution 3.0 Unported Licence
Charge carrier dynamics and reaction intermediates in heterogeneous photocatalysis by time-resolved spectroscopies
Jiani
Ma†
 a,
Tina Jingyan
Miao†
bc and
Junwang
Tang
*b
a,
Tina Jingyan
Miao†
bc and
Junwang
Tang
*b
aKey Laboratory of Synthetic and Natural Functional Molecule of the Ministry of Education, and the Energy and Catalysis Hub, College of Chemistry and Materials Science, Northwest University, Xi’an, P. R. China
bDepartment of Chemical Engineering, University College London (UCL), WC1E 7JE, London, UK
cDepartment of Chemistry, University College London (UCL), WC1H 0AJ, London, UK. E-mail: Junwang.tang@ucl.ac.uk
First published on 30th June 2022
Abstract
Sunlight as the most abundant renewable energy holds the promise to make our society sustainable. However, due to its low power density and intermittence, efficient conversion and storage of solar energy as a clean fuel are crucial. Apart from solar fuel synthesis, sunlight can also be used to drive other reactions including organic conversion and air/water purification. Given such potential of photocatalysis, the past few decades have seen a surge in the discovery of photocatalysts. However, the current photocatalytic efficiency is still very moderate. To address this challenge, it is important to understand fundamental factors that dominate the efficiency of a photocatalytic process to enable the rational design and development of photocatalytic systems. Many recent studies highlighted transient absorption spectroscopy (TAS) and time-resolved infrared (TRIR) spectroscopy as powerful approaches to characterise charge carrier dynamics and reaction pathways to elucidate the reasons behind low photocatalytic efficiencies, and to rationalise photocatalytic activities exhibited by closely related materials. Accordingly, as a fast-moving area, the past decade has witnessed an explosion in reports on charge carrier dynamics and reaction mechanisms on a wide range of photocatalytic materials. This critical review will discuss the application of TAS and TRIR in a wide range of heterogeneous photocatalytic systems, demonstrating the variety of ways in which these techniques can be used to understand the correlation between materials design, charge carrier behaviour, and photocatalytic activity. Finally, it provides a comprehensive outlook for potential developments in the area of time-resolved spectroscopies with an aim to provide design strategies for photocatalysts.
 Jiani Ma | Prof. Jiani Ma received her doctorate in Physical Chemistry from the University of Hong Kong, under the supervision of Professor David Lee Phillips. She was a Professor in Physical Chemistry at Northwest University during the year of 2014-2022. And is now a professor at Shaanxi Normal University. Her current research interests focus on investigating the photochemical and photobiological reactions using ultrafast time-resolved spectroscopies and quantum calculations. |
 Tina Jingyan Miao | Dr Tina J. Miao received her engineering doctorate in Molecular Modelling and Materials Science at University College London (UCL), under the supervision of Professor Junwang Tang. She is currently a postdoctoral research fellow in the group of Professor Junwang Tang in Chemical Engineering at UCL. Her research interests include synthesis of metal–graphene composites and fundamental understanding of photophysical steps in photocatalysis by advanced spectroscopies. |
 Junwang Tang | Prof. Junwang Tang is a Member of Academia Europaea, RS Leverhulme Trust Senior Research Fellow, Fellow of European Academy of Sciences, Fellow of RSC, Fellow of IMMM and Professor in Chemical Engineering at University College London. His research interests encompass photocatalytic small molecule activation (e.g. H2O, CO2, CH4 and N2) and microwave catalysis, together with the investigation of the charge dynamics and kinetics using state-of-the-art spectroscopies. He has also received many awards, the latest of which is the 2021 IChemE Andew Medal, 2021 RSC Corday-Morgan Prize and 2021 IChemE Innovative Product Award. He is also a member of the editorial/advisory board for nine international journals. |
1. Introduction
To make our society sustainable, considerable effort has been focused on the development of renewable energy technologies. Sunlight is the only primary energy resource on the planet and has the potential to meet the increasing energy demands. However, due to the low power density and intermittence of sunlight, not only does it have to be efficiently converted, but it is also important to store the converted energy in the form of clean chemical fuels in order to effectively meet different types of energy demands.Photocatalysis has a wide range of applications including production of solar fuels,1–3 organic upgrade,4–6 and air and water purification.7–9 Regardless of homogenous or heterogeneous photocatalysis, the first step in photocatalysis is photon absorption resulting in photoexcited charges, which migrate to surface reactive sites in the case of heterogeneous photocatalysis, followed by interfacial charge transfer of the photoexcited electron/hole to the chemical species to be reduced/oxidised. Charge recombination is a key process limiting the solar conversion efficiency. In heterogeneous photocatalysis the diffusion length is also important, which determines the fraction of charge carriers generated in the bulk that are capable of reaching the surface to participate in the photocatalytic reactions. Furthermore, the reaction pathway is also significant, which not only determines the reaction efficiency but also controls the product selectivity.10
A variety of techniques have been applied to understand charge carrier dynamics and its impact on photocatalytic activity. Among these technologies, time-resolved infrared (TRIR) spectroscopy and transient absorption spectroscopy (TAS) have been extensively used to obtain information such as charge recombination kinetics over timescales from femtoseconds to seconds. For instance, the charge carrier dynamics in carbon nitride (CNx) heterojunctions was investigated using time resolved photoluminescence (TRPL) and TAS by Godin et al., where the emissive states could be detected and the authors found that the application of TRPL faced problems from the low photoluminescence quantum yield of CNx.11,12 Very recently, a review also discussed the in situ TAS of semiconductor nanostructures using copper oxide and dye-sensitized TiO2 as exemplar photocatalytic systems.13 The TRIR studies on photocatalytic processes were also reviewed recently.14 Therefore, TAS and TRIR are two powerful methods to characterise two continuous and interlinked steps – dynamics of charge carriers and their reactions with reactants. Understanding the charge dynamics and intermediate steps is critical for providing a solid foundation for the rational designing of future photocatalysts. As such, a variety of time-resolved techniques have been developed to characterize charge carrier dynamics in photo-responsive systems. A comparison of the large repertoire of available techniques (including TRPL, TAS, TRIR, time-resolved Raman, etc.) has been provided in a recent review by us,15 in which it has been pointed out that techniques involving electrical measurements generally have low time-resolution in the order of microseconds to seconds, whilst techniques that use electromagnetic radiation to probe the charge carrier behavior can provide complementary information to one another (analogous to the use of the static counterparts of the time-resolved techniques). In particular, TAS and TRIR results could be utilized to unravel the reaction mechanisms by providing the characteristic spectra of the intermediates of interest, as well as by offering the kinetic information related to the photocatalytic process. For example one type of charge, e.g. electrons, disappears together with the other type of charge, e.g. holes, as a result of which the reactant is reduced rather than being oxidized. The analysis could also be complemented by TRIR and theory calculations.
Given such significance of TAS and TRIR in directing the design of photocatalysts, this critical review will discuss contributions from both TAS and TRIR to the current progress in understanding key events in heterogenous photocatalytic systems, and key factors that affect photocatalytic efficiency. Metal oxides have consistently been the most prevalent type of photocatalyst, whilst polymer photocatalysts have been receiving increasing research attention due to their advantage of synthetic versatility, which allows their photocatalytic properties to be enhanced through rational molecular designing. Thus heterogeneous photocatalysts including metal oxides and polymers will be focused on in the discussions as the materials of interest. Although TiO2 is discussed in depth as the most commonly studied and exemplar metal oxide, visible-driven metal oxides including WO3, hematite, and BiVO4 will be discussed and compared with TiO2 as they are photocatalysts of wide interest. For polymeric materials, carbon nitride will be discussed in depth as the exemplar benchmark polymeric photocatalyst. Other polymers including covalent organic frameworks (COFs) and metal organic frameworks (MOFs) will also be discussed as they present strong potential to be efficient photocatalysts due to their diverse porous structures and ease of modification. The way in which cocatalysts have been studied using time-resolved spectroscopy will also be outlined. Furthermore, the interactions between photoexcited charges and chemical reactants will be discussed. Detailed background of both the system components and physical interpretation of TAS signals have been reviewed previously,15 therefore will not be covered here. The study of homogeneous photocatalysis using time-resolved spectroscopy methods is also outside the scope of the current article, but has been reviewed elsewhere.16
2. Fundamentals of TAS and TRIR
Both TAS and TRIR can be classified as time-resolved spectroscopic techniques. A general introduction to time-resolved spectroscopic techniques can be found elsewhere15,17 and will not be recapitulated here. There are a few articles focusing on the basics of TAS15,18 and TRIR.19 Here, we briefly review the similarities and differences between TAS and TRIR. Both are pump–probe techniques, in which a sample is photoexcited by an electromagnetic pulse (the “pump”), then the photo-induced changes are monitored as a function of time using an electromagnetic “probe”. When the probe has wavelengths in the visible and near-IR (NIR) regions, the technique is commonly referred to as TAS, whilst when the probe is in the mid-IR region, the technique is commonly referred to as TRIR. Due to the lower energy probe in TRIR compared to that in TAS, TRIR is more sensitive to free/shallow-trapped charge carriers, while TAS signals usually have more contribution from deep trapped charge carriers. A diagrammatic representation of different transitions corresponding to absorptive signals from different types of charge carriers can be found in one related review.15 Spectroscopic characteristics of different types of charge carriers and their contribution to the performance of widely studied photocatalysts will be further discussed in later sections.The set-up of TAS and TRIR systems is very similar – both include an electromagnetic “pump” and “probe”, a mechanism for controlling the time-difference between the pump and the probe (i.e. the “time-delay”), and detectors for measuring the probe intensity. Two commonly employed TAS/TRIR setups are schematically illustrated in Fig. 1. Fig. 1(a) illustrates a typical setup for achieving time-resolutions down to the ns–ms timescale, where a continuous-wave visible or IR radiation is used as the probe. Fig. 1(b) illustrates a typical setup for achieving time-resolutions down to the fs–ps timescale, where a visible or IR probe is pulsed for ultrafast (≤ps) measurements. The main differences between TAS and TRIR set-ups are the optics used to direct probe radiation, and the detectors used to measure the probe intensity. Silicon-based detectors are frequently used in TAS for monitoring the intensity of the visible probe,18,20,21 whilst mercury cadmium telluride (MCT) detectors are commonly used in TRIR for monitoring the intensity of the mid-IR probe.22,23 In either case, the detector can be single-pixeled (for detecting one probe wavelength at a time) or multi-pixeled (for detecting many different probe wavelengths at the same time).
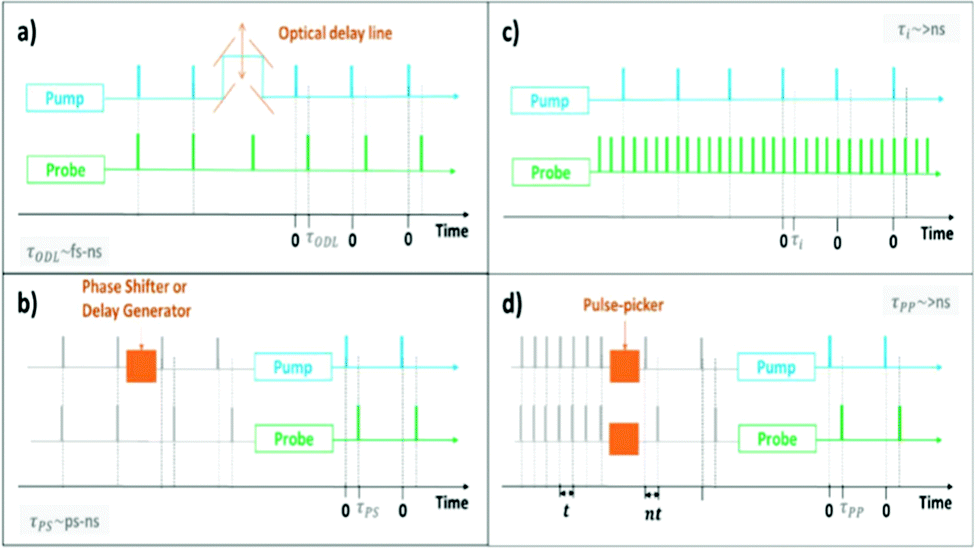 | ||
| Fig. 1 Simplified schematic illustration of the ways in which time-delays can be controlled in a transient absorption setup, using (a) an optical delay line to delay the pump pulses (time-delay labelled as τODL), (b) a phase shifter or delay generator to delay the trigger signal for emitting pump pulses (time-delay labelled as τps), (c) a multiple-probe scheme to measure multiple delays per excitation event (time-delay labelled as τi), and (d) pulse-picking methods to select appropriate trigger signals for emitting pump and probe pulses (time-delay labelled as τpp). Blue and green colours, respectively, indicate optical components/output associated with the pump and probe, orange colour highlights the component used to control time-delays, and gray indicates electrical signals. In (a), the pump and probe light originate from the same laser in a classical fs-setup, but are shown here as two separate sources for clarity, and the orange double-headed arrow represents the mechanical freedom of the optical delay line that allows different time-delays to be achieved. In (d), “n” is an integer as pulses can only be selected in steps of the clock frequency “t”. Synchronisation and other timing details have been omitted to improve clarity of the diagrams, and because the details differ from setup to setup.32 | ||
In instruments that use pulsed-detection, usually optical delay lines (mechanical delay stages) are used to achieve time-delays spanning fs–ns timescales, whilst phase-shifting methods can be used to achieve ps–ns time-delays, and pulse-picking and multiple-probe methods are typically used to extend the range of ultrafast instruments to >ns timescales.21,24–28 In TAS/TRIR, the intensity of the visible/IR probe passing through the sample with and without photoexcitation is detected, from which the change in absorption (ΔA) caused by photoexcitation can be calculated. The transient signal generally has contribution from multiple components. Excited state absorption (ESA, ΔA > 0) arises when the photoexcited state of a material absorbs more probe light than the ground state. In the case of TRIR, positive ESA signals are also expected if the frequencies of the vibrational modes of a material in its excited state differ from those of the ground state.29 On the other hand, a negative change in absorption (ΔA < 0) will be observed when stimulated emission (SE) and/or ground-state bleach (GSB) dominates. In the case of TRIR, negative ΔA is also expected if the vibrational frequencies of the excited states differ from those of the ground state. For more in-depth background on TAS and TRIR, the reader is advised to refer to other reviews.15,18,19,28,30,31
The range of charge carrier processes (electron and hole transfer kinetics) is very diverse as indicated in Fig. 2. In the frame of inorganic semiconductor materials, the light-driven charge transfer processes are nearly orthogonal (Fig. 2a and b). In transition metal-based photosensitizers or organic semiconductors (Fig. 2c), processes such as intersystem crossing and the formation of long-lived excited triplet states could be involved.
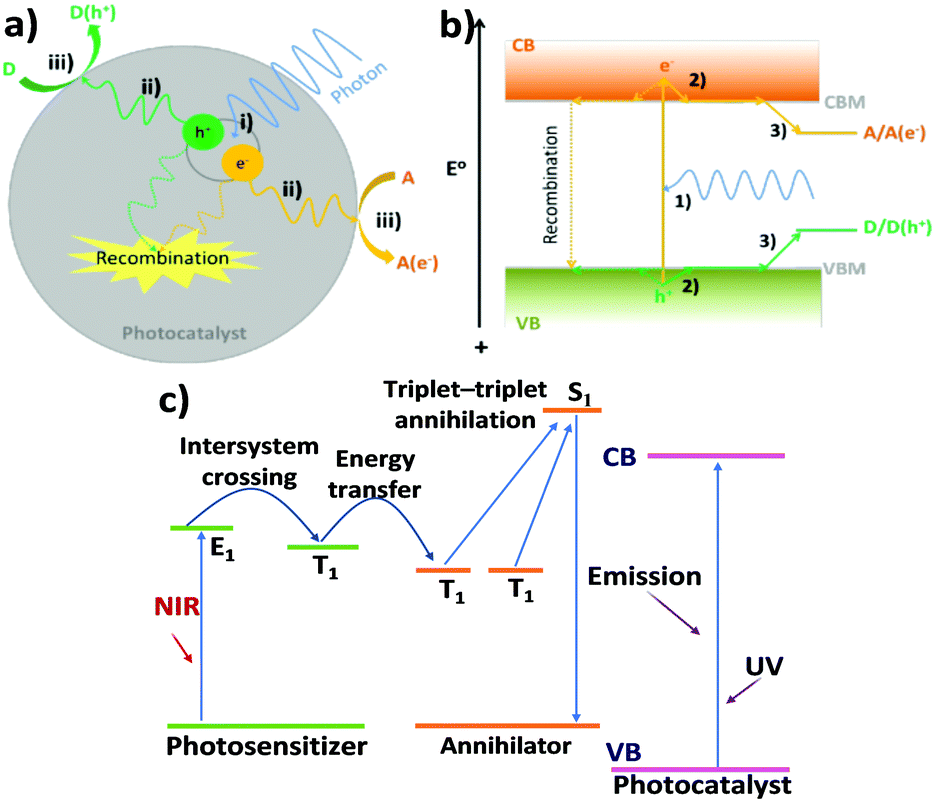 | ||
| Fig. 2 Illustration of the key processes of photocatalysis in a particle photocatalyst: (i) exciton generation, (ii) charge carrier separation and diffusion to surface reactive sites, and (iii) electron/hole reduction/oxidation of an electron acceptor (A)/donor (D); (b) detailed electron/hole pathways of important processes in photocatalysis: (1) photoexcitation of an electron from VB to CB, leaving a hole in the VB, (2) rapid thermal relaxation of electron/hole to CBM/VBM, and (3) thermodynamically driven transfer of electron/hole from photocatalyst to reactants. Note: in both (a) and (b), recombination has also been shown (dashed lines). (c) Schematic illustrations of charge transfer and upconversion mechanisms combined with a triplet–triplet annihilation process in an organic or dye-sensitised system. Reproduced from ref. 63 with permission from Springer, copyright 2021. | ||
3. Charge carrier dynamics measured by TAS
As discussed by Haisch et al., TAS has been useful for measuring important events in photocatalysis including charge carrier trapping, charge transfer between semiconductors and co-catalysts, charge separation at heterojunctions, recombination kinetics, and interfacial charge transfer between the photocatalyst and chemical reactants.33 The present review complements the review by Haisch et al.33 and our previous review15 in that the former review focused on different applications of ultrafast (sub-ns) and ns–ms TAS in characterising photocatalysts, while our earlier review is useful for readers seeking to assign physical meaning to the TAS data, whereas this section is tailored to facilitate readers understand the common TAS characteristics of typical heterogenous materials, some key events that can be monitored using TAS, and more importantly the behaviour of photoexcited charges on representative catalysts and the correlation between this information and photocatalytic performance.It is worth noting that early studies using TAS were usually referred to as “flash photolysis” experiments. However, the term TAS will be used throughout the present review. Common heterogeneous photocatalysts include metal oxides and more recently polymeric materials. Both types of materials will be reviewed.
3.1 Intrinsic characteristics of charge carriers in metal oxides
TiO2 was the first metal oxide reported to be capable of photocatalytic water splitting in 1972.34 Since then, there have been many studies on TiO2 and other metal oxide photocatalysts. Thus there are numerous reviews on TiO2 photocatalysis,35–39 and this field continues to receive significant research interest. Although many other metal oxides have been investigated for various photocatalytic reactions, TiO2 still remains the most widely studied material. Given this, there are many studies on the fundamentals of photocatalysis by TiO2. Numerous literature reports also detailed charge carrier dynamics in TiO2-based photocatalysts using a range of time-resolved spectroscopic techniques.35,38,39 Building on these significant literature reports, the present article focuses on TAS of representative metal oxide photocatalysts including TiO2, WO3, haematite, and BiVO4.The earliest study using TAS to characterise TiO2 was reported by Duonghong et al. using viologen (MV2+) as an electron acceptor and thiocyanate (SCN−) as a hole acceptor.40 The formation of the reduction and oxidation products (MV+ and (SCN)2−, respectively) was monitored using their characteristic absorption peaks in the visible region.40 Other pioneering studies41,42 also concentrated on visible absorption signals due to chemical intermediates and products formed as a result of photocatalysis, while neglected absorption due to photoexcited charge carriers, which was extensively investigated by later studies and is the focus of this review due to their strong correlation with observed photocatalytic activities.
One of the earliest studies that directly tracked the behaviour of photoexcited charge carriers was reported by Rothenberger et al. in 1985.43 A colloidal TiO2 dispersion at pH 2.7 was found to exhibit a broad peak around 620 nm in its transient absorption (TA) spectrum, attributed to trapped electrons. The peak remained at 620 nm from 20 ps up to the observation limit of 5 ns. As the TA spectrum fully resembled that of trapped electrons at 20 ps, it was concluded that electron trapping occurred within 20 ps after photoexcitation.43 Later studies also attributed the TAS signal at 620 nm to trapped electrons in TiO2, and used the signal rise time to estimate that photogenerated electrons become trapped over timescales shorter than hundreds of fs.44,45
To obtain distinct fingerprints, hole scavengers such as alcohols have repeatedly been used to obtain the absorption spectra of photoexcited electrons in TiO2, whilst electron scavengers such as Pt (deposited onto TiO2 surface) have been used to obtain the absorption spectra of photoexcited holes.42,46–48 It is noted that the TA spectra and their assignment differ slightly from work to work. Apparent discrepancies between different studies could be attributed to the sensitivity of TA spectra to conditions such as pH, surface conditions, and particle size.46,47 In addition, experimental parameters such as excitation wavelength may also contribute to some apparent discrepancies between different studies. Although it is generally difficult to make precise comparisons between different studies, some recurring features can nonetheless be observed. For example, in the case of anatase TiO2, photoexcited electrons have been found to be characterised by a broad peak around 650–750 nm and a signal that monotonously increases towards longer wavelengths,42,46–48 whilst photoexcited holes are reportedly characterised by a broad peak around 400–500 nm.42,46,47,49 Representative TA spectra for anatase TiO2 are shown in Fig. 3A. Generally, deep trapped charge carriers in anatase TiO2 exhibit transient absorption peaks, whilst free/shallow charge carriers do not have distinctive spectral peaks. As trapping reduces the oxidation/reduction potential of photoexcited holes/electrons, it is reasonable to expect free/shallow charges to be more reactive than deep trapped charges. Indeed, it has been reported that deeply trapped holes are unreactive, whilst free/shallow holes are the primary species responsible for oxidation reactions.49 However, another study found that trapped electrons and holes reacted immediately but free electrons only reacted slowly with scavenger molecules (attributed to trap sites being distributed mainly on the surface).47 These observations highlight the importance of the interplay between different competing factors contributing to the overall reactivity of photoexcited charges.
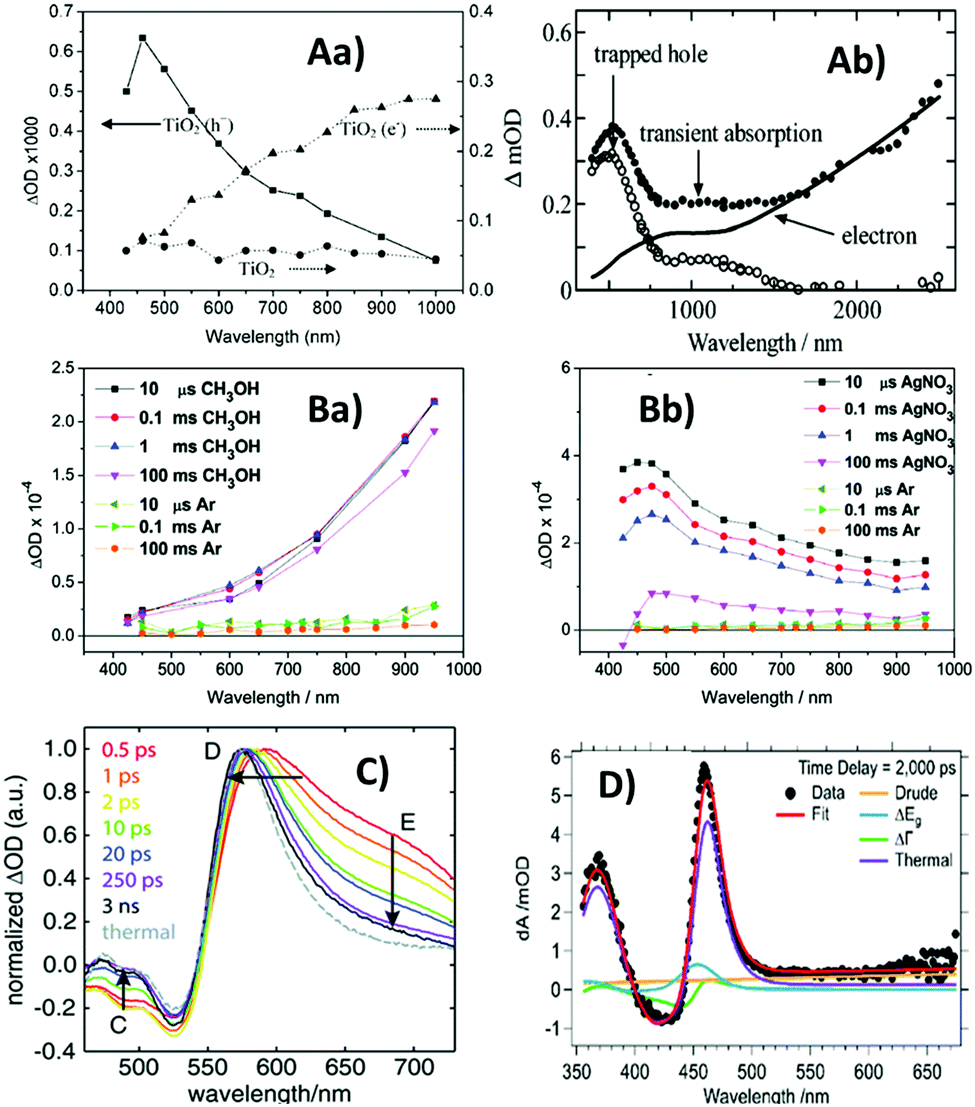 | ||
| Fig. 3 Transient absorption (TA) spectra of metal oxides. (A) Anatase TiO2, (Aa)46 recorded 20 μs after excitation in the presence of a methanol hole scavenger (triangles – fingerprint of photoexcited electrons), a deposited Pt electron scavenger in argon (squares – fingerprint of photoexcited holes), and in the absence of scavengers (circles), and (Ab)47 recorded 1 μs after excitation in the presence of N2-saturated heavy water (solid circles – contain spectral contributions from both electrons and holes), along with normalised electron absorption recorded in the steady-state in the presence of N2-saturated CD3OD after 30 mins UV irradiation (solid line), and their difference spectrum (open circles) representative of absorption due to photoexcited holes. Also shown for comparison are TA spectra for (B)60 WO3 film, (Ba)50 after excitation in the presence of a methanol hole scavenger and (Bb)50 in the presence of a AgNO3 electron scavenger; (C) hematite film and (D)61 BiVO4 at a time-delay of 2 ns. Comparison of panels (Aa) and (Ab) demonstrates that the TA spectra of the same material can be broadly similar across different literature reports, but slight differences exist due to variations in experimental conditions and sample characteristics. The absorption due to photoexcited electrons in both TiO2 (A) and WO3 (Ba) increases with increasing wavelength, whilst the absorption due to photoexcited holes in both TiO2 (A) and WO3 (Bb) exhibits a peak <500 nm. Hematite (C) and BiVO4 (D) both exhibit a characteristic absorption peak near the bandgap that is not observed for TiO2 (A) and WO3 (B), but this characteristic TA peak is strikingly similar to the thermal difference spectrum for both materials. Reproduced from ref. 46, 47, 50 and 61 with permission from American Chemical Society, copyright 2008, 2004, 2011 and 2018, respectively. | ||
Interestingly, the TA spectra of WO3 in the presence of chemical scavengers reported by Pesci et al.50 are similar to those of TiO2. In the presence of scavengers, the TA spectrum for WO3 (Fig. 3B) shows striking similarity to the TA spectrum for anatase TiO2 (Fig. 3A). However, in contrast to the previously discussed ≤ps charge trapping times observed for TiO2, the TA signals (monitored at 630 nm) for WO3 colloids in ethanol have been reported to continuously rise as a function of time up to the ns timescale, taken to be indicative of slow electron trapping after hole scavenging by ethanol.51 Interestingly, a broad peak around 600–650 nm superimposed on the monotonously increasingly signal was observed by Bedja et al.51 over ps–ns timescales for photoexcited WO3 colloids in ethanol. This broad peak was absent in the spectra observed by Pesci et al.50 over μs–ms timescales for WO3 in methanol (Fig. 3(Ba)). This might suggest that trapped electrons responsible for the broad peak undergo faster recombination than electrons responsible for the monotonously increasing signal. Alternatively, it might be the case that surface states are responsible for the broad peak, which can be expected to be prominent in the WO3 colloids used by Bedja et al.51 but insignificant in the WO3 films used by Pesci et al.50 due to low surface area.
Different from TiO2 and WO3, the TA spectrum of hematite has been repeatedly studied using electrical bias rather than the chemical scavenger methods. A sharp positive peak around 570–580 nm in the TA spectrum of hematite has been repeatedly assigned to photoexcited holes using the electrical bias methods.52–54 Furthermore, Pendlebury et al. found that under a +0.4 V bias (vs. Ag/AgCl), the lifetime of the TA decay monitored at 580 nm was extended from the μs-timescale (for −0.1 V bias) to 3 seconds, and the addition of methanol reduced this lifetime to 400 ms. The positive peak around 580 nm was thus assigned to holes that are surface active.54 However, the TA spectra reported for hematite also vary between different literature reports, and the distinctive positive peak between 550 and 600 nm was not always observed.55,56 Typical TA spectra with the distinctive positive peak reported for hematite are shown in Fig. 3(C).
The TA spectrum of BiVO4 is similar to that of hematite. A distinctive positive peak near the bandgap has often been reported and attributed to photoexcited holes.57–59 Typical TA spectrum reported for BiVO4 is shown in Fig. 3D. However, for both BiVO4 and hematite, there is strong evidence that the positive TA feature near the bandgap was due to the heating effects.58–61 Thermal difference spectra for hematite and BiVO4 are compared to their TA spectra, shown in Fig. 3(C) and (D), respectively, from which striking similarities can be observed. We recently pointed out that these literature assignments could be reconciled if the near-bandgap positive feature was attributed to polarons, which could be generated through heat, electrical bias, or photoexcitation.15 As charge carriers are consumed through recombination, the distorted lattice also relaxes back to its ground-state with corresponding kinetics.15 Therefore particular care needs to be taken to assign these TAS signals.
Once the absorption characteristics/fingerprints of photoexcited electrons and holes are identified, it is possible to track the behaviour of photoexcited charge carriers. The decay of TA signals can often be interpreted as electron–hole recombination.43,44,46 Rothenberger et al. found that when the charge carrier concentration in TiO2 particles was high, the TA decay was well-described by second-order kinetics. However, when the charge carrier concentration was very low, the decay became first order.43 This can be understood as when the average number of charge carrier is ≤1 pair per particle, recombination is geminate, therefore well-described by first-order kinetics. Colombo et al. also found that TA decay exhibited by TiO2 particles in water was well-described by second-order kinetics (Fig. 4a),44 but Colombo et al. calculated a second-order rate constant that was 5 times larger than the value obtained by Rothenberger et al.,43 which was attributed to differences in the excitation conditions – while Rothenberger et al.43 used a laser system with 30 ps resolution, Colombo et al.44 used a system with 150 fs resolution. Colombo et al.44 noted that more than 50% recombination occurred within the first 30 ps, which would be missed by Rothenberger et al.43 due to their excitation pulse duration, resulting in the underestimated second-order rate constant. In addition, Colombo et al. found that a baseline was needed to fit their kinetic data to second order kinetics, indicative of a species with lifetime much longer than the time range (<200 ps) observed experimentally. The long-lived species was later identified as deep trapped electrons by applying TAS in the diffuse reflectance mode to TiO2 powders.62
In contrast to first/second order recombination kinetics reported in the above-mentioned literature, we observed that under inert conditions, both photoexcited electrons (monitored at 800 nm) and holes (monitored at 460 nm) in the anatase TiO2 film exhibited power-law decay kinetics, attributed to trapping–detrapping limited motion of charge carriers (Fig. 4b).46 After our work, power-law recombination kinetics has since been repeatedly observed over ≥ns timescales after photoexcitation of anatase TiO2.20,48,64,65 This is in stark contrast to the second order kinetics observed by early studies described previously, as compared in Fig. 4. It is noted here that the early studies that observed first/second order kinetics monitored charge carrier kinetics over ≤ns timescales, whereas the later studies reporting power-law kinetics monitored charge carrier kinetics over ≥ns timescales. It might therefore be the case that recombination occurs according to first/second-order kinetics during early times (≤ ns), but evolves to power-law decay kinetics over ns-timescales after photoexcitation. First/second order kinetics suggests that recombination is in an analogous manner to one/two reactant(s) in a solution, which may be a good model for charge carrier behaviour over ≤ns timescales. However, as the concentration of charge carriers reduces as a result of recombination, and the motion of electrons becomes limited by trap–detrapping between mid-gap states and the conduction band (CB), the kinetics progresses to a power-law decay. Generally, first order kinetics occurs when there is only one reactant that reacts with one type of charge, second order kinetics occurs when there are two reactants, and power-law kinetics occurs for recombination limited by trapping–detrapping of electrons and holes. Common kinetic models for describing electron–hole dynamics have been discussed in more depth elsewhere,15 therefore will not be further detailed here.
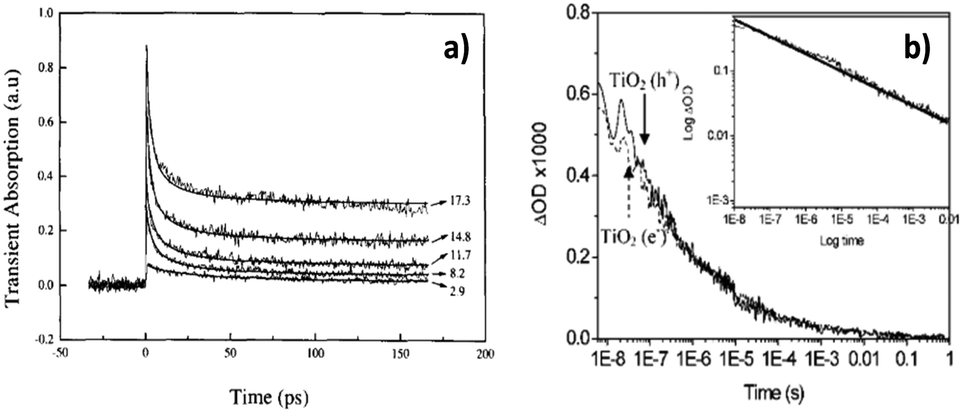 | ||
| Fig. 4 Exemplar TA kinetic traces of TiO2 exhibiting (a)44 second-order kinetics and (b)46 power-law kinetics. Panel (a)44 shows second-order kinetic fitting to experimental data acquired at different excitation fluences (labelled in the plot with units of photon absorbed per TiO2 cluster). Panel (b)46 shows overlapped decay of holes (solid trace) and electrons (dashed trace) under an argon atmosphere. As the only process consuming photoexcited charge carriers is recombination under inert conditions, the decay exhibited by electrons and holes is identical in panel (b). The inset in (b) is a log–log plot of the decay trace. Linearity of the kinetic trace on the log–log plot demonstrates power-law kinetics. The different TA kinetics exhibited by TiO2 over different timescales (<ns timescales in (a) and >ns timescales in (b)) suggest charge carrier behaviour is evolving over time. It is possible that recombination occurs in an analogous manner to one/two reactant(s) in a solution over <ns timescales, resulting in first/second order kinetics. As the concentration of charge carriers reduces due to recombination, the motion of photoexcited charges becomes limited by trapping–detrapping events, which result in power-law kinetics. Part (a) was reproduced from ref. 44, with permission from Elsevier, copyright 1995. And (b) was reproduced from ref. 46, with permission from American Chemical Society, copyright 2008. | ||
3.2 Reactions between charge carriers and chemicals on metal oxides
More importantly in the context of photocatalysis, TAS has been applied to understand the interplay between interfacial charge transfer and chemical reactions. Colombo et al. studied the effect of SCN− hole scavenger on charge carrier kinetics in P-25 TiO2.45 The rise of the photoelectron signal (<200 fs) at 620 nm was found to be unaffected by SCN−,45 which indicated that the hole scavenger did not affect the electron trapping timescale. This is expected because charge carrier trapping is an intrinsic process that should not be affected by the surrounding environment. However, in the presence of SCN− the initial intensity of the TA signal was greater, and the subsequent decay kinetics was slower. It was thus concluded that interfacial hole transfer between TiO2 and SCN− was in competition with charge recombination.The above finding that hole transfer from TiO2 to SCN− is in competition with charge carrier recombination cannot be generalised to other photocatalytic systems. This is well-exemplified in a later work we conducted. We used TAS to deduce that oxygen production from water splitting over anatase TiO2 required holes with lifetime in the order of seconds, which was much slower than the recombination kinetics we observed in the absence of efficient scavengers.46 Similarly, Cowan et al. attributed the low quantum yield observed for oxygen production from water splitting over TiO2 to fast recombination, which dominates the consumption of photoexcited charge carriers over timescales that successfully compete with interfacial charge transfer for water oxidation.20 Similar to the findings for TiO2, Pesci et al. found that O2 was readily evolved upon illumination of WO3 in the presence of AgNO3 but was slowly consumed when only water is present. Together with the observation that more than 95% of charge carriers recombined within 10 μs under inert conditions, whilst AgNO3 extended the lifetime of holes to the ms–s timescale, it was deduced that long-lived holes with ms–s lifetimes are required for water oxidation over WO3.50 It is believed that Ag+ ions here worked as an electron scavenger following the reaction Ag+ + WO3(e−/h+) → Ag + WO3(h+); thus long lived holes were achieved. A similar phenomenon can likely be expected when the reduction potential of the added species is more positive than the proton reduction potential. The combined results suggest that long-lived holes are a requirement for photocatalytic water oxidation regardless of the material, likely a consequence of the fact that four holes are needed for complete water oxidation to O2, and a long time is required for water molecules to (consecutively) come into contact with four photoexcited holes.
The above described work demonstrates that long-lived holes are essential for O2 production from water splitting, and highlights that strategies such as co-catalyst loading are crucial in photocatalysis to promote electron–hole separation and enhance chemical reactions.66,67 Although the suppressed recombination has been well correlated with higher photocatalytic activity for various reactions in a range of photocatalysts,68–71 it is important to note that a longer charge carrier lifetime does not guarantee better photocatalytic activity. Sieland et al. found that although the photocatalytic degradation of NO was more efficient for TiO2 samples with a longer charge carrier lifetime, acetaldehyde degradation was independent of charge carrier lifetime for the same samples, because acetaldehyde strongly adsorbs to TiO2 whereas NO adsorbs relatively weakly, and charge transfer between TiO2 and acetaldehyde was fast enough to be unaffected by charge carrier lifetimes observed over μs-timescales.72 Interestingly, Sieland et al. found that longer charge carrier lifetimes in TiO2 actually correlated with lower photocatalytic conversion of acetaldehyde, although the actual reason was not clear.73 Patrocinio reported that their TiO2 sample exhibiting faster recombination had higher efficiencies for photocatalytic oxidation, attributed to its larger surface area that offsets poorer electronic properties.74 However, interestingly, the sample surface area had little effect on H2 evolution, and the efficiency of electron transfer (ET) from TiO2 to platinum co-catalysts was the primary factor affecting photocatalytic performance for H2 evolution.74 In another detailed study, Wang et al. used TAS to investigate charge carrier kinetics in dense and mesoporous anatase and rutile TiO2 films, and found that although photoexcited charge carriers were longer-lived in rutile under inert conditions, anatase was more photocatalytically active,48 as will be rationalised below. It was found that charge carrier recombination was independent of sample morphology, but the mesoporous films unsurprisingly exhibited significantly higher photocatalytic activity than the dense samples, attributed to the larger surface area of the mesoporous samples.48 All subsequent discussions will focus on the mesoporous films. TAS revealed that in the presence of methanol, holes in anatase were almost completely scavenged over the pre-μs timescale, but only about 2/3 of holes in rutile were scavenged before 10 μs. In addition, the half-life of electrons increased in the presence of methanol from 100 μs to 0.7 s for anatase TiO2 but only increased marginally for rutile, which was interpreted as that methanol oxidation over rutile was readily reversible, therefore relatively ineffective at extending the electron lifetime. It was thus deduced that the comparatively high photocatalytic activity for dye reduction over mesoporous anatase was due to rapid and irreversible scavenging of holes by alcohol, which extended the electron lifetime sufficiently for dye reduction to take place with a 62% quantum yield. The electron lifetime was extended to a lesser extent in rutile; therefore, its dye-reduction activity was lower (1.9% quantum yield). Furthermore, no dye reduction took place in the absence of hole scavengers, attributed to dye reduction requiring a longer time than recombination timescales in the absence of hole scavengers.48 One of the main findings of this study is similar to our findings described earlier,46 in that the use of scavengers to extend the lifetime of electrons/holes is essential for photocatalytic reduction/oxidation reactions with slow kinetics. Also, the study by Wang et al.48 highlighted that charge carrier lifetimes measured under inert conditions do not necessarily correlate with photocatalytic activity, but TAS studies in the presence of hole scavengers revealed that for good photocatalytic activity, the time it takes for interfacial charge transfer must be comparable to the charge carrier lifetime. Similar to the work by Wang et al.,48 Sachs et al.76 also investigated the effect of morphology on charge carrier behaviour in anatase and rutile TiO2, and found that dense and mesoporous samples exhibit similar TA decay kinetics, taken to indicate that surface-mediated recombination was insignificant, which was identified as a potential key factor contributing to the good photocatalytic performance of TiO2.75
3.3 Polymeric materials
Following recent intensive studies on graphitic carbon nitride (g-CN) as a metal-free photocatalyst, TAS has been extensively applied to understand charge carrier behaviour in various g-CN based materials. However, in contrast to TiO2, systematic studies on the absorption characteristics of photoexcited charge carriers in g-CN are limited, and there is significantly more variability in the literature reports of TA characteristics of g-CN, as will become evident through later discussions. There has been evidence that positive TAS signals around 510 and 700 nm are primarily due to photoexcited holes and electrons in g-CN, respectively.76 However, a separate thorough TAS investigation of g-CN did not conclusively determine the absorption characteristics of holes in g-CN, while positive TAS signals in the visible and near-IR regions were suggested to be dominated by electrons.77More interestingly, different amounts of negative and positive contributions to the TAS signal of g-CN have been reported, with direct consequences on photocatalytic behaviour. TAS was first applied to study g-CN in 2015, and the TA signals after 388 nm excitation were found to be dominated by negative contributions from stimulated emission up to the longest measured time-delay of 1.5 ns.78 As only negative signals were observed throughout the entire probe wavelength range of 450–700 nm, and stimulated emission has the same physical origin as spontaneous emission observed in photoluminescence (PL), the kinetic curves obtained from TAS and time-resolved PL were integrated over the entire wavelength range and combined into one kinetic trace for analysis. Power-law kinetics was observed to span from ps timescales to at least μs timescales. Upon theoretical considerations which are not detailed here, the empirically observed kinetics was attributed to geminate recombination of charge carriers that predominately move along the interplanar direction.78 This is in contrast to the first/second order decay observed for TiO2 over similar timescales.43,44 However, in the same year, Lan et al.79 and Ye et al.80 reported positive TAS signals for g-CN, as shown in Fig. 5(a) and (b), respectively. Lan et al. found that their TA kinetics observed over ns timescales was well-fitted by a single exponential decay function with a time-constant of 130.3 ns,79 as shown by the red trace in Fig. 5(a). However, one can see from Fig. 5(a) that the kinetics is initially dominated by a negative signal which rapidly becomes positive over the ns timescale; therefore, these data do not contradict the negative TAS signals observed by Merschjann et al. over sub-ns timescales. On the other hand, no negative region can be seen in Fig. 5(b) at all, which could be due to the ≤ns negative signal region being missed as a result of the μs time-resolution. Consistent with the conjecture that the TA signal is negative over ≤ns timescales but positive over longer timescales, we observed that g-CN exhibited a negative TAS signal in the visible region that persisted for beyond 5 ns after photoexcitation (Fig. 5(c)), but only a positive TAS signal was observed in the visible region over ≥μs timescales (Fig. 5(d)), which was preliminarily attributed to photoelectrons.77 Also, recently we directly observed negative TA signals becoming positive over the ns timescale for g-CN, as shown by the ref-g-C3N4 trace in Fig. 5(e).81 The negative TAS signals exhibited by g-CN over ≤ns timescales are in stark contrast to TiO2, which showed only positive signals over all timescales after photoexcitation.
 | ||
| Fig. 5 Transient absorption (TA) characteristics of g-CN. (a)79 Kinetics monitored at 500 nm after 355 nm excitation, (b)80 kinetics monitored at 700 nm after 410 nm excitation (black line), (c)77 spectra at ≤ns timescales after 355 nm excitation, (d)7 spectra at >ns timescales after 355 nm excitation, and (e)81 kinetics monitored at 660 nm after 355 nm excitation. Panel (f)77 is a schematic of dynamic equilibrium between electrons in shallow emissive states (EM) and trapped charge separated states (CS), with the electrons becoming trapped deeper with increasing time (darkening shade of red). Further note: the red trace in (a) is a single-exponential fit to the data (time-constant = 130.3 ns). The green trace in (b) is TA kinetics for protonated g-CN. Legends in panels (c) and (d) represent the time-delay. The ref-g-C3N4 trace in (e) corresponds to the standard g-CN sample, and the def-g-C3N4-1/2/5 traces correspond to samples ultrasonicated for 1/2/5 hours to introduce defects. The unidirectional arrows in (f) represent interfacial ET events. Overall, TAS in g-CN evolves from negative with ns-resolution (panel a, and detailed information in panel c) to positive with μs-resolution (panel b and detailed information in panel d) after photoexcitation. Panel (e) shows the transfer of the standard g-CN (ref-g-C3N4) as a photoanode exhibiting positive TAS signals to defective g-CN as a photocathode exhibiting significant negative TAS signals. The scheme in panel (f) suggests that electrons in shallow EM mostly become deeply trapped in charge separated states (CS) over μs timescales, and these deeply trapped electrons do not have enough reducing potential to be transferred to surface electron-accepting species. Fig. 5a is reproduced from ref. 79, with permission from The Royal Society of Chemistry, copyright 2015. Fig. 5b, c and d are reproduced from ref. 80, 77 and 81, with permission from American Chemical Society, copyright 2015, 2017 and 2020, respectively. | ||
Following from the above, the evolution of the TA signal for g-CN over the ns-timescale can be rationalised with a trapping model proposed by us, in which electrons in shallow emissive states close to the CB are in thermal equilibrium with deeply trapped electrons.77 It was proposed that upon photoexcitation, shallow emissive states become populated, and electrons in these states may undergo radiative recombination or become deeply trapped with energy losses around 1 eV, as shown by the schematic in Fig. 5(f).77 As such, it is plausible that immediately after photoexcitation electrons mainly reside in shallow emissive states, resulting in negative TAS signals over sub-ns timescales, but most of these electrons become deeply trapped over the ns timescale, resulting in positive TAS signals over longer times. This is consistent with our recent observation that there are significant negative contributions to the TA kinetics of g-CN (monitored with 660 nm probe) at time delays of <50 ns, which was used to deduce that the lifetime of electrons in shallow emissive states was <50 ns.81 The significance of these positive and negative TAS signals for photocatalysis will be explored in the next section.
In contradiction to the above discussions, Zhang et al. reported positive TAS signals for g-CN between 510 and 650 nm over ps timescales after 450 nm excitation, and between 470 and 700 nm after 395 nm excitation.82 Also, Corp et al. only observed a negative TAS signal between 420 and 550 nm over ps timescales (up to 5 ns) after 365 nm excitation, whilst a positive signal was prominent for wavelengths >600 nm.83 To rationalise these observations, we speculate that the relative energetic positions and distributions of the emissive states might be different in the g-CN samples prepared in different studies, resulting in a slightly different wavelength at which negative contributions from stimulated emission exactly cancel with positive contributions from excited-state absorption. Furthermore, whilst the spectra recorded ps after photoexcitation reported by Corp et al.83 and μs after photoexcitation reported by Godin et al.77 (Fig. 5(c)) were qualitatively similar, in that a negative signal was observed at shorter wavelengths and an increasing positive signal towards longer wavelengths in the near-IR region, the spectra reported by Zhang et al.82 are drastically different from both. This could be attributed to the different sample preparation methods adopted in the different studies – while Corp et al.83 and we77 dispersed g-CN samples in water, Zhang et al.82 thermally treated g-CN in aqueous tetraethylammonium hydroxide at 100 °C to obtain a stable transparent colloid solution. The colloid solution obtained82 appear to quench the TA signal at longer probe wavelengths, which could either be due to the states responsible for the positive TA signal at near-IR wavelengths being eliminated or ultrafast (sub-ps) charge transfer to tetraethylammonium hydroxide. We thus highlight that the sample preparation conditions are an important factor in TAS measurement and interpretation.
COFs are a group of increasingly popular polymeric photocatalysts,84 to which TAS has been applied to provide a variety of insights into charge carrier behaviour. Exciton–exciton annihilation has been identified in COFs,85,86 and Jakowetz et al. proposed that free charges were generated upon exciton–exciton annihilation, which then become trapped charges with lifetimes in the order of tens of microseconds.85 More extensively, TAS has been used to elucidate charge dynamics in donor–acceptor (D–A) COF assemblies, including ultrafast ET from donors to acceptors and the lifetimes of resulting excited states.87–90 However, the role of processes and photoexcited species reported in the literature has not been thoroughly investigated in the context of photocatalysis, which we note might be a worthwhile future study. Many above-mentioned literature studies reported boron-containing COFs,86–88,90 while an imine-based COF was also reported.85 A notable subgroup of COFs, covalent triazine frameworks (CTFs), have also been relatively extensively investigated using TAS.91–94 For example, Yang et al. used TAS to deduce that the incorporation of a rhenium complex onto the CTF extended the charge recombination time from 19.4 ps in unmodified CTF to 171 ps in Re-CTF.91 Similarly, Zhang et al. used TAS to measure the photoexcited lifetime of a novel CTF system, determined to be 0.3764 ps.92 However, the implication of this lifetime on photocatalysis was not made clear. In addition, the stability of CTF under strong laser pulses is a concern which could limit the reproductivity of these studies.
Another group of polymer-containing photocatalysts are metal organic frameworks (MOFs), to which TAS has similarly been applied to elucidate the behaviour of photoexcited charges, including charge transfer between different building blocks of MOFs and lifetimes of photoexcited species.95–98 For example, Laurier et al. used TAS to deduce that long-lived holes with a lifetime of c.a. 2 μs were generated on the linkers of a series of Fe(III)-MOFs.96 Solutions containing only Fe(III) groups or linkers exhibited no TAS signal at 0.4 μs after 355 nm excitation,96 which might be indicative of ultrafast recombination in the absence of interaction between Fe(III) groups and linkers.
3.4 Rationalising photocatalytic activity of typical polymers
It has repeatedly been observed that g-CN samples with a larger amount of long-lived positive TAS signals exhibit lower photocatalytic activity; these signals were accordingly attributed to less active deeply trapped charge carriers.77,100 Kuriki et al. provided direct evidence that positive TAS signals in the visible to near-IR region corresponded to deeply trapped electrons. It was found that Ag-loaded g-CN exhibited faster TA decay kinetics than g-CN, attributed to electron scavenging by Ag.101 The accelerated decay was less pronounced at shorter probe wavelengths, suggesting that deeply trapped electrons were less able to be transferred to Ag; thus there was less difference in the decay kinetics between Ag-loaded and pure g-CN at shorter probe wavelengths.101 Given the observation that deeply trapped electrons are less able to be transferred to Ag from g-CN, it is unsurprising that samples with a higher concentration of deep trapped electrons, identified by long-lived (>μs) positive TAS signals, have lower photocatalytic activity, as more charges become deactivated by deep trapping rather than contribute to interfacial charge transfer required for photocatalysis to take place.77Different from the long-lived charge carriers (>μs) in g-CN which are deeply trapped and negatively contribute to the photocatalytic activity, Lan et al. found that short-lived charges (ns timescales) observed with the 500 nm probe were positively correlated with photocatalytic activity for Rhodamine B degradation.79 Furthermore, Lan et al. found that these short-lived charge carriers with ns lifetimes obeyed single-exponential decay kinetics, while both Walsh et al.100 and our group77 observed power-law decay kinetics over long timescales (≥ μs). This suggests that positive TAS signals observed over ns timescales and ≥μs timescales likely correspond to intrinsically different charge carriers, with those observed over ns timescales being more photocatalytically active. We speculate that the positive signals observed over ns timescales are excitonic in nature, which is expected to exhibit single-exponential decay kinetics in the absence of exciton–exciton annihilation, and these excitons later separate and become deeply trapped over >ns timescales. However, we monitored the TA kinetics of g-CN over ns–ms timescales but did not identify a single-exponential decay component after the initially negative TAS signal became positive. Instead, we observed that the positive TAS signal obeyed a power-law decay from c.a. 50 ns after photoexcitation.81 This difference might be due to the different g-CN preparation methods adopted in the different studies – whereas Lan et al. calcined melamine at 550 °C for 4 hours, we heated DCDA at 600 °C for 20 minutes.
Very recently, we observed that the TAS signal of g-CN that behaved as a photoanode was drastically different from that of g-CN that exhibited photocathode behaviour for water splitting.81 This was rationalised using the previously identified two distinct populations of electrons – those that are in shallow emissive states close to the CB responsible for negative TA signals and those that are deeply trapped responsible for positive TA signals. It was observed that the photoanode material exhibits negative TAS signals which became positive over ns timescales after photoexcitation (the ref-g-C3N4 trace in Fig. 5e), whilst the photocathode material maintained a significant negative TAS signal tens of microseconds after photoexcitation (the def-g-C3N4-1 trace in Fig. 5e). We thus concluded that the lifetime of shallow trapped electrons was extended by 3 orders of magnitude in the photocathode compared to the photoanode. This is consistent with the observed photoelectrode properties of these materials, i.e. the photocathode material had a significant population of long-lived electrons with high reducing potentials to facilitate reduction reactions, whereas the photoanode mainly contained deeply trapped electrons from ns-timescales onwards after photoexcitation. In addition, these deeply trapped electrons were incapable of partaking in reduction reactions for water splitting.81
Other polymeric materials mentioned in the previous section have more straightforward links between photocatalytic activity and TAS results. For CTFs, longer TAS lifetime normally corresponds to higher photocatalytic activity. For example, a recent study found that CTF with higher crystallinity possessed longer lifetime of photoexcited charge carriers; therefore, it was deduced that CTF with higher photocatalytic hydrogen evolution activity could be attributed to their higher crystallinity structure.93 Also, Guo et al. used TAS to compare charge carrier kinetics in a donor–acceptor (D–A) CTF system and a D–A1–A2 (dual acceptor) CTF system, and found the charge carrier lifetime to be extended by a factor of c.a. 3 in the D–A1–A2 system. A more efficient charge separation and subsequent suppressed recombination was used to rationalise the high quantum yield and good photocatalytic H2 evolution rates exhibited by the D–A1–A2 system.94
Similar to other materials, MOFs exhibiting slower TA decay kinetics can be interpreted as possessing longer-lived excited-states, leading to higher photocatalytic activity.96,98 However, as before, alternative interpretations of TA signals are possible. Yan et al. used TAS to observe charge transfer between the two building blocks of a MOF consisting of Eu(III)2 clusters and Ru(phen)3-derived ligands. The decay of ESA in the MOF was found to be significantly faster than that in the pure ligand, therefore was interpreted as ET from the ligands to Eu(III)2 clusters with a time constant of 1.2 ns.95 In addition, the recovery of a GSB signal was interpreted as back ET from the Eu(III)2 clusters to the ligand, which occurred over timescales ≫7 ns. This comparatively slow back ET was used as an evidence for effective charge separation in the MOF, which enabled efficient photocatalytic CO2 reduction.95 Also, interestingly Ma et al. found that for a series of UiO-66-NH2 MOFs with controlled structural defects, TA lifetimes were inversely correlated with photocatalytic H2 evolution from water splitting, with the sample exhibiting the fastest relaxation time possessing the highest photocatalytic activity.99 This is similar to observations sometimes made for other photocatalysts discussed earlier. Ma et al. interpreted the faster relaxation time to be indicative of higher charge separation efficiency,99 analogous to the transfer of photoexcited electrons from ligands to Eu(III)2 clusters mentioned earlier.95 However we speculate that the faster relaxation time reported99 could alternatively be due to faster interfacial charge transfer from the MOF to surface-adsorbed species, as their TAS were performed under ambient conditions and it was not clear whether any solvents were used.
4. Complementary investigation by TRIR
As a visible-NIR probe is usually employed in TAS, this technique does not yield significant structural information on the various chemical states/intermediates involved and is hindered by spectral overlap of different contributions outlined in Section 2. Contrary to TAS, TRIR signals do not usually have contributions from GSB and SE, because most photocatalysts have a bandgap (related to GSB) in the visible/UV region and exhibit photoluminescence (related to SE) in the visible region. As such, using TRIR the dynamics of photoexcited charges can be directly monitored without unwanted contributions from GSB and SE. Apart from monitoring photoexcited charges, TRIR is also useful for investigating molecular and materials dynamics, in particular to study connections between photoinduced charge transfer and structural/vibrational changes associated with reaction intermediates. Compared with TAS, relatively fewer studies on heterogeneous photocatalysis have been carried out using TRIR due to its complexity. This section is devoted to discussing the application of TRIR in heterogeneous photocatalysis with respect to the limited references, and underlines the significance and challenges faced in the observation of reaction intermediates using TRIR.4.1 TRIR studies on intrinsic photocatalysts
TRIR has been used to examine reaction intermediates and photoexcited charge carriers in intrinsic semiconductor photocatalysts, in particular inorganic materials. In a recent study on a TiO2 anatase nanoparticle film using TRIR, Weng et al. reported that the energy levels within the CB were almost continuously distributed, and the energy levels within the CB had enough vacancies to accept the photoexcited electrons.102 The Fermi level of anatase TiO2 nanoparticles was determined to be 1.41 eV below the CB by TRIR, and the lowest trap state level was 0.86 eV above the Fermi level or 0.55 eV below the CB. More than 20 trap states were also found beneath the Fermi level, and 7 localized excited states below the CB. This case of study demonstrated that TRIR is capable of systematically characterizing midgap energy levels in semiconductor photocatalysts. In addition, the near IR spectroscopy can also provide complementary information to TRIR,103 in which we found that the free or shallow trapped photoelectrons in TiO2 could be monitored readily using near IR spectroscopies.Higher photocatalytic activity was found for mixed-phase TiO2 of anatase and rutile compared to their pristine compositions, which was proposed to be related to charge separation between the two phases. However, there has been extensive discussion regarding the charge transfer direction between anatase and rutile. Some researchers hold the point that electron migration occurs from rutile to anatase,104–107 while others believe the transfer direction is from anatase to rutile.108–111 Investigation to clarify this was performed using TRIR. Li et al. tested the kinetics of photoinduced electrons on anatase, rutile, and anatase–rutile mixed phase TiO2 under vacuum or methanol vapor using TRIR. They found that in mixed phase TiO2, photogenerated electrons in the CB and shallow trap states of anatase transferred to rutile within 50 ns after excitation, and methanol hole scavenger enhanced this transfer by prolonging electron lifetimes. However, the author claimed that due to complicated energy levels and trapped states in mixed phase TiO2, the ET from rutile to anatase could be not excluded.112
TRIR has also been utilized to study the ion dynamics in solids such as halide perovskites. Oliver et al. examined the role of the organic formamidinium cations in formamidinium lead iodide perovskite. Formamidinium cation reorientation was observed to occur with time constants of 470 ± 50 fs and 2.8 ± 0.5 ps. The rapid reorientation ruled out the existence of long-lived (anti)-ferroelectric species, and was likely explained by large polaron formation or Rashba splitting.113 Schaller et al. studied the heat dissipation in both CH3NH3PbI3 and (CH)N2H4PbI3 films upon high energy density optical excitation and observed inter-sub-lattice thermal equilibration on timescales ranging from hundreds of ps to a couple of ns by TRIR.114 Asbury et al. examined the structural origins of the long charge carrier lifetimes of halide perovskites, suggesting that the slow charge recombination was due to the formation of energetic barriers, which hindered wavefunction overlap of oppositely charged carriers in large polaron states.115
4.2 TRIR studies on the effect of cocatalysts and reaction intermediates
Cocatalyst loading can facilitate charge separation and change the reaction pathway, intermediates, and charge states. The effect of different cocatalysts on charge separation and reaction intermediates can be monitored by TRIR. The effect of inorganic and molecular cocatalysts and their influence on the reaction pathways will be addressed in this section.In LaTiO2N, the lifetime of excited electrons can be enhanced with deposition of either cobalt oxide (CoOx) or IrO2, as elucidated by TRIR spectroscopy using absorbance at 2000 cm−1 as a typical signal of excited electrons (Fig. 6a). It is suggested that both CoOx and IrO2 play a role in separating the photogenerated electrons from holes. In particular, the relative concentration of holes and electrons in LaTiO2N changed significantly upon CoOx loading by capturing holes rapidly within a few ps, and thus prolonged the lifetimes of electrons up to the order of seconds. This explains the higher photocatalytic performance of LaTiO2N modified with CoOx for the oxygen evolution reaction than that modified with IrO2.116 The behaviour of photogenerated electrons and holes on Pt coloaded LaTiO2N was also compared with CoOx coloaded LaTiO2N using TRIR (Fig. 6b). Different from CoOx coloaded LaTiO2N, Pt was proved to capture photogenerated electrons within 100 μs.117
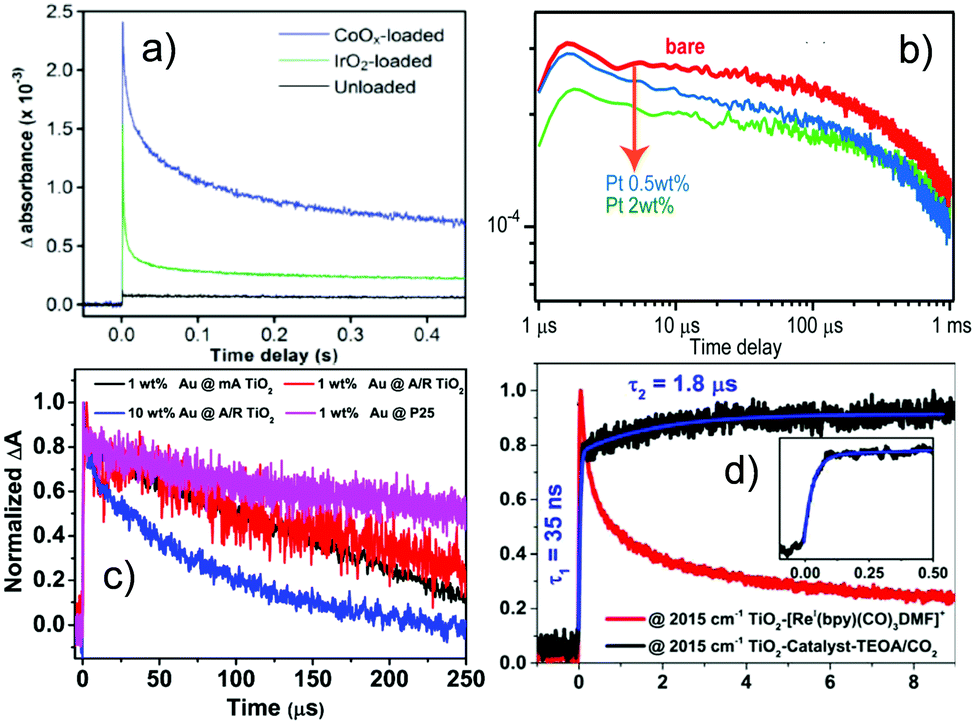 | ||
| Fig. 6 TRIR results on the effect of cocatalysts and charge kinetics. (a) Decay of photogenerated electrons on LaTiO2N with and without cocatalysts, monitored at 2000 cm−1. Both cocatalysts CoOx and IrO2 play a crucial role in separating the photogenerated electrons from holes, resulting in the lifetime of electrons up to seconds timescale on the CoOx loaded photocatalyst.116 (b) Decay of transient absorption for bare, CoOx and Pt-loaded LaTiO2N photocatalysts measured in air monitored at 2000 cm−1, indicating that the cocatalyst Pt can capture photoelectrons within 100 μs.117 (c) Normalized decay curves of TRIR absorption for the photoelectrons in P25 and different Au/TiO2 catalysts upon excitation by the 532 nm laser and monitored at 1200 cm−1, where 1 wt % Au @ mA TiO2 means AuNPs 1% on modified anatase TiO2, 1 wt % Au @ A/R TiO2 means AuNPs 1% on anatase/rutile mixed TiO2, 10 wt % Au @ A/R TiO2 means AuNPs 10% on anatase/rutile mixed TiO2 and 1 wt % Au @ P25 means Au 1% on P25. Electrons injected from Au into TiO2 upon plasmon excitation show a lifetime of hundreds of μs.118 (d) Traces at 2015 cm−1 for the TiO2 catalyst (red) and the TiO2 catalyst in the presence of TEOA and CO2 (black) up to 10 μs (inset shows the rising component),124 indicating that compared to the sample without TEOA/CO2, the system with TEOA/CO2 showed long lived photoelectrons in TiO2 after their injection from the bonded molecular catalyst, where the reduced catalyst formed at 35 ns following by a slow rise (1.8 μs). (a, b, c and d) were reproduced from ref. 116, 117, 118 and 124, with permission from American Chemical Society, copyright 2012, 2014, 2019 and 2017, respectively. | ||
The decay kinetics of photogenerated electrons in Au/TiO2 generated upon 355 nm or 532 nm excitation has been monitored by TRIR spectroscopy. Under 355 nm irradiation, the longer lifetime of photogenerated electrons observed in Au/TiO2 compared to that in bare TiO2 was due to the enhanced charge separation and the suppressed recombination by Au nanoparticles. With 532 nm irradiation (Fig. 6c), long-lived (hundreds of μs) electrons produced by electron injection from Au into TiO2 upon plasmon excitation were detected. It is therefore suggested that Au/TiO2 could be photocatalytically activated under visible light irradiation, which is very appealing. It was also found that the phase composition of TiO2 affected the photogenerated electrons excited by UV light, while the injected photoelectrons were not so sensitive to the phase composition when excited by visible light, which depends on whether TiO2 is directly excited or light absorption is due to surface plasma.118
Nanosecond transient IR spectra were acquired on Pt deposited on C3N4 hollow spheres using the step-scan FTIR. In the absence of scavengers, the transient IR signal was observed around 200 ns, which was quenched with addition of the electron scavenger, indicating that the signals were from photoexcited electrons.119 Liu et al. prepared C3N4/TiO2 heterojunction samples with sub-15 nm size and unravelled using TRIR that the lifetime of photogenerated carriers was prolonged,120 compared to that of assembled TiO2/C3N4 hybrid nanostructures.121 It was interpreted that TiO2 acted as the bridge to photon-to-electron conversion. Overall, the solar-to-hydrogen conversion efficiency was improved with an enhanced apparent quantum yield (AQY) of 6.9% under 405 nm irradiation.
Doping is another commonly adopted strategy for enhancing photocatalytic activity. To understand the reason behind the improved performances of doped photocatalysts, TRIR plays an important role. Onish et al. examined the electron–hole recombination kinetics in NaTaO3 photocatalysts doped with Ca, Sr, Ba, and La using TRIR.144 Upon irradiation, the NaTaO3 photocatalysts doped with the alkali earth elements displayed monotonous IR absorption, which was assigned to photoexcited electrons. The absorbance at time delays of 1 μs or later was enhanced (Fig. 7c) following a decreasing order from Sr, Ba to Ca. The same order of enhancement was observed for H2 production rates. It was thus concluded that electron–hole recombination was suppressed by the alkali earth element dopants, with the degree of suppression decreasing from Sr, Ba, to Ca. SrTiO3 photocatalysts doped with Rh and Sb have also been studied by TRIR. The doped and undoped photocatalysts both exhibited TRIR signals due to photoexcited electrons. The normalized absorbance decay is presented in Fig. 7c. The recombination pathways were different during early and later time delays. It was reported that within 1 μs the recombination was related to the direct, geminate recombination of electrons and holes, whilst over slower timescales, trapping–detrapping cycles dominate, consistent with the TAS results summarised earlier. These different recombination pathways led to the decay rate being sensitive to the dopant composition over fast timescales (<1 μs), but insensitive over slow timescales (>1 μs). As shown in Fig. 7d, Rh-doped SrTiO3 exhibited the fastest decay, supporting the role of Rh4+ as an active centre for recombination, resulting in no photocatalytic O2 production. The introduction of Sb changed the oxidation state of Rh to 3+, resulting in delayed TRIR decay of the photoexcited electrons, which suggest that Rh3+ retarded charge recombination,145 thus allowing the sluggish O2 evolution reaction to take place.
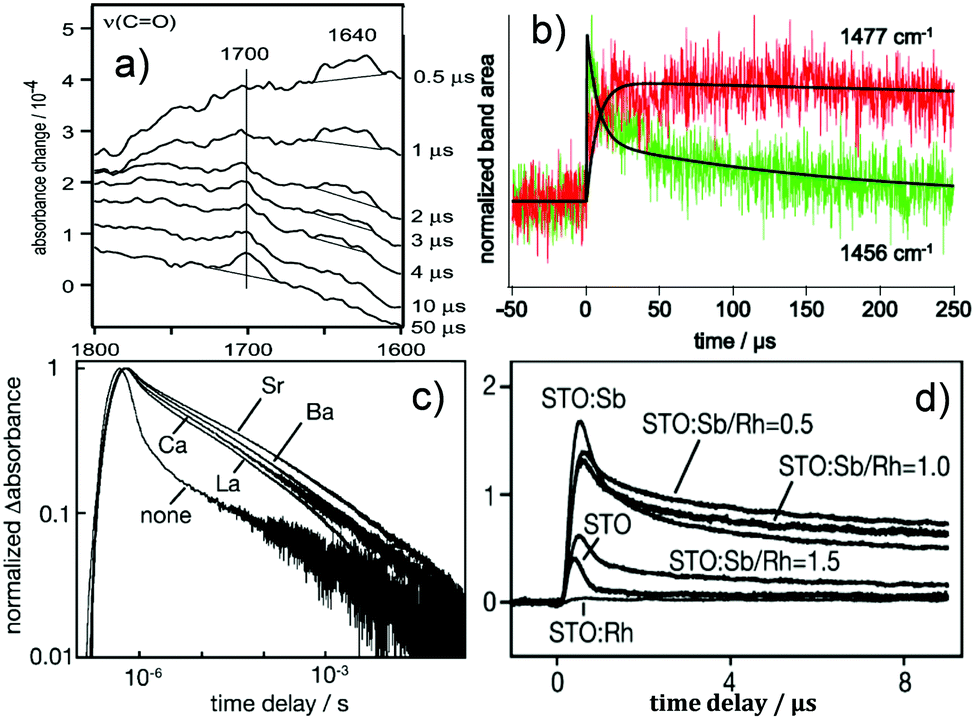 | ||
Fig. 7 TRIR results on the reaction intermediates and doping. (a) The vibrational spectrum of the transient chemical species produced during the oxidation of 2-propanol. The Pt/TiO2 (P-25) in the solution was irradiated by the 355 nm light pulse, where the growth of C![[double bond, length as m-dash]](https://www.rsc.org/images/entities/char_e001.gif) O was seen at 1700 cm−1 and the anion radical of acetone appeared around 1640 cm−1.139 (b) Temporal profiles of intermediate t-butyl radical (1456 cm−1) and product isobutane (1477 cm−1) for pivalic acid degradation on a Pt/TiO2 photocatalyst with fitting lines,140 (c) Normalized absorbance change was monitored at 2000 cm−1 as a function of time delay. Nondoped photocatalyst SrTiO3 and doped photocatalysts with La of 2 mol%, Ca of 2 mol %, Sr of 2 mol %, and Ba of 2 mol %. The absorbance at time delays of 1 μs or later was enhanced due to doping following the order of Sr > Ba > Ca.144 (d) Infrared absorbance was monitored at 2000 cm−1 as a function of the time delay on doped SrTiO3. Rh-doped SrTiO3 exhibited the fastest decay, supporting the role of Rh4+ as an active centre for recombination, while the introduction of Sb showed delayed decay of the photoexcited electrons, suggesting that Rh3+ retarded charge recombination.145 (a) is reproduced from ref. 139, with permission from Springer, copyright 2005. Fig. 7(b) is reproduced from ref. 140, with permission from Elsevier, copyright 2013. (Fig. 7c and d) are reproduced from ref. 144 and 145, with permission from American Chemical Society, copyright 2009 and 2013, respectively. O was seen at 1700 cm−1 and the anion radical of acetone appeared around 1640 cm−1.139 (b) Temporal profiles of intermediate t-butyl radical (1456 cm−1) and product isobutane (1477 cm−1) for pivalic acid degradation on a Pt/TiO2 photocatalyst with fitting lines,140 (c) Normalized absorbance change was monitored at 2000 cm−1 as a function of time delay. Nondoped photocatalyst SrTiO3 and doped photocatalysts with La of 2 mol%, Ca of 2 mol %, Sr of 2 mol %, and Ba of 2 mol %. The absorbance at time delays of 1 μs or later was enhanced due to doping following the order of Sr > Ba > Ca.144 (d) Infrared absorbance was monitored at 2000 cm−1 as a function of the time delay on doped SrTiO3. Rh-doped SrTiO3 exhibited the fastest decay, supporting the role of Rh4+ as an active centre for recombination, while the introduction of Sb showed delayed decay of the photoexcited electrons, suggesting that Rh3+ retarded charge recombination.145 (a) is reproduced from ref. 139, with permission from Springer, copyright 2005. Fig. 7(b) is reproduced from ref. 140, with permission from Elsevier, copyright 2013. (Fig. 7c and d) are reproduced from ref. 144 and 145, with permission from American Chemical Society, copyright 2009 and 2013, respectively. | ||
Fullerenes can be utilised as a component in artificial photosynthetic systems, and their function as an electron acceptor has also been clarified by TRIR. Lebedeva et al. incorporated a C60–fullerene electron acceptor moiety into a catecholate–Pt(II)–diimine photoactive dyad, which contained a strong electron donor. After injection of a photoelectron to the fullerene, the subsequent stabilisation of a charge-separated state in a donor–acceptor assembly was achieved with a lifetime of 890 ps.122
Molecular catalysts are also frequently attached to TiO2 or NiO to promote photocatalytic activity. For instance, upon attaching the phosphonated molecular catalyst [ReIBr(bpy)–(CO)3]0 to TiO2, the visible-light-driven reduction rate of CO2 to CO was remarkably enhanced in dimethylformamide with triethanolamine (TEOA) as a sacrificial electron donor.123 Using TRIR spectroscopy, it was unveiled that electron injection from the excited molecular catalyst to TiO2 was followed by rapid (ps–ns) and efficient regeneration of the ReI center by the attached TEOA ligand. Thereafter, a second ET occurred from the TEOA radical cation to the molecular catalyst over the course of 35 ns, producing the singly reduced [ReI(bpy−)(CO)3L] species. Compared to the excited metal to ligand charge transfer (MLCT) state on ZrO2 or in a homogeneous solution, the photocatalytic activity increased when the molecular catalyst was attached to TiO2. It could be explained by the slow charge recombination and high oxidative power of the ReII species after electron injection resulted in a more efficient reaction with TEOA (Fig. 7d). It was suggested that TiO2 worked as an electron reservoir that was able to accept, save, and give the electrons back to the molecular catalyst and thus to help complete the photoreduction of CO2.124–127 In addition, the salt [nBu4N]2[Mo2(DAniF)2(TTh–CO2)2], where TTh–CO2 =2,2′:5′,2′′-terthienyl-5,5′′-dicarboxylate, has been attached to TiO2 nanoparticles.128 A broad TRIR signal was observed for the system and attributed to the photoinduced ET from the adsorbate to TiO2.129–131 ET from the unrelaxed 1MLCT state of the Mo2 complex to TiO2 occurs within 100 fs. Decay of the TRIR signal for Mo2@TiO2 was fitted to obtain time constants of 5 ps (τ1), 50 ps (τ2), ∼600 ps (τ3), and the estimated lifetime >3 ns (τ4). τ1 may result from a reduced 1MT lifetime of the bound species. τ2 correlates with the cooling of the “hot” electron within the CB.132 Both τ3 and τ4 may be assigned to back ET.133–135 Gibson et al. developed an integrated photocatalyst, where polypyridyl Ru(II) complexes were linked with ester groups on the peripheral ligands and the photocatalyst was loaded on a NiO substrate as a photocathode. TRIR studies for the complexes immobilised on NiO surfaces detected depletion of the carbonyl group and the 3MLCT excited state species, demonstrating the rapid photoinduced ET from NiO to the adsorbed photocatalyst. Besides, a signal was seen in the range of 1750–1810 cm−1 within the excitation pulse, while its kinetics and assignment were unclear due to weak intensity.136
As an alternative to molecular photosensitizers, colloidal quantum dots (QDs) have also been used for building inorganic–organic hybrid systems for photocatalysis as a cocatalyst, charge acceptor or both.146 Tian et al. covalently linked a rhenium bipyridine complex to CuInS2 QDs for photocatalytic CO2 reduction.137 Within 300 fs after photoexcitation, the reduced form of the Re catalyst was observed at 2012 cm−1, which was red-shifted from the GS of the CO stretching band. Compared to the mixture of the QDs and the Re catalyst, the efficient ET in the covalently linked hybrid system led to the enhanced photocatalytic activity for CO2 reduction. A similar tendency was also reported in an earlier study by Lian et al. on exciton dissociation dynamics of CdSe QDs adsorbed to Re(CO)3Cl(dcbpy), and suggested ET from the semiconductor QDs to the Re catalyst.138
TRIR is also very useful for obtaining “fingerprint” information on reactive intermediate species by detecting the characteristic band(s) involved. Some successful cases of using TRIR for recognizing photocatalytic intermediates will be outlined. Onishi et al. used TRIR to monitor the aqueous (D2O) phase oxidation of 2-propanol on Pt/TiO2,139 where the growth of CO was observed at 1700 cm−1, and the anion radical of acetone appeared around 1640 cm−1 and decayed within 4 μs (Fig. 7a). Photodegradation of pivalic acid [(CH3)3CCOOH] on a Pt/TiO2 photocatalyst was also studied by TRIR over μs to ms timescales, where the t-butyl radical was detected at 1456 cm−1 and the product was analysed to be isobutane appearing at 1477 cm−1. The decay curve of the radicals could be fit using a biexponential function with lifetimes of 7.3 and 180 μs. The lifetime of 7.3 μs coincided with the growth of isobutane, while the process correlating with 180 μs was uncertain (Fig. 7b).140 Frei probed two intermediates of water oxidation catalysed by Co3O4; one was attributed to a surface superoxide (three-electron oxidation intermediate absorbing at 1013 cm−1), and the other at 840 cm−1 to one-electron oxidation intermediate.141 On investigating CH3NH3PbI3 planar-hetero-junction solar cells, Shigeto had a chance to observe the cation species of the hole-transporting material at 1485 cm−1 with a lifetime of 1.0 μs. This intermediate is associated with interfacial charge recombination and thus allows the charge recombination at the perovskite/hole-transporting material interface to be studied.142 On the other hand, a synthetic pyridylphosphole–appended [FeFe]hydrogenase mimic was encapsulated inside a supramolecular zinc porphyrin–based Fe4(Zn–L)6 metal–organic cage structure and was investigated by TRIR. When selectively exciting the cage, the mono–anion species at 1958 and 2022 cm−1 was seen by the TRIR spectra, which is attributed to the photoexcited electron of the porphyrin cage transferring to the encapsulated catalyst upon irradiation.143
5. Conclusion and perspective
It has been demonstrated that TAS is a useful technique for studying a range of aspects of charge carrier dynamics in a variety of heterogeneous photocatalysts. Early TAS studies of charge carrier behaviour in TiO2 demonstrated the ability of this technique to track reaction intermediates and products that absorb in the visible region. Subsequent massive research elucidated that TAS is typically useful for identifying and tracking intrinsic photoexcited charge carriers, allowing timescales for charge carrier trapping, recombination, and interfacial charge transfer to be monitored. Interestingly, we note that (i) the fingerprints of photoholes vary between 450–500 nm (e.g. TiO2 and WO3) and 550–600 nm (e.g. Fe2O3 and BiVO4) and the fingerprints of photoelectrons increase with the wavelength for metal oxide photocatalysts as well as for some polymers, and (ii) recombination on the same photocatalyst is frequently observed to obey first/second order kinetics over faster timescales (≤ ns), but power-law kinetics over slow timescales.The spectroscopic profiles of photoexcited charge carriers are determined by the electronic characteristics of the excited photocatalyst including density of states and the transition dipole moment between two states. In theory, these can be determined computationally, and there have been some successful attempts of calculating the absorption of various photoexcited species.147,148 However, there are a very limited number of such computational studies, and we note that to further our understanding of why different materials have different excited spectroscopic characteristics, and to further rationalise the effect of charge carriers with different spectroscopic characteristics on photocatalytic activities, more computational studies even with time resolution should be carried out.
The application of TAS to newer photocatalytic systems including multi-component COFs and MOFs allows rationalisation of photocatalytic activity in terms of charge transfer and separation between different components within these materials. In some cases, longer-lived TAS signals, representing slower recombination, directly correlate with better photocatalytic activity due to longer-lived charge carriers, which have a higher chance of interacting with surface-adsorbed chemical species.
It should be noted that the existence of long-lived charge carriers is a necessary but not sufficient condition in determining the photocatalytic activity. Poor interfacial charge transfer and deep-trapped charge carriers can both lead to poor photocatalytic activity even in the presence of rather long charge carrier lifetimes. Similarly, we note that there is an apparent discrepancy in the literature in that some studies reported that photocatalysts exhibiting a longer charge carrier lifetime had higher photocatalytic activity due to reduced recombination, but others reported that photocatalysts exhibiting a shorter charge carrier lifetime had higher photocatalytic activity due to efficient charge carrier transfer at the interface. We would like to point out that there is no discrepancy for multi-component photocatalysts; efficient charge transfer from one component to another prolongs the lifetime of both electrons and holes due to charge separation, but the lifetime of the charge that has undergone transfer at the interface can appear shortened in TAS in the first component. Furthermore, depending on the experimental conditions, a longer charge carrier lifetime can be correlated with lower photocatalytic activity. For example, this is expected to be the case if TAS is monitoring the photoexcited species that undergo interfacial charge transfer with reactants on the photocatalyst surface, because faster interfacial charge transfer more effectively competes against charge recombination. As such, we highlight that careful experimental design is essential to allow reliable and meaningful interpretation of the TAS data.
We would like to highlight that many TAS studies were performed in transmission mode, but many newly developed photocatalysts are opaque powders, for which diffuse reflectance characterisation is desirable. Diffuse-reflectance TAS has been applied to TiO2-based photocatalysts,149–153 but so far there has been limited application of this technique to other photocatalytic systems, presumably due to (1) technical difficulties with obtaining good-quality data using diffuse reflectance TAS and (2) limited access to such specialised instrumentation. We highlight the importance of more widespread application of diffuse reflectance TAS to allow charge carrier dynamics in novel powder photocatalysts to be elucidated.
Our discussions demonstrated that TRIR is a powerful technique for examining the behaviour of photogenerated charge carriers and for monitoring the formation of photocatalytic intermediates and products. However, research efforts still need to address the following points. It is noted that TRIR in principle can sensitively observe reaction intermediates, but very limited TRIR studies on heterogeneous processes have been reported. There are significant challenges associated with monitoring reactions occurring in aqueous solutions, since the solvent absorbs strongly in the mid-infrared region and could annihilate signals of interest for the photocatalytic reactions. Thus, efforts are needed to combine TRIR with time-resolved Raman spectroscopy, which could not only detect the organic functional groups,154 but also probe the excited free electrons in the CB or the shallowly trapped electrons appearing at lower wavenumbers. Secondly, we note that for the study of organic molecular systems, experimental TRIR/TAS spectra can be well interpreted with the help of calculations.155,156 However, for heterogeneous photocatalytic systems the simulations are challenging due to the surface complexity of the solid catalyst, still requiring substantial effort. Thirdly, to achieve a sufficient solar energy conversion efficiency, researchers are working to design photocatalysts which are active under irradiation up to 600 nm or even longer. Accordingly, it is important to optimise TRIR instruments using longer pump wavelengths (for example up to 750 nm). Furthermore, TRIR instruments should be improved to monitor operando photocatalytic reactions to further elucidate the transformation of the intermediates under the real experimental conditions.
Furthermore, it is suggested to pay attention to coupling TAS and TRIR to electrochemical or temperature-controlled measurements. Electrochemical measurement coupled TAS is usually used to characterize charge carrier dynamics in photoelectrodes under different bias conditions, which has been comprehensively reviewed recently.13 There are a very limited number of studies on temperature-coupled TAS in the field of heterogeneous photocatalysis. Notably, Utterback et al. found that the exponent of the power law relaxation of CdS and CdSe nanorods was temperature-independent, therefore ruled out thermally activated recombination pathways and deduced that the power-law recombination dynamics was due to slow trapped-hole diffusion.157 Also, recently Maza et al. applied temperature-dependent TAS to deduce rate constants and activation energies associated with the initial reduction of linear perfluoroalkyl carboxylates and perfluoroalkyl sulfonates by hydrated electrons.158 Therefore, we note that this method may similarly be applied to deduce rate constants and activation energies associated with heterogeneous photocatalysis. On the other hand, electrochemical techniques are coupled with TRIR to validate the occurrence of ET in the photocatalytic processes. For instance, the intramolecular ET process for the dyad [Re(CO)3(Pic)Bpy–PdTPP][PF6] was supported by cyclic voltammetry study, and ET from Pd(II) porphyrin to Re(I) tricarbonyl bipyridine was monitored by TRIR.159 A self-assembled complex was formed for the pyridyl-functionalized diiron dithiolate complex (3) in the presence of zinc tetraphenylporphyrin (ZnTPP). Ultrafast photoinduced ET from excited ZnTPP to complex 3 was observed by TRIR. A cyclic voltammetry study was also performed to test the influence of the axial–pyridine ligand on the redox potentials of ZnTPP.160 In addition, TRIR tests were performed at different temperatures. For instance, in the 150–300 K temperature range, the charge carriers in the CH3NH3PbI3 perovskite film were more spatially localized at higher temperatures and the charge recombination rate determined by TRIR slowed more than an order of magnitude.161
Finally, although TAS and TRIR could provide complementary information to one another, these two techniques are seldom integrated together to characterise novel photocatalysts. In particular, we highlight the potential of applying TRIR to monitor the formation of reaction intermediates and free/shallow-trapped charge carriers, and in parallel use TAS to monitor the behaviour of free/deep-trapped charge carriers. Similarly, other time-resolved spectroscopic techniques (e.g. time-resolved Raman and time-resolved XUV) can provide complementary information to both TAS and TRIR, as detailed in a recent review.15 In addition, near IR spectroscopy can also provide complementary information to both TAS and TRIR. It would be desirable to combine these techniques in a single instrument, in which the optical pump is coupled with a visible-NIR probe (TAS) as well as a near-mid-IR probe, which would potentially allow charge carrier behaviour to be directly correlated with chemical changes.
Overall, the photophysics elucidated by time-resolved spectroscopies is much more developed than the photochemistry, which should be one key area of focus for future studies of heterogeneous photocatalysis.
Author contributions
J. T. conceived and supervised the progress of the entire project. J. M and T. M. co-drafted the entire article, and equally contributed to the preparation of this manuscript.Conflicts of interest
The authors declare no conflict of interest.Acknowledgements
J. M. is thankful to the National Natural Science Foundation of China (21973075), Shaanxi Science Foundation for Distinguished Young Scholars (2021JC-38), Shaanxi Science and Technology New Star Project (2020KJXX-010) and Shaanxi Key Research Grant (2020GY-244). T. J. M and J. T. are thankful for financial support from UK EPSRC (EP/N009533/1 and EP/S018204/2), Leverhulme Trust (RPG-2017-122), Royal Society Newton Advanced Fellowship grant (NAF\R1\191163) and Royal Society Leverhulme Trust Senior Research Fellowship (SRF\R1\21000153).Notes and references
- Q. Xiang, B. Cheng and J. Yu, Angew. Chem., Int. Ed., 2015, 54, 11350–11366 CrossRef CAS PubMed.
- T. Takata, J. Jiang, Y. Sakata, M. Nakabayashi, N. Shibata, V. Nandal, K. Seki, T. Hisatomi and K. Domen, Nature, 2020, 581, 411–414 CrossRef CAS PubMed.
- Y. Wang, A. Vogel, M. Sachs, R. S. Sprick, L. Wilbraham, S. J. A. Moniz, R. Godin, M. A. Zwijnenburg, J. R. Durrant, A. I. Cooper and J. Tang, Nat. Energy, 2019, 4, 746–760 CrossRef CAS.
- C. Wang and D. Astruc, Chem. Soc. Rev., 2014, 43, 7188–7216 RSC.
- X. Li, J. Xie, H. Rao, C. Wang and J. Tang, Angew. Chem., Int. Ed., 2020, 59, 19702–19707 CrossRef CAS PubMed.
- J. Xie, R. Jin, A. Li, Y. Bi, Q. Ruan, Y. Deng, Y. Zhang, S. Yao, G. Sankar, D. Ma and J. Tang, Nat. Catal., 2018, 1, 889–896 CrossRef CAS.
- F. Dong, Z. Zhao, Y. Sun, Y. Zhang, S. Yan and Z. Wu, Environ. Sci. Technol., 2015, 49, 12432–12440 CrossRef CAS PubMed.
- A. Mills, R. H. Davies and D. Worsley, Chem. Soc. Rev., 1993, 22, 417–425 RSC.
- A. H. Mamaghani, F. Haghighat and C. S. Lee, Appl. Catal., B, 2017, 203, 247–269 CrossRef CAS.
- S. N. Habisreutinger, L. Schmidt-Mende and J. K. Stolarczyk, Angew. Chem., Int. Ed., 2013, 52, 7372–7408 CrossRef CAS PubMed.
- E. Mitchell, A. Law and R. Godin, Chem. Commun., 2021, 57, 1550–1567 RSC.
- E. Mitchell, A. Law and R. Godin, J. Photochem. Photobiol., C, 2021, 49, 100453 CrossRef CAS.
- T.-H. Lai, K.-i Katsumata and Y.-J. Hsu, Nanophotonics, 2021, 10, 777–795 CrossRef CAS.
- Y. Paz, J. Phys.: Condens. Matter, 2019, 31, 503004 CrossRef CAS PubMed.
- T. J. Miao and J. Tang, J. Chem. Phys., 2020, 152, 194201 CrossRef CAS PubMed.
- A. Papcke, A. Friedrich and S. Lochbrunner, J. Phys.: Condens. Matter, 2020, 32, 153001 CrossRef PubMed.
- C. Günnemann, M. Curti, J. Schneider and D. W. Bahnemann, Photochemistry, 2020, 47, 122–158 Search PubMed.
- R. Berera, R. van Grondelle and J. T. M. Kennis, Photosynth. Res., 2009, 101, 105–118 CrossRef CAS PubMed.
- V. Kumar, S. Schlücker and E. Hasselbrink, Ultrafast time-resolved molecular spectroscopy. Molecular and Laser Spectroscopy, Elsevier Inc., 2020 DOI:10.1016/b978-0-12-818870-5.00016-2.
- A. J. Cowan, J. Tang, W. Leng, J. R. Durrant and D. R. Klug, J. Phys. Chem. C, 2010, 114, 4208–4214 CrossRef CAS.
- E. C. Carroll, M. P. Hill, D. Madsen, K. R. Malley and D. S. Larsen, Rev. Sci. Instrum., 2009, 80, 026102 CrossRef CAS PubMed.
- K. T. Munson, E. R. Kennehan and J. B. Asbury, J. Mater. Chem. C, 2019, 7, 5889–5909 RSC.
- G. M. Greetham, P. Burgos, Q. Cao, I. P. Clark, P. S. Codd, R. C. Farrow, M. W. George, M. Kogimtzis, P. Matousek, A. W. Parker, M. R. Pollard, D. A. Robinson, Z.-J. Xin and M. Towrie, Appl. Spectrosc., 2010, 64, 1311–1319 CrossRef CAS PubMed.
- C. K. Johnson, J. M. Bostick, S. A. Mounter, K. L. Ratzlaff and D. E. Schloemer, Rev. Sci. Instrum., 1988, 59, 2375–2379 CrossRef CAS.
- C. K. Johnson and J. Johnson, Rev. Sci. Instrum., 1990, 61, 1158–1160 CrossRef CAS.
- J. Bredenbeck, J. Helbing and P. Helbing, Rev. Sci. Instrum., 2004, 75, 4462 CrossRef CAS.
- G. M. Greetham, D. Sole, I. P. Clark, A. W. Parker, M. R. Pollard and M. Towrie, Rev. Sci. Instrum., 2012, 83, 103107 CrossRef CAS PubMed.
- G. M. Greetham, P. M. Donaldson, C. Nation, I. V. Sazanovich, I. P. Clark, D. J. Shaw, A. W. Parker and M. Towrie, Appl. Spectrosc., 2016, 70, 645–653 CrossRef CAS PubMed.
- B. L. Greene, G. E. Vansuch, B. C. Chica, M. W. W. Adams and R. B. Dyer, Acc. Chem. Res., 2017, 50, 2718–2726 CrossRef CAS PubMed.
- K. T. Munson, E. R. Kennehan and J. B. Asbury, J. Mater. Chem. C, 2019, 7, 5889–5909 RSC.
- T. Yuzawa, C. Kato, M. W. George and H.-O. Hamaguchi, Appl. Spectrosc., 1994, 48, 684–690 CrossRef CAS.
- T. J. Miao, Doctoral thesis, University College London, 2021.
- C. Haisch, B. N. Nunes, J. Schneider, D. Bahnemann and A. O. T. Patrocinio, Z. Phys. Chem., 2018, 232, 1469–1493 CrossRef CAS.
- A. Fujishima and K. Honda, Nature, 1972, 238, 37–38 CrossRef CAS PubMed.
- J. Schneider, M. Matsuoka, M. Takeuchi, J. Zhang, Y. Horiuchi, M. Anpo and D. W. Bahnemann, Chem. Rev., 2014, 114, 9919–9986 CrossRef CAS PubMed.
- K. Hashimoto, H. Irie and A. Fujishima, Jpn. J. Appl. Phys., 2005, 44, 8269 CrossRef CAS.
- K. Nakata and A. Fujishima, J. Photochem. Photobiol., C, 2012, 13, 169–189 CrossRef CAS.
- Q. Guo, C. Zhou, Z. Ma and X. Yang, Adv. Mater., 2019, 31, 1901997 CrossRef CAS.
- H. Qian, J. Zong, G. Schneider, T. Zhou, Y. Zhao, J. Li, D. Yang, W. Bahnemann and J. H. Pan, Catal. Today, 2019, 335, 78–90 CrossRef.
- D. Duonghong, J. Ramsden and M. Grätzel, J. Am. Chem. Soc., 1982, 104, 2977–2988 CrossRef.
- A. Henglein, Ber. Bunsen-Ges., 1982, 86, 241–246 CrossRef CAS.
- D. Bahnemann, A. Henglein, J. Lilie and L. Spanhel, J. Phys. Chem., 1984, 88, 709–711 CrossRef CAS.
- D. Rothenberger, J. Moser, M. Graetzel, N. Serpone and D. K. Sharma, J. Am. Chem. Soc., 1985, 26, 389–416 Search PubMed.
- D. P. Colombo, K. A. Roussel, J. Saeh, D. E. Skinner, J. J. Cavaleri and R. M. Bowman, Chem. Phys. Lett., 1995, 232, 207–214 CrossRef CAS.
- D. P. Colombo and R. M. Bowman, J. Phys. Chem., 1996, 100, 18445–18449 CrossRef CAS.
- J. Tang, J. R. Durrant and D. R. Klug, J. Am. Chem. Soc., 2008, 130, 13885–13891 CrossRef CAS.
- T. Yoshihara, R. Katoh, A. Furube, Y. Tamaki, M. Murai, K. Hara, S. Murata, H. Arakawa and M. Tachiya, J. Phys. Chem. B, 2004, 108, 3817–3823 CrossRef CAS.
- X. Wang, A. Kafizas, X. Li, S. J. A. Moniz, P. J. T. Reardon, J. Tang, I. P. Parkin and J. R. Durrant, J. Phys. Chem. C, 2015, 119, 10439–10447 CrossRef CAS.
- D. W. Bahnemann, M. Hilgendorff and R. Memming, J. Phys. Chem. B, 1997, 101, 4265–4275 CrossRef CAS.
- F. M. Pesci, A. J. Cowan, B. D. Alexander, J. R. Durrant and D. R. Klug, J. Phys. Chem. Lett., 2011, 2, 1900–1903 CrossRef CAS.
- I. Bedja, S. Hotchandani and P. V. Kamat, J. Phys. Chem., 1993, 97, 11064–11070 CrossRef CAS.
- Z. Huang, Y. Lin, X. Xiang, W. Rodríguez-Córdoba, K. J. McDonald, K. S. Hagen, K.-S. Choi, B. S. Brunschwig, D. G. Musaev, C. L. Hill, D. Wang and T. Lian, Energy Environ. Sci., 2012, 5, 8923–8926 RSC.
- M. Barroso, C. A. Mesa, S. R. Pendlebury, A. J. Cowan, T. Hisatomi, K. Sivula, M. Gratzel, D. R. Klug and J. R. Durrant, Proc. Natl. Acad. Sci. U. S. A., 2012, 109, 15640–15645 CrossRef CAS PubMed.
- S. R. Pendlebury, M. Barroso, A. J. Cowan, K. Sivula, J. Tang, M. Grätzel, D. Klug and J. R. Durrant, Chem. Commun., 2011, 47, 716–718 RSC.
- B. C. Fitzmorris, J. M. Patete, J. Smith, X. Mascorro, S. Adams, S. S. Wong and J. Z. Zhang, ChemSusChem, 2013, 6, 1907–1914 CrossRef CAS PubMed.
- L. Fu and Z. Wu, J. Chem. Phys., 2004, 120, 3406 CrossRef CAS PubMed.
- I. Grigioni, K. G. Stamplecoskie, E. Selli and P. V. Kamat, J. Phys. Chem. C, 2015, 119, 20792–20800 CrossRef CAS.
- B. Pattengale, J. Ludwig and J. Huang, J. Phys. Chem. C, 2016, 120, 1421–1427 CrossRef CAS.
- J. Ravensbergen, F. F. Abdi, J. H. van Santen, R. N. Frese, B. Dam, R. van de Krol and J. T. M. Kennis, J. Phys. Chem. C, 2014, 118, 27793–27800 CrossRef CAS.
- D. Hayes, R. G. Hadt, J. D. Emery, A. A. Cordones, A. B. F. Martinson, M. L. Shelby, K. A. Fransted, P. D. Dahlberg, J. Hong, X. Zhang, Q. Kong, R. W. Schoenleinc and L. X. Chen, Energy Environ. Sci., 2016, 9, 3754–3769 RSC.
- J. K. Cooper, S. E. Reyes-Lillo, L. H. Hess, C.-M. Jiang, J. B. Neaton and I. D. Sharp, J. Phys. Chem. C, 2018, 122, 20642–20652 CrossRef CAS.
- D. P. Colombo and R. M. Bowman, J. Phys. Chem., 1995, 99, 11752–11756 CrossRef CAS.
- Q. Wang, C. Pornrungroj, S. Linley and E. Reisner, Nat. Energy, 2022, 7, 13–24 CrossRef.
- Y. Yamada and Y. Kanemitsu, Appl. Phys. Lett., 2012, 101, 133907 CrossRef.
- A. Kafizas, X. Wang, S. R. Pendlebury, P. Barnes, M. Ling, C. Sotelo-Vazquez, R. Quesada-Cabrera, C. Li, I. P. Parkin and J. R. Durrant, J. Phys. Chem. A, 2016, 120, 715–723 CrossRef CAS PubMed.
- J. Ran, J. Zhang, J. Yu, M. Jaroniec and S. Z. Qiao, Chem. Soc. Rev., 2014, 43, 7787–7812 RSC.
- J. Liu, Y. Li, X. Zhou, H. Jiang, H. G. Yang and C. Li, J. Mater. Chem. A, 2020, 8, 17–26 RSC.
- S. J. A. Moniz, S. A. Shevlin, D. J. Martin, Z.-X. Guo and J. Tang, Energy Environ. Sci., 2015, 8, 731–759 RSC.
- A. J. Cowan and J. R. Durrant, Chem. Soc. Rev., 2013, 42, 2281–2293 RSC.
- J. Schneider, K. Nikitin, M. Wark, D. W. Bahnemann and R. Marschall, Phys. Chem. Chem. Phys., 2016, 18, 10719–10726 RSC.
- A. Tolosana-Moranchel, M. Faraldos, A. Bahamonde, L. Pascual, F. Sieland, J. Schneider, R. Dillert and D. W. Bahnemann, J. Photochem. Photobiol., A, 2020, 386, 112112 CrossRef CAS.
- F. Sieland, J. Schneider and D. W. Bahnemann, Phys. Chem. Chem. Phys., 2018, 20, 8119–8132 RSC.
- F. Sieland, J. Schneider, T. Lippmann and D. W. Bahnemann, in Solar Hydrogen and Nanotechnology XI, 2016, vol. 9935, p. 99350G Search PubMed.
- A. O. T. Patrocinio, J. Schneider, M. D. França, L. M. Santos, B. P. Caixeta, A. E. H. Machado and D. W. Bahnemann, RSC Adv., 2015, 5, 70536–70545 RSC.
- M. Sachs, E. Pastor, A. Kafizas and J. R. Durrant, J. Phys. Chem. Lett., 2016, 7, 3742–3746 CrossRef CAS.
- Y. Wang, X. Liu, X. Han, R. Godin, J. Chen, W. Zhou, C. Jiang, J. F. Thompson, K. B. Mustafa, S. A. Shevlin, J. R. Durrant, Z. Guo and J. Tang, Nat. Commun., 2020, 11, 2531 CrossRef CAS.
- R. Godin, Y. Wang, M. A. Zwijnenburg, J. Tang and J. R. Durrant, J. Am. Chem. Soc., 2017, 139, 5216–5224 CrossRef CAS PubMed.
- C. Merschjann, S. Tschierlei, T. Tyborski, K. Kailasam, S. Orthmann, D. Hollmann, T. Schedel-Niedrig, A. Thomas and S. Lochbrunner, Adv. Mater., 2015, 27, 7993–7999 CrossRef CAS PubMed.
- M. Lan, G. Fan, L. Yang and F. Li, RSC Adv., 2015, 5, 5725–5734 RSC.
- C. Ye, J.-X. Li, Z.-J. Li, X.-B. Li, X.-B. Fan, L.-P. Zhang, B. Chen, C.-H. Tung and L.-Z. Wu, ACS Catal., 2015, 5, 6973–6979 CrossRef CAS.
- Q. Ruan, T. Miao, H. Wang and J. Tang, J. Am. Chem. Soc., 2020, 142, 2795–2802 CrossRef CAS PubMed.
- H. Zhang, Y. Chen, R. Lu, R. Li and A. Yu, Phys. Chem. Chem. Phys., 2016, 18, 14904–14910 RSC.
- K. L. Corp and C. W. Schlenker, J. Am. Chem. Soc., 2017, 139, 7904–7912 CrossRef CAS PubMed.
- H. Wang, H. Wang, Z. Wang, L. Tang, G. Zeng, P. Xu, M. Chen, T. Xiong, C. Zhou, X. Li, D. Huang, Y. Zhu, Z. Wang and J. Tang, Chem. Soc. Rev., 2020, 49, 4135–4165 RSC.
- A. C. Jakowetz, T. F. Hinrichsen, L. Ascherl, T. Sick, M. Calik, F. Auras, D. D. Medina, R. H. Friend, A. Rao and T. Bein, J. Am. Chem. Soc., 2019, 141, 11565–11571 CrossRef CAS PubMed.
- A. M. Evans, L. R. Parent, N. C. Flanders, R. P. Bisbey, E. Vitaku, M. S. Kirschner, R. D. Schaller, L. X. Chen, N. C. Gianneschi and W. R. Dichtel, Science, 2018, 361, 52–57 CrossRef CAS PubMed.
- S. Jin, X. Ding, X. Feng, M. Supur, K. Furukawa, S. Takahashi, M. Addicoat, M. E. El-Khouly, T. Nakamura, S. Irle, S. Fukuzumi, A. Nagai and D. Jiang, Angew. Chem., Int. Ed., 2013, 52, 2017–2021 CrossRef CAS PubMed.
- S. Jin, M. Supur, M. Addicoat, K. Furukawa, L. Chen, T. Nakamura, S. Fukuzumi, S. Irle and D. Jiang, J. Am. Chem. Soc., 2015, 137, 7817–7827 CrossRef CAS PubMed.
- T. W. Kim, S. Jun, Y. Ha, R. K. Yadav, A. Kumar, C.-Y. Yoo, I. Oh, H.-K. Lim, J. W. Shin, R. Ryoo, H. Kim, J. Kim, J.-O. Baeg and H. Ihee, Nat. Commun., 2019, 10, 1873 CrossRef PubMed.
- D. D. Medina, V. Werner, F. Auras, R. Tautz, M. Dogru, J. Schuster, S. Linke, M. Döblinger, J. Feldmann, P. Knochel and T. Bein, ACS Nano, 2014, 8, 4042–4052 CrossRef CAS PubMed.
- S. Yang, W. Hu, X. Zhang, P. He, B. Pattengale, C. Liu, M. Cendejas, I. Hermans, X. Zhang, J. Zhang and J. Huang, J. Am. Chem. Soc., 2018, 140, 14614–14618 CrossRef CAS PubMed.
- S. Zhang, S. Wang, L. Guo, H. Chen, B. Tan and S. Jin, J. Mater. Chem. C, 2020, 8, 192–200 RSC.
- S. Zhang, G. Cheng, L. Guo, N. Wang, B. Tan and S. Jin, Angew. Chem., Int. Ed., 2020, 59, 6007–6014 CrossRef CAS PubMed.
- L. Guo, Y. Niu, S. Razzaque, B. Tan and S. Jin, ACS Catal., 2019, 9, 9438–9445 CrossRef CAS.
- Z.-H. Yan, M.-H. Du, J. Liu, S. Jin, C. Wang, G.-L. Zhuang, X.-J. Kong, L.-S. Long and L.-S. Zheng, Nat. Commun., 2018, 9, 3353 CrossRef PubMed.
- K. G. M. Laurier, E. Fron, P. Atienzar, K. Kennes, H. Garcia, M. Van der Auweraer, D. E. De Vos, J. Hofkensa and M. B. J. Roeffaers, Phys. Chem. Chem. Phys., 2014, 16, 5044–5047 RSC.
- D. Wang, J. Albero, H. García and Z. Li, J. Catal., 2017, 349, 156–162 CrossRef CAS.
- M. A. Nasalevich, C. H. Hendon, J. G. Santaclara, K. Svane, B. van der Linden, S. L. Veber, M. V. Fedin, A. J. Houtepen, M. A. van der Veen, F. Kapteijn, A. Walsh and J. Gascon, Sci. Rep., 2016, 6, 23676 CrossRef CAS PubMed.
- X. Ma, L. Wang, Q. Zhang and H. Jiang, Angew. Chem., Int. Ed., 2019, 58, 12175–12179 CrossRef CAS PubMed.
- J. J. Walsh, C. Jiang, J. Tang and A. J. Cowan, Phys. Chem. Chem. Phys., 2016, 18, 24825–24829 RSC.
- R. Kuriki, H. Matsunaga, T. Nakashima, K. Wada, A. Yamakata, O. Ishitani and K. Maeda, J. Am. Chem. Soc., 2016, 138, 5159–5170 CrossRef CAS PubMed.
- M. Zhu, Y. Mi, G. Zhu, D. Li, Y. Wang and Y. Weng, J. Phys. Chem. C, 2013, 117, 18863–18869 CrossRef CAS.
- T. Miao, C. Wang, L. Xiong, X. Li, X. Xie and J. Tang, ACS Catal., 2021, 11, 8226–8238 CrossRef CAS PubMed.
- J. Zhang, Q. Xu, Z. Feng, M. Li and C. Li, Angew. Chem., Int. Ed., 2008, 47, 1766–1769 CrossRef CAS PubMed.
- T. Ohno, K. Tokieda, S. Higashida and M. Matsumura, Appl. Catal., A, 2003, 244, 383–391 CrossRef CAS.
- D. C. Hurum, K. A. Gray, T. Rajh and M. C. Thurnauer, J. Phys. Chem. B, 2005, 109, 977–980 CrossRef CAS PubMed.
- D. C. Hurum, A. G. Agrios, K. A. Gray, T. Rajh and M. C. Thurnauer, J. Phys. Chem. B, 2003, 107, 4545–4549 CrossRef CAS.
- T. Kawahara, Angew. Chem., Int. Ed., 2002, 41, 2811–2813 CrossRef CAS PubMed.
- H. Nakajima, T. Mori, Q. Shen and T. Toyoda, Chem. Phys. Lett., 2005, 409, 81–84 CrossRef CAS.
- K. Komaguchi, H. Nakano, A. Araki and Y. Harima, Chem. Phys. Lett., 2006, 428, 338–342 CrossRef CAS.
- G. Li, L. Chen, M. E. Graham and K. A. A. Gray, J. Mol. Catal. A: Chem., 2007, 275, 30–35 CrossRef CAS.
- X. Wang and C. Li, J. Phys. Chem. C, 2018, 122, 21083–21096 CrossRef CAS.
- V. C. A. Taylor, D. Tiwari, M. Duchi, P. M. Donaldson, I. P. Clark, D. J. Fermin and T. A. A. Oliver, J. Phys. Chem. Lett., 2018, 9, 895–901 CrossRef CAS PubMed.
- P. Guo, J. Gong, S. Sadasivam, Y. Xia, T.-B. Song, B. T. Diroll, C. C. Stoumpos, J. B. Ketterson, M. G. Kanatzidis, M. K. Y. Chan, P. Darancet, T. Xu and R. D. Schaller, Nat. Commun., 2018, 9, 2792 CrossRef PubMed.
- K. T. Munson, G. S. Doucette, E. R. Kennehan, J. R. Swartzfager and J. B. Asbury, J. Phys. Chem. C, 2019, 123, 7061–7073 CrossRef CAS.
- F. Zhang, A. Yamakata, K. Maeda, Y. Moriya, T. Takata, J. Kubota, K. Teshima, S. Oishi and K. Domen, J. Am. Chem. Soc., 2012, 134, 8348–8351 CrossRef CAS PubMed.
- A. Yamakata, M. Kawaguchi, N. Nishimura, T. Minegishi, J. Kubota and K. Domen, J. Phys. Chem. C, 2014, 118, 23897–23906 CrossRef CAS.
- X. Dai, Z. Jiao, Z. Ma, K. Liu, C. Wang and H. Su, J. Phys. Chem. C, 2019, 123, 20325–20332 CrossRef CAS.
- I. Benisti, F. Shaik, Z. Xing, A. Ben-refael, L. Amirav and Y. Paz, Appl. Surf. Sci., 2021, 542, 148432 CrossRef CAS.
- J. Yan, P. Li, H. Bian, H. Wu and S. Liu, Sustainable Energy Fuels, 2017, 1, 95–102 RSC.
- J. Yan, H. Wu, H. Chen, Y. Zhang, F. Zhang and S. Frank Liu, Appl. Catal., B, 2016, 191, 130–137 CrossRef CAS.
- M. A. Lebedeva, T. W. Chamberlain, P. A. Scattergood, M. Delor, I. V. Sazanovich, E. Stephen Davies, M. Suyetin, E. Besley, M. Schröder, J. A. Weinstein and A. N. Khlobystov, Chem. Sci., 2016, 7, 5908–5921 RSC.
- G. Sahara and O. Ishitani, Inorg. Chem., 2015, 54, 5096–5104 CrossRef CAS PubMed.
- M. Abdellah, A. M. El-Zohry, L. J. Antila, C. D. Windle, E. Reisner and L. Hammarström, J. Am. Chem. Soc., 2017, 139, 1226–1232 CrossRef CAS PubMed.
- S. Ardo, D. Achey, A. J. Morris, M. Abrahamsson and G. J. Meyer, J. Am. Chem. Soc., 2011, 133, 16572–16580 CrossRef CAS PubMed.
- J. Shao, S. Yang and Y. Liu, ACS Appl. Mater. Interfaces, 2017, 9, 16202–16214 CrossRef CAS PubMed.
- D. R. Whang, D. H. Apaydin, S. Y. Park and N. S. Sariciftci, J. Catal., 2018, 363, 191–196 CrossRef CAS.
- S. E. Brown-Xu, M. H. Chisholm, C. B. Durr, T. L. Gustafson and T. F. Spilker, J. Am. Chem. Soc., 2014, 136, 11428–11435 CrossRef CAS PubMed.
- N. A. Andersen and T. Lian, Annu. Rev. Phys. Chem., 2005, 56, 491–519 CrossRef PubMed.
- J. B. Asbury, R. J. Ellingson, H. N. Ghosh, S. Ferrere, A. J. Nozik and T. Lian, J. Phys. Chem. B, 1999, 103, 3110–3119 CrossRef CAS.
- H. Zhao, Q. Zhang and Y. X. Weng, J. Phys. Chem. C, 2007, 111, 3762–3769 CrossRef CAS.
- J. B. Asbury, E. Hao, Y. Wang and T. Lian, J. Phys. Chem. B, 2000, 104, 11957–11964 CrossRef CAS.
- J. B. Asbury, N. A. Anderson, E. Hao, X. Ai and T. Lian, J. Phys. Chem. B, 2003, 107, 7376–7386 CrossRef CAS.
- H. B. Gobeze, S. K. Das and F. Dsouza, J. Phys. Chem. C, 2014, 118, 16660–16671 CrossRef CAS.
- H. Imahori, S. Kang, H. Hayashi, M. Haruta, H. Kurata, S. Isoda, S. E. Canton, Y. Infahsaeng, A. Kathiravan, T. Pascher, P. Chábera, A. P. Yartsev and V. Sundström, J. Phys. Chem. A, 2011, 115, 3679–3690 CrossRef CAS PubMed.
- N. Põldme, L. O’Reilly, I. Fletcher, J. Portoles, I. V. Sazanovich, M. Towrie, C. Long, J. G. Vos, M. T. Pryce and E. A. Gibson, Chem. Sci., 2019, 10, 99–112 RSC.
- J. Huang, M. Gilbert Gatty, B. Xu, P. Baran Pati, A. S. Etman, L. Tian, J. Sun, L. Hammarströma and H. Tian, Dalton Trans., 2018, 47, 10775–10783 RSC.
- J. Huang, D. Stockwell, Z. Huang, D. L. Mohler and T. Lian, J. Am. Chem. Soc., 2008, 130, 5632–5633 CrossRef CAS PubMed.
- A. Yamakata, T. A. Ishibashi, K. Takeshita and H. Onishi, Top. Catal., 2005, 35, 211–216 CrossRef CAS.
- A. Maeda and T. A. Ishibashi, Chem. Phys., 2013, 419, 167–171 CrossRef CAS.
- M. Zhang, M. De Respinis and H. Frei, Nat. Chem., 2014, 6, 362–367 CrossRef CAS PubMed.
- S. Narra, C. C. Chung, E. W. G. Diau and S. Shigeto, J. Phys. Chem. Lett., 2016, 7, 2450–2455 CrossRef CAS PubMed.
- S. S. Nurttila, R. Becker, J. Hessels, S. Woutersen and J. N. H. Reek, Chem. – Eur. J., 2018, 24, 16395–16406 CrossRef CAS PubMed.
- M. Maruyama, A. Iwase, H. Kato, A. Kudo and H. Onishi, J. Phys. Chem. C, 2009, 113, 13918–13923 CrossRef CAS.
- K. Furuhashi, Q. Jia, A. Kudo and H. Onishi, J. Phys. Chem. C, 2013, 117, 19101–19106 CrossRef CAS.
- Y. Wang, R. Godin, J. R. Durrant and J. Tang, Angew. Chem., Int. Ed., 2021, 60, 20811–20816 CrossRef CAS PubMed.
- P. Zawadzki, J. Phys. Chem. C, 2013, 117, 8647–8651 CrossRef CAS.
- A. S. Skeidsvoll, A. Balbi and H. Koch, Phys. Rev. A, 2020, 102, 023115 CrossRef CAS.
- A. Furube, T. Asahi, H. Masuhara, H. Yamashita and M. Anpo, J. Phys. Chem. B, 1999, 103, 3120–3127 CrossRef CAS.
- T. Tachikawa, S. Tojo, M. Fujitsuka and T. Majima, J. Phys. Chem. B, 2004, 108, 5859–5866 CrossRef CAS.
- R. Miyasato, H. Sato, T. Yano, M. Fujiwara and H. Hashimoto, J. Photochem. Photobiol., A, 2018, 358, 452–458 CrossRef CAS.
- T. Tachikawa, S. Tojo, K. Kawai, M. Endo, M. Fujitsuka, T. Ohno, K. Nishijima, Z. Miyamoto and T. Majima, J. Phys. Chem. B, 2004, 108, 19299–19306 CrossRef CAS.
- K. I. Yamanaka and T. Morikawa, J. Phys. Chem. C, 2012, 116, 1286–1292 CrossRef CAS.
- J. Ma, X. Zhang and D. L. Phillips, Acc. Chem. Res., 2019, 52, 726–737 CrossRef CAS PubMed.
- K. Chevalier, M. M. N. Wolf, A. Funk, M. Andres, M. Gerhardsb and R. Diller, Phys. Chem. Chem. Phys., 2012, 14, 15007–15020 RSC.
- B. Patrizi, C. Cozza, A. Pietropaolo, P. Foggi and M. S. de Cumis, Molecules, 2020, 25, 430 CrossRef CAS PubMed.
- J. K. Utterback, J. L. Ruzicka, H. Hamby, J. D. Eaves and G. Dukovic, J. Phys. Chem. Lett., 2019, 10, 2782–2787 CrossRef CAS PubMed.
- W. A. Maza, V. M. Breslin, J. C. Owrutsky, B. B. Pate and A. Epshteyn, Environ. Sci. Technol. Lett., 2021, 8, 525–530 CrossRef CAS.
- J. Schneider, K. Q. Vuong, J. A. Calladine, X.-Z. Sun, A. C. Whitwood, M. W. George and R. N. Perutz, Inorg. Chem., 2011, 50, 11877–11889 CrossRef CAS PubMed.
- P. Li, S. Amirjalayer, F. Hartl, M. Lutz, B. d Bruin, R. Becker, S. Woutersen and J. N. H. Reek, Inorg. Chem., 2014, 53, 5373–5383 CrossRef CAS PubMed.
- Kyle T. Munson, Grayson S. Doucette, Eric R. Kennehan, John R. Swartzfager and John B. Asbury, J. Phys. Chem. C, 2019, 123, 7061–7073 CrossRef CAS.
Footnote |
| † These authors contributed equally to this work. |
| This journal is © The Royal Society of Chemistry 2022 |