 Open Access Article
Creative Commons Attribution 3.0 Unported Licence
Time-resolved infra-red studies of photo-excited porphyrins in the presence of nucleic acids and in HeLa tumour cells: insights into binding site and electron transfer dynamics†
Páraic M.
Keane
 *ab,
Clara
Zehe
 c,
Fergus E.
Poynton
ad,
Sandra A.
Bright
ad,
Sandra
Estayalo-Adrián
 ad,
Stephen J.
Devereux
c,
Paul M.
Donaldson
 e,
Igor V.
Sazanovich
 e,
Michael
Towrie
e,
Stanley W.
Botchway
e,
Christine J.
Cardin
b,
D. Clive
Williams
d,
Thorfinnur
Gunnlaugsson
e,
Michael
Towrie
e,
Stanley W.
Botchway
e,
Christine J.
Cardin
b,
D. Clive
Williams
d,
Thorfinnur
Gunnlaugsson
 ad,
Conor
Long
 *f,
John M.
Kelly
 *a and
Susan J.
Quinn
 *c
*c
aSchool of Chemistry, Trinity College Dublin, Dublin 2, Ireland. E-mail: keanepa@tcd.ie; jmkelly@tcd.ie
bSchool of Chemistry, University of Reading, Whiteknights, Reading RG6 6AD, UK
cSchool of Chemistry, University College Dublin, Dublin 4, Ireland. E-mail: susan.quinn@ucd.ie
dTrinity Biomedical Sciences Institute, The University of Dublin, Pearse St., Dublin 2, Ireland
eSTFC Central Laser Facility, Research Complex at Harwell, Rutherford Appleton Laboratory, Didcot OX11 0QX, UK
fSchool of Chemical Sciences, Dublin City University, Dublin 9, Ireland. E-mail: conor.long@dcu.ie
First published on 31st October 2022
Abstract
Cationic porphyrins based on the 5,10,15,20-meso-(tetrakis-4-N-methylpyridyl) core (TMPyP4) have been studied extensively over many years due to their strong interactions with a variety of nucleic acid structures, and their potential use as photodynamic therapeutic agents and telomerase inhibitors. In this paper, the interactions of metal-free TMPyP4 and Pt(II)TMPyP4 with guanine-containing nucleic acids are studied for the first time using time-resolved infrared spectroscopy (TRIR). In D2O solution (where the metal-free form exists as D2TMPyP4) both compounds yielded similar TRIR spectra (between 1450–1750 cm−1) following pulsed laser excitation in their Soret B-absorption bands. Density functional theory calculations reveal that vibrations centred on the methylpyridinium groups are responsible for the dominant feature at ca. 1640 cm−1. TRIR spectra of D2TMPyP4 or PtTMPyP4 in the presence of guanosine 5'-monophosphate (GMP), double-stranded {d(GC)5}2 or {d(CGCAAATTTGCG)}2 contain negative-going signals, ‘bleaches’, indicative of binding close to guanine. TRIR signals for D2TMPyP4 or PtTMPyP bound to the quadruplex-forming cMYC sequence {d(TAGGGAGGG)}2T indicate that binding occurs on the stacked guanines. For D2TMPyP4 bound to guanine-containing systems, the TRIR signal at ca. 1640 cm−1 decays on the picosecond timescale, consistent with electron transfer from guanine to the singlet excited state of D2TMPyP4, although IR marker bands for the reduced porphyrin/oxidised guanine were not observed. When PtTMPyP is incorporated into HeLa tumour cells, TRIR studies show protein binding with time-dependent ps/ns changes in the amide absorptions demonstrating TRIR's potential for studying light-activated molecular processes not only with nucleic acids in solution but also in biological cells.
Introduction
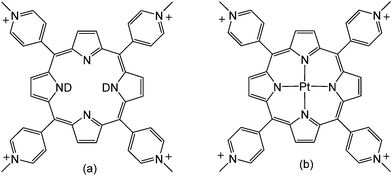
Porphyrins are versatile and tuneable molecules with a wide range of applications.1 Porphyrins derived from 4-N-methylpyridyl porphine (TMPyP4), in particular, have been the subject of intense studies over the last 40 years due to their strong interactions with various nucleic-acid structures including quadruplex DNA, and their potential role as photodynamic therapeutic (PDT) agents, probes and telomerase inhibitors.2 A wide range of spectroscopic techniques have been used to characterise these porphyrins and their interactions with biomolecules, including absorption, steady-state and time-resolved emission spectroscopy, CD/LD, transient absorption spectroscopy, resonance Raman, resonance light scattering, NMR and X-ray crystallography.1–3Time-resolved infrared spectroscopy (TRIR) has become increasingly utilised for studying photo-active bio-molecules, due to its abilities to provide both structural and kinetic information on excited states and reaction intermediates,4 and more recently has been shown to provide unique markers for binding of metal complexes to nucleic acids.5 Despite this, there have been, to our knowledge, no corresponding reports on the TRIR of cationic porphyrin compounds. Here we report a TRIR study of two porphyrins TMPyP4 and PtTMPyP4 (Scheme 1) with various nucleic acids.
The singlet excited state of the free-base TMPyP4 has a lifetime of 4–5 ns,6 whereas by contrast PtTMPyP4 is expected to undergo sub-picosecond singlet-to-triplet inter-system crossing.7 This triplet subsequently decays with a lifetime of 1 μs in aerated solution,8 so that the triplet state is the sole electronic excited state present in the time range of the TRIR experiments reported here (2–2500 ps). Both porphyrins are known to intercalate into double-stranded DNA and also to bind to the human telomeric sequence and inhibit telomerase activity.2,9 It has been shown in previous studies with metal polypyridyl compounds that TRIR can provide valuable information about the site of binding of such photosensitisers to nucleic acids. A principal objective of our study is to see whether similar information could be obtained with TMPyP4 and PtTMPyP4 by studying their behaviour when bound to 5′-guanosine monophosphate (GMP), double-stranded oligonucleotides and the quadruplex structure formed from the c-MYC oncogene.
Free-base TMPyP4 is of notable interest as it undergoes partial fluorescence quenching in the presence of G-containing nucleic acids (about 50% in poly(dG-dC)), proposed to be due to electron transfer from guanine to the photo-excited porphyrin.2c,10,11 Very recent fs-transient absorption (TA) studies have suggested the formation of a short-lived (170 fs) oxidised guanine species,12 although a clear absorption band characteristic for the reduced porphyrin13 was not reported. It was hoped in the current study that TRIR, which is known to readily detect the products of oxidised guanine occurring following electron transfer, might shed further light on the mechanism of this process.
As TMPyP derivatives are known to be taken up by biological cells14 we have further examined the behaviour of PtTMPyP4 in HeLa tumour cells. In particular we hoped to obtain information about the biomolecules targeted by TMPyP porphyrins, as molecules such as nucleic acids or proteins have characteristic spectroscopic signatures.
Results and discussion
As noted above, PtTMPyP4 undergoes intersystem crossing in the sub-picosecond regime.7 It is also known to photo-oxidise guanine much more slowly than the metal-free porphyrin,15 so it is expected that its TRIR excited-state dynamics should be easier to interpret. In the following sections we look at the TRIR of PtTMPyP4 in D2O buffer and then when bound to various nucleic acids.PtTMPyP4 in D2O
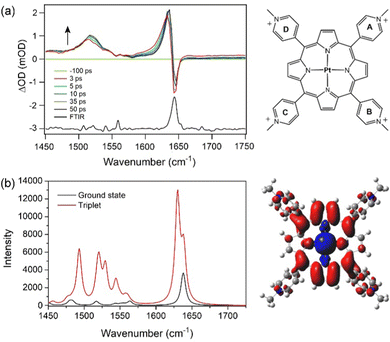
The ground-state IR spectra for PtTMPyP4 in D2O is dominated by a strong band at 1643 cm−1 (Fig. 1). TRIR spectra recorded 2 ps after excitation (400 nm) into the strong Soret B-band shows removal of the ground state, indicated by a negative-going “bleach” peak at 1643 cm−1 and the appearance of a positive band at lower wavenumber, which shifts to 1636 cm−1 over the first few picoseconds. We assign this transient absorption band to the 3ππ* excited state. Weaker broader transient bands are also observed in the 1500–1550 cm−1 region (see also Fig. S1, ESI†). These, like the 1636 cm−1 band, are found to shift to higher wavenumbers within a few picoseconds, which we attribute to vibrational cooling (Fig. 1 and Fig. S1, ESI†). Exponential fitting was performed for growth at the peak maxima at 1518 cm−1 and 1636 cm−1. Lifetimes of ca. 4 ps were obtained (Fig. S1 and Table S1, ESI†).To aid the interpretation of the TRIR spectra, the infrared spectra of the lowest energy singlet (ground state) and the lowest energy triplet states of PtTMPyP4·D2O were simulated by Density Functional Theory (DFT) methods using the B3LYP hybrid functional and the LANL2DZ basis set and solvent correction used the polarisable continuum model (PCM) for water (Tables S2–S4, ESI†). Because of the considerable difficulty in locating the global minimum on the potential energy hypersurface when considering the highly symmetric PtTMPyP4, a water molecule was introduced close to the coordination sphere of the platinum atoms, at a Pt-OD2 distance of 2.4 Å. The introduction of the remote water reduces the tendency for the system to rotate about the C4 axis during the optimisation process. The calculations reveal that the angle of the pyridinium groups to the plane of the porphyrin ring changes from 68 ± 1° in the ground state to 63 ± 1° for the A and C and 57 ± 1° for B and D rings in the triplet state. The electron density difference map for the lowest energy triplet state indicates that this state has substantial metal-to-porphyrin charge-transfer character16 with slightly more electron density moving to rings A and C compared to B and D (see the electron density difference map to the right of Fig. 1b where blue volumes represent regions where the electron density is less in the triplet state compared to the ground-state while red volumes indicate an increase in electron density in the triplet state over the singlet ground state). The calculated infrared spectra are presented in Fig. 1b. The calculation confirmed that the ground state band at ca. 1640 cm−1 comprises two almost degenerate modes localised predominantly on the Mepy+ groups, as found for similar porphyrins.17 In the triplet state one of these signals is enhanced and shifted to lower energy by 11 cm−1. This mode is localised on one set of trans-Mepy+ groups (rings A and C in Fig. 1a) which are in receipt of the greater electron density in the transition. The shoulder on the high energy side of this feature, which is not enhanced significantly, corresponds to vibrations on the alternate set of trans Mepy+ units. The broad transient observed at 1515 cm−1 is predicted to be a series of vibrations, and combination of vibrations, centred on the porphyrin and pyridinium rings.
PtTMPyP4 in presence of guanine-containing DNA
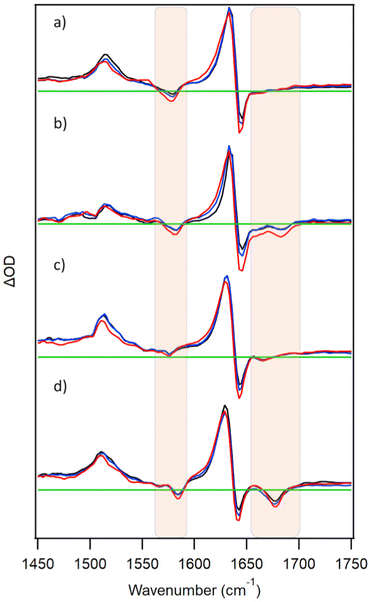
PtTMPyP4 has been reported to form a ground-state complex with the guanine mononucleotide 5′-GMP.15a The TRIR spectrum recorded at 2 ps after excitation of PtTMPyP4 in the presence of 10 mM 5′-GMP is shown in Fig. 2a. This exhibits a strong bleach at 1578 cm−1 and a broad bleach at 1670 cm−1 in addition to the porphyrin bands. These extra features coincide with the IR bands of GMP, namely the G ring (1578 cm−1) and carbonyl (1670 cm−1) vibrations, and their appearance reflects the change in environment experienced by the nucleotide upon photo-excitation of the close-lying porphyrin. This is a similar phenomenon to that reported with DNA-intercalating Re(I),18 Ru(II)19 and Cr(III)20,21 complexes, though to our knowledge this is the first example of such an effect with a mononucleotide-bound chromophore. Under the conditions of the experiment >98% of the porphyrin is expected to be bound to GMP, as a mixture of PtTMPyP4·GMP and PtTMPyP4·(GMP)2 complexes.15a It has also been proposed previously on the basis of fluorescence lifetime data that there were four components in the solution of TMPyP4 and GMP, possibly indicating different orientations of the porphyrin and the mononucleotide.10c The broad nature of the signal in the carbonyl region may be attributable to this mixture of species.In the presence of double-stranded DNA formed from the self-complementary guanine-rich sequence d(GC)5, excitation of PtTMPyP4 produces bleach bands associated with the cytosine (1660 cm−1) and guanine (1685 cm−1) carbonyl vibrations, as expected for the porphyrin intercalated between the GC base-pairs (Fig. 2b). Similarly, in the presence of a mixed GC/AT sequence {d(CGCAAATTTGCG)}2 a bleach band is observed at 1670 cm−1, implying that the porphyrin intercalates preferentially at the GC base-pairs rather than binding at AT-rich sites (bands are expected for adenine at 1625 cm−1 and for thymine at 1640 cm−1, 1666 cm−1 and 1690 cm−1).22
As noted earlier, TMPyP porphyrins are known to stack onto guanine tetrads formed from quadruplex DNA.2d In Fig. 2d it is shown that excitation of PtTMPyP4 in the presence of the quadruplex-forming c-MYC sequence d{(TAGGGAGGG)2T} induces strong bleach signals characteristic of guanine at 1678 cm−1. This is expected if the porphyrin is stacked on the guanine tetrad. Similar site effects have been recently reported for a ruthenium polypyridyl complex.23
Interestingly, the tracking of the 1640 cm−1 band to higher wavenumbers, as observed for free PtTMPyP4 (Fig. 1), is present with GMP- and ODN-bound porphyrin, but with much decreased prominence in the ODN systems. Lifetimes of ca. 5 ps are observed on exponential fitting at 1620 cm−1 in all cases (Fig. S2 and Table S1, ESI†).‡ It is possible that the more structured binding environment in DNA and protection from water moderates the vibrational cooling processes. It is also notable that after the initial cooling processes there is very little subsequent evolution of the spectrum on the picosecond timescale, consistent with the long excited-state lifetime and lack of reaction with the nucleotides as confirmed by complementary TA experiments (Fig. S3, ESI†).
Free-base TMPyP4 in D2O
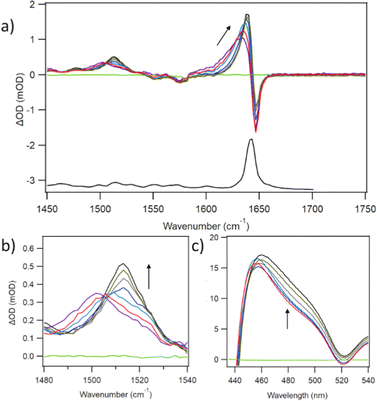
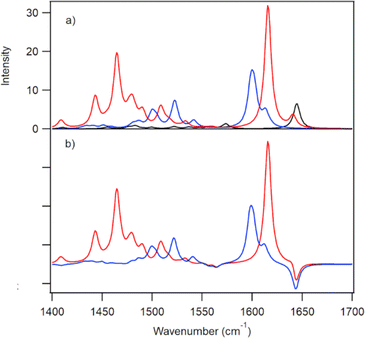
The principal IR features of D2TMPyP4 are similar to those of PtTMPyP4, namely a large band in the FTIR at 1643 cm−1 and a corresponding bleach in the TRIR, and transient features at 1636 cm−1 and 1500 cm−1 (Fig. 3a). Pronounced tracking from low to high wavenumber is evident in both transient bands, but significantly greater for the lower frequency band whose maximum moves from 1503 to 1513 cm−1 (Fig. 3b). Kinetic fits were performed on the decays over the first 50 ps. At 1638 cm−1 a lifetime of 4.0 ps is observed whereas at 1513 cm−1 the lifetime is 13.2 ps (Fig. S4 and Table S1, ESI†). Interestingly, corresponding TA experiments revealed a spectral change at 480 nm over the same (<50 ps) timescale (Fig. 3c).DFT calculations were performed on the ground and the lowest energy singlet excited state of D2TMPyP4 providing simulated IR spectra for both species (Fig. 4). The structure of the excited-state species was optimised using TD-DFT methods (Tables S5 and S6, ESI†). The pyridinium methyl groups were frozen in the latter stages of the optimisations and the resulting coordinates are presented in the ESI.† The IR spectra of H2TMPyP4 and HDTMPyP4 were also simulated, but only very minor spectral differences were predicted in the 1450 to 1750 cm−1 region (Fig. S5, ESI†).
As D2TMPyP4 is proposed to undergo photoinduced electron transfer in the presence of guanine, the simulated spectrum of the singly reduced porphyrin was also calculated. This species is predicted to have strong absorptions around 1450 cm−1 and 1620 cm−1 (Fig. 4b).
Free-base TMPyP4 bound to nucleic acids
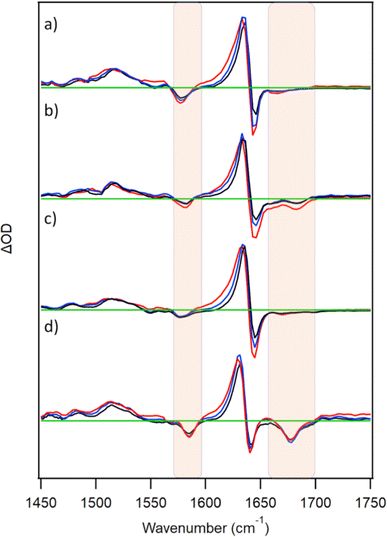
TRIR spectra were also recorded for D2TMPyP4 in the presence of GMP, {d(GC)5}2, {d(CGCAAATTTGCG)}2 or c-MYC (Fig. 5). In all four systems, similar nucleotide bleach bands to those of the corresponding PtTMPyP4-bound systems were observed. This is consistent with the similar binding properties of the two porphyrins. With each of the nucleic acids, a shift in the main transient band (1636 cm−1) at the early picosecond delays is evident. Monitoring at 1620 cm−1 shows signals decreasing with lifetimes of 5–10 ps for the various systems (Fig. S6 and Table S1, ESI†).In contrast to what is observed for PtTMPyP4, the excited state of metal-free TMPyP4 is further quenched by both GMP and {d(GC)5}2 on the ps/ns timescale. In the presence of 5′-GMP, a mono-exponential fit after 50 ps (when initial cooling processes are complete) yields a value of 0.7 ± 0.1 ns, broadly in agreement with those previously recorded by ps/ns-fluorescence lifetime measurements.10 A lifetime of 2.4 ± 0.6 ns was recorded in the presence of {d(GC)5}2, in agreement with fluorescence lifetime measurements of TMPyP4 in the presence of poly(dG-dC) (see Fig. S7 and Table S7, ESI†).11 By way of comparison ps-TA spectra were also recorded and comparable kinetics were obtained (Fig. S8, S9 and Table S8, ESI†). For the TRIR of TMPyP4 in the presence of c-MYC, a value of 1.9 ± 0.3 ns was obtained (where biexponential fitting was used, values of 0.73 ± 0.43 ns (52%) and 4.9 ± 2.8 ns (48%) were obtained). These values are in line with those reported using fluorescence lifetime measurements on TMPyP4 bound to other G-quadruplex sequences.24
The quenching of free-base TMPyP4 singlet state has been attributed to electron transfer (ET) from guanine to the porphyrin singlet excited state.2c,10,11 TRIR has been demonstrated to be a powerful technique for monitoring guanine photo-oxidation, as oxidised guanine exhibits a distinctive marker band at 1700 cm−1, which has been observed for intercalating Ru/Re complexes and UV-excited DNA.4,18,19 Surprisingly, this marker band is not observed for TMPyP4-GMP/{d(GC)5}2, despite efficient emission quenching. A similar behaviour was observed with [Cr(phen)2(dppz)]3+, where the G radical cation is also not observed despite strong emission quenching.20 The absence of distinctive oxidation bands in the TRIR may be indicative of the back ET being faster than the forward reaction. Steenkeste et al. have also reported very rapid reverse ET with derivatives of H2TMPyP4.25
In a recent fs-TA study, Wang et al. have reported that the initially formed Soret excited state induces very rapid (about 50 fs) electron transfer from guanine.12 The species so formed (which possesses a broad absorption band between 500 and 600 nm) decays with a lifetime of about 170 fs. This is very much shorter than the species we observe in our TRIR experiments and which we have assigned to the lowest singlet excited state.
PtTMPyP4 in HeLa tumour cells
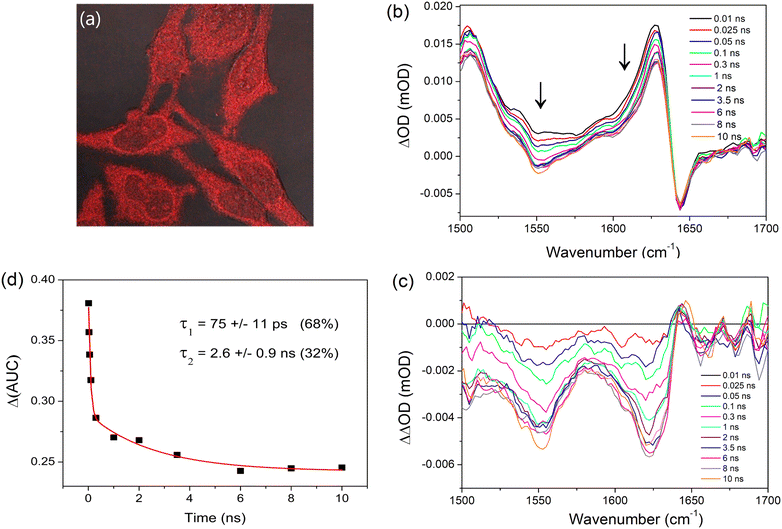
Given the well characterised binding of PtTMPyP4 to DNA and its biological activity noted above, we sought to evaluate whether TRIR spectroscopy could be used to probe its excited-state processes in cells. HeLa cells were grown to high confluency on CaF2 discs which were incubated with PtTMPyP4 (100 μM) for 4 h and rinsed to remove any free porphyrin prior to fixing with MeOH. UV-visible absorption spectroscopy of these fixed cells confirmed the presence of the porphyrin Soret B-band, which was observed at 412 nm, shifted from 406 nm recorded for the free porphyrin in cell medium (Fig. S10 and S11, ESI†). Luminescence imaging of these MeOH-fixed cells by confocal microscopy shows evidence of localisation with points of bright intensity in the cytoplasm, indicating specific organelle/structure targeting, as shown in Fig. 6a. Furthermore, the nuceoli, which have high protein content, appear to be brightly stained within the nucleus. Whereas the ground-state infrared signal of the porphyrin is not distinguishable in the FTIR spectrum of the fixed cell sample (Fig. S12, ESI†), excitation of the PtTMPyP4 fixed cell sample at 400 nm resulted in reproducible TRIR signals in the 1500–1700 cm−1 region, see Fig. 6b. (No equivalent signal or kinetics data could be detected from fixed cells, which had not been treated with the porphyrin (Fig. S13, ESI†).) The maximum of the characteristic transient band of PtTMPyP4 was found at 1627 cm−1 (compared to 1636 cm−1 in D2O) and to have broadened slightly, while the bleach band at 1645 cm−1 was co-incident with that in D2O.Interestingly, unlike in solution, the transient signal at 1627 cm−1 was found to decrease (26%) between 10 ps and 10 ns. A strong decrease in absorption is also observed in the 1550 cm−1 region. To investigate this further, the earliest delay signal (10 ps) was subtracted from the later spectra. This revealed the evolution over 2–3 ns of a structured infrared signal with maxima at 1622 cm−1 and 1550 cm−1 (Fig. 6c). The signal between 1600 and 1638 cm−1 was found to undergo a biexponential decay with lifetimes of 75 ± 11 ps (68%) and 2.6 ± 0.9 ns (32%) (Fig. 6d).
The principal mid-infrared vibrations detected for biological molecules in the cell arise due to lipids, nucleic acids, carbohydrates and proteins. The absence in Fig. 6b of bleaches between 1660 cm−1 and 1700 cm−1 associated with the DNA base carbonyl vibrations rule out the binding of PtTMPyP4 primarily with cellular DNA. There is also an absence in the carbonyl bleach that would be expected due to lipid interaction (1710–1750 cm−1), while other lipid, (3010–2850 cm−1), carbohydrate and the phosphate vibrations of nucleic acids (<1440 cm−1) unfortunately lie outside the window of detection.26 The IR bands observed here are located in the region where Amide I and Amide II protein vibrations are observed,27 which leads to our proposal that these bands correspond to cellular protein. The appearance of these bands suggest (i) that changes have occurred to the ground state of the protein following selective excitation of the porphyrin and (ii) that the protein is a major site of porphyrin binding, which agrees with previous studies.28 Additionally, the position of the Amide I band is characteristic of the β-sheet region and porphyrins have previously been reported to target this region upon binding.29
The reason for the decay of the amide signal is still to be fully determined. Ultrafast kinetic perturbation methods30 suggest the timescale for protein unfolding to be much longer (on the order of 10 ns to 10 μs,) with molecular changes such as hydrogen bond breaking and charge transfer occurring on significantly faster timescales (fs to ps). Photosensitised electron transfer has previously been reported in the case of cytochrome C.8a Our DFT calculations predict that the reduced porphyrin ([PtTMPyP4]3+) should show a band at 1616 cm−1 due to Mepy+ groups and weaker bands centred at 1522 and 1546 cm−1 (Fig. S14, ESI†). Notably, such a shift of the Mepy+ is not observed in our experiments. We propose therefore that the change in the amide bands is due to thermal effects caused by energy dissipation from the initially formed excited state. A similar explanation has been proposed for an anionic porphyrin bound to bovine serum albumin.31 It is possible that this heating may then lead to localised alterations in structure such as the unfolding of proteins.29
Insights provided by TRIR studies
Overall, the study shows the value of applying TRIR to the study of excited-state processes of multicomponent systems such as those involving photophysical probes and photosensitisers.In the studies reported here interpretation is more straightforward for PtTMPyP4 as the only electronically excited state present at times longer than a picosecond is the triplet and it is known to only very slowly oxidise DNA bases. The maxima of the principal bands observed for PtTMPyP4 shift to 1636 cm−1 and 1519 cm−1 over the first few picoseconds, as expected for vibrational cooling. The extent of band shifting is less significant when the porphyrin is bound to the nucleic acid, presumably a consequence of the more constrained environment in that case.
Interestingly, different behaviour is observed for the lower wavenumber band of D2TMPyP4 in D2O, which is consistent with the interconversion of two species rather than only vibrational cooling. As some of the vibrations in this area are porphyrin-ring based, it is possible that this process is due to ring puckering, as recently described by Burghardt and co-workers.32 In agreement with this proposal, in the presence of DNA, when puckering is hindered, the band at ca. 1515 cm−1 does not show this behaviour.
When the porphyrins are bound to the various nucleic acids, the TRIR shows signals of not only the porphyrins but ‘bleaches’ which are characteristic of the site to which the porphyrin is bound. Both porphyrins show similar patterns of bleaches as expected from the similarity of their binding behaviour with nucleic acids, facilitated by the planar geometries of both compounds.
It is well established that when bound in the proximity of a guanine, the fluorescence of H2TMPyP4 (or D2TMPyP4) is quenched and that this process is believed to proceed by electron transfer from the guanine to the singlet excited state. Our experiments show that the TRIR spectrum of the species observed 2 ps after excitation is similar whether the D2TMPyP4 is free in solution or bound to DNA. This is consistent with the species being the singlet excited state in all cases. As noted above, Wang et al. have proposed that there is very fast electron transfer from the initially formed Soret excited state with the resultant formation of a species which decays with a lifetime of 170 fs.12 We suggest that this decay must still lead to the lowest excited singlet state. Subsequently the singlet state if close to guanine is quenched at rates which range from 0.7 ns−1 to 2.4 ns−1 depending on the nucleic acid involved. However, in no case was it possible to observe the signal at ca. 1700 cm−1 characteristic of the one-electron oxidised guanine. This is consistent with back electron transfer being more rapid than the forward rate of quenching of the excited state.
Our experiments with PtTMPyP4 in the fixed HeLa tumour cells show that TRIR can yield valuable information on the principal binding site of the porphyrin – in this case demonstrating that binding is to proteins rather than to nucleic acids, as previously expected.
Conclusions
The work reported here shows that TRIR, complemented by DFT calculations, can provide valuable information on the behaviour of porphyrins when bound to nucleic acids or in biological cells. The technique is particularly useful in that it can simultaneously probe both the porphyrin and the biomolecules. For the TMPyP4 compounds TRIR provides data not only on how the properties of the excited states of the porphyrins are affected by binding to biomolecules but also gives information about the identity of the non-covalent binding sites. TRIR should, therefore, be of general value for monitoring ultra-fast processes of related photosensitisers in biological cells and may complement studies performed by the recently developed transient absorption microscopy.33Experimental
TMPyP4 (meso-tetra(N-methyl-4-pyridyl)porphine tetra(p-toluenesulfonate) was purchased from Midcentury. Pt(II)TMPyP4 tetrachloride was purchased from Frontier Scientific. Porphyrins were used without further purification. HPLC-purified oligodeoxynucleotide sequences were obtained from Eurogentec. TRIR spectra were recorded on the LIFEtime34 or TRMPS35 system, and psTA spectra recorded on the ULTRA36 apparatus, at the Rutherford Appleton Laboratories. Further details on transient spectroscopic methods, computational methods, confocal microscopy and preparations of solution and cell samples are provided in the SI.Author contributions
PMK, JMK and SJQ designed and supervised the TRIR experiments. PMK, CZ, FEP, SE-A and SJD carried out the TRIR experiments. PMD, IVS and MT set up and optimised the TRIR and TA instruments. SAB and SE-A prepared the HeLa cell samples and their imaging under the supervision of DCW, TG and SWB. CJC provided some funding and resources. CL carried out and interpreted all the DFT calculations. PMK, JMK, CL and SJQ wrote the manuscript.Conflicts of interest
There are no conflicts to declare.Acknowledgements
We thank STFC for programme access to the CLF (App 13230047), this work was supported by BBSRC grants BB/K019279/1 and BB/M004635/1 to Professor Christine Cardin, and in support of the LIFEtime instrument (Alert 13 BB/L014335/1), the Royal Irish Academy/Royal Society exchange programme, Science Foundation Ireland (SFI PI Awards 10/IN.1/B2999 and 13/IA/1865 to TG) and the Irish Research Council (FEP, CZ GOIPG/2019/4510 and SJD GOIPG/2016/805). The authors wish to acknowledge the DJEI/DES/SFI/HEA Irish Centre for High-End Computing (ICHEC) for the provision of computational facilities.Notes and references
- G. Pratviel, Coord. Chem. Rev., 2016, 308, 460–477 CrossRef CAS.
- (a) R. J. Fiel, J. C. Howard, E. H. Mark and N. Datta-Gupta, Nucleic Acids Res., 1979, 6, 3093–3118 CrossRef CAS PubMed; (b) R. F. Pasternack, E. J. Gibbs and J. J. Villafranca, Biochemistry, 1983, 22, 2406–2414 CrossRef CAS PubMed; (c) J. M. Kelly, M. J. Murphy, D. J. McConnell and C. OhUigin, Nucleic Acids Res., 1985, 13, 167–184 CrossRef CAS PubMed; (d) R. T. Wheelhouse, D. Sun, H. Han, F. X. Han and L. H. Hurley, J. Am. Chem. Soc., 1998, 120, 3261–3262 CrossRef CAS.
- (a) B. Jin, J. E. Ahn, J. H. Ko, W. Wang, S. W. Han and S. K. Kim, J. Phys. Chem. B, 2008, 112, 15875–15882 CrossRef CAS PubMed; (b) L. A. Lipscomb, F. X. Zhou, S. R. Presnell, R. J. Woo, M. E. Peek, R. R. Plaskon and L. D. Williams, Biochemistry, 1996, 35, 2818–2823 CrossRef CAS PubMed; (c) J. A. Strickland, L. G. Marzilli, W. D. Wilson and G. Zon, Inorg. Chem., 1989, 28, 4191–4198 CrossRef CAS; (d) S. G. Kruglik, V. A. Galievsky, V. S. Chirvony, P. A. Apanasevich, V. V. Ermolenkov, V. A. Orlovich, L. Chinsky and P.-Y. Turpin, J. Phys. Chem., 1995, 99, 5732–5741 CrossRef CAS; (e) R. Jasuja, T. L. Hazlett, M. K. Helms, S.-H. Lee, D. M. Jameson and R. V. Larsen, Chem. Phys. Lett., 2001, 350, 515–521 CrossRef CAS.
- (a) M. Towrie, G. W. Doorley, M. W. George, A. W. Parker, S. J. Quinn and J. M. Kelly, Analyst, 2009, 134, 1265–1273 RSC; (b) D. B. Bucher, B. M. Pilles, T. Carell and W. Zinth, Proc. Natl. Acad. Sci. U. S. A., 2014, 111, 4369–4374 CrossRef CAS PubMed.
- P. M. Keane and J. M. Kelly, Coord. Chem. Rev., 2018, 364, 137–154 CrossRef CAS.
- K. Kano, T. Miyake, K. Uomoto, T. Sato, T. Ogawa and S. Hashimoto, Chem. Lett., 1983, 1867–1870 CrossRef CAS.
- K. Kalyanasundaram, Photochemistry of Polypyridine and Porphyrin Complexes, Academic Press, 1992 Search PubMed.
- (a) M. Börsch, Proc. SPIE–Int. Soc. Opt. Eng., 2010, 7551, 75510G CrossRef; (b) I. A. Blinova and V. V. Vasil’ev, Russ. J. Phys. Chem., 1995, 69, 1097–1101 CAS.
- (a) E. Nyarko, N. Hanada, A. Habib and M. Tabata, Inorg. Chim. Acta, 2004, 357, 739–745 CrossRef CAS; (b) D.-F. Shi, R. T. Wheelhouse, D. Sun and L. H. Hurley, J. Med. Chem., 2001, 44, 4509–4523 CrossRef CAS PubMed.
- (a) C. Belin, MSc thesis, Trinity College Dublin, 1992 Search PubMed; (b) R. Jasuja, D. M. Jameson, C. K. Nishijo and R. W. Larsen, J. Phys. Chem. B, 1997, 101, 1444–1450 CrossRef CAS; (c) I. V. Sazanovich, E. P. Petrov and V. S. Chirvony, Opt. Spectrosc., 2006, 100, 209–218 CrossRef CAS.
- V. S. Chirvony, V. A. Galievsky, N. N. Kruk, B. M. Dzhagarov and P.-Y. Turpin, J. Photochem. Photobiol., B, 1997, 40, 154–162 CrossRef CAS.
- L.-L. Wang, H.-H. Wang, H. Wang and H.-Y. Liu, J. Phys. Chem. B, 2021, 125, 5683–5693 CrossRef CAS PubMed.
- (a) S. Mosseri, G. S. Nahor, P. Neta and P. Hambright, J. Chem. Soc., Faraday Trans., 1991, 87, 2567–2572 RSC; (b) E. Van Caemelbecke, A. Derbin, P. Hambright, R. Garcia, A. Doukkali, A. Saoiabi, K. Ohkubo, S. Fukuzumi and K. M. Kadish, Inorg. Chem., 2005, 44, 3789–3798 CrossRef CAS PubMed; (c) V. V. Vasil’ev, I. A. Blinova, I. V. Golovina and S. M. Borisov, J. Appl. Spectrosc., 1999, 66, 583–587 CrossRef.
- V. Cenklová, J. Photochem. Photobiol., B, 2017, 173, 522–537 CrossRef PubMed.
- (a) P. M. Keane and J. M. Kelly, Photochem. Photobiol. Sci., 2011, 10, 1578–1586 CrossRef CAS PubMed; (b) P. M. Keane and J. M. Kelly, Photochem. Photobiol. Sci., 2016, 15, 980–987 CrossRef CAS PubMed.
- F. J. Vergeldt, R. B. M. Koehorst, A. van Hoek and T. J. Schaafsma, J. Phys. Chem., 1995, 99, 4397–4405 CrossRef CAS.
- M. Aydin, Molecules, 2014, 19, 20988–21021 CrossRef PubMed.
- Q. Cao, C. M. Creely, E. S. Davis, J. Dyer, T. L. Easun, D. C. Grills, D. A. McGovern, J. McMaster, J. Pitchford, J. A. Smith, X.-Z. Sun, J. M. Kelly and M. W. George, Photochem. Photobiol. Sci., 2011, 10, 1355–1364 CrossRef CAS PubMed.
- P. M. Keane, K. O’Sullivan, F. E. Poynton, B. C. Poulsen, I. V. Sazanovich, M. Towrie, C. J. Cardin, X.-Z. Sun, M. W. George, T. Gunnlaugsson, S. J. Quinn and J. M. Kelly, Chem. Sci., 2020, 11, 8600–8609 RSC.
- S. J. Devereux, P. M. Keane, S. Vasudevan, I. V. Sazanovich, M. Towrie, Q. Cao, X.-Z. Sun, M. W. George, C. J. Cardin, N. A. P. Kane-Maguire, J. M. Kelly and S. J. Quinn, Dalton Trans., 2014, 43, 17606–17609 RSC.
- F. A. Baptista, D. Krizsan, M. Stitch, I. V. Sazanovich, I. P. Clark, M. Towrie, C. Long, L. Martinez-Fernandez, R. Improta, N. A. P. Kane-Maguire, J. M. Kelly and S. J. Quinn, J. Am. Chem. Soc., 2021, 143, 14766–14779 CrossRef CAS PubMed.
- M. Banyay, M. Sarkar and A. Gräslund, Biophys. Chem., 2003, 104, 477–488 CrossRef CAS PubMed.
- S. J. Devereux, F. E. Poynton, F. R. Baptista, T. Gunnlaugsson, C. J. Cardin, I. V. Sazanovich, M. Towrie, J. M. Kelly and S. J. Quinn, Chem. – Eur. J., 2020, 26, 17103–17109 CrossRef CAS PubMed.
- (a) H.-J. Zhang, X.-F. Wang, P. Wang, X.-C. Ai and J.-P. Zhang, Photochem. Photobiol. Sci., 2008, 7, 948–955 CrossRef CAS PubMed; (b) C. Wei, G. Jia, J. Zhou, G. Hana and C. Li, Phys. Chem. Chem. Phys., 2009, 11, 4025–4032 RSC.
- K. Steenkeste, M. Enescu, F. Tfibel, M. Perrée-Fauvet and M.-P. Fontaine-Aupart, J. Phys. Chem. B, 2004, 108, 12215–12221 CrossRef CAS.
- M. J. Baker, J. Trevisan, P. Bassan, R. Bhargava, H. J. Butler, K. M. Dorling, P. R. Fielden, S. W. Fogarty, N. J. Fullwood, K. A. Heys, C. Hughes, P. Lasch, P. L. Martin-Hirsch, B. Obinaju, G. D. Sockalingum, J. Sulé-Suso, R. J. Strong, M. J. Walsh, B. R. Wood, P. Gardner and F. L. Martin, Nat. Protoc., 2014, 9, 1771–1791 CrossRef CAS PubMed.
- F. S. Ruggeri, C. Marcott, S. Dinarelli, G. Longo, M. Girasole, G. Dietler and T. P. J. Knowles, Int. J. Mol. Sci., 2018, 19, 2582 CrossRef PubMed.
- E. Alves, C. Moreirinha, M. A. Faustino, Â. Cunha, I. Delgadillo, M. G. Neves and A. Almeida, Future Med. Chem., 2016, 8, 613–628 CrossRef CAS PubMed.
- J. Belcher, S. Sansone, N. F. Fernandez, W. E. Haskins and L. Brancaleon, J. Phys. Chem. B, 2009, 113, 6020–6030 CrossRef CAS PubMed.
- V. Muñoz and M. Cerminara, Biochem. J., 2016, 473, 2545–2559 CrossRef PubMed.
- G. Li, D. Magana and R. B. Dyer, Nat. Commun., 2014, 5, 3100 CrossRef PubMed.
- K. Falahati, C. Hamerla, M. Huix-Rotllant and I. Burghardt, Phys. Chem. Chem. Phys., 2018, 20, 12483–12492 RSC.
- A. De la Cadena, D. y Davydova, T. Tolstik, C. Reichardt, S. Shukla, D. Akimov, R. Heintzmann, J. Popp and B. Dietzek, Sci. Rep., 2016, 6, 33547 CrossRef CAS PubMed.
- G. M. Greetham, P. M. Donaldson, C. Nation, I. V. Sazanovich, I. P. Clark, D. J. Shaw, A. W. Parker and M. Towrie, Appl. Spectrosc., 2016, 70, 645–653 CrossRef CAS PubMed.
- G. M. Greetham, D. Sole, I. P. Clark, A. W. Parker, M. R. Pollard and M. Towrie, Rev. Sci. Instrum., 2012, 83, 103107 CrossRef CAS PubMed.
- G. M. Greetham, P. Burgos, Q. Cao, I. P. Clark, P. S. Codd, R. C. Farrow, M. W. George, M. Kogimtzis, P. Matousek, A. W. Parker, M. R. Pollard, D. A. Robinson, Z. J. Xin and M. Towrie, Appl. Spectrosc., 2010, 64, 1311–1319 CrossRef CAS PubMed.
Footnotes |
| † Electronic supplementary information (ESI) available: Additional TRIR/TA data, FTIR spectra, calculations and experimental details. See DOI: https://doi.org/10.1039/d2cp04604k |
| ‡ The cooling dynamics of the DNA-bound systems were examined at 1620 cm−1 as the change of the signal intensity at the band max of 1636 cm−1 was very small in these cases. |
| This journal is © the Owner Societies 2022 |

