
 Open Access Article
 This Open Access Article is licensed under a
 Creative Commons Attribution 3.0 Unported Licence
Hydration-induced protomer switching in p-aminobenzoic acid studied by cold double ion trap infrared spectroscopy†
Kyota
Akasaka
ab,
Keisuke
Hirata
 acd,
Fuad
Haddad
e,
Otto
Dopfer
*de,
Shun-ichi
Ishiuchi
*acd and
Masaaki
Fujii
*abd
acd,
Fuad
Haddad
e,
Otto
Dopfer
*de,
Shun-ichi
Ishiuchi
*acd and
Masaaki
Fujii
*abd
aLaboratory for Chemistry and Life Science, Institute of Innovative Research, Tokyo Institute of Technology, 4259 Nagatsuta-cho, Midori-ku, Yokohama, 226-8503, Japan. E-mail: ishiuchi.s.aa@m.titech.ac.jp; mfujii@res.titech.ac.jp
bSchool of Life Science and Technology, Tokyo Institute of Technology, 4259 Nagatsuta-cho, Midori-ku, Yokohama, Kanagawa 226-8503, Japan
cDepartment of Chemistry, School of Science, Tokyo Institute of Technology, 2-12-1 Ookayama, Meguro-ku, Tokyo 152-8550, Japan
dInternational Research Frontiers Initiative, Tokyo Institute of Technology, 4259 Nagatsuta-cho, Midori-ku, Yokohama, 226-8503, Japan. E-mail: dopfer@physik.tu-berlin.de
eInstitut für Optik und Atomare Physik, Technische Universität Berlin, Hardenbergstrasse 36, 10623 Berlin, Germany
First published on 6th December 2022
Abstract
Para-Aminobenzoic acid (PABA) is a benchmark molecule to study solvent-induced proton site switching. Protonation of the carboxy and amino groups of PABA generates O- and N-protomers of PABAH+, respectively. Ion mobility mass spectrometry (IMS) and infrared photodissociation (IRPD) studies have claimed that the O-protomer most stable in the gas phase is converted to the N-protomer most stable in solution upon hydration with six water molecules in the gas-phase cluster. However, the threshold size has remained ambiguous because the arrival time distributions in the IMS experiments exhibit multiple peaks. On the other hand, IRPD spectroscopy could not detect the N-protomer for smaller hydrated clusters because of broad background due to annealing required to reduce kinetic trapping. Herein, we report the threshold size for O → N protomer switching without ambiguity using IR spectroscopy in a double ion trap spectrometer from 1300 to 1800 cm−1. The pure O-protomer is prepared by electrospray, and size-specific hydrated clusters are formed in a reaction ion trap. The resulting clusters are transferred into a second cryogenic ion trap and the distribution of O- and N-protomers is determined by mid-IR spectroscopy without broadening. The threshold to promote O → N protomer switching is indeed five water molecules. It is smaller than the value reported previously, and as a result, its pentahydrated structure does not support the Grotthuss mechanism proposed previously. The extent of O → N proton transfer is evaluated by collision-assisted stripping IR spectroscopy, and the N-protomer population increases with the number of water molecules. This result is consistent with the dominant population of the N-protomer in aqueous solution.
1. Introduction
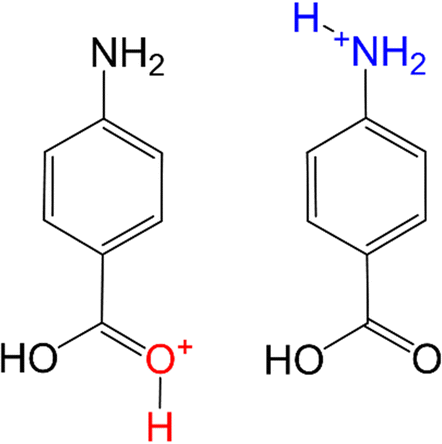
Protonation is one of the most fundamental chemical reactions and a basic step in many synthetic and catalytic processes. Determining the protonation site is important because it changes the chemical properties of the molecule, such as redox behaviour, optical activity, and hydrophobicity.1–4 In addition, some molecules vary their preferred protonation site depending on the surrounding environment such as solvent or counter ion.5–29 Such protonation site-switching obviously has a huge effect on the chemical reactivity and biological activity of the molecule.12,28Para-aminobenzoic acid (PABA) is a benchmark molecule for protonation site-switching.8–11,13–18,20–22,29 PABA has two low-energy protonated isomers, namely the O- and N-protomers resulting from protonation of the carboxy and amino groups, respectively (Fig. 1). Their relative stability varies with type and degree of solvation. While the O-protomer is most stable in the gas phase, the N-protomer becomes more stable in polar solvents such as water. The high stability of the O-protomer in the gas phase arises from the conjugated π-electron system extending from the neutral amino group to the protonated carboxy group. On the other hand, the N-protomer becomes preferable in polar solvents due to its larger solvation energy.14
 | ||
| Fig. 1 Molecular structure of O- and N-protomers of PABAH+. | ||
Infrared (IR) spectroscopy and ion mobility mass spectrometry (IMS) have previously been used to identify the protonation site in polyhydrated clusters of PABAH+. Hebert and Russel tracked changes in the protonation positions in PABAH+(H2O)n by low-temperature IMS.30 They used the electrospray source with a mixed solvent of acetonitrile and water to generate simultaneously both O- and N-protomers. Both protomers are clearly separated by the arrival time distribution (ATD) of the monomer. For clusters up to n = 4, they fitted two Gaussian functions to the ATD but changed to a single broader Gaussian function for n = 5 and a narrower Gaussian for n = 6. From these results, they concluded that the protomer population is dominated by the N-protomer at n = 6. To rationalize this result, they proposed a Grotthus mechanism for proton transfer along a water bridge between the NH2 and COOH groups at n = 6. However, the ATD exhibit for all hydrated PABAH+ clusters multiple peaks and fitting these by only one or two Gaussians may not be fully appropriate, although the DFT calculations also show that the N-protomer becomes most stable at n = 6.
In contrast to the less structure-sensitive IMS spectra, IR spectroscopy can provide direct evidence for the structural assignments of the O- and N-protomers. To this end, Williams and co-workers measured the IR photodissociation (IRPD) spectra of PABAH+(H2O)n (n = 1–6) in the OH/NH stretch range (2600–3900 cm−1) to determine how many water molecules are necessary to stabilize the N-protomer.10 They introduced PABAH+(H2O)n clusters generated directly in the electrospray source into the ion cyclotron resonance mass spectrometer and measured their IRPD spectra. It is known that the electrospray of PABA with water solvent selectively generates the O-protomer of the PABAH+ monomer. The IRPD spectra of PABAH+(H2O)n (n = 1–5) give free NH stretching bands similar to the monomer, while new vibrational bands appear with high intensity in the spectrum of n = 6 (although such bands are already weakly present also for n < 6). They assigned the new bands to the N-protomer in the hydrated cluster, and concluded that hydration by six water molecules stabilizes the N-protomer such that the preferred protonation site switches from COOH to NH2 in PABAH+ at n = 6. One problem of this approach is kinetic trapping of the N-protomer in the hydrated cluster in the electrospray process. As the N-protomer is more stable in aqueous solution, it may remain in the hydrated clusters generated in the electrospray source regardless of its relative stability. To avoid the kinetically trapped N-protomer, they carefully annealed the hydrated clusters by collisions with N2 and measured the IRPD spectra at 130 K. Although annealing and the measurement at 130 K were assumed to avoid kinetic trapping, all IRPD spectra became broader and the spectral signatures of the two protomers became less resolved. Consequently, the presence of the N-protomer in the n = 1–5 spectra is not clear because of the broad background, as stated by the authors. In summary, it appears clear that hydration by six water molecules is sufficient to induce O → N protonation site-switching, however, the minimal number of water molecules required to promote the switching is still unclear.
To reliably determine the threshold for hydration-induced O → N protonation site-switching, we apply herein a more sophisticated spectroscopic strategy. It has clearly been established that only the O-protomer is produced when the PABAH+ monomer is generated from the electrospray of a slightly acidic protic solution.12 This O-protomer of the PABAH+ monomer is mass-selected and then introduced into the first ion trap (reaction trap31,32) containing water vapour to grow PABAH+(H2O)n clusters. If then the N-protomer is detected in the hydrated clusters after the first ion trap by IRPD, it is without any doubt the result of O→N protonation site-switching. The reaction trap has to be kept at a certain elevated temperature (80 K in this work) to promote the intracluster proton transfer reaction. If we measure the IR spectra under such conditions, spectral broadening may not be avoided. This problem is solved by the following means. We use one more ion trap33–35 at very low temperature (4 K in this work) and the hydrated clusters in the warmer reaction trap are mass-selected and transferred into the cryogenic second ion trap at a frozen N/O population ratio. Then, we measure the population of the O- and N-protomers using IRPD spectroscopy by irradiating the mass-selected clusters with a tuneable IR laser (using the tagging approach36). The broadening of IR spectra can be avoided because of the low temperature. In addition, we expand the spectral range down to mid-IR to readily distinguish between the O- and N-protomers. Recently, Johnson and coworkers reported the IRPD spectra of the O- and N-protomers of the PABAH+ monomer and found the clear discrimination of both monomers by probing the C![[double bond, length as m-dash]](https://www.rsc.org/images/entities/char_e001.gif) O stretching range (the CO band can occur only for the N-protomer).20 In addition, the shape of the CO stretching band is rather insensitive to H-bonding with water molecules. This is in stark contrast to the previously investigated N–H stretching range, and thus the new IRPD spectra recorded in the mid-IR (6 μm) range will give clear evidence for the protomer assignments. Finally, we also apply the recently developed collision-assisted stripping IR spectroscopic technique (CAS-IR),27 which enables us to precisely determine the protomer population in highly hydrated clusters. By using both IRPD and CAS-IR in the double ion trap spectrometer, we examine how the protomer abundance ratio in PABAH+ changes as the number of water molecules increases.
O stretching range (the CO band can occur only for the N-protomer).20 In addition, the shape of the CO stretching band is rather insensitive to H-bonding with water molecules. This is in stark contrast to the previously investigated N–H stretching range, and thus the new IRPD spectra recorded in the mid-IR (6 μm) range will give clear evidence for the protomer assignments. Finally, we also apply the recently developed collision-assisted stripping IR spectroscopic technique (CAS-IR),27 which enables us to precisely determine the protomer population in highly hydrated clusters. By using both IRPD and CAS-IR in the double ion trap spectrometer, we examine how the protomer abundance ratio in PABAH+ changes as the number of water molecules increases.
2. Experimental and computational methods
A methanol solution of PABA (Wako, 10−5 M) with 0.5% of formic acid is electrosprayed and the fine droplets are desolvated in a glass capillary heated to ∼80 °C. The generated ions are introduced into the vacuum via an ion funnel. The ions of interest are mass-selected by a quadrupole mass spectrometer (QMS) and transported by a tapered hexapole ion guide. The ions are hydrated in an octupole ion trap (reaction trap31,32) with water vapour introduced by a pulsed valve. The temperature of the reaction trap is maintained at 80 K. Hydrated ions are mass-selected in the second QMS and introduced into the cryogenic quadrupole ion trap (QIT37) via a quadrupole ion deflector and an octupole ion guide. The QIT is maintained at 4 K by a closed-cycle two-stage He refrigerator. Helium buffer gas mixed with H2 is introduced into the QIT by a pulsed valve for collisional cooling of hydrated ions down to ∼10 K, and subsequently H2 molecules are attached to the hydrated PABAH+ cluster (H2 tagging method36). The cold hydrated ions, PABAH+(H2O)n(H2)m, are irradiated with a tuneable OPO/OPA IR laser. The PABAH+(H2O)n photofragments produced by the dissociation of all H2 molecules are monitored by a time-of-flight mass spectrometer. H2 is weakly bound so that the structure of the hydrated PABAH+(H2O)n clusters are not perturbed.36 All IRPD spectra are measured by monitoring the fragment ion yield generated by H2 dissociation as a function of laser wavenumber.When CAS-IR spectra are measured, hydrated ions are directed into the QIT with high kinetic energy (∼16 eV) by lowering the offset voltage at the QIT entrance electrode. The ions are then collisionally dissociated to bare PABAH+, and H2 molecules are attached to PABAH+. The H2-detached photofragments are detected by scanning the wavenumber of the IR laser.
Molecular structures and vibrational frequencies of PABAH+(H2O)n are calculated by density functional theory (DFT). The initial structures of PABAH+(H2O)n are generated automatically by the OPLS38 force field implemented in MacroModel.39 Preliminary DFT calculations are performed for the initial structures at the dispersion-corrected ωB97X-D/6-31G(d,p) level using the Gaussian1640 software. The ωB97X-D method gives better results than B3LYP and MP2.10,27 Relative Gibbs free energies at 298.15 K are also calculated at the same level. The structures whose relative Gibbs free energy are within 10 kJ mol−1 of the most stable protomer are re-calculated at the higher ωB97X-D/6-311++G(d,p) level27 (ESI†). All calculated conformers displayed are local minima on the potential energy surface. The harmonic vibrational frequencies obtained are scaled by 0.952 in the 3 μm range27 and 0.970 (O-protomer)/0.955 (N-protomer) in the 6 μm range. The scaling factor for the 6 μm range is determined by the characteristic band for each protomer at n = 0 (Fig. S1, ESI†). In addition, the Gibbs free energies are re-calculated at 80 K at the higher computational level (Tables S1–S8, ESI†).
3. Results and discussion
Fig. 2 shows the IRPD spectra of PABAH+(H2O)n≤7 recorded in the 1300–1800 cm−1 range. Based on previous studies of bare PABAH+,20 the bands observed in the IRPD spectrum are assigned to C(OH)asym2 at 1508 cm−1, C–NHaryl2 at 1519 cm−1, C–C(OH)aryl2 at 1570–1600 cm−1, and NHbend2 at 1658 cm−1. The bands characteristic of the N-protomer of the PABAH+ monomer, i.e., the CO stretch (1790 cm−1) and NH3 umbrella (1470 cm−1) vibrations indicated by broken lines, are not observed in the spectrum. Thus, all bands present in the recorded spectrum of PABAH+ (n = 0) are attributed to the O-protomer (color-coded in red). This result indicates that the initial protomeric ion injected into the reaction trap is the most stable gas-phase ion, and kinetic trapping of the higher energy N-protomer most stable in solution is not observed. The IRPD spectra of PABAH+(H2O)n (n = 1–7) also show the vibrational bands in the 1500–1700 cm−1 range, which are tentatively assigned to hydrated clusters with an O-protomeric PABAH+ core. The NH3 umbrella band, which is the characteristic mode of the N-PABAH+ core, will be shifted in its hydrated clusters because of H-bonding (NH⋯O ionic H-bonds). On the other hand, the CO stretch band is relatively insensitive to hydration because water molecules form H-bonds mainly around the positively charged NH3+ centre. Thus, the absence and presence of a band above 1700 cm−1 can be attributed to the O- and N-protomer, respectively. This argument means that only O-protomers are populated in the hydrated PABAH+(H2O)n up to four water molecules. For the hydrated cluster with five water molecules, a new band is observed in the range above 1700 cm−1. This band at 1748 cm−1 is assigned to the CO stretch of the N-protomeric core, and thus strongly suggests that the hydration by five water molecules makes the N-protomer of PABAH+ stable enough to be detected. Similarly, the IRPD spectra of hydrated clusters with six and seven water molecules show vibrational bands in the range above 1700 cm−1 (1726 and 1748 cm−1, 1725 and 1746 cm−1, respectively). Thus, O- and N-protomers coexist in the PABAH+(H2O)5–7 size range.
 | ||
| Fig. 2 IRPD spectra of PABAH+(H2O)n with n = 0–7. | ||
To confirm the presence of the N-protomer, theoretical spectra of O- and N-protomers in PABAH+-(H2O)n (n = 0–7) obtained by quantum chemical calculations are compared to the observed spectra. Gibbs free energies of optimized structures for n = 0–7 are listed in Tables S1–S8 in ESI,† respectively. The computed spectra of the ten most stable structures for n = 0–3 are compared to the observed ones in Fig. S2–S5 (ESI†), respectively. The bands observed for n = 0–3 are well assigned to O-protomer transitions (Fig. S2–S5, ESI†). Fig. 3b compares the computed spectra of the most stable N- and O-protonated PABAH+(H2O)4 clusters to the observed IRPD spectrum (Fig. 3a). The bands observed between 1500 and 1650 cm−1 are similar to those in the spectrum computed for the most stable O-protomer in PABAH+(H2O)4. The theoretical spectra for the N-protomer predict the CO stretch band at 1765 cm−1. However, no clear band is observed in the range above 1700 cm−1, suggesting that the population of the N-protomer in PABAH+(H2O)4 is (at most) small and thus below the detection limit (Fig. S6–S9, ESI†). This observation is indeed consistent with the calculated Gibbs free energies (80 K) of PABAH+(H2O)4, for which the most stable isomer with an N-protomer core is less stable than the most stable one with an O-protomer core by 12.1 kJ mol−1. It should be noted that the NH3 umbrella band for n = 4 is blue-shifted by ∼90 cm−1 (frequency: 1547 cm−1, IR intensity: 114 km mol−1) and overlaps with bands of the O-protomer, making this vibration insensitive for protomer assignment.
 | ||
| Fig. 3 IRPD spectrum of PABAH+(H2O)n with (a) n = 4 and (c) n = 5 in comparison with (b,d) theoretical IR spectra of the most stable N- and O-protomers. Molecular structures are shown next to the computed IR spectra with their relative Gibbs free energies at 80 K in parentheses (in kJ mol−1). It should be noted that the detection sensitivity decreases toward the lower frequency range because of the lower dissociation efficiency of H2-tagged molecules.45 Calculated intensities of the bands at 1316, 1318, and 1589 cm−1 in the n = 4 cluster of the O-protomer core and 1314 and 1584 cm−1 in the n = 5 cluster of the O-protomer core are 711, 734, 896, 1392, and 863 km mol−1, respectively. | ||
In contrast to n ≤ 4, the IRPD spectrum of PABAH+(H2O)5 is not solely assigned to the O-protomer. Specifically, the band at 1748 cm−1 cannot be reproduced by O-protomers (Fig. S10 and S12, ESI†). In contrast, one of the theoretical IR spectra of the two most stable pentahydrated PABAH+ clusters with an N-protomer core, for which the CO stretches are calculated at 1730 and 1768 cm−1 (Fig. 3d), can explain the band at 1748 cm−1 (Fig. 3c, d and Fig. S11, S13, ESI†). A more detailed isomer assignment for n = 5 will be given below after assigning the spectra for n = 6 and 7. In any case, the observed band at 1748 cm−1 is a clear signature of the N-protomer core in pentahydrated PABAH+. Bands around 1630 cm−1 are attributed to the most stable O-protomer in pentahydrated clusters. The observation of N-protomer clusters at n = 5 is consistent with their significant stabilization in Gibbs free energy relative to the most stable O-protomer (only 3.5 and 6.9 kJ mol−1 less stable at 80 K) by adding one more water (n = 4 → 5). From this assignment, we conclude that the N-protomeric core begins to appear already at n = 5 and not at n = 6 under the current experimental conditions.
The coexistence of O- and N-protomers in the PABAH+(H2O)n clusters with n = 6 and 7 is also confirmed by their IRPD spectra shown in Fig. 4a–d, respectively. In both spectra, two vibrational bands are observed in the 1700–1800 cm−1 range, which cannot be assigned to O-protomers (Fig. 4 and Fig. S14, S16, ESI†). The most stable conformer of PABAH+(H2O)6 has an N-protomeric core, in agreement with previous calculations.10 The bands at 1726 and 1748 cm−1 can be assigned to CO stretch modes of the most stable and less stable N-protomers of PABAH+(H2O)6 (Fig. 4a, b and Fig. S15, ESI†). The different frequencies of the two CO stretch modes arise from the presence and absence of H-bonding to a water molecule (see corresponding structures in Fig. 4b and Fig. S17, ESI†). It should be noted that the free CO stretching band (1748 cm−1) in the less stable conformer is slightly red-shifted from that of bare PABAH+ (1781 cm−1) probably due to the change of electron density upon hydration of the NH3+ group. We name herein the conformers with and without H-bonding between CO and water as bridged and unbridged conformers, respectively. Similar to n = 6, two CO stretch bands appear at n = 7, but their relative intensities are reversed, indicating that the preferred geometry for n = 7 is a bridged conformer (Fig. 4c, d and Fig. S18–S21, ESI†). Comparing the energies of the two types of structures for each hydrated cluster, the bridged structure is more stabilized in n = 7 than in n = 6 (by 12.8 vs. 7.2 kJ mol−1).
 | ||
| Fig. 4 IRPD spectrum PABAH+(H2O)n with (a) n = 6 and (c) n = 7 in comparison with (b and d) theoretical IR spectra of the most stable N- and O-protomers. Molecular structures are shown next to the computed IR spectra with their relative Gibbs free energies at 80 K in parentheses (in kJ mol−1). It should be noted that the detection sensitivity decreases in the lower frequency range because of the lower dissociation efficiency of H2-tagged molecules.45 The calculated intensity of the band at 1638 cm−1 of the O-protomer core is 686 km mol−1. | ||
When we now look at the single CO stretch band observed for n = 5, it can be assigned to an unbridged conformer by comparing its frequency to those for n = 6 and 7. However, this type of CO stretch is calculated for a metastable conformer, which is 3.4 kJ mol−1 less stable than the most stable N-protomer (Fig. 3 and Fig. S13, ESI†). A similar inconsistency is found for n = 6. The higher-frequency CO stretch band has to be assigned to the unbridged conformer which is more than 7 kJ mol−1 less stable than the most stable bridged one (Fig. S15, ESI†), although the band of the unbridged isomer is more intense than the one of the bridged isomer. The most probable scenario is that the reaction product, the N-protomer, is thermally not equilibrated at 80 K. The produced N-protomer is probably hotter than 80 K because of exothermic intracluster O → N proton transfer. Alternatively, hot O-protomers may transiently be generated by hydration of PABAH+ by converting hydration energy into internal energy. As a result, the hot O-protomer may overcome the reaction barrier for O → N proton transfer. The produced “hot” N-protomer may then be kinetically trapped in the cold reaction trap (80 K). This means that the kinetically trapped N-protomer reflects the structural information at higher temperature. Therefore, the energy gap between experiment and theory arises from a temperature effect. In fact, when we elevate the temperature from 80 to 298 K for the free energy calculations, unbridged N-protomers become more stable than bridged ones for n = 5 and 6 (Fig. S22, ESI†), qualitatively consistent with the experimental IRPD spectra. The higher stability of the unbridged N-protomers at higher temperature can then be ascribed to entropy.
Although the IRPD spectra shown in Fig. 3 and 4 clearly indicate the presence/absence of the N-protomer, they do not directly reveal the population ratio of O- and N-protomers. The population ratio may be derived by normalizing the integrated experimental band intensities using the computed IR oscillator strengths, which however can vary strongly among the various conformers. The exact conformer assignments are very difficult because there are too many possible conformers predicted in the low energy range (e.g., more than ten conformers are lower than 3 kJ mol−1 for the n = 6 clusters of the O-protomer core). This makes a reliable population analysis almost impossible. To avoid this problem, collision-stripping assisted IR (CAS-IR) spectroscopy has been developed and tested for a prototypical molecule, benzocaine H+, an analogue of PABAH+.27 This method measures the populations of O- and N-protomers after stripping all water molecules from the protonated solute molecule and thus the conformational distributions in the hydrated clusters must not necessary be determined. Significantly, the collisional stripping does not affect the protonation position.27 Here, we apply CAS-IR spectroscopy to PABAH+(H2O)n and experimentally determine the relative abundance of O- and N-protomers for each size of the hydrated clusters.
To this end, Fig. 5c shows CAS-IR spectra of PABAH+(H2O)n (n = 0–7). After stripping the water ligands, PABAH+ forms van der Waals complexes with H2, which is introduced into the second ion trap together with the He buffer gas. Then, the IR transitions of the PABAH+ monomer can be measured by loss of H2 (tagging method36). Thus, all bands can be assigned by vibrational transitions of the monomer isomers. The spectrum for n = 0 shows four bands in the 3400–3600 cm−1 range. These bands are in good agreement with the calculated spectrum of O-protonated PABAH+ tagged by four H2 molecules (Fig. 5 and Fig. S23, ESI†). The bands at 3435, 3496, 3535, and 3558 cm−1 are assigned to symmetric NH stretching, outward-facing OH stretching, antisymmetric NH stretching, and OH stretching toward the benzene ring, respectively. Only these bands are observed for mono- to tetrahydrated PABAH+ clusters after collisional stripping of the water ligands. Thus, PABAH+ has only the O-protonated form in these clusters with one to four water molecules.
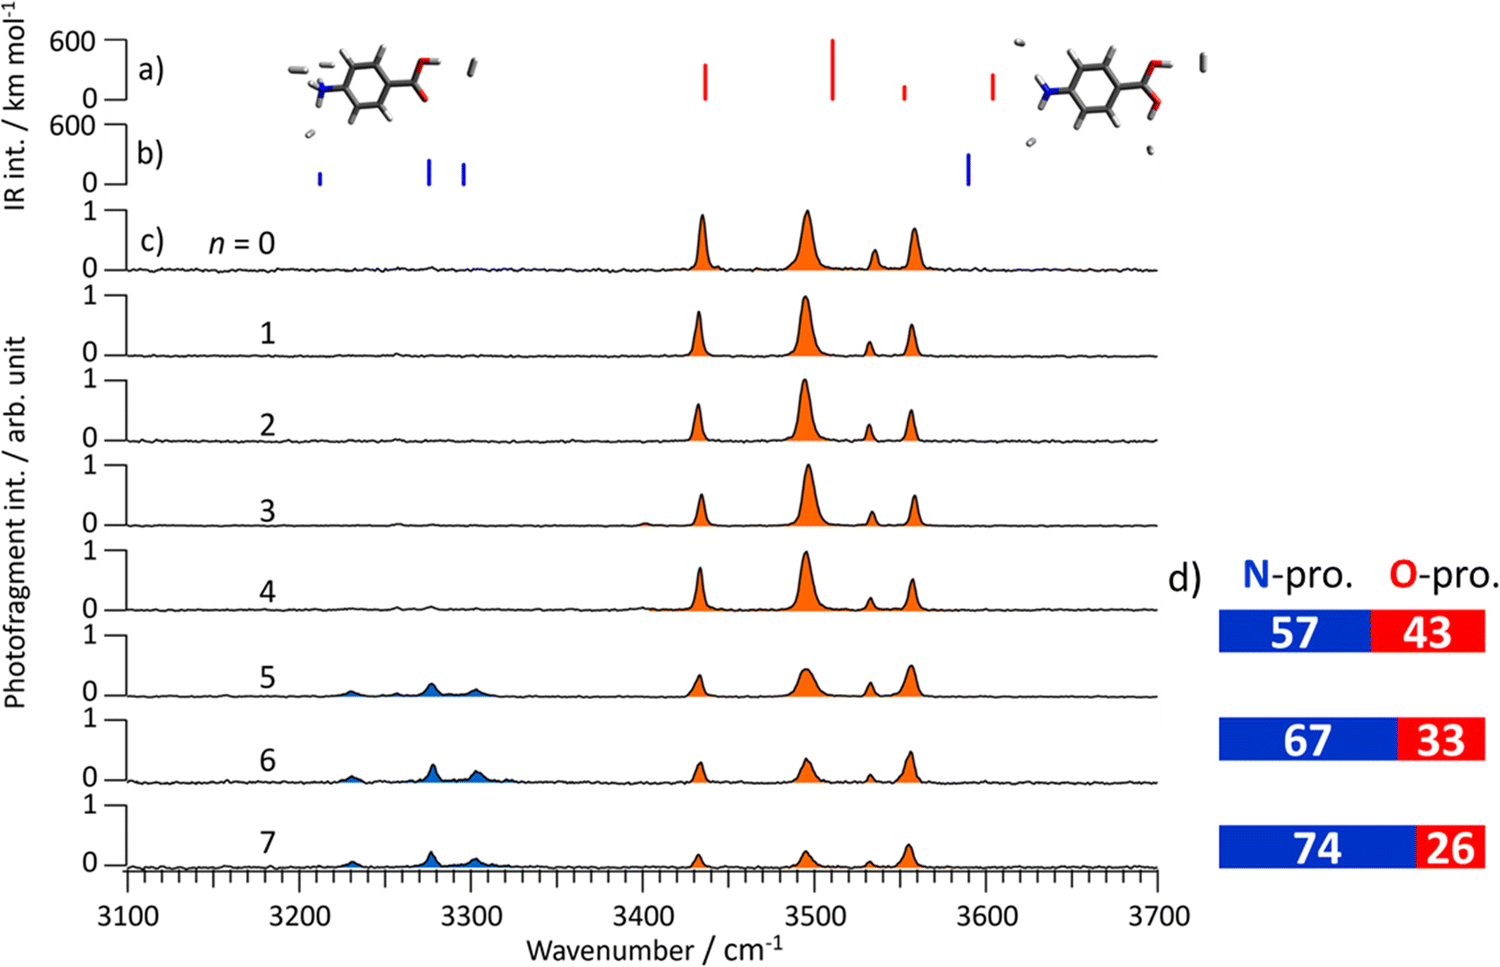 | ||
| Fig. 5 Calculated IR spectra of the (a) O- and (b) N-protomers of PABAH+(H2)4. (c) Observed CAS-IRPD spectra of PABAH+(H2O)n (n = 0–7) and (d) estimated population ratio for N- and O-protomers for n = 5–7. The calculated frequencies of the OH stretching modes are overestimated compared to the NH stretching modes. | ||
In the CAS-IR spectrum of n = 5, new bands appear in the range from 3200 to 3350 cm−1. From the comparison to the theoretical IR spectra shown in Fig. 5b, these bands at 3230, 3278, and 3303 cm−1 are assigned to symmetric and two antisymmetric stretching vibrations of the NH3 group in the N-protomer tagged with four H2 molecules. The theoretical spectra also predict the OH stretching vibration at 3580 cm−1. Probably this mode corresponds to the band at 3555 cm−1, which overlaps with the one of the OH stretching of the O-protomer, because this band appears more strongly than predicted for the O-protomer. Thus, the appearance of the bands between 3200 and 3350 cm−1 confirms the formation of the N-protomer in the pentahydrated PABAH+ cluster, as well as the interpretation of the IRPD spectra in the 6 μm range. Similarly, the coexistence of O- and N-protomers in the PABAH+(H2O)n with n = 6 and 7 is confirmed by the appearance of the bands in the 3200–3350 cm−1 range.
The population ratio of N- and O-protomers is quantitatively estimated by normalizing the CAS-IR band intensities using the calculated IR oscillator strength of PABAH+ (more exactly H2-tagged PABAH+). The CAS-IR intensities are obtained by fitting the CAS-IR spectra with Lorentzian profiles (details are shown in Fig. S24, ESI†). Finally, we obtain the N![[thin space (1/6-em)]](https://www.rsc.org/images/entities/char_2009.gif) :O ratio of 6:4 for n = 5, 2:1 for n = 6, and 3:1 for n = 7, indicating that this ratio increases with the number of water molecules (Fig. 5d). It should be noted that the N-protomer is likely to be kinetically trapped and the N ↔ O interconversion is not thermally equilibrated. Therefore, the obtained population ratio does not reflect the thermodynamic stability but the extent of the O → N proton transfer reaction. The O → N intracluster proton transfer is more pronounced as the number of attached water ligands is increased in the cluster. This observation suggests that the reaction barrier for the proton transfer is lowered by sequential addition of water molecules.
:O ratio of 6:4 for n = 5, 2:1 for n = 6, and 3:1 for n = 7, indicating that this ratio increases with the number of water molecules (Fig. 5d). It should be noted that the N-protomer is likely to be kinetically trapped and the N ↔ O interconversion is not thermally equilibrated. Therefore, the obtained population ratio does not reflect the thermodynamic stability but the extent of the O → N proton transfer reaction. The O → N intracluster proton transfer is more pronounced as the number of attached water ligands is increased in the cluster. This observation suggests that the reaction barrier for the proton transfer is lowered by sequential addition of water molecules.
4. Summary
We have applied double ion trap IRPD and CAS-IR spectroscopy to hydrated clusters of PABAH+. By selective formation of the O-protomer in the electrospray source and the sequential cluster formation with water molecules in the reaction trap combined with mid-IR spectroscopy in the CO stretch range, we have determined the threshold size for hydration-induced N-protomer formation as five water molecules, without ambiguity caused by kinetic trapping in the electrospray source. This threshold size of n = 5 is smaller than n = 6 reported by previous studies. Hebert and Russel proposed the Grotthuss mechanism for the intracluster proton transfer in the hydrated clusters of PABAH+ because of the bridged structure of the hydrated N-protomer (n = 6) in which the NH3+ and COOH groups are connected by a H-bonded water chain.30 However, the bridged conformer appears minor in the current IRPD spectrum for n = 6 and the pentahydrated N-protomer of PABAH+ does not have such a bridged structure. Thus, we should consider a non-Grotthuss mechanism for the proton transfer, such as the vehicle mechanism, in this size regime.19,41,42 On the other hand, the bridged structure becomes most abundant in higher hydrated clusters (n = 7). This suggests that the Grotthuss mechanism13,26,43,44 may also be involved in the proton transfer, especially in larger hydrated clusters. However, a clear conclusion that can be drawn here for the smaller clusters (n ≤ 6) is that if the Grotthuss mechanism plays a role in the proton transfer, it would first require the formation of energetically highly unfavourable structures. The proton transfer mechanism can be further examined in the future by hydration with heavy water (D2O). Concerning the N/O protomer population, our measurements are currently limited up to the hydration with seven water molecules. It may be interesting to explore how many water molecules are required to reach a 100% population of the N-protomer as observed in solution. Another interesting aspect is the acceleration of the proton transfer reaction by raising the temperature of the reaction trap. These future plans, as well as the application of double ion trap spectroscopy31,32 to other molecules that contain two or more protonation sites, will allow us to explore the mechanism of intracluster proton transfer in hydrated clusters and aqueous solution at the molecular level.
Conflicts of interest
There are no conflicts to declare.Acknowledgements
This work was supported in part by KAKENHI (JP19K23624, JP20K20446, JP20H00372, JP21H04674, and JP21K14585), the Core-to-Core program (JPJSCCA20210004) from Japan Society for the Promotion of Science, research grant from World Research Hub Initiative (WRHI) of Tokyo Institute of Technology, the Cooperative Research Program of the “Network Joint Research Center for Materials and Devices” from the Ministry of Education, Culture, Sports, Science and Technology (MEXT), Japan. The computations were performed at the Research Centre for Computational Science, Okazaki, Japan. M. F. is grateful for support from the Alexander von Humboldt foundation. O. D. acknowledges support from Deutsche Forschungsgemeinschaft (DFG, DO 729/10) and the World Research Hub Initiative (WRHI) of Tokyo Institute of Technology.References
- N. Gupta and H. Linschitz, J. Am. Chem. Soc., 1997, 119, 6384–6391 CrossRef CAS.
- M. K. Nazeeruddin, S. M. Zakeeruddin, R. Humphry-Baker, M. Jirousek, P. Liska, N. Vlachopoulos, V. Shklover, C.-H. Fischer and M. Grätzel, Inorg. Chem., 1999, 38, 6298–6305 CrossRef CAS PubMed.
- C. H. Cheon and H. Yamamoto, J. Am. Chem. Soc., 2008, 130, 9246–9247 CrossRef CAS PubMed.
- J. T. Mohr, A. Y. Hong and B. M. Stoltz, Nat. Chem., 2009, 1, 359–369 CrossRef CAS PubMed.
- D. H. Aue, H. M. Webb and M. T. Bowers, J. Am. Chem. Soc., 1976, 98, 311–317 CrossRef CAS.
- N. Solcà and O. Dopfer, Angew. Chem., Int. Ed., 2003, 42, 1537–1540 CrossRef PubMed.
- N. Solcà and O. Dopfer, J. Am. Chem. Soc., 2004, 126, 1716–1725 CrossRef PubMed.
- Z. Tian and S. R. Kass, Angew. Chem., Int. Ed., 2009, 48, 1321–1323 CrossRef CAS PubMed.
- J. Schmidt, M. M. Meyer, I. Spector and S. R. Kass, J. Phys. Chem. A, 2011, 115, 7625–7632 CrossRef CAS PubMed.
- T. M. Chang, J. S. Prell, E. R. Warrick and E. R. Williams, J. Am. Chem. Soc., 2012, 134, 15805–15813 CrossRef CAS PubMed.
- J. L. Campbell, J. C. Y. Le Blanc and B. B. Schneider, Anal. Chem., 2012, 84, 7857–7864 CrossRef CAS PubMed.
- S. Warnke, J. Seo, J. Boschmans, F. Sobott, J. H. Scrivens, C. Bleiholder, M. T. Bowers, S. Gewinner, W. Schöllkopf and K. Pagel, et al. , J. Am. Chem. Soc., 2015, 137, 4236–4242 CrossRef CAS PubMed.
- J. L. Campbell, A. M.-C. Yang, L. R. Melo and W. S. Hopkins, J. Am. Soc. Mass Spectrom., 2016, 27, 1277–1284 CrossRef CAS PubMed.
- J. Seo, S. Warnke, S. Gewinner, W. Schöllkopf, M. T. Bowers, K. Pagel and G. von Helden, Phys. Chem. Chem. Phys., 2016, 18, 25474–25482 RSC.
- A. L. Patrick, A. P. Cismesia, L. F. Tesler and N. C. Polfer, Int. J. Mass Spectrom., 2017, 418, 148–155 CrossRef CAS.
- E. Matthews and C. E. H. Dessent, Phys. Chem. Chem. Phys., 2017, 19, 17434–17440 RSC.
- H. Xia and A. B. Attygalle, J. Mass Spectrom., 2018, 53, 353–360 CrossRef CAS PubMed.
- R. Kumar and H. I. Kenttämaa, J. Am. Soc. Mass Spectrom., 2020, 31, 2210–2217 CrossRef CAS PubMed.
- K. Ohshimo, S. Miyazaki, K. Hattori and F. Misaizu, Phys. Chem. Chem. Phys., 2020, 22, 8164–8170 RSC.
- T. Khuu, N. Yang and M. A. Johnson, Int. J. Mass Spectrom., 2020, 457, 116427 CrossRef CAS PubMed.
- P. R. Batista, T. C. Penna, L. C. Ducati and T. C. Correra, Phys. Chem. Chem. Phys., 2021, 23, 19659–19672 RSC.
- M. Demireva and P. B. Armentrout, J. Phys. Chem. A, 2021, 125, 2849–2865 CrossRef CAS.
- M. McCullagh, S. Goscinny, M. Palmer and J. Ujma, Talanta, 2021, 234, 122604 CrossRef CAS PubMed.
- T. Uhlemann, G. Berden and J. Oomens, Eur. Phys. J. D, 2021, 75, 23 CrossRef CAS.
- N. Takeda, K. Hirata, K. Tsuruta, G. D. Santis, S. S. Xantheas, S. Ishiuchi and M. Fujii, Phys. Chem. Chem. Phys., 2022, 24, 5786–5793 RSC.
- B. Ucur, A. T. Maccarone, S. R. Ellis, S. J. Blanksby and A. J. Trevitt, J. Am. Soc. Mass Spectrom., 2022, 33, 347–354 CrossRef CAS PubMed.
- K. Hirata, F. Haddad, O. Dopfer, S. Ishiuchi and M. Fujii, Phys. Chem. Chem. Phys., 2022, 24, 5774–5779 RSC.
- G. D. Santis, N. Takeda, K. Hirata, K. Tsuruta, S. Ishiuchi, S. S. Xantheas and M. Fujii, J. Am. Chem. Soc., 2022, 144, 16698–16702 CrossRef CAS PubMed.
- T. Khuu, S. J. Stropoli, K. Greis, N. Yang and M. A. Johnson, J. Chem. Phys., 2022, 157, 131102 CrossRef CAS PubMed.
- M. J. Hebert and D. H. Russell, J. Phys. Chem. B, 2020, 124, 2081–2087 CrossRef CAS.
- B. M. Marsh, J. M. Voss and E. Garand, J. Chem. Phys., 2015, 143, 204201 CrossRef PubMed.
- E. Sato, K. Hirata, J. M. Lisy, S. Ishiuchi and M. Fujii, J. Phys. Chem. Lett., 2021, 12, 1754–1758 CrossRef CAS PubMed.
- J. A. Stearns, S. Mercier, C. Seaiby, M. Guidi, O. V. Boyarkin and T. R. Rizzo, J. Am. Chem. Soc., 2007, 129, 11814–11820 CrossRef CAS.
- E. Garand, M. Z. Kamrath, P. A. Jordan, A. B. Wolk, C. M. Leavitt, A. B. McCoy, S. J. Miller and M. A. Johnson, Science, 2012, 335, 694–698 CrossRef CAS.
- J. G. Redwine, Z. A. Davis, N. L. Burke, R. A. Oglesbee, S. A. McLuckey and T. S. Zwier, Int. J. Mass Spectrom., 2013, 348, 9–14 CrossRef CAS.
- M. Z. Kamrath, E. Garand, P. A. Jordan, C. M. Leavitt, A. B. Wolk, M. J. Van Stipdonk, S. J. Miller and M. A. Johnson, J. Am. Chem. Soc., 2011, 133, 6440–6448 CrossRef CAS PubMed.
- S. Ishiuchi, H. Wako, D. Kato and M. Fujii, J. Mol. Spectrosc., 2017, 332, 45–51 CrossRef CAS.
- W. L. Jorgensen and J. Tirado-Rives, J. Am. Chem. Soc., 1988, 110, 1657–1666 CrossRef CAS PubMed.
- F. Mohamadi, N. G. J. Richards, W. C. Guida, R. Liskamp, M. Lipton, C. Caufield, G. Chang, T. Hendrickson and W. C. Still, J. Comput. Chem., 1990, 11, 440–467 CrossRef CAS.
- M. Frisch, G. Trucks, H. Schlegel, G. Scuseria, M. Robb, J. Cheeseman, G. Scalmani, V. Barone, G. Petersson and H. Nakatsuji, et al., Gaussian 16, Gaussian, Inc., Wallingford, CT, 2016 Search PubMed.
- K.-D. Kreuer, A. Rabenau and W. Weppner, Angew. Chem., Int. Ed. Engl., 1982, 21, 208–209 CrossRef.
- Y. Matsuda, A. Yamada, K. Hanaue, N. Mikami and A. Fujii, Angew. Chem., Int. Ed., 2010, 49, 4898–4901 CrossRef CAS PubMed.
- N. Agmon, Chem. Phys. Lett., 1995, 244, 456–462 CrossRef CAS.
- M.-P. Gaigeot, A. Cimas, M. Seydou, J.-Y. Kim, S. Lee and J.-P. Schermann, J. Am. Chem. Soc., 2010, 132, 18067–18077 CrossRef CAS PubMed.
- R. Otsuka, K. Hirata, Y. Sasaki, J. M. Lisy, S. Ishiuchi and M. Fujii, ChemPhysChem, 2020, 21, 712–724 CrossRef CAS PubMed.
Footnote |
| † Electronic supplementary information (ESI) available. See DOI: https://doi.org/10.1039/d2cp04497h |
| This journal is © the Owner Societies 2023 |