 Open Access Article
Theoretical investigation of selective CO2 capture and desorption controlled by an electric field†
Koki
Saegusa
a,
Kenshin
Chishima
a,
Hiroshi
Sampei
 a,
Kazuharu
Ito
a,
Kota
Murakami
a,
Jeong Gil
Seo
a,
Kazuharu
Ito
a,
Kota
Murakami
a,
Jeong Gil
Seo
 b and
Yasushi
Sekine
 *a
*a
aApplied Chemistry, Waseda University, 3-4-1, Okubo, Shinjuku, Tokyo, 169-8555, Japan. E-mail: ysekine@waseda.jp
bDepartment of Chemical Engineering, Hanyang University, Wangsimniro-222, Seongdong-gu, Seoul, 04768, Republic of Korea
First published on 26th October 2022
Abstract
Low-cost carbon dioxide (CO2) capture technologies have been studied widely. Among such technologies, the control of CO2 adsorption by the application of an electric field to solid materials has been shown to be a promising technology that can combine high CO2 adsorption with low energy consumption. Suitable materials must be found for electric field-assisted CO2 adsorption. For this study, the CO2 adsorption energies of CeO2 partially substituted with hetero-cations were investigated using theoretical calculations. The differences in adsorption performance attributable to the application of an electric field were clarified for different doped cations. The results show that the amount of change in the CO2 adsorption energy by the application of an electric field depended on the different doped cations. Furthermore, it is found that this difference in cations is related to the electronegativity of the doped cations. These results suggest a tuning strategy for the material properties necessary for CO2 capture and separation using an electric field.
1. Introduction
Intensive and extensive consumption of fossil fuels has increased the atmospheric concentrations of carbon dioxide (CO2), thereby causing global warming and climate change.1 Suitable technologies must be found to reduce CO2 emissions while maintaining the industry and providing power generation: CO2 capture and separation is one promising technology to reduce CO2 emissions to a net-zero amount.2,3Various materials have been developed for CO2 capture, including liquid absorbents4,5 and solid adsorbents.6,7 Among them, amine-based absorbents are widely used in the industry, but they have shortcomings such as high energy consumption during regeneration and poor handling because of toxicity.8,9 Pressurised conditions are beneficial, to a certain degree, for physical absorption into Selexol and other materials. For these reasons, solid adsorbents are attracting attention because they are expected to consume less energy during regeneration. Solid adsorbents including carbon-based materials,10 metal–organic frameworks,11 and metal oxides12,13 have been examined widely. Although many studies have been undertaken to improve their selective CO2 adsorption capacity, these improvements simultaneously entail difficulties in regeneration. A trade-off exists between high CO2 separation capacity and low energy consumption in the control of adsorption and desorption by temperature and pressure swings.
Here, CO2 capture controlled by an electric field has been proposed as a process that combines high CO2 selectivity with low energy consumption. This electric-field-assisted CO2 capture has been investigated in supercapacitive swing adsorption using liquid electrolytes14,15 and electric field-assisted adsorption using solid 2D materials.16,17 Sun et al.18 reported, using density functional theory (DFT) calculations, that applying an external electric field to a boron nitride sheet can create a charge distribution in the sheet and can promote electron transfer selectively to the adsorbed CO2. This facilitation stabilises CO2 adsorption. Switching the electric field can weaken CO2 adsorption without significant barriers. Therefore, applying an external electric field to the supports of CO2-activation catalysts, containing inorganic solid materials, is expected to be able to control the CO2 adsorption selectively with low consumption energy and successive conversion of CO2 into a useful product. However, the design strategy for materials of CO2 capture controlled by a DC electric field remains unclear.
In this study, we focus on CO2 adsorption with an electric field over cerium oxide (CeO2). Although MgO has been reported to exhibit high performance in previous CO2 adsorption studies without an electric field,19 it is difficult to control the nature by a DC electric field because of its dielectric nature, and also it is difficult to tune the structure by hetero-cation doping. On the other hand, CeO2 has f electrons and is known as a semi-conductor, so CeO2 adsorption can be greatly controlled by applying an electric field, and its performance can be easily tuned by hetero-cation doping; since the valence of Ce can be changed, there is a high level of structural freedom through doping with cations of different valence states. Therefore, DFT calculations were performed using CeO2 doped with various hetero-cations,20 which have been studied as CO2 adsorbents21,22 and as supports for CO2-activation catalysts.23,24 Then, differences between the doped cations were investigated with regard to the changes in the CO2 adsorption performance by application of the electric field. This study identified the material properties required for CCS with an electric field.
2. Computational method
2.1. Computational details
All DFT calculations for this work were conducted using the Vienna Ab initio Simulation Package (VASP) 5.4.4.25,26 Core–valence interactions were represented using a projector augmented wave (PAW) method.27,28 The generalized gradient approximation (GGA) of Perdew–Burke–Ernzerhof (PBE) was applied to describe the exchange correlation.29 The plane-wave cutoff was 400 eV. We used the DFT-D3 method proposed by Grimme to assess van der Waals interactions between the surface and adsorbates.30 The DFT+U method31,32 was used to introduce an on-site correction for the localised electrons. The value of U was set to 5.0 eV for the Ce 4f orbital.33–37 Optimisation of bulk and slab models was carried out respectively with a Γ-centred k-point grid of (5 × 5 × 5) and that of (1 × 1 × 1) using Gaussian smearing. Furthermore, the electric field direction was vertical to the CeO2 surface. Applied electric field amounts of −0.50, −0.10, 0.10, and 0.50 eV Å−1 along the z-direction were considered. In addition, the Bader charge analysis was performed to evaluate the electron transfer from the surface to adsorbates.38–41The CO2 adsorption energy when applied to an electric field of x eV Å−1 (which is represented as Ead(x)) was calculated using the following equation:
Ead(x) = Esurface![[thin space (1/6-em)]](https://www.rsc.org/images/entities/char_2009.gif) adsorbed adsorbed![[thin space (1/6-em)]](https://www.rsc.org/images/entities/char_2009.gif) CO2(x) − (Esurface(x) + ECO2(x)) CO2(x) − (Esurface(x) + ECO2(x)) | (1) |
![[thin space (1/6-em)]](https://www.rsc.org/images/entities/char_2009.gif) adsorbed
adsorbed![[thin space (1/6-em)]](https://www.rsc.org/images/entities/char_2009.gif) CO2(x) and Esurface(x) respectively denote the total energy of the surface model with adsorbed CO2 and without adsorbed CO2. Also, ECO2(x) denotes the total energy of a CO2 molecule, as obtained by the calculation of an isolated CO2 molecule in a 10 × 10 × 10 Å vacuum cubic box.
CO2(x) and Esurface(x) respectively denote the total energy of the surface model with adsorbed CO2 and without adsorbed CO2. Also, ECO2(x) denotes the total energy of a CO2 molecule, as obtained by the calculation of an isolated CO2 molecule in a 10 × 10 × 10 Å vacuum cubic box.
2.2. Calculation models
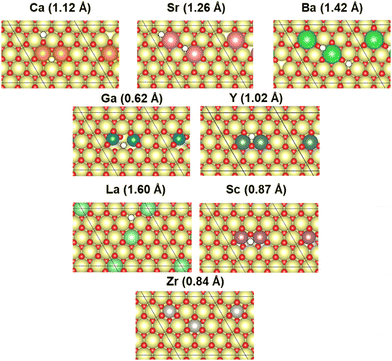
In this study, CeO2 has been selected as a material for investigation. Herein, we investigated a (4 × 4) expansion of the CeO2(111) surface with three O–Ce–O tri-layers, which is the most stable surface on CeO2.42 In this slab model, the bottom tri-layer was fixed during geometry optimisation. The vacuum layer was set to 20 Å along the z direction (shown in Fig. 1(a) and (b)). The optimised lattice parameter of CeO2 bulk was 5.43 Å, which shows good agreement with the results reported from an earlier investigation (5.47 Å)43 and an experimentally obtained result (5.41 Å).44 The doped models were prepared by replacing two Ce atoms at the uppermost surface of the CeO2 slab model with various cations: Ba, Ca, Ga, La, Sc, Sr, Y, and Zr. Additionally, doping hetero-cations with different valences (divalent or trivalent) to the valence of the Ce atom (tetravalent) is known to require charge compensation by creating oxygen vacancies. Therefore, we prepared models with oxygen vacancies as presented in Fig. 2 and investigated the CO2 adsorption behaviour when applying an electric field using these models with oxygen vacancies. Regarding the arrangements of the doped cations and the positions of oxygen vacancies, the most stable arrangements and positions were found from an earlier study.45 Moreover, the drawing of all calculation models was performed using Visualization for Electronic and STructural Analysis (VESTA).46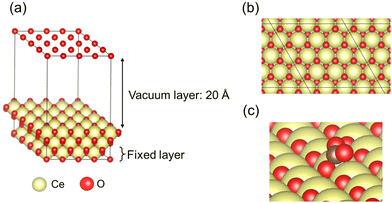 | ||
| Fig. 1 Calculation models of pure CeO2: (a) perspective view, (b) top view, and (c) CO2 adsorption form on a pure CeO2(111) surface: yellow, Ce; red, O. | ||
3. Results and discussion
3.1. Optimisation of the CO2 adsorption model on non-doped CeO2
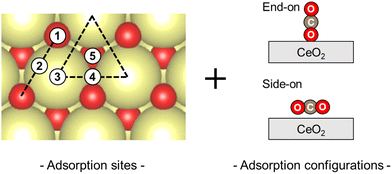
First, the CO2 adsorption models were investigated along with their various adsorption sites and various configurations over non-doped CeO2. The adsorption models and the relevant results are presented in Fig. 3 and Table 1. The CO2 adsorption model with a side-on arrangement on the surface oxygen (Olat) was found to be the most stable adsorption arrangement. Geometry optimisation of this adsorption model led to an adsorption energy of −0.46 eV, a C–Olat bond length of 1.38 Å, and an O–C–O angle of 129.5°. These results are consistent with those of earlier theoretical studies: 1.38 Å and 129.7°, respectively.36 This optimised model includes interactions between the carbon molecule of CO2 and the surface oxygen, and between the oxygen of CO2 and the surface cerium. Among the various adsorption sites and configurations, these interactions involve the smallest adsorption energy. However, all other models show weak interaction or no interaction, causing the adsorption to be unstable at less than −0.10 eV. Therefore, the model presented in Fig. 1(c) was regarded as a suitable computational model to study the adsorption of CO2 on each surface oxygen of the CeO2 surface.| No. | Adsorption site | End-on/eV | Side-on/eV | ||
|---|---|---|---|---|---|
| Without EF | With EF (0.50 eV Å−1) | Without EF | With EF (0.50 eV Å−1) | ||
| 1 | Olat atom (on top) | −0.04 | −0.04 | −0.46 | −0.69 |
| 2 | Olat atom (bridge) | −0.09 | −0.07 | −0.06 | −0.04 |
| 3 | Ce atom (on top) | −0.08 | −0.06 | −0.07 | −0.05 |
| 4 | Ce atom (bridge) | −0.05 | −0.05 | −0.06 | −0.06 |
| 5 | Ce atom (hollow) | −0.04 | −0.04 | −0.06 | −0.05 |
3.2. Influence of doping hetero-cation on CO2 adsorption without an electric field
The DFT calculations were then performed to assess the behaviour of CO2 adsorption without an electric field on CeO2 with various dopants after optimising the structure of the doped-oxide. Fig. 4(a) shows the relationship between the ionic radius of the dopants and the adsorption energies, as classified by the average adsorption energy of the surface oxygens next to the dopant and that of the surface oxygen next to the cerium atom. The results show that, as the ionic radius of the dopant decreases, CO2 adsorption stabilises irrespective of the adsorption site. Among them, the adsorption sites adjacent to the dopant were found to bring about this tendency to a greater degree than the adsorption sites adjacent to the cerium atom. The results show that CO2 adsorption on the doped CeO2 surface is influenced strongly by the ionic radius of the dopant. The influence of a dopant on adsorption over the doped CeO2 surface was also examined in an earlier study,20 which showed the same trend for the adsorption of hydrogen atoms. This report revealed that the difference in the ionic radius from the Ce atom has a greater effect on the adsorption energy than the electron transfer from the dopant to the lattice oxygen. A smaller ionic radius of the dopant can reflect a more stable adsorption structure because the surface around the smaller dopant has more spatial freedom and room for lattice distortion during adsorption. This trend is more pronounced for CO2 adsorption in the vicinity of the dopant, indicating that structural factors such as the ionic radius are the main factors controlling CO2 adsorption.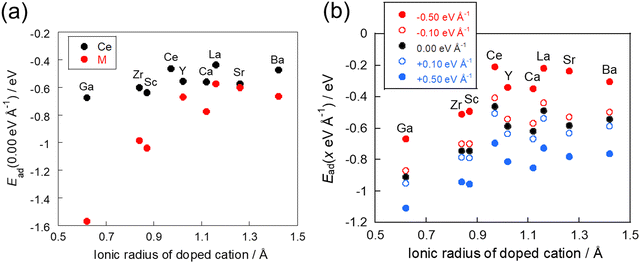 | ||
| Fig. 4 Relationship between the ionic radius and the adsorption energy: (a) without application of an electric field and (b) with application of an electric field. | ||
3.3. CO2 adsorption with an electric field
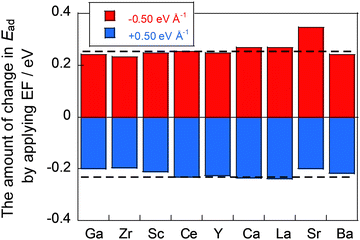
Next, we investigated CO2 adsorption when electric fields of −0.50, −0.10, 0.10, and 0.50 eV Å−1 were applied to CeO2 with various dopants. Fig. 4(b) depicts the relationship between the ionic radius of the dopant and the CO2 adsorption energies when the electric fields were applied. The results show that the doped CeO2 surface is positively charged when negative electric fields of −0.50 and −0.10 eV Å−1 are applied. The adsorption becomes unstable. However, application of positive electric fields of 0.50 eV Å−1 and 0.10 eV Å−1 caused the doped CeO2 surface to become negatively charged and adsorption-stabilised. Therefore, the results confirmed that the adsorption and desorption of CO2 can be controlled by switching the direction of application of the electric field, as reported in earlier studies.17,47 Furthermore, the amounts of change in the adsorption energies have been found to be strongly related to the amount of CO2 adsorption that can be controlled. Therefore, the amount of change in adsorption energy has been calculated for application of electric fields of −0.50 and 0.50 eV Å−1. The results are shown in Fig. 5. In this figure, a greater change in adsorption energy means that a greater amount of CO2 adsorption can be controlled. This figure clarifies that the amount of change in the adsorption energy by application of an electric field differs among dopants, even if the same amount of electric field is applied. In particular, gallium (Ga) and zirconium (Zr) doping have a smaller change in adsorption energy than that of undoped CeO2, whereas lanthanum (La) doping has a greater change in adsorption energy than undoped CeO2.3.4. Analytical method for dominant factors on CO2 adsorption with an electric field
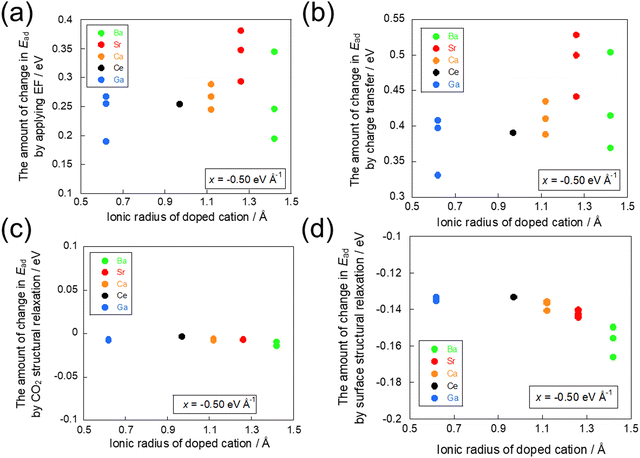
To clarify the material properties necessary to control CO2 adsorption and desorption by the application of an electric field, the change in adsorption energy was analysed: it occurs because of the application of the varied electric field on dopants. Three factors influence the amount of change in adsorption: charge transfer factor, CO2 molecular structural relaxation factor, and surface structural relaxation factor. The charge transfer factor represents the electron transfer effects between the doped CeO2 surface and the CO2 molecules because of the application of the electric field on the adsorption energy. The CO2 molecular structural relaxation factor indicates the effect of changes in the C–Olat length and O–C–O angle because of the application of the electric field to the adsorption energy. Indeed, it has been observed that the bond length between the CO2 molecule and the surface oxygen changes with the application of the electric field, as Table 2 shows. Finally, the surface structural relaxation factor reflects the effects of changes in the surface structure because of the application of the electric field on the adsorption energy. The results of the present study demonstrated that the surface structure relaxation during adsorption dominates the adsorption behaviour in the adsorption without applying an electric field of CO2 molecules as well as a recent study about H atom adsorption.20 This finding suggests that the relaxation of the surface structure also affects the adsorption energy. Based on the points above, three factors are inferred as involved in the change in adsorption energy. Partial optimisation of the adsorption model is used to separate and study the effects of these factors and to elucidate the controlling factors.| The amount of EF [eV Å−1] | E ad [eV] | d O–Ce [Å] | d C–Olat [Å] | d C–O [Å] | a OCO [deg] | Charge/e |
|---|---|---|---|---|---|---|
| −0.50 | −0.21 | 2.464 | 1.382 | 1.266 | 129.7 | 0.18 |
| 0.00 | −0.46 | 2.511 | 1.379 | 1.269 | 129.5 | 0.22 |
| +0.50 | −0.69 | 2.566 | 1.375 | 1.270 | 129.2 | 0.28 |
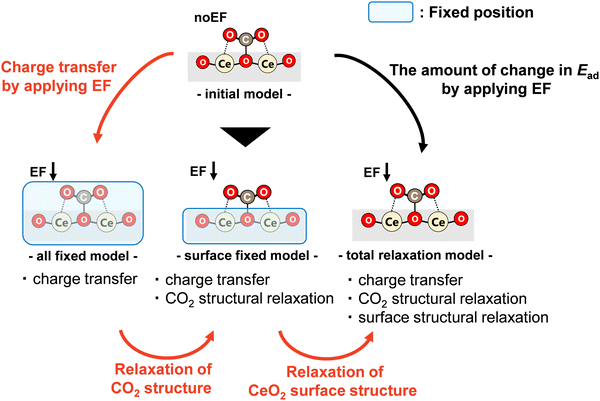
A schematic diagram showing the prepared adsorption models of four types used to separate these three factors is presented in Fig. 6. First, the adsorption model optimised without an electric field is called the ‘initial model’, which is the same as the model calculated as described in Section 3.2. Next, a model in which the electric field is applied to this ‘initial model’ and in which the positions of all atoms are fixed is called the ‘all-fixed model’. In this ‘all-fixed model’, only electron transfer attributable to the application of the electric field occurs from the ‘initial model’. Therefore, only the effect of the charge transfer factor is included. Furthermore, a model in which the atomic positions on the doped CeO2 surface are fixed and only the atomic positions of the CO2 molecule are optimised for the ‘initial model’ is called the ‘surface-fixed model’. This model includes the effects of the charge transfer factor and the CO2 molecular structural relaxation factor as the application of an electric field causes the electron transfer and structural relaxation of the CO2 molecule. Finally, a model in which an electric field is applied to the ‘initial model’ and the atomic positions of the CO2 molecule and the surface atoms of the doped CeO2 are optimised is called the ‘total relaxation model’, which is the same as the model investigated in Section 3.3. In this model, the electron transfer, the structural relaxation of the CO2 molecule, and the structural relaxation of the doped CeO2 surface created by the application of the electric field occur. This model includes all three factors.
Therefore, the influence of charge transfer factors, CO2 molecular structural relaxation factors, and surface structural relaxation factors can be considered respectively from a comparison between the ‘initial model’ and the ‘all-fixed model’, between the ‘all-fixed model’ and the ‘surface-fixed model’, and between the ‘surface-fixed model’ and the ‘total relaxation model’. Here, a comparison between the ‘initial model’ and the ‘total relaxation model’ can elucidate the amount of change in adsorption energy attributable to the application of the electric field, as obtained in Fig. 5. Herein, dopants are classified into the following three types from Fig. 5: dopants (Ga, Zr, Sc, Y, and Ba) with small changes by applying the electric field, dopants (Ca and La) with large changes, and dopants (Sr) with different changes in the direction of the electric field, compared to undoped CeO2. Therefore, in this investigation of the dominant factor, we focused on Ba, Ga, Ca, and Sr doping in consideration of the difference in the valence states. For each dopant, only three adsorption sites were selected for the study. The maximum, minimum, and average changes in the adsorption energy by the application of the electric field were observed. The calculated models are shown in Fig. S1 (ESI†).
3.5. Influence of doping hetero-cations on CO2 adsorption with an electric field
The effects of each factor were assessed by calculating the difference in adsorption energies between the models prepared in the preceding section. The effects of all factors on the adsorption energy are depicted in Fig. 7(a), whereas the effects on adsorption energy of the charge transfer factor, CO2 molecular structural relaxation factor, and surface structural relaxation factor are presented respectively in Fig. 7(b), (c) and (d). Here, it was observed that the inhibition of adsorption because of the electron transfer from the CO2 molecule was greater than the promotion of adsorption because of the electron transfer to the CO2 molecule in light of the change in adsorption energy because some electrons had already transferred to the CO2 molecule during the adsorption. Therefore, some attention was devoted to the relationship between the ionic radius of the dopant and the amount of change in adsorption energy because of the influences of the respective factors by application of a −0.50 eV Å−1 electric field, which suppresses CO2 molecule adsorption.By comparison of Fig. 7(a) and (b), we investigated the influence of the charge transfer factor. The results show that the same trend was obtained among all factors and the charge transfer factor with regard to the ionic radius of the dopant. A comparison between the effects on the energy of all factors and the effects on the energy of the charge transfer factor confirmed a strong correlation, as shown in Fig. S2 (ESI†). Next, similar to the investigation of the effect of the charge transfer factor, a comparison was conducted between Fig. 7(a) and (c) and between Fig. 7(a) and (d). As a result, the effects of the CO2 molecular structural relaxation factor and the surface structural relaxation factor showed different trends from the effects of all factors. These results indicate that the dominant factor influencing the amount of change in adsorption energy because of the application of the electric field is the charge transfer factor.
To confirm the electron transfer further, the amounts of charge transfer to CO2 molecules and to the adsorption site when the electric field is applied were calculated using the Bader charge analysis. The relationship between the amount of charge transfer obtained from the Bader charge analysis and the amount of change in adsorption energy by the application of the electric field is presented in Fig. 8. This diagram shows that electron donation to the CO2 molecule decreases and the CO2 adsorption becomes more unstable as the amount of charge held at the adsorption site increases. These results are also confirmed by the amount of charge transfer on the CO2 molecule itself, which indicates that a lower amount of charge transfer to the CO2 molecule leads to greater instability of adsorption. The relationship between the amount of charge transfer and the change in adsorption energy is not very linear: interaction exists not only with the surface oxygen, which is the adsorption site, but also simultaneously with the cation. This interaction between the CO2 molecule and the cation engenders the opposite direction of charge transfer to that of the interaction between the CO2 molecule and the surface oxygen because the cation acts as a Lewis acid for CO2 adsorption. Therefore, the presence of interaction with the cation shows an almost linear relationship.
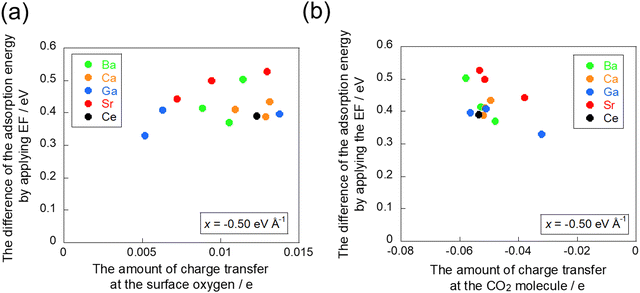 | ||
| Fig. 8 Relationship between the difference of adsorption energy and the amount of charge transfer: (a) at the surface oxygen and (b) at the CO2 molecule in −0.50 eV Å−1. | ||
The results of the Bader charge analysis confirm that the charge transfer from the adsorption site to the CO2 molecule is dominant in the amount of change in the CO2 adsorption energy because of the application of the electric field. This study was also conducted with an electric field of 0.50 eV Å−1. The results revealed a similar trend to that found in the previous section as shown in Fig. S3 (ESI†).
3.6. Correlation between dopants and the CO2 adsorption behaviour with an electric field
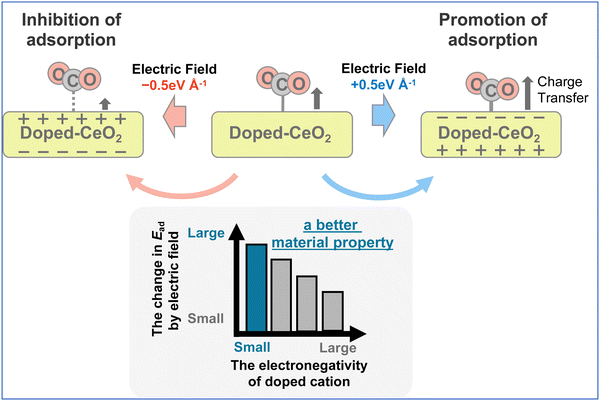
The results obtained from the studies described above indicate that the charge transfer factor has important effects on the amount of change in adsorption energy by applying the electric field. Nevertheless, the relationship between the doped cation species and the charge transfer factor remains unclear. Therefore, the relationship between the CO2 adsorption–desorption behaviour and the doped species by the application of the electric field was clarified. Because the charge transfer from the adsorption site to the CO2 molecule is a key factor for CO2 adsorption behaviour with the electric field, the Lewis basicity of the surface oxygen on the metal oxide was found to be important. In other words, the Lewis basicity of the surface oxygen that can be changed more easily by application of an electric field is associated with more controllable adsorption and desorption of CO2 molecules. Here, the charge on the oxygen atoms of metal oxides is known to be more negative and more Lewis basic for a lower electronegativity of the cation.48,49The correlation between the amount of change in adsorption energy attributable to the application of the electric field and the dopant electronegativity is presented in Fig. 9. In these figures, the numbers in brackets below the horizontal axis represent the electronegativity of each dopant. Variation of these data is influenced by the position of the doped cation species, with a symmetrical arrangement leading to a smaller variation. The results show that the amount of change in the adsorption energy caused by the application of an electric field can be varied easily by doping cations with small electronegativity. The results for Ba, Sr, and Zr are slightly off from this trend. These three cations are uniformly doped (see Fig. 2), so that the doped cations are not adjacent to each other. Therefore, it is considered that the amount of electron transfer to the CO2 molecule changes depending on the absence of the adjacent element. In conclusion, this indicates that doping with cations of small electronegativity can readily perform control of adsorption and desorption by application of an electric field, which is predicted theoretically to lead to a higher CO2 separation capacity (see Fig. 10).
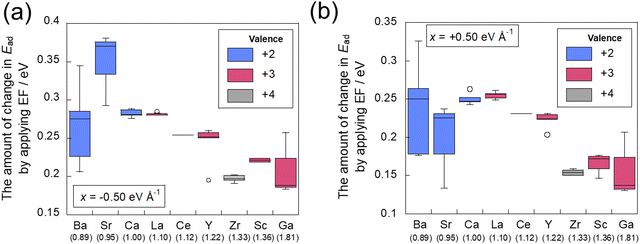 | ||
| Fig. 9 Relationship between the difference of adsorption energy and the electronegativity of the dopant (a) in −0.50 eV Å−1 and (b) in +0.50 eV Å−1. | ||
4. Conclusion
The material properties necessary for CO2 capture control by application of an electric field were elucidated using doped CeO2 models and DFT calculations. The calculations showed that the application of an electric field for any doped cation can control the CO2 adsorption energy. Selective CO2 capture and desorption can be performed by switching the direction of the electric field. However, the amounts of change in adsorption energy were observed to be different for each doped cation because of the application of the electric field. This amount of change corresponds to the degree to which the adsorption or desorption can be controlled by the application of the electric field. To clarify the reason why these values differ for doped cations, we prepared computational models in which the atomic positions were partially fixed. Then we calculated the energy of the prepared models. This investigation revealed that the difference in charge transfer from the adsorption site to the CO2 molecule has a strong correlation with the difference in the amount of change in the adsorption energy caused by the application of the electric field. This result was also confirmed using the Bader charge analysis. Moreover, the results showed a relationship between the electronegativity of the doped cation, which affects the Lewis basicity of metal oxides, and the controllable amount of CO2 adsorption. In summary, the low electronegativity of the doped cation is associated with a greater amount of electron transfer and a greater amount of change in CO2 adsorption by application of the electric field. These results can lead to better material prediction for CO2 capture controlled using an electric field, which can be expected to contribute to methods for low-cost CO2 capture.Conflicts of interest
The authors have no conflicts to declare.Acknowledgements
This work received support from the JSPS-research the mechanism of CO2 capture assisted by an EF. It was performed using the supercomputer system at the Information Initiative Center in Hokkaido University.References
-
J. G. Canadell, et al., Global Carbon and other Biogeochemical Cycles and Feedbacks, in Climate Change 2021: The Physical Science Bases. Contribution of Working Group I to the Sixth Assessment Report of the Intergovernmental Panel on Climate Change, Cambridge University Press, 2021, pp. 673–816 Search PubMed
.
- C. H. Yu, C. H. Huang and C. S. Tan, Aerosol Air Qual. Res., 2012, 12, 745–769 CrossRef CAS
.
- W. Gao, S. Liang, R. Wang, Q. Jiang, Y. Zhang, Q. Zheng, B. Xie, C. Y. Toe, X. Zhu, J. Wang, L. Huang, Y. Gao, Z. Wang, C. Jo, Q. Wang, L. Wang, Y. Liu, B. Louis, J. Scott, A. C. Roger, R. Amal, H. Heh and S. E. Park, Chem. Soc. Rev., 2020, 49, 8584–8686 RSC
.
- M. Wang, A. Lawal, P. Stephenson, J. Sidders and C. Ramshaw, Chem. Eng. Res. Des., 2011, 89, 1609–1624 CrossRef CAS
.
- F. O. Ochedi, J. Yu, H. Yu, Y. Liu and A. Hussain, Environ. Chem. Lett., 2021, 19, 77–109 CrossRef CAS
.
- J. Wang, L. Huang, R. Yang, Z. Zhang, J. Wu, Y. Gao, Q. Wang, D. Hare and Z. Zhong, Energy Environ. Sci., 2014, 7, 3478–3518 RSC
.
- B. Petrovic, M. Gorbounov and S. M. Soltani, Microporous Mesoporous Mater., 2021, 312, 110751 CrossRef CAS
.
- L. Dumée, C. Scholes, G. Stevens and S. Kentish, Int. J. Greenhouse Gas Control, 2012, 10, 443–455 CrossRef
.
- M. Tao, N. Xu, J. Gao, W. Zhang, Y. Li, M. T. Bernards, Y. Shi, Y. He and H. Pan, Energy Fuels, 2019, 33, 474–483 CrossRef CAS
.
- G. Sethia and A. Sayari, Carbon, 2015, 93, 68–80 CrossRef CAS
.
- M. Ding, R. W. Flaig, H. L. Jiang and O. M. Yaghi, Chem. Soc. Rev., 2019, 48, 2783–2828 RSC
.
- T. Harada, F. Simeon, E. Z. Hamada and T. A. Hatton, Chem. Mater., 2015, 27, 1943–1949 CrossRef CAS
.
- M. L. T. Triviño, V. Hiremath and J. G. Seo, Environ. Sci. Technol., 2018, 52, 11952–11959 Search PubMed
.
- B. Kokoszka, N. K. Jarrah, C. Liu, D. T. Moore and K. Landskron, Angew. Chem., Int. Ed., 2014, 53, 3698–3701 CrossRef CAS PubMed
.
- T. B. Binford, G. Mapstone, I. Temprano and A. C. Forse, Nanoscale, 2022, 14, 7980–7984 RSC
.
- X. Tan, L. Kou, H. A. Tahini and S. C. Smith, Sci. Rep., 2015, 5, 17636 CrossRef CAS PubMed
.
- H. Xiong, H. Zhang and L. Gan, J. Mater. Sci., 2021, 56, 4341–4355 CrossRef CAS
.
- Q. Sun, Z. Li, D. J. Searles, Y. Chen, G. Lu and A. Du, J. Am. Chem. Soc., 2013, 135, 8246–8253 CrossRef CAS
.
- M. L. T. Triviño, H. Jeon, A. C. S. Lim, V. Hiremath, Y. Sekine and J. G. Seo, ACS Appl. Mater. Interfaces, 2020, 12, 518–526 CrossRef PubMed
.
- K. Murakami, Y. Mizutani, H. Sampei, A. Ishikawa, Y. Tanaka, S. Hayashi, S. Doi, T. Higo, H. Tsuneki, H. Nakai and Y. Sekine, Phys. Chem. Chem. Phys., 2021, 23, 4509–4516 RSC
.
- M. Li, U. Tumuluri, Z. Wu and S. Dai, ChemSusChem, 2015, 8, 3651–3660 CrossRef CAS
.
- C. Slostowski, S. Marre, P. Dagault, O. Babot, T. Toupance and C. Aymonier, J. CO2 Util., 2017, 20, 52–58 CrossRef CAS
.
- S. Ratchahat, M. Sudoh, Y. Suzuki, W. Kawasaki, R. Watanabe and C. Fukuhara, J. CO2 Util., 2018, 24, 210–219 CrossRef CAS
.
- K. Yamada, S. Ogo, R. Yamano, T. Higo and Y. Sekine, Chem. Lett., 2020, 49, 303–306 CrossRef CAS
.
- G. Kresse and J. Hafner, Phys. Rev. B: Condens. Matter Mater. Phys., 1993, 47, 558–561 CrossRef CAS PubMed
.
- G. Kresse and J. Furthmüller, Phys. Rev. B: Condens. Matter Mater. Phys., 1996, 54, 11169–11186 CrossRef CAS
.
- P. E. Blöchl, Phys. Rev. B: Condens. Matter Mater. Phys., 1994, 50, 17953–17979 CrossRef
.
- G. Kresse and D. Joubert, Phys. Rev. B: Condens. Matter Mater. Phys., 1999, 59, 1758–1775 CrossRef CAS
.
- J. P. Perdew, K. Burke and M. Ernzerhof, Phys. Rev. Lett., 1996, 77, 3865–3868 CrossRef CAS
.
- S. Grimme, J. Antony, S. Ehrlich and S. Krieg, J. Chem. Phys., 2010, 132, 154104 CrossRef PubMed
.
- V. I. Anisimov and O. Gunnarsson, Phys. Rev. B: Condens. Matter Mater. Phys., 1991, 43, 7570–7574 CrossRef CAS
.
- S. L. Dudarev, G. A. Botton, S. Y. Savrasov, C. J. Humphreys and A. P. Sutton, Phys. Rev. B: Condens. Matter Mater. Phys., 1998, 57, 1505–1509 CrossRef CAS
.
- M. Nolan, S. Grigoleit, D. C. Sayle, S. C. Parker and G. W. Watson, Surf. Sci., 2005, 576, 217–229 CrossRef CAS
.
- Z. X. Yang, G. X. Luo, Z. S. Lu and K. Hermansson, J. Chem. Phys., 2007, 127, 074704 CrossRef
.
- H. T. Chen and J. G. Chang, J. Chem. Phys., 2010, 132, 214702 CrossRef PubMed
.
- K. R. Hahn, M. Iannuzzi, A. P. Seitsonen and J. Hutter, J. Phys. Chem. C, 2013, 117, 1701–1711 CrossRef CAS
.
- K. Murakami, Y. Mizutani, H. Sampei, A. Ishikawa and Y. Sekine, J. Chem. Phys., 2021, 154, 164705 CrossRef CAS PubMed
.
- W. Tang, E. Sanville and G. Henkelman, J. Phys.: Condens. Matter, 2009, 21, 084204 CrossRef CAS
.
- E. Sanville, S. D. Kenny, R. Smith and G. Henkelman, J. Comput. Chem., 2007, 28, 899–908 CrossRef CAS PubMed
.
- G. Henkelman, A. Arnaldsson and H. Jónsson, Comput. Mater. Sci., 2006, 36, 354–360 CrossRef
.
- M. Yu and D. R. Trinkle, J. Chem. Phys., 2011, 134, 064111 CrossRef
.
- N. V. Skorodumova, M. Baudin and K. Hermansson, Phys. Rev. B: Condens. Matter Mater. Phys., 2004, 69, 075401 CrossRef
.
- J. L. F. D. Silva, M. V. G. Pirovano, J. Saucer, V. Bayer and G. Kresse, Phys. Rev. B: Condens. Matter Mater. Phys., 2007, 75, 045121 CrossRef
.
- L. Gerward, J. S. Olsen, L. Petit, G. Vaitheeswaran, V. Kanchana and A. Svane, J. Alloys Compd., 2005, 400, 56–61 CrossRef CAS
.
- K. Murakami, S. Ogo, A. Ishikawa, Y. Takeno, T. Higo, H. Tsuneki, H. Nakai and Y. Sekine, J. Chem. Phys., 2020, 152, 014707 CrossRef CAS PubMed
.
- K. Momma and F. Izumi, J. Appl. Crystallogr., 2011, 44, 1272–1276 CrossRef
.
- N. Ulumuddin, F. Che, J. Yang, S. Ha and J.-S. McEwen, Catalysts, 2021, 11, 271 CrossRef CAS
.
- J. A. Duffy, J. Solid State Chem., 1986, 62, 145–157 CrossRef CAS
.
- V. Dimitrov and T. Komatsu, J. Solid State Chem., 2012, 196, 574–578 CrossRef CAS
.
Footnote |
| † Electronic supplementary information (ESI) available. See DOI: https://doi.org/10.1039/d2cp04108a |
| This journal is © the Owner Societies 2022 |

