Theoretical study of the CO2–O2 van der Waals complex: potential energy surface and applications†
Yosra
Ajili
a,
Ernesto
Quintas-Sánchez
 b,
Bilel
Mehnen
 c,
Piotr S.
Żuchowski
 c,
Filip
Brzęk
c,
Nayla
El-Kork
c,
Filip
Brzęk
c,
Nayla
El-Kork
 d,
Marko
Gacesa
d,
Richard
Dawes
d,
Marko
Gacesa
d,
Richard
Dawes
 b and
Majdi
Hochlaf
 *e
*e
aUniversité de Tunis El Manar, Faculté des Sciences de Tunis, LR01ES09 Spectroscopie Atomique et Moléculaire et Applications, 1060, Tunis, Tunisia
bDepartment of Chemistry, Missouri University of Science and Technology, Rolla, MO 65409-0010, USA
cInstitute of Physics, Faculty of Physics, Astronomy and Informatics, Nicolaus Copernicus University, Grudziadzka 5, 87-100 Torun, Poland
dSpace and Planetary Sciences Center, and Department of Physics, Khalifa University, P.O. Box 127788, Abu Dhabi, United Arab Emirates
eUniversité Gustave Eiffel, COSYS/IMSE, 5 Bd Descartes 77454, Champs sur Marne, France. E-mail: majdi.hochlaf@univ-eiffel.fr
First published on 17th November 2022
Abstract
A four-dimensional-potential energy surface (4D-PES) of the atmospherically relevant carbon dioxide–oxygen molecule (CO2–O2) van der Waals complex is mapped using the ab initio explicitly correlated coupled cluster method with single, double, and perturbative triple excitations (UCCSD(T)-F12b), and extrapolation to the complete basis set (CBS) limit using the cc-pVTZ-F12/cc-pVQZ-F12 bases and the l−3 formula. An analytic representation of the 4D-PES was fitted using the method of interpolating moving least squares (IMLS). These calculations predict that the most stable configuration of CO2–O2 complex corresponds to a planar slipped-parallel structure with a binding energy of V ∼ −243 cm−1. Another isomer is found on the PES, corresponding to a non-planar cross-shaped structure, with V ∼ −218 cm−1. The transition structure connecting the two minima is found at V ∼ −211 cm−1. We also performed comparisons with some CO2–X van der Waals complexes. Moreover, we provide a SAPT analysis of this molecular system. Then, we discuss the complexation induced shifts of CO2 and O2. Afterwards, this new 4D-PES is employed to compute the second virial coefficient including temperature dependence. A comparison between quantities obtained in our calculations and those from experiments found close agreement attesting to the high quality of the PES and to the importance of considering a full description of the anisotropic potential for the derivation of thermophysical properties of CO2–O2 mixtures.
I. Introduction
In Earth's atmosphere, carbon dioxide is present in gaseous form under normal pressure and temperature conditions. It is the fourth most abundant gas there (∼0.035%). At low temperatures, it can also be found in liquid and solid forms. Its supercritical fluid form is used for industrial extraction applications where it replaces hazardous liquids. Dioxygen, is the second most abundant gas in Earth's atmosphere (∼21%), where it is in the gas phase under normal conditions. Industrially, O2 is purified by the distillation of liquid air. It is used as an oxidizer, for medical purposes, and in a wide range of domestic and industrial combustion reactions. Dioxygen is also produced by living organisms through photosynthesis and is essential for the breathing process of most living organisms. In addition, thermophysical properties of carbon dioxide and dioxygen molecules are relevant for modeling Earth's atmosphere and the atmospheres of other celestial bodies and planets where these species are present such as Mars, Europa and Ganymede, as well as exoplanets. In a planetary atmosphere, CO2 acts both as a powerful greenhouse gas and as a coolant, strongly influencing the formation and evolution of primary and secondary atmospheres of hot gas giants and terrestrial planets.1,2 Very recently, CO2 has been detected in transmission spectra in the atmosphere of the gas giant exoplanet WASP-39b,3 confirming the hints of earlier photometric detections of CO2 during transits.4 Accurate photochemical modeling of CO2-rich atmospheres of exoplanets will require detailed descriptions of thermophysical properties of carbon dioxide and other atmospheric species, such as dioxygen molecules.Previous studies of molecular dimers whose interactions are already described in the literature are often in the form of multi-dimensional potential energy surfaces (PESs), describing the potential energy for the full range of angular poses and interaction distances, usually with fixed monomer geometries. These multi-dimensional PESs are crucial to compute and interpret the spectroscopic and thermophysical properties of mixtures. Indeed, they are needed for the derivation of the rovibrational spectra of the complexes5–8 or for inelastic energy transferring collisions9 and are usually used for the derivation of the macromolecular thermophysical properties (e.g., virial coefficients) of the dimer mixtures. Therefore, an accurate PES of the CO2–O2 van der Waals (vdW) complex is needed in order to predict and understand the spectroscopy and dynamical behavior of this system in various environments. In atmospheric and environmental contexts, systems composed of CO2 interacting with small gas phased molecules are considered as prototypes, allowing extensive characteristic studies of the intermolecular interactions and molecular dynamics of vdW systems. Moreover, the CO2–O2 PES is of great importance for climate simulations since for CO2–O2, collision-induced-absorption is in the spectral ranges of atmospheric windows.
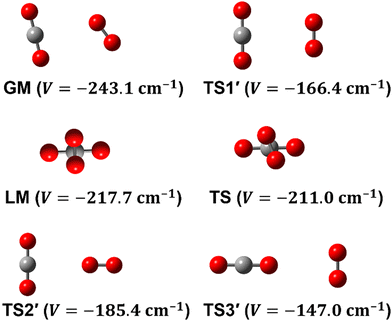
To date, there are numerous theoretical and experimental studies dedicated to vdW complexes involving CO2 as well as O2 with other molecules such as CO2–O2,10–12 O2–O2,11,13 O2–N2,14 O2–N2O,4,15 CO2–H2,16 CO2–CO2,5,17 CO2–N2,18,19 CO2–CO,6,18,20 and CO2–N2O.21 To the best of our knowledge, no analytical function of the CO2–O2 PES is available in the literature. In fact, information on this complex is limited to the recent works by Grein,10 Madajczyk et al.,11 and Lee et al.12 In 2017, Grein used the explicitly correlated coupled cluster method in conjunction with the cc-pVXZ-F12 and the aug-cc-pVXZ (X = D up to Q) basis sets to identify some stationary points, where he used the RCCSD(T)-F12a approach for geometry optimizations while he employed the UCCSD(T)/aug-cc-pVDZ level for harmonic frequencies calculations. Grein found two minima and one T-shaped stationary point that was assigned in that paper to be a first-order saddle connecting them. These structures are shown in Fig. 1 and are labeled GM, LM, and TS2′. Later on, Madajczyk et al.11 performed extensive methodological benchmarks on CO2–O2 interaction energies for the stationary points found by Grein. With the benefit of a complete 4D mapping, we find, however, that TS2′ is in fact one of three second-order saddles, as it is unstable with respect to an out-of-plane rotation of O2, leading to the cross-shaped LM, but also with respect to a disrotatory in-plane geared motion leading to the slipped parallel GM. We do report one transition structure (a non-planar first-order saddle) connecting GM and LM. The topography of the PES and paths connecting critical points will be discussed in more detail later.
Experimentally, Lee et al.12 used the CO2–O2 neutral vdW complex to show that electron attachment may lead to the formation of a monomeric molecular anion (O2–CO2)−, which is an isomer of the gaseous anionic species (CO4)−. This anion is present in the ionosphere, with a newly formed C–O bond facilitating extensive delocalization of the free electron. Indeed, a significant bonding interaction was characterized resulting from the formation of the (O2–CO2)− monomeric anionic complex instead of the weak bond of the CO2–O2 vdW neutral system. Lee et al.12 also reported some calculations at the MP2/6-311+G* level which predict an out-of-plane structure for the GM of the neutral CO2–O2 complex. The much higher-level calculations reported here are expected to be more reliable.
In this paper, we generate the 4D-PES of the CO2–O2 vdW complex describing the intermolecular coordinates. The electronic structure calculations are performed at the UCCSD(T)-F12b/CBS level of theory. An analytical expression of the PES was constructed and used to characterize the interactions and also to compute the temperature dependent second virial coefficient. We also provided rationalization of the shape of the PES using the energy decomposition provided by the Symmetry Adapted Perturbation Theory (SAPT) for high-spin open-shell complexes.22–24 Moreover, we discuss the complexation-induced effects on the vibrational frequencies of the CO2 and O2 monomers. The paper is organized as follows: In Section II, we give details about the electronic structure calculations, the fitting methodology and analytical representation developed in this work. In Section III, we describe the main features of the PES. In Section IV, we discuss the monomers’ vibrational frequencies either isolated or in CO2–O2 complexes and their shifts. Then, we compute the CO2–O2 mixture second virial coefficient in the 200–550 K temperature range and compare with available experiments. Good agreement between our theoretical data and the experimental measurements is observed although there is significant variation found in the various experiments which span several decades. This validates the 4D-PES and demonstrates its relevance for the deduction of thermophysical properties.
II. Interaction potential of the CO2–O2 complex
1. Electronic structure calculations
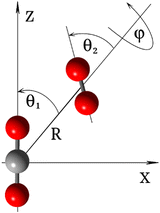
As depicted in Fig. 2, the coordinates used to represent the four-dimensional (4D) CO2–O2 PES (V(R,θ1,θ2,ϕ)) are the Jacobi coordinates: R, θ1, θ2 and ϕ. R is the distance between the centers of mass of the two fragments; θ1 and θ2 correspond to the angles between R and the molecular axes of the CO2 and O2 molecules, respectively; and ϕ denotes the dihedral (out of plane) torsional angle. For the construction of the PES, both monomers were held rigid. It is a good approximation in this application to consider only the inter-monomer coordinates because their frequencies are much less than those of the intra-monomer coordinates. The geometry of the O2 molecule was held at equilibrium, using the vibrationally averaged distance: rOO = 1.20752 Å, which is consistent with its experimental rotational constant.25 The CO2 molecule is held linear, with each CO bond-distance fixed at 1.162086 Å,26 which is also consistent with its experimental rotational constant.26,27The ground state of the CO2–O2 complex correlates to the CO2 (X1Σg+) + O2 (X3Σg−) dissociation limit at infinite inter-monomer separations. It has an open shell wavefunction of triplet spin multiplicity. Thus, the final high-level PES was computed using explicitly-correlated unrestricted coupled-cluster theory,28 extrapolated to the complete basis set limit, UCCSD(T)-F12b/CBS. For the description of the atoms, we used the explicitly correlated basis sets (cc-pVXZ-F12) by Peterson and co-workers29 and corresponding density fitting and resolution of identity basis sets as implemented in MOLPRO electronic structure code package.30 The basis extrapolation was performed using the cc-pVTZ-F12 and cc-pVQZ-F12 bases and the l−3 formula.31 All ab initio calculations were performed using MOLPRO.
In our experience with dimer complexes composed of a few light atoms, the binding energy and relative energies of vdW isomers are typically converged to within a few wavenumbers with this procedure, which does not employ counterpoise corrections or mid-bond functions. Indeed, we tested the effect of adding mid-bond functions for this system and find the impact to be negligible at the CBS level, affecting the well-depth at the GM by only 1.4 cm−1 and less in other regions. At the triple-zeta level, however, the results obtained without mid-bond functions are significantly better (closer to CBS) than those obtained with mid-bond functions. Careful testing for a particular system, method, and basis set seems warranted when considering use of mid-bond functions. Stable convergence to the restricted open-shell Hartree–Fock (ROHF) reference was achieved by first using MOLPRO's CASSCF (multi) algorithm with the occupation of the desired configuration specified, followed by a single iteration of the ROHF SCF algorithm to prepare the orbitals for the UCCSD(T)-F12b procedure. As mentioned below, to avoid placing expensive high-level data in energetically inaccessible regions, a lower-level guide surface was first constructed. This was done using data at the UCCSD(T)-F12a/cc-pVDZ-F12 level of theory. The guide surface is only used to aid in the efficient construction of the high-level PES, on which all evaluations used to study the dynamics were performed. Exploiting the system's symmetry, energies were only computed in the reduced angular range: 0° < θ1 < 90°, 0° < θ2 < 90°, and 0° < ϕ < 180°.
2. Analytical potential function
As we have done in the past for other vdW linear dimers32–39 an analytical representation of the 4D-PES was constructed using an automated interpolating moving least squares (IMLS) methodology, freely available as a software package under the name AUTOSURF.40 As usual,41,42 a local fit was expanded about each data point, and the final potential is obtained as the normalized weighted sum of the local fits. The fitting basis and other aspects of the procedure were the same as for other previous systems and have been described in detail elsewhere.40,42,43 The shortest inter-monomer center-of-mass distance considered is R = 2.0 Å and the ab initio data coverage in the fitted PES extends to R = 16.0 Å, while the zero of energy is set at infinite center-of-mass separation between the monomers. For the high-level 4D-PES, 1438 symmetry-unique points were required to achieve an estimated root-mean-squared fitting error of 0.3 cm−1 for energies below the asymptote. As discussed in previous applications of our approach, since the fit is interpolative and thus passes through each included data point, a straightforward RMS error measure isn’t applicable. The fit quality is therefore estimated by other means including use of independent test sets.42 The 4D-PES switches to an analytical form describing the long range based on the leading electrostatic (quadrupole–quadrupole) and dispersion terms, which vary as R−5 and R−6 respectively. For consistency, the parameters of the long-range form were determined by a least squares fit to the subset of ab initio data with R > 8.0 Å. To guide the placement of high-level data, a lower-level guide surface was constructed using 1370 symmetry-unique points, distributed using a Sobol sequence44 biased to sample the short range region more densely. This PES will be sent upon request.III. Description of the 4D-PES
Some of us have been involved in the construction of each of a large number vdW PESs for which both monomers are linear and hence the intermolecular interactions are 4D. These include: (OCS)2,45 (CO)2,46 (CO2)2,5,47 CO2–CO,6,32 CO2–CS2,48 CO–N2,49 (NNO)2,50 CO2–HCCH,51 C6H−–H2,52 HC2NC–H2,53 O2–CO,54 O2–HCl, O2–HF, H2–O2, O2–N2,37,55 CO–HCCH, HNC3–H2,53 HC5N–H2,53 C4H−–H2,38 C2H−–H2, MgCCH–H2, CF+–H2,33 HCS+–H2,39 NCCP–H2, PN–H2,36 CO2–N2,8,19,35 and O2–O2.56,57 Four systems from that list include CO2, and six others include O2. Except for the cases of ions, whose PESs typically have simpler topographies, the rich and subtle balance of possible steric and electronic interactions as well as symmetry considerations, give rise to a complex variety of predicted isomers, transition structures, and connecting paths. Many of the isomers are planar and include configurations such as slipped- or skewed-parallel or anti-parallel (in some cases non-polar due to structure and symmetry), T-shaped or nearly T-shaped, with either end of each fragment possibly stabilized when pointing towards the side of the other molecule. Colinear, or slightly skewed nearly colinear arrangements are sometimes observed. Non-planar isomers are also common and are often accompanied by planar isomers. These usually take the form of perfect cross shapes, although they are sometimes slightly skewed in one or more coordinates. Symmetry can play a role. Remarkably, what is a local or even global minimum geometry in one system can be quite unstable and perhaps a saddle point of some order in another.Once the 4D-PES has been constructed, it is insightful to generate some plots such as those in Fig. 3. With the torsion fixed at ϕ = 0 degrees (enforcing planar geometries) a 2D plot was made for the complete ranges of both θ1 and θ2. At each point on the plot corresponding to a pair of (θ1, θ2) values, the energy is minimized with respect to R. Thus, any planar isomers, transition structures, and paths between them are represented, all fully relaxed. Optionally, in the same fashion, an extended angles plot can be constructed allowing each fragment to rotate a full 360°. This doesn’t provide additional information for this system given its symmetry, but can facilitate viewing of paths that otherwise exit the plot on one side and re-emerge on the other. The left panel of Fig. 3 shows the two symmetry equivalent wells corresponding to the global minimum (GM). From GM, rotation mostly of one fragment or the other leads to the two possible T-shaped structures in this system (one for each monomer acting as the stem of the T). These are TS2′ (O2 as the stem) and TS3′ (CO2 as the stem), found in the middle of the plot borders, top/bottom and left/right respectively. They each appear twice due to symmetry. These are 2nd-order saddles since they are unstable to in-plane rotation of the stem fragment, leading back to GM, but also with respect to out-of-plane stem fragment rotation leading to the cross minimum. The right side of Fig. 3 shows the same type of plot, but with the torsion fixed at ϕ = 90°, which includes the cross-shaped minimum. The torsion angle is undefined for a precise T-shaped structure but TS2′ and TS3′ are shown on the edges of both plots. The side-by-side parallel structure (TS1′) appears in the center of the ϕ = 0° plot, and although labeled a transition state by Grein is shown here to be a 2nd-order saddle. It is unstable with respect to a geared disrotatory in-plane motion leading to GM, and also with respect to rotation in ϕ, leading to the cross-shaped LM. A thorough search through similar optimized plots for a sequence of values of ϕ, enabled location of the TS connecting GM and LM. Fig. 4 plots this path in ϕ, with the other three coordinates relaxed at each point, locating the TS at ϕ = 70.5°. GM and LM differ significantly in terms of R (geometric parameters are given in Table 1), with LM found at a shorter separation (R = 3.20 Å for LM compared with R = 3.38 Å for GM). The value of R for the TS is already close to that of LM, at R = 3.24 Å. A closer look at geometries along the path between GM and LM reveals that θ2 changes more significantly than θ1, and it is when ϕ increases from about 50–70°, that θ2 changes the most and R contracts correspondingly.
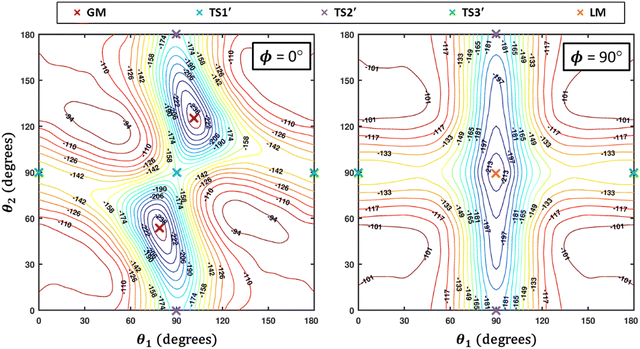 | ||
| Fig. 3 R-Optimized contour plots of the CO2–O2 4D-PES as a function of θ1 and θ2 for (at left) the planar (ϕ = 0°) geometries, and (at right) the non-planar (ϕ = 90°) geometries. For each pair of angles (θ1, θ2), the energy is minimized by varying R. The global minimum (GM) and its symmetry partner appear in the ϕ = 0° plot at left, while the local cross-shaped minimum (LM) is found in the ϕ = 90° plot. Symmetry partners of the three second-order saddles (structures given in Fig. 1) are also indicated on the plots. The TS connecting GM and LM does not appear since ϕ = 70.5° for that structure (see Fig. 4). | ||
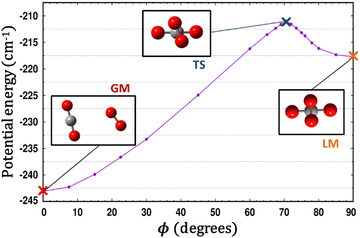 | ||
| Fig. 4 A scan along ϕ with all three of the other coordinates optimized at each point illustrates the path connecting the global minimum (GM) and the local minimum (LM) which passes through a TS. | ||
| Structure | GM | LM | TS | TS1′ | TS2′ | TS3′ | colinear |
|---|---|---|---|---|---|---|---|
| R | 3.379 | 3.202 | 3.244 | 3.325 | 3.717 | 4.339 | 4.873 |
| θ 1 | 78.5 | 90.0 | 86.0 | 90.0 | 90.0 | 0.0 | 0.0 |
| θ 2 | 55.0 | 90.0 | 79.0 | 90.0 | 0.0 | 90.0 | 0.0 |
| ϕ | 0.0 | 90.0 | 70.5 | 0.0 | — | — | — |
| V | −243.1 | −217.7 | −211.0 | −166.4 | −185.4 | −147.0 | −105.5 |
Fig. 5 presents radial 1D-cuts of the 4D-PES passing through each of the critical points identified in this study. The strong anisotropy is highlighted as minima in R appear at a wide range of values for the various angular poses. Fig. 5 also confirms the fitting accuracy of the 4D-PES as a number of ab initio data that were not included in the fit are plotted along each radial slice and closely match the fitted values.
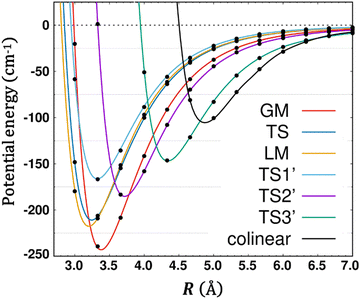 | ||
| Fig. 5 Seven radial cuts are presented which reveal the strong anisotropy of the PES. Angular poses correspond to approach through each of the 6 critical points shown in Fig. 1 as well as the end-on colinear orientation. Lines plot the fitted PES, while points represent ab initio data (not used in the fit). | ||
Fig. 3 and 4 imply that a complex manifold of rovibrational levels can be anticipated, even before considering the effect of electronic spin. Nuclear spin statistics will dictate allowed levels and transitions for the various isotopologues. Tunneling splittings due to symmetry partners of GM are expected, and substantial delocalization and perturbation of even low-lying levels are likely. As seen in the left side of Fig. 3, exploration from GM toward the T-shaped TS2′ can occur with little necessary energy. The right side of Fig. 3 highlights the fact that for the cross-shaped LM, the complex is extremely floppy with respect to θ2, motion of the O2 fragment. Fig. 4 shows that the barrier between GM and LM is low and thus interference between the stacks of levels is possible, although, similar to the case of (CO)2,46 the isomers can be distinguished by their rather different center-of-mass distances (see Table 1). For SN–H−, SH–N−58 and CO2–N28 weakly bound complexes, quantum effects, such as tunneling, vibrational memory, and localization effects were predicted. A previous study of CO–O2 indicates that although the electronic spin adds additional complexity in these triplet systems, a great deal of useful insight and interpretation of the experiments can be made even while neglecting the spin term.54
It is remarkable to consider the variety of interactions and resulting isomers for complexes of CO2 with other partners including itself. The interactions vary significantly in strength as well as with respect to orientation. For example, the GM of the CO2–N2O21 complex has a similar shape as GM of CO2–O2, whereas no equivalent structure found in the CO2–H2,59 CO2–CO2,5,47 CO2–N2,8,19,35 or CO2–CO6,18,20,32 PESs. This can be interpreted in terms of orbital overlaps. The bonding for CO2–O2 GM and LM can be viewed as electron donation to the electropositive C of CO2 from the lone pair of O2 located in the πg* molecular orbital (MO) of O2, as illustrated in Scheme 1. For CO2–H2, CO2–N2 and CO2–CO dimers, the outermost σ orbital of H2/N2/CO interacting with such C promotes T-shaped minima (either global or local, cf.Scheme 1), corresponding however to unfavorable interactions for CO2–O2 resulting in a transition state (e.g. TS2′, cf.Scheme 1). For (CO2)2, overlap between the outermost π MOs of CO2 then promotes the global minimum slipped parallel form (θ1 = 58.7°, θ2 = 58.7°, ϕ = 0°), while the T-shape structure corresponds to a transition structure (cf.Scheme 1). Fig. 6 compares the CO2–O2 and CO2–N2 systems, both homonuclear diatomics and neighbors on the periodic table, but with very different electron configurations. The plots in Fig. 6 were obtained after scanning the out-of-plane rotation (θ2) of N2 or O2, while holding θ1 and ϕ fixed, and relaxing R at each point. The T-shaped global minimum for CO2–N2 corresponds to an unstable 2nd-order saddle for CO2–O2, while the cross-shaped LM for CO2–O2 becomes a TS for CO2–N2.
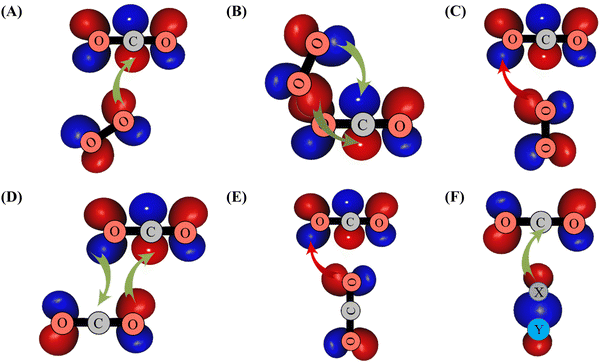 | ||
| Scheme 1 Illustration of overlaps between the πg* MO of O2 and outermost πu MO of CO2 leading to the formation of GM (in (A)), of LM (in (B)) and of TS2′ (in (C)). The formation of the other CO2–O2 structures displayed in Fig. 1 can be obtained with similar considerations. In (D) and (E), we give the interactions between the CO2 outermost orbitals resulting in the formation of the global and the T-shape transition structures of (CO2)2. In (F), we illustrate the overlap between the outermost σ MO of XY (XY = H2 or N2 or CO) and the outermost πu MO of CO2. πg* (πu) MO corresponds to the HOMO (LUMO) of O2 (CO2). σ MO is the HOMO of XY species. Favorable (unfavorable) overlaps are represented by green (red) arrows. | ||
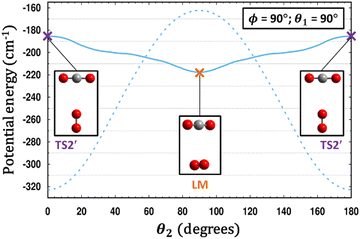 | ||
| Fig. 6 A comparison is made between the PESs of CO2–O2 (solid line) and CO2–N2 (dashed line).35 For each system, a scan of θ2 is performed holding θ1 and ϕ fixed, and for each value of θ2, the energy in each case is minimized with respect to R. Remarkably, what is a T-shaped global minimum for CO2–N2 becomes an unstable 2nd-order saddle in CO2–O2, while the cross-shaped structure in the center of the plot at θ2 = 90° is a local minimum for CO2–O2 yet a transition structure for CO2–N2. | ||
The well depths for the global minima of some of the CO2 bearing vdW complexes fall into the following order: CO2–C2H251 > CO2–N2O21 > CO2–CO25,47 > CO2–CO6,32 > CO2–N28,19,35 > CO2–O2 > CO2–H2,59 with V (in cm−1) = 751, 581, 520, 407, 323, 243, and 220, respectively. Most of these neutral partners are nonpolar and clearly the different electron configurations play a key role. The deepest global minimum from this set is for C2H2 (acetylene), which with its triple bond, positions itself into a close side-by-side parallel geometry at a distance of R = 3.20 Å (the same distance as the cross-shaped LM in CO2–O2). This is not a stable configuration in the other systems.
IV. SAPT analysis
We have used a SAPT implementation based on the psi4numpy60 module of Psi4 suite of codes implemented by some of us with the density fitting approach.61,62 The reference wavefunction for the first-order electrostatics and exchange energies correspond to the UHF level of theory, while for the dispersion energy we have used the RPA approximation.63 We have performed the calculations using aug-cc-pVXZ basis sets (with X = T,Q)64,65 with and without mid-bond functions.The calculations using various basis sets were performed for GM, LM and TS2′ geometries obtained in the present paper. Results were gathered in Table 2. A brief comparison with values from Table 1 shows fairly good agreement of SAPT(RPA) compared to UCCSD(T)-F12 values from our fit. The interaction energy was defined as the sum of all contributions to the second order. A common practice for a non-polar system is to neglect contributions beyond second order which can be calculated as the difference between the Hartree–Fock interaction energy and the sum of SAPT correction obtained at Hartree–Fock level. This contribution is commonly denoted as δHF and is also shown in Table 2. At each of the tested critical points, dispersion energy is the main binding force, while the first-order exchange energy is the biggest repulsive factor.
| Geometry | Basis | E int | E (1)elst | E (1)exch | E (2)ind | E (2)exch−ind | E (2)disp | E (2)exch−disp | δ HF |
|---|---|---|---|---|---|---|---|---|---|
| GM | TZ | −219.86 | −130.80 | 348.63 | −143.09 | 103.25 | −431.12 | 33.28 | −11.95 |
| TZ+mb | −238.35 | −130.26 | 348.51 | −143.35 | 102.87 | −452.93 | 36.81 | −12.00 | |
| QZ | −236.02 | −131.31 | 348.55 | −143.56 | 103.29 | −448.78 | 35.78 | −12.04 | |
| QZ+mb | −247.44 | −131.68 | 348.48 | −143.88 | 103.37 | −462.10 | 38.37 | −12.08 | |
| LM | TZ | −175.91 | −61.55 | 300.83 | −113.93 | 88.06 | −419.95 | 30.63 | −8.86 |
| TZ+mb | −194.73 | −59.84 | 300.48 | −114.30 | 87.54 | −442.49 | 33.88 | −8.97 | |
| QZ | −192.30 | −60.89 | 300.82 | −114.78 | 88.21 | −438.66 | 33.01 | −8.95 | |
| QZ+mb | −204.11 | −61.53 | 300.81 | −115.14 | 88.22 | −451.79 | 35.32 | −8.99 | |
| TS2′ | TZ | −145.22 | −12.14 | 241.64 | −85.41 | 67.57 | −381.73 | 24.85 | −9.75 |
| TZ+mb | −157.42 | −9.03 | 241.32 | −85.53 | 67.15 | −398.55 | 27.22 | −9.85 | |
| QZ | −156.09 | −9.10 | 241.19 | −84.75 | 66.57 | −396.75 | 26.75 | −9.89 | |
| QZ+mb | −165.51 | −9.32 | 241.17 | −85.05 | 66.65 | −407.58 | 28.61 | −9.91 | |
Since the center-of-mass distance R is similar for the GM, LM and TS2′ stationary points, there are generally only small differences in the dispersion component between these cases. The most dramatic change originates from the electrostatic interaction: in case of the secondary minimum (LM) the electrostatic energy is less than half of that at GM, and nearly zero in case of the T-shaped TS2′. This is somewhat expected as usually the electrostatic energy is the most anisotropic contribution even in the case of non-polar molecules. As is usually the case, the exchange-induction energy cancels out strongly with the induction energy, yet, the cancellation is not complete, thus the net overall effect of the induction forces is large compared to the interaction energy at these points: ∼−40 cm−1 in GM, ∼−25 cm−1 at LM and ∼−19 cm−1 at TS2′.
In Fig. S1 (ESI†), we show radial cuts through the 4D-PES corresponding to the GM, LM, TS, TS1′, TS2′, and TS3′ angular orientations. These plots confirm that the interaction energy originates mostly from the interplay between dispersion and exchange energies. In the case of the linear configuration, as expected, the steric Pauli repulsion is strongest, which manifests in the rapid increase of the exchange energy at a short range. For all geometries considered in this section, the induction-, electrostatics- and higher-order exchange energies along with δHF are small. As for the electrostatic interactions, this effect is repulsive at long range only for the parallel (TS1′, H-shape) configuration, and near the minima, the electrostatics are typically attractive. The induction forces quickly vanish with R and become very small: for quadrupole-quadrupole interactions, such decay is known to have R−8 asymptotic behavior, and a strong cancellation with exchange-induction energy occurs. Note also that in Ref. 57 similar character of the molecular interaction was reported for the quintet state of the O2–O2 system.
V. Applications
1. Complexation induced shifts
Upon complexation, modifications of the physico-chemical properties and of the geometries of the constituent monomers can occur. Regardless of the type of interaction involved, it is instructive to discuss the changes induced on the monomers within the complex. When experimental information on the complexes is not available, it is common to perform comparisons between the calculated data of the isolated monomers and those in within the complexes. Therefore, we give in Table 3 the (U)CCSD(T)-F12/aug-cc-pVTZ harmonic vibrational frequencies of isolated O2(X3Σg−) and CO2(X1Σg+) and those for GM and LM of the complex. For the monomers, we list also the corresponding experimental values, which compare reasonably to the calculated harmonic frequencies due to modest anharmonicity. The recorded errors are less than 1% for the equilibrium distances and less than 3% for the frequencies.Table 3 shows that all monomer modes change by complexation. The shifts are more pronounced for GM than for LM. This is consistent with the perturbation of the outermost πg* MO of CO2 interacting with O2 (see above). Also, the O2 vibrational frequency is more affected than the CO2 frequencies. Indeed, O2 redshifts by 3.2 and 1.8 cm−1 in GM and LM, respectively. In particular, there is a lifting of degeneracy of the bending mode of CO2: they redshift by 1.8 and 0.2 cm−1 (0.9 and 0.2 cm−1) in GM (LM). In GM, the stretching modes of CO2 blueshift, whereas they remain almost unchanged in LM. Note that these shifts are relatively significant, and they can be probed by IR spectroscopy of the complexes.
2. Second virial coefficients
To check the validity of our 4D-PES obtained with ab initio calculations, second virial coefficient computations were performed employing the fitted potential for the CO2–O2 complex. In the case of rigid molecules, the classical second virial coefficient, B, is expressed as a function of temperature as | (1) |
In the literature, very few experimental data are available for the second virial coefficient of the CO2–O2 mixture to compare with. Indeed, no experimental data exist for temperatures lower than 250 K or temperatures higher than 400 K. Fig. 7 shows our results for the second virial coefficient and those values measured by Edwards and Roseveare,68 Gorski and Miller,69 Cottrell et al.,70 and by Martin et al.71 This figure shows generally good agreement between our calculations and the experimental values. While small discrepancies of 4 to 9 cm3 mol−1 are found between our calculations and the experimental values of Gorski and Miller69 from 1953, and the more recent measurements of Martin et al.,71 excellent agreement is found with the measurements of Cottrell et al.70 (1956). The early (1942) single value provided by Edwards and Roseveare68 is discordant in the plot, deviating significantly from the other measurements and our calculations. It should be noted that the measurements of Edwards and Roseveare also deviate from the experimental consensus for other systems such as He–N2,72 N2–H2,73 as well as from the CO2–N2ab initio second virial coefficient calculations of Crusius et al.74 The performance of the calculations attests to the high accuracy of our 4D-PES and to the utility of the explicitly correlated method for mapping multidimensional PESs for these applications.
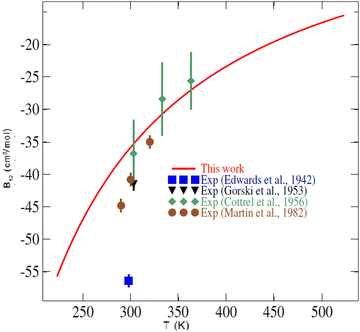 | ||
| Fig. 7 Temperature dependence of the second virial coefficient of the CO2–O2 mixture. The symbols are experimental values (Exp.) found in the literature.68–71 | ||
VI. Conclusion
The potential interaction energies of the CO2–O2 vdW complex were generated ab initio as a function of the distance between the centers of mass of CO2 and O2 and the angular coordinates at the UCCSD(T)-F12/CBS level. This 4D-PES is strongly anisotropic. In addition to the stationary points found previously, we locate three additional critical points. Their binding energies and geometrical parameters were determined. SAPT analysis shows that the system is dominated mostly by the interplay between dispersion and first-order exchange forces. The relative changes of the electrostatic interaction upon the orientations of CO2 and O2 molecules are quite pronounced, and they strongly contribute to the overall anisotropy of the potential in the minimum region. Overall, the agreement of SAPT and UCCSD(T)-F12 methods is reasonable. We also report the complexation induced shifts of the vibrational modes of the monomers and the second virial coefficient of the CO2–O2 mixture for which good agreement with recent available experimental determinations is observed, which validates this new 4D-PES. This confirms the well-established performance of explicitly correlated methods for the generation of multidimensional potential energy surfaces and for their accurate description of polyatomic–polyatomic weakly bound vdW interactions.7 These results extend our conclusions for previous polyatomic systems5,6,8,75 to larger molecular systems for thermophysical properties calculations, and demonstrate the high quality of our interaction potentials.Conflicts of interest
There are no conflicts to declare.Acknowledgements
This study was carried out while M. H. was Visiting Professor at Khalifa University (supported by the internal grant 8474000362-KU-FSU-2021). M. G. is partly supported by Khalifa University (grants 8474000336-KU-SPSC and 8474000362-KU-FSU-2021). N. E. K. is partly supported by Khalifa University (grants 8474000336-KU-SPSC and ASPIRE grant AARE20-031). R. D. and E. Q.-S. were supported by the U.S. Department of Energy (Award No. DE-SC0019740). B. M., P. Z. and F. B. acknowledge the National Science Center for support (Sonata Bis 9, Grant No. 2019/34/E/ST4/00407). We also acknowledge partial support from the Programme National “Physique et Chimie du Milieu Interstellaire” (PCMI) of CNRS/INSU with INC/INP co-funded by CEA and CNES.References
- K. Lodders and B. Fegley, Icarus, 2002, 155, 393 CrossRef CAS.
- K. Zahnle, M. S. Marley, R. S. Freedman, K. Lodders and J. J. Fortney, Astrophys. J. Lett., 2009, 701, L20–L24 CrossRef CAS.
- E.-M. Ahrer, et al., Nature, 2022 DOI:10.1038/s41586-022-05269-w.
- J. J. Spake, et al. , Mon. Not. R. Astron. Soc., 2021, 500, 4042 CrossRef CAS.
- Y. N. Kalugina, I. A. Buryak, Y. Ajili, A. A. Vigasin, N.-E. Jaidane and M. Hochlaf, J. Chem. Phys., 2014, 140, 234310 CrossRef PubMed.
- A. Badri, L. Shirkov, N.-E. Jaidane and M. Hochlaf, Phys. Chem. Chem. Phys., 2019, 21, 15871 RSC.
- M. Hochlaf, Phys. Chem. Chem. Phys., 2017, 19, 21236 RSC.
- M. Lara-Moreno, T. Stoecklin, P. Halvick and M. Hochlaf, Phys. Chem. Chem. Phys., 2019, 21, 3550 RSC; M. Lara-Moreno, T. Stoecklin, P. Halvick and M. Hochlaf, Erratum, Phys. Chem. Chem. Phys., 2021, 23, 10687 RSC.
- E. Roueff and F. Lique, Chem. Rev., 2013, 113, 8906 CrossRef CAS PubMed.
- F. Grein, Comput. Theor. Chem., 2017, 1114, 101 CrossRef CAS.
- K. Madajczyk, P. S. Żuchowski, F. Brzȩk, Ł. Rajchel, D. Kȩdziera, M. Modrzejewski and M. Hapka, J. Chem. Phys., 2021, 154, 134106 CrossRef CAS PubMed.
- S. H. Lee, N. Kim, T.-R. Kim, S. Shin and S. K. Kim, J. Phys. Chem. A, 2021, 125, 5794 CrossRef CAS PubMed.
- M. Bartolomei, M. I. Hernandez, J. Campos-Martinez, E. Carmona-Novillo and R. Hernandez-Lamoneda, Phys. Chem. Chem. Phys., 2008, 10, 5374 RSC.
- M. Bartolomei, E. Carmona-Novillo, M. I. Hernandez, J. Campos-Martinez and R. Moszynski, J. Phys. Chem. Lett., 2014, 5, 751 CrossRef CAS PubMed.
- S. R. Salmon and J. R. Lane, J. Chem. Phys., 2015, 143, 124303 CrossRef PubMed.
- H. Ran, Y. Zhou and D. Xie, J. Chem. Phys., 2017, 126, 204304 CrossRef PubMed.
- J. D. McMahon and J. R. Lane, J. Chem. Phys., 2011, 135, 154309 CrossRef PubMed.
- K. M. de Lange and J. R. Lane, J. Chem. Phys., 2011, 134, 034301 CrossRef PubMed.
- S. Nasri, Y. Ajili, N.-E. Jaidane, Y. N. Kalugina, P. Halvick, T. Stoecklin and M. Hochlaf, J. Chem. Phys., 2015, 142, 174301 CrossRef PubMed.
- S. Sheybani-Deloui, A. J. Barclay, K. H. Michaelian, A. R. W. McKellar and N. Moazzen-Ahmadi, J. Chem. Phys., 2015, 143, 121101 CrossRef CAS PubMed.
- L. Zheng, S.-Y. Lee, Y. Lu and M. Yang, J. Chem. Phys., 2013, 138, 044302 CrossRef PubMed.
- B. Jeziorski, R. Moszynski and K. Szalewicz, Chem. Rev., 1994, 94, 1887 CrossRef CAS.
- P. S. Żuchowski, R. Podeszwa, R. Moszyński, B. Jeziorski and K. Szalewicz, J. Chem. Phys., 2008, 129, 084101 CrossRef PubMed.
- M. Hapka, P. S. Żuchowski, M. M. Szczęśniak and G. Chałasiński, J. Chem. Phys., 2012, 137, 164104 CrossRef PubMed.
- C. Amiot and J. Verges, Can. J. Phys., 1981, 59, 1391 CrossRef CAS.
- G. Guelachvili, J. Mol. Spectrosc., 1980, 79, 72 CrossRef CAS.
- H. Li, P.-N. Roy and R. J. Le Roy, J. Chem. Phys., 2010, 132, 214309 CrossRef PubMed.
- G. Knizia and T. B. Adler, J. Chem. Phys., 2009, 130, 054104 CrossRef PubMed.
- K. A. Peterson, T. B. Adler and H.-J. Werner, J. Chem. Phys., 2008, 128, 084102 CrossRef PubMed.
- H. J. Werner, P. J. Knowles, G. Knizia, F. R. Manby and M. Schütz, Molpro: a generalpurpose quantum chemistry program package, Wiley Interdiscip. Rev.: Comput. Mol. Sci., 2012, 2, 242–253 CAS.
- D. Feller, K. A. Peterson and T. D. Crawford, J. Chem. Phys., 2006, 124, 054107 CrossRef PubMed.
- E. Castro-Juárez, X.-G. Wang, T. Carrington Jr, E. Quintas-Sánchez and R. Dawes, J. Chem. Phys., 2019, 151, 084307 CrossRef PubMed.
- B. Desrousseaux, E. Quintas-Sanchez, R. Dawes and F. Lique, J. Phys. Chem. A, 2019, 123, 9637 CrossRef CAS PubMed.
- C. T. Bop, F. A. Batista-Romero, A. Faure, E. Quintas-Sánchez, R. Dawes and F. Lique, ACS Earth Space Chem., 2019, 3, 1151 CrossRef CAS.
- E. Quintas-Sánchez, R. Dawes, X.-G. Wang and T. Carrington Jr, Phys. Chem. Chem. Phys., 2020, 22, 22674 RSC.
- B. Desrousseaux, E. Quintas-Sánchez, R. Dawes, S. Marinakis and F. Lique, J. Chem. Phys., 2021, 154, 034304 CrossRef CAS PubMed.
- M. Gancewski, H. Jóźwiak, E. Quintas-Sánchez, R. Dawes, F. Thibault and P. Wcisło, J. Chem. Phys., 2021, 155, 124307 CrossRef CAS PubMed.
- C. Balança, E. Quintas-Sánchez, R. Dawes, F. Dumouchel, F. Lique and N. Feautrier, Mon. Not. R. Astron. Soc., 2021, 508, 1148 CrossRef.
- E. Quintas-Sánchez, R. Dawes and O. Denis-Alpizar, Mol. Phys., 2021, 119, e1980234 CrossRef.
- E. Quintas-Sánchez and R. Dawes, J. Chem. Inf. Model., 2019, 59, 262 CrossRef PubMed.
- R. Dawes and E. Quintas-Sánchez, Reviews in Computational Chemistry, 2018, ch. 5, vol. 31, pp. 199–264 Search PubMed.
- M. Majumder, S. A. Ndengue and R. Dawes, Mol. Phys., 2016, 114, 1 CrossRef CAS.
- R. Dawes, X.-G. Wang, A. W. Jasper and T. Carrington Jr, J. Chem. Phys., 2010, 133, 134304 CrossRef PubMed.
- I. M. Sobol, USSR Comput. Math. Math. Phys., 1976, 16, 236 CrossRef.
- J. Brown, X.-G. Wang, R. Dawes and T. Carrington Jr, J. Chem. Phys., 2012, 136, 134306 CrossRef PubMed.
- R. Dawes, X.-G. Wang and T. Carrington Jr, J. Phys. Chem. A, 2013, 117, 7612 CrossRef CAS PubMed.
- X.-G. Wang, T. Carrington Jr and R. Dawes, J. Mol. Spectrosc., 2016, 330, 179 CrossRef CAS.
- J. Brown, X.-G. Wang, T. Carrington Jr, G. S. Grubbs and R. Dawes, J. Chem. Phys., 2014, 140, 114303 CrossRef PubMed.
- H. Cybulski, C. Henriksen, R. Dawes, X.-G. Wang, N. Bora, G. Avila, T. Carrington Jr and B. Fernández, Phys. Chem. Chem. Phys., 2018, 20, 12624 RSC.
- R. Dawes, X.-G. Wang, A. W. Jasper and T. Carrington Jr, J. Chem. Phys., 2010, 133, 134304 CrossRef PubMed.
- G. Donoghue, X.-G. Wang, R. Dawes and T. Carrington Jr, J. Mol. Spectrosc., 2016, 330, 170 CrossRef CAS.
- K. M. Walker, F. Dumouchel, F. Lique and R. Dawes, J. Chem. Phys., 2016, 145, 024314 CrossRef PubMed.
- C. T. Bop, F. A. Batista-Romero, A. Faure, E. Quintas-Sánchez, R. Dawes and F. Lique, ACS Earth Space Chem., 2019, 3, 1151 CrossRef CAS.
- A. Barclay, A. McKellar, N. Moazzen-Ahmadi, R. Dawes, X.-G. Wang and T. Carrington Jr, Phys. Chem. Chem. Phys., 2018, 20, 14431 RSC.
- M. Bartolomei, E. Carmona-Novillo, M. I. Hernandez, J. Campos-Martinez and R. J. Moszynski, J. Phys. Chem. A, 2014, 118, 6584 CrossRef CAS PubMed.
- M. Bartolomei, E. Carmona-Novillo, M. I. Hernández, J. Campos-Martínez and R. Hernández-Lamoneda, J. Chem. Phys., 2010, 133, 124311 CrossRef PubMed.
- P. S. Żuchowski, Chem. Phys. Lett., 2008, 450, 203 CrossRef.
- Y. Ajili, T. Trabelsi, O. Denis-Alpizar, T. Stoecklin, A. G. Csaszar, M. Mogren Al-Mogren, J. S. Francisco and M. Hochlaf, Phys. Rev. A, 2016, 93, 052514 CrossRef.
- H. Ran, Y. Zhou and D. Xie, J. Chem. Phys., 2007, 126, 204304 CrossRef PubMed.
- D. G. A. Smith, et al. , J. Chem. Theory Comput., 2018, 14, 3504 CrossRef CAS PubMed.
- J. F. Gonthier and D. C. Sherrill, J. Chem. Phys., 2016, 145, 134106 CrossRef PubMed.
- A. J. Misquitta, R. Podeszwa, B. Jeziorski and K. Szalewicz, J. Chem. Phys., 2005, 123, 214103 CrossRef PubMed.
- P. S. Żuchowski, B. Bussery-Honvault, R. Moszynski and B. Jeziorski, J. Chem. Phys., 2003, 119, 10497 CrossRef.
- T. H. Dunning, J. Chem. Phys., 1989, 90, 1007 CrossRef CAS.
- R. A. Kendall, T. H. Dunning and R. J. Harrison, J. Chem. Phys., 1992, 96, 6796 CrossRef CAS.
- K. P. Huber and G. Herzberg, Molecular Spectra and Molecular Structure, Constants of Diatomic Molecules, Van Nostrand Reinhold, Wokingham, 1979, vol. IV Search PubMed.
- G. Herzberg, Molecular Spectra and Molecular Structure, Electronic Spectra and Electronic Structure of Polyatomic Molecules, Van Nostrand, Princeton, NJ, 1966, vol. III Search PubMed.
- A. E. Edwards and W. E. Roseveare, J. Am. Chem. Soc., 1942, 64, 2816 CrossRef CAS.
- R. A. Gorski and J. G. Miller, J. Am. Chem. Soc., 1953, 75, 550 CrossRef CAS.
- T. L. Cottrell, R. A. Hamilton and R. P. Taubinger, Trans. Faraday Soc., 1956, 52, 1310 RSC.
- M. L. Martin, R. D. Trengove, K. R. Harris and P. J. Dunlop, Aust. J. Chem., 1982, 35, 1525 CrossRef CAS.
- B. Schramm and A. Buchner, Chem. Phys. Lett., 1983, 98, 118 CrossRef CAS.
- M. Jaeschke, H.-M. Hinze, H. J. Achtermann and G. Magnus, Fluid Phase Equilib., 1991, 62, 115 CrossRef CAS.
- J.-P. Crusius, R. Hellmann, J. C. Castro-Palacio and V. Vesovic, J. Chem. Phys., 2018, 148, 214306 CrossRef PubMed.
- Y. Ajili, K. Hammami, N. E. Jaidane, M. Lanza, Y. N. Kalugina, F. Lique and M. Hochlaf, Phys. Chem. Chem. Phys., 2013, 15, 10062 RSC.
Footnote |
| † Electronic supplementary information (ESI) available. See DOI: https://doi.org/10.1039/d2cp04101d |
| This journal is © the Owner Societies 2022 |

![[thin space (1/6-em)]](https://www.rsc.org/images/entities/char_2009.gif) stretch
stretch
