
 Open Access Article
 This Open Access Article is licensed under a Creative Commons Attribution-Non Commercial 3.0 Unported Licence
Impact of solvent interactions on 1H and 13C chemical shifts investigated using DFT and a reference dataset recorded in CDCl3 and CCl4†
Thomas
Stadelmann
 ,
Chantal
Balmer
,
Sereina
Riniker
* and
Marc-Olivier
Ebert
*
,
Chantal
Balmer
,
Sereina
Riniker
* and
Marc-Olivier
Ebert
*
Department of Chemistry and Applied Biosciences, ETH Zürich, Vladimir-Prelog-Weg 1-5, 8093 Zürich, Switzerland. E-mail: sriniker@ethz.ch; marc-olivier.ebert@org.chem.ethz.ch
First published on 14th September 2022
Abstract
1H and 13C chemical shifts of 35 small, rigid molecules were measured under standardized conditions in chloroform-d and in tetrachloromethane. The solvent change mainly affects carbon shifts of polar functional groups. This difference due to specific interactions with CDCl3 cannot be adequately reproduced by DFT calculations in implicit solvent. The new dataset provides an accurate basis for the validation and calibration of shift calculations, especially with respect to improved solvent models.
Introduction
Structure elucidation by NMR and the determination of relative configuration are often assisted by comparison of experimental chemical shifts with shifts calculated using density functional theory (DFT).1 With advances in computational resources and quantum chemical software, shielding constants can be obtained on a routine basis.2 For comparison with experimental data, the shieldings (σcalc) have to be converted into chemical shifts (δcalc). Most simply, this is done using the shielding of tetramethylsilane (TMS), calculated at the same level of theory:| δcalci = σcalcTMS − σcalci | (1) |
Instead of TMS, any chemical shift determined with respect to TMS can be used as reference, if the corresponding shielding calculation has been carried out at the same level of theory:
| δcalci = δexpref + σcalcref − σcalci | (2) |
To compensate for shortcomings of the theoretical method in specific electronic environments, one can also employ multiple standards for different types of carbons (e.g. based on hybridization).3 In organic chemistry, the most popular way to convert shieldings into chemical shifts is to use a large set of reference data and perform a linear regression between calculated shieldings and experimental shifts:
 | (3) |
If the calculation reproduced all shieldings perfectly, a slope of −1 would be obtained with the intercept being equivalent to σcalcTMS. Chemical shifts are very sensitive to the chemical environment. They also depend on temperature, solute concentration,4,5 protonation state and the presence of impurities.6 Therefore, control over the conditions at which the reference shifts are recorded is important for a consistent dataset. A popular reference set is the one from Tantillo et al.,7 which consists of 1H and 13C shifts of 80 small and relatively rigid organic molecules. Scaling factors for numerous functional/basis set combinations can be found on the authors’ webpage.8 The chemical shifts, however, were collected from different sources and experimental conditions (i.e. temperature, concentration, and purity) are not indicated. In addition, the dataset contains multiple chlorinated compounds whose 13C chemical shifts are affected by relativistic effects that cannot be accounted for by standard DFT. Hehre et al.9 used a reference set of 2000 molecules to derive an elaborate empirical correction scheme for 13C chemical shifts calculated at the inexpensive ωB97X-D/6-31G* level of theory. Also here, no special attention was paid to solvent and concentration effects or standardized experimental conditions.
Given a high-quality reference set, there are different types of errors and approximations that impact the quality and reliability of the resulting shift prediction. One source of error is the chosen DFT method itself (functional and incomplete basis set). It is possible to go beyond DFT and perform e.g. a coupled-cluster calculation for improved accuracy, but such calculations are computationally extremely expensive and only feasible for very small systems. Numerous studies attempted to determine the best combination of functional and basis set for chemical shift calculations.7,10–13 Presumably, some combinations are only better than others due to fortunate error compensation. In terms of the applied level of theory, a good compromise between accuracy and computational cost are double-hybrid functionals, giving mean absolute relative errors as low as 1.9% for the calculated shieldings compared to coupled-cluster calculations.14 Another potential source of error when comparing calculated shieldings with experimental chemical shifts are specific intermolecular interactions with impurities like water or the solvent itself (e.g. via hydrogen bonds), which are not trivial to account for in DFT calculations.15–17 Also vibrational contributions to the chemical shift are usually neglected.
Experimental section
NMR measurements
The molecules included in the dataset are a selection of small, rigid organic compounds containing different functional groups and consisting of only H, C, N and O atoms. For each compound 10 mM solutions were prepared in chloroform-d (Apollo Scientific) and carbon tetrachloride (Sigma-Aldrich). Chloroform was previously filtered through a short column of aluminium oxide (EcoChrom, MP Alumina N, Akt. I) and stored over molecular sieve (3 Å, Dr Bender & Dr Hobein AG) in the fridge. TMS was added as internal standard. NMR spectra were recorded on a Bruker AVANCE III 600 MHz spectrometer equipped with a helium-cooled DCH cryogenic probe with z-gradients at 25.0 °C. For each compound, a 1H (32 scans, sw 16.0 ppm, td 96![[thin space (1/6-em)]](https://www.rsc.org/images/entities/char_2009.gif) 152, o1p 6.0 ppm, aq 5 s, d1 0.01 s) and a 13C spectrum (512 scans, sw 248.5 ppm, td 157890, o1p 110 ppm, aq 2.1 s, d1 0.3 s) were recorded. The samples in tetrachloromethane were shimmed via the proton signal of TMS using the following TopSpin command:
152, o1p 6.0 ppm, aq 5 s, d1 0.01 s) and a 13C spectrum (512 scans, sw 248.5 ppm, td 157890, o1p 110 ppm, aq 2.1 s, d1 0.3 s) were recorded. The samples in tetrachloromethane were shimmed via the proton signal of TMS using the following TopSpin command:| topshim 1h rga lockoff o1p = 0.2 selwid = 0.5 durmax = 120 |
If peaks could not be assigned unambiguously, 13C-HSQC, 13C-HMBC, DQF-COSY, NOESY and PSYCHE18 spectra were recorded as needed. Processing of the spectra was done with Bruker TopSpin™ version 4.1 (Bruker Biospin AG) and MestreNova 14.1 (Mestrelab Research). A line broadening of 0.1 Hz for 1H and 0.5 Hz for 13C spectra was used. The data points were extended by zero-filling to 64k data points for 1H spectra and to 256k data points for 13C spectra.
All spectra were referenced to the signal of internal TMS set to 0 ppm in both solvents.  , the susceptibility corrected chemical shift of TMS in CCl4 referenced to external TMS in CDCl3 was calculated using eqn (4).19
 | (4) |
 is the externally referenced chemical shift of TMS in CCl4,
 ![[small alpha, Greek, macron]](https://www.rsc.org/images/entities/i_char_e0c2.gif) is a shape factor assumed to be 0.007,19 and κ and κref are the volume magnetic susceptibilities of CCl4 (−0.690) and CDCl3 (−0.735),20 respectively. On a Bruker spectrometer
is a shape factor assumed to be 0.007,19 and κ and κref are the volume magnetic susceptibilities of CCl4 (−0.690) and CDCl3 (−0.735),20 respectively. On a Bruker spectrometer  can be obtained as follows: the spectrum of a dilute sample of TMS in CDCl3 is recorded and the TMS signal is set to 0 ppm. The sample is exchanged with a dilute sample of TMS in CCl4, and a second spectrum is recorded with the values of SR and FIELD kept fixed. The chemical shift of the TMS signal in the second spectrum corresponds to
  . At 25 °C,
  was determined to be 0.21 ppm for 1H and 0.47 ppm for 13C (see Fig. S4 in the ESI†). Eqn (4) yielded values for
  of 0.02 ppm (1H) and 0.28 ppm (13C).
Assigned NMR spectra in CDCl3 and CCl4 for compounds 1–35 are provided in the NMReData21 format as well as in separate MestreNova files together with the DFT optimized coordinates in vacuum. The data can be downloaded free of charge from https://doi.org/10.3929/ethz-b-000570841.
Computational details
Analysis of the data was done in a Jupyter Notebook39 using Python 3.9.12.40 The functionalities of the matplotlib 3.5.1,41 nglview 3.0.3,42 numpy 1.21.6,43 openbabel 3.1.1,44 and scipy 1.5.345 packages were used. DFT calculations were performed on the Euler cluster at ETH Zürich.
Results and discussion
In this study, we focus on solute–solvent interactions and how well these can be reproduced by DFT calculations with implicit solvent models. For this purpose, we measured a set of 1H and 13C chemical shifts in two solvents, chloroform-d (CDCl3) and tetrachloromethane (CCl4). Although both can be considered apolar solvents, the solute–solvent interactions are stronger in CDCl3 because CCl4 cannot act as hydrogen-bond donor. This pair of solvents thus allows us to assess the impact of solute–solvent interactions on chemical shifts without solubility issues and very strong interactions. 1H and 13C chemical shifts were measured in both solvents for a set of 35 small and rigid organic molecules, consisting only of H, C, N, and O atoms (Chart 1). The dataset was recorded under standardized conditions, referenced to internal TMS, and all chemical shifts were reassigned to eliminate potential incorrect assignments (see Experimental section). To make these measurements as reproducible as possible and to reduce unwanted intermolecular interactions between solute molecules as well as between solute and impurities, a concentration of 10 mM was chosen for all compounds with a maximum allowed impurity concentration (including water) of <2 mM. The temperature during the experiments was kept constant at 25.0 °C. | ||
| Chart 1 Chemical structures of the molecules in the dataset. Carbons are numbered according to their appearance in the coordinate files with identical labels for magnetically equivalent nuclei. Red dots: carbons with a difference in 13C chemical shift larger than 1 ppm between CDCl3 and CCl4. Blue circles: protons with a difference in 1H chemical shift larger than 0.1 ppm between CDCl3 and CCl4. | ||
After averaging magnetically equivalent nuclei, 141 1H and 170 13C chemical shifts were obtained for the 35 molecules and unambiguously assigned in CDCl3 (Table 1) and CCl4 (Table 2). Exchangeable protons are listed but were not included in this study. First, we compared the chemical shifts in CDCl3 with previously published data in the literature. Then, we investigated the chemical shift differences between the two solvents, followed by a detailed comparison with DFT calculated values.
| Compound | 1 | 2 | 3 | 4 | 5 | 6 | 7 | 8 | 9 | 10 | 11 |
|---|---|---|---|---|---|---|---|---|---|---|---|
| a First value corresponds to cis-configured 1H. b First value corresponds to 1H on the same side as the nitrile group. c Exchangeable proton. d First value corresponds to proR 1H. e First value corresponds to axial 1H. | |||||||||||
| 1 | 4.33 | ||||||||||
| 62.5 | |||||||||||
| 2 | 1.59 | 4.42 | |||||||||
| 12.3 | 70.5 | ||||||||||
| 3 | 1.30 | 2.36 | |||||||||
| 10.5 | 10.9 | 120.7 | |||||||||
| 4 | 2.03 | 6.87 | 6.15 | 9.50 | |||||||
| 18.7 | 153.9 | 134.7 | 193.9 | ||||||||
| 5 | 1.33 | 2.70 | |||||||||
| 20.0 | 19.8 | 123.8 | |||||||||
| 6 | 4.83/4.92a | 5.85 | 1.01 | ||||||||
| 108.9 | 149.9 | 33.7 | 29.2 | ||||||||
| 7 | 2.88 | 3.81 | |||||||||
| 74.8 | 74.5 | 153.1 | 53.0 | ||||||||
| 8 | 1.34 | 1.08/1.01b | |||||||||
| 122.2 | −3.5 | 7.1 | |||||||||
| 9 | 2.50 | 2.27 | 4.35 | ||||||||
| 177.6 | 27.8 | 22.2 | 68.5 | ||||||||
| 10 | 3.87 | 4.25 | 2.50 | ||||||||
| 215.0 | 70.6 | 66.9 | 37.1 | ||||||||
| 11 | 1.98 | 3.82 | 4.23 | ||||||||
| 13.8 | 165.5 | 54.6 | 67.4 | ||||||||
| 12 | 7.03 | ||||||||||
| 164.1 | 136.5 | ||||||||||
| 13 | 3.78 | ||||||||||
| 67.1 | |||||||||||
| 14 | 2.50 | 3.98 | |||||||||
| 206.5 | 42.9 | 67.9 | |||||||||
| 15 | 8.24 | 7.56 | 7.70 | ||||||||
| 148.2 | 123.2 | 129.3 | 134.6 | ||||||||
| 16 | 4.61c | 6.83 | 7.25 | 6.94 | |||||||
| 155.4 | 115.3 | ||||||||||
| 17 | 3.81 | 6.91 | 7.30 | 6.95 | |||||||
| 55.1 | 159.6 | 113.9 | 129.5 | 120.7 | |||||||
| 18 | 10.03 | 7.89 | 7.54 | 7.64 | |||||||
| 192.4 | 136.4 | 129.8 | 129.0 | 134.5 | |||||||
| 19 | 7.67 | 7.48 | 7.61 | ||||||||
| 118.9 | 112.5 | 132.2 | 129.1 | 132.8 | |||||||
| 20 | 3.00 | 6.49 | 8.23 | ||||||||
| 39.0 | 154.2 | 106.6 | 149.9 | ||||||||
| 21 | 9.25 | 8.76 | 7.34 | ||||||||
| 159.1 | 156.9 | 121.6 | |||||||||
| 22 | 6.05 | 2.24 | |||||||||
| 180.2 | 113.8 | 165.4 | 19.8 | ||||||||
| 23 | 2.85 | 1.31/1.08d | 5.99 | 0.95/1.61e | |||||||
| 41.7 | 48.5 | 135.4 | 24.6 | ||||||||
| 24 | 2.60 | 1.53/1.82d | 1.80/1.44d | 2.66 | 1.55/1.73d | 2.05/1.84d | |||||
| 218.3 | 49.9 | 24.2 | 27.2 | 35.3 | 37.7 | 45.3 | |||||
| 25 | 1.03 | 1.03 | 2.14 | 1.53/1.79d | 1.71/1.79d | 1.39/1.56d | 1.14 | ||||
| 23.4 | 47.4 | 21.7 | 45.4 | 41.7 | 25.0 | 31.9 | 54.2 | 14.6 | 223.4 | ||
| 26 | 5.88 | 2.17 | 1.04 | 2.20 | 1.94 | ||||||
| 199.9 | 125.6 | 160.3 | 45.3 | 33.6 | 28.3 | 50.8 | 24.6 | ||||
| 27 | 10.10 | 8.00 | 7.85 | ||||||||
| 190.6 | 138.8 | 129.9 | 132.9 | 117.7 | 117.7 | ||||||
| 28 | 2.58 | 6.90 | 2.32 | 10.57 | |||||||
| 20.5 | 141.5 | 130.5 | 143.8 | 21.5 | 130.0 | 193.0 | |||||
| 29 | 0.91 | 2.35/1.85d | 2.09 | 0.84 | 0.96 | 1.95/1.34d | 1.68/1.41d | ||||
| 9.3 | 57.7 | 219.7 | 43.3 | 43.1 | 46.8 | 19.8 | 19.2 | 27.1 | 29.9 | ||
| 30 | 8.14c | 7.22 | 6.56 | 7.41 | 7.20 | 7.12 | 7.65 | ||||
| 127.9 | 135.8 | 124.1 | 102.7 | 111.0 | 122.0 | 119.8 | 120.7 | ||||
| 31 | 1.88 | 1.75 | |||||||||
| 28.3 | 37.8 | ||||||||||
| 32 | 3.22 | 5.49 | 5.49 | 1.68/2.18d | 2.73 | 2.88 | 5.98 | 5.94 | 2.78 | 1.30/1.48d | |
| 54.8 | 132.0 | 132.1 | 34.7 | 41.2 | 46.2 | 132.4 | 136.0 | 45.2 | 50.4 | ||
| 33 | 2.70 | 8.00 | 7.52 | 7.48 | 7.85 | 7.71 | 7.37 | 7.32 | |||
| 19.4 | 134.3 | 132.6 | 124.1 | 125.7 | 125.5 | 128.5 | 133.5 | 126.4 | 125.6 | 126.6 | |
| 34 | 7.66 | 7.30 | 7.49 | 7.53 | |||||||
| 193.9 | 134.2 | 144.5 | 124.4 | 129.1 | 134.7 | 120.3 | |||||
| 35 | 8.01 | 7.46 | 8.43 | ||||||||
| 131.7 | 128.2 | 125.3 | 126.2 | ||||||||
| Compound | 1 | 2 | 3 | 4 | 5 | 6 | 7 | 8 | 9 | 10 | 11 |
|---|---|---|---|---|---|---|---|---|---|---|---|
| a First value corresponds to cis-configured 1H. b First value corresponds to 1H on the same side as the nitrile group. c Exchangeable proton. d First value corresponds to proR 1H. e First value corresponds to axial 1H. | |||||||||||
| 1 | 4.27 | ||||||||||
| 61.6 | |||||||||||
| 2 | 1.59 | 4.34 | |||||||||
| 12.0 | 69.5 | ||||||||||
| 3 | 1.32 | 2.29 | |||||||||
| 10.4 | 10.5 | 118.1 | |||||||||
| 4 | 2.03 | 6.72 | 6.07 | 9.43 | |||||||
| 18.1 | 149.9 | 134.9 | 190.3 | ||||||||
| 5 | 1.34 | 2.62 | |||||||||
| 19.9 | 19.4 | 121.3 | |||||||||
| 6 | 4.78/4.86a | 5.77 | 1.01 | ||||||||
| 109.0 | 149.0 | 33.4 | 29.1 | ||||||||
| 7 | 2.72 | 3.76 | |||||||||
| 73.4 | 74.6 | 151.6 | 51.9 | ||||||||
| 8 | 1.27 | 1.07/0.96b | |||||||||
| 120.1 | −3.1 | 6.9 | |||||||||
| 9 | 2.36 | 2.22 | 4.25 | ||||||||
| 173.7 | 27.0 | 22.0 | 66.7 | ||||||||
| 10 | 3.73 | 4.16 | 2.39 | ||||||||
| 211.2 | 69.7 | 66.0 | 36.4 | ||||||||
| 11 | 1.88 | 3.70 | 4.11 | ||||||||
| 13.2 | 163.4 | 54.4 | 66.5 | ||||||||
| 12 | 6.96 | ||||||||||
| 162.7 | 135.7 | ||||||||||
| 13 | 3.57 | ||||||||||
| 66.5 | |||||||||||
| 14 | 2.39 | 3.89 | |||||||||
| 202.1 | 42.5 | 67.3 | |||||||||
| 15 | 8.23 | 7.53 | 7.64 | ||||||||
| 148.3 | 123.2 | 128.7 | 133.4 | ||||||||
| 16 | 4.27c | 6.70 | 7.14 | 6.82 | |||||||
| 155.2 | 114.9 | ||||||||||
| 17 | 3.76 | 6.78 | 7.17 | 6.83 | |||||||
| 54.3 | 159.2 | 113.4 | 128.9 | 120.2 | |||||||
| 18 | 9.97 | 7.83 | 7.49 | 7.56 | |||||||
| 189.3 | 136.6 | 129.2 | 128.5 | 133.4 | |||||||
| 19 | 7.63 | 7.45 | 7.55 | ||||||||
| 117.0 | 113.5 | 131.7 | 128.6 | 131.7 | |||||||
| 20 | 2.99 | 6.37 | 8.08 | ||||||||
| 38.8 | 153.4 | 106.1 | 149.5 | ||||||||
| 21 | 9.11 | 8.65 | 7.23 | ||||||||
| 158.9 | 156.0 | 120.7 | |||||||||
| 22 | 5.85 | 2.20 | |||||||||
| 176.7 | 113.8 | 162.9 | 19.3 | ||||||||
| 23 | 2.83 | 1.31/1.06d | 5.92 | 0.95/1.59e | |||||||
| 41.4 | 48.3 | 135.0 | 24.4 | ||||||||
| 24 | 2.50 | 1.54/1.77d | 1.77/1.44d | 2.63 | 1.50/1.70d | 1.96/1.74d | |||||
| 212.4 | 48.8 | 23.8 | 27.2 | 35.0 | 37.3 | 44.5 | |||||
| 25 | 1.00 | 0.99 | 2.09 | 1.47/1.75d | 1.68/1.79d | 1.37/1.50d | 1.10 | ||||
| 23.3 | 46.7 | 21.6 | 45.1 | 41.4 | 24.9 | 31.4 | 53.4 | 14.6 | 218.5 | ||
| 26 | 5.75 | 2.10 | 1.03 | 2.07 | 1.91 | ||||||
| 195.5 | 125.8 | 155.7 | 45.1 | 33.2 | 28.3 | 50.3 | 24.1 | ||||
| 27 | 10.05 | 7.96 | 7.82 | ||||||||
| 188.0 | 138.5 | 129.3 | 132.3 | 118.0 | 116.2 | ||||||
| 28 | 2.56 | 6.81 | 2.30 | 10.50 | |||||||
| 20.7 | 141.1 | 130.6 | 142.6 | 21.7 | 130.5 | 190.5 | |||||
| 29 | 0.86 | 2.25/1.75d | 2.03 | 0.83 | 0.95 | 1.93/1.34d | 1.62/1.39d | ||||
| 9.2 | 56.8 | 214.3 | 42.6 | 42.9 | 46.3 | 19.7 | 19.1 | 27.1 | 29.5 | ||
| 30 | 7.91c | 7.08 | 6.44 | 7.25 | 7.06 | 6.99 | 7.50 | ||||
| 127.6 | 135.5 | 122.8 | 102.9 | 110.3 | 121.7 | 119.6 | 120.5 | ||||
| 31 | 1.88 | 1.75 | |||||||||
| 28.0 | 37.5 | ||||||||||
| 32 | 3.17 | 5.40 | 5.40 | 1.59/2.14d | 2.69 | 2.84 | 5.89 | 5.84 | 2.75 | 1.28/1.47d | |
| 54.5 | 131.5 | 131.7 | 34.7 | 41.0 | 45.9 | 131.9 | 135.7 | 44.9 | 50.1 | ||
| 33 | 2.68 | 7.90 | 7.42 | 7.39 | 7.74 | 7.60 | 7.27 | 7.22 | |||
| 19.2 | 133.3 | 132.4 | 123.6 | 125.2 | 125.0 | 128.2 | 133.4 | 126.2 | 125.0 | 126.1 | |
| 34 | 7.62 | 7.26 | 7.42 | 7.48 | |||||||
| 191.2 | 134.2 | 144.0 | 124.1 | 128.6 | 133.6 | 119.6 | |||||
| 35 | 7.92 | 7.38 | 8.34 | ||||||||
| 131.5 | 127.9 | 124.8 | 125.9 | ||||||||
Comparison with experimental shifts in CDCl3 from the literature
The chemical shifts measured in this study can be considered a highly homogeneous dataset, which presents a unique opportunity to assess the effect of variations in the experimental protocol by comparing to literature values from different sources. Also varying water content, although naturally limited in chloroform, may still impact the measured shifts. Fig. 1 shows a comparison between our 1H and 13C chemical shifts in CDCl3 and collected literature values (references given in the ESI†). A good agreement is observed, indicating that the effects of concentration, water content, other impurities, or slight variations in temperature are relatively small for the studied molecules in CDCl3. Along with these effects, also proper referencing of the spectra and potential typos might be responsible for some of the variability. If we classify our data according to their association with a functional group, the largest deviations for the 13C chemical shifts were found for carbonyl carbons (RMSD of 0.43 ppm), which apparently are most affected by changes in sample or experiment conditions. The largest individual deviation from the values in our 13C dataset likely stems from a change in protonation state (see Table S1 in the ESI†).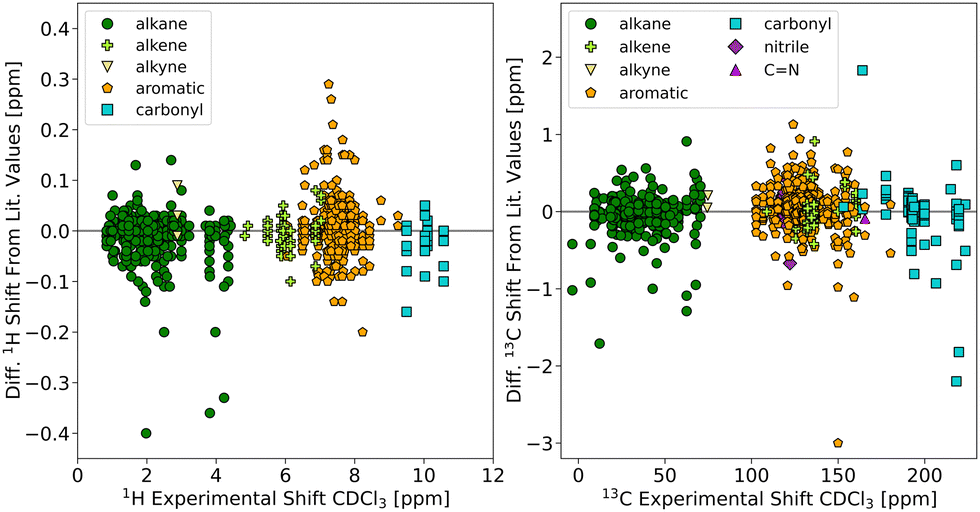 | ||
| Fig. 1 Comparison of experimental 1H (left) and 13C (right) chemical shifts in CDCl3 (this study) to literature values from various sources. A positive difference indicates that the literature value is larger. | ||
While our shift data in CDCl3 and the literature values do not differ much on average, the spread for some of the datapoints is still as high or higher as the accuracy one would like to achieve in a chemical shift calculation by DFT (≤1 ppm for 13C and ≤0.1 ppm for 1H). Thus, the observed differences are still too large for the validation of computational approaches. Especially for the study of solute–solvent interactions or other weak effects, the use of compiled literature values is not optimal since their influence on the chemical shifts is expected to be on the same order of magnitude as the spread in experimental values. The homogeneous sets of chemical shifts measured in this study will therefore serve as valuable reference to both validate in silico methods and to investigate the influence of specific solvation effects.
Comparison of experimental shifts recorded in CDCl3 and CCl4
In general, one would expect that polar groups (i.e. carbons of carbonyls, nitriles, and other H-bond acceptors) exhibit the largest changes in chemical shift between CCl4 and CDCl3, which is a (weak) H-bond donor. Fig. 2 shows the chemical shift differences between CDCl3 and CCl4 (for evaluation metrics see Table S2 in the ESI†). For the 13C chemical shifts, a clear trend can be observed that correlates with the polarity of the functional groups. The largest difference is found for carbonyl carbons (cyan squares, RMSD of 3.82 ppm), followed by the nitrile carbons (violet diamonds, RMSD of 2.13 ppm), while the 13C chemical shifts of the sp3 carbons are similar in both solvents (green circles, RMSD of 0.54 ppm). An illustrative example is given for 26 in Fig. S1 in the ESI. † No such functional group associated trend was found for the 1H shifts, although a general shift with a RMSD of 0.08 ppm is observed when going from CDCl3 to CCl4.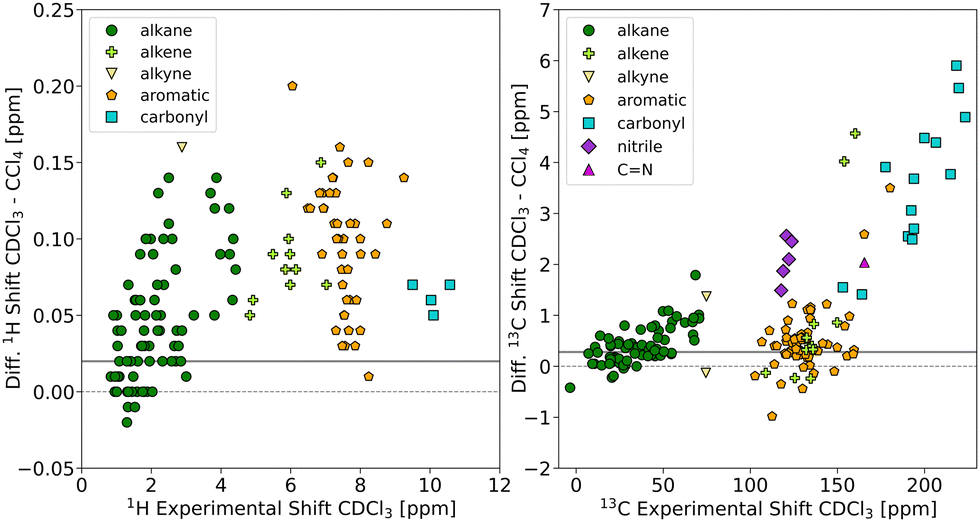 | ||
Fig. 2 Comparison of experimental 1H (left) and 13C (right) chemical shifts measured under standardized conditions in CDCl3 and CCl4. The data points are colour and symbol coded with respect to the functional group of the carbon atom. The solid grey horizontal lines indicate  , the susceptibility corrected chemical shift of TMS in CCl4 referenced to external TMS in CDCl3 (see main text). , the susceptibility corrected chemical shift of TMS in CCl4 referenced to external TMS in CDCl3 (see main text). | ||
To a minor extent, the change in chemical shift of TMS itself should also influence the observed chemical shift differences. We have experimentally determined this contribution which corresponds to the susceptibility corrected chemical shift of TMS in CCl4 referenced to external TMS in CDCl3 . In Fig. 2,
  is indicated as horizontal line. Chemical shifts of positions that are only marginally affected by the solvent change should symmetrically scatter around this line. For the majority of the sp3-positions this is indeed the case.
To visualize in more detail which nuclei experience the largest solvent-induced change in chemical shift, we selected all 13C and 1H chemical shifts which differ between the two solvents by more than 1.0 and 0.1 ppm, respectively (see Chart 1). For 13C, the marked nuclei agree with positions where – according to the general concepts used in organic chemistry – one would expect the largest change in partial charge upon protonation or interaction with a H-bond donor. Again, the trend is less clear for 1H resonances.
Overall, inspection of the two datasets confirms that there is a clear effect of specific solvent–solute interactions on the chemical shifts – even for these relatively apolar solvents –, which is important to consider when comparing them with computed values.
Comparison of experimental shifts with vacuum DFT calculations
DFT calculations of chemical shifts have traditionally been performed in vacuum. To assess how large the effect of the vacuum condition is, we compared the experimental values with DFT calculations carried out in vacuum using the gauge invariant atomic orbital (GIAO)46 approach in Orca 5.0.124 with either the hybrid GGA functional PBE047 with the cc-pVTZ basis set33 (called PBE0 in the following) or the 2013 version of the double-hybrid functional PBEP8635 together with the pcSseg-3 basis set36 (called PBEP86 in the following). Both methods have been shown in the past to perform well in the calculation of chemical shifts.14,48 Geometries were generated using RDKit22 and were optimized at the BP86/def2-tzvp25–27 level of theory. As the solute–solvent interactions are weaker in CCl4 than in CDCl3, we expect the vacuum condition in the calculations to be more appropriate for the former solvent. Table 3 gives the RMSD values when comparing vacuum chemical shifts calculated using eqn (3) with experimental values in CDCl3 or CCl4. The graphical comparisons are provided in Fig. S5 and S6 in the ESI.†| DFT method | Exp. solvent | 1H | 13C | ||||
|---|---|---|---|---|---|---|---|
| All | sp2 | sp3 | All | sp2 | sp3 | ||
| PBE0 | CCl4 | 0.11 | 0.10 | 0.09 | 1.37 (1.27) | 1.47 (1.27) | 1.05 (1.04) |
| PBEP86 | CCl4 | 0.11 | 0.11 | 0.09 | 1.27 (1.05) | 1.27 (0.86) | 0.91 (0.88) |
| PBE0 | CDCl3 | 0.12 | 0.11 | 0.10 | 1.50 (1.27) | 1.69 (1.32) | 1.12 (1.08) |
| PBEP86 | CDCl3 | 0.12 | 0.11 | 0.10 | 1.78 (1.09) | 1.75 (1.06) | 0.97 (0.91) |
For the 1H shifts, only a very small change in RMSD (0.01 ppm) is observed when comparing to CDCl3 or CCl4 data. This might seem surprising as the experimental 1H chemical shifts in the two solvents differed by a RMSD of 0.08 ppm. However, some of the offset between the two datasets can be compensated by changing the intercept in the linear regression (eqn (3)) without a significant increase in RMSD.
A large part of the potential shortcomings of the vacuum calculations can be masked by this mechanism. For the 13C chemical shifts, on the other hand, a clear increase in the deviation from experiment (0.13–0.51 ppm) can be seen when going from CCl4 to CDCl3 data. The sp2 carbons are thereby more affected than the sp3 carbons (as expected from the results in Fig. 2). Again, the differences are not of the order of magnitude expected from the experimental comparison (RMSD of 1.40 ppm, see Table S2 in the ESI†). But here, the compensation by the regression procedure is not as efficient as for 1H. Part of the reason for this might be that the differences in experimental 13C shifts between the two solvents systematically increase towards lower field. This is not the case for the 1H shifts. The effect of the functional (PBE0 or PBEP86) is negligible for the 1H shifts as also noted recently by Oliveira et al.49 For 13C, PBEP86 performs better than PBE0 for the values recorded in CCl4 and worse for the values recorded in CDCl3. Mean absolute deviations (MAD) and maximum absolute deviations (max. AD) are given in Tables S3 and S4 (ESI†). Exchanging the basis sets (using PBE0/pcSseg-3 and PBEP86/cc-pVTZ) shows that PBE0 profits only marginally from the larger basis set. For PBEP86/cc-pVTZ, the 13C RMSD increases slightly by ca. 0.1 ppm (Table S31, ESI†).
To assess the baseline error of the DFT method, independent of the solvent, we can focus the analysis only on the 13C nuclei that showed no or a very small solvent effect in experiment (nuclei without mark in Chart 1, 135 13C shifts). Table 3 shows that for this reduced set the deviation between calculation and experiment becomes similar for the two solvents, indicating a baseline error for PBEP86 of ca. 1 ppm for 13C chemical shifts (and 1.3 ppm with PBE0).
We have also calculated the vacuum chemical shifts using eqn (1) (TMS as single reference, Table S6, ESI†). The RMSDs from the experimental values are consistently larger than for the shifts obtained using eqn (3). The largest increase (up to five times) is seen for 13C shifts. RMSD values are only comparable for sp3 protons, i.e. for protons with shifts similar to the reference. The same trend can be seen if single resonances in adamantane (31) or anthracene (35) are used as reference (Table S9, ESI†). But for the latter compounds, 13C RMSDs are significantly smaller than for TMS. This behaviour is not surprising as eqn (1) assumes a linear relation with a fixed slope of −1 between chemical shift and calculated shielding and TMS lies at the edge of the sampled chemical shift range. With increasing distance from the reference, small deviations from the expected slope of −1 lead to large deviations between calculation and experiment. In this regard the peripheral position of TMS is far from ideal. Further, the difference between the results obtained with adamantane and TMS as reference points to an issue in the treatment of silicon, similar to the relativistic effects of chlorine that cannot be properly accounted for in standard DFT.13
If only closely related electronic environments are investigated, the use of eqn (1) or (2) is justified. But e.g. for the validation of constitution or configuration of a newly isolated, structurally diverse natural product, the use of eqn (3) is clearly preferable.
It is instructive in this respect, to use eqn (3) with m fixed at −1. This enforces the theoretically expected slope of −1 but is independent of a specific single reference. For 1H, the RMSDs are about twice as large as in Table 3 but differences between the two datasets (CDCl3 and CCl4) and the different functional/basis set combinations are small. Combinations using the double hybrid functional perform slightly better. The 13C RMSDs for the reduced datasets vary between 1.11 and 3.80 ppm. Interestingly, changing the basis from cc-pVTZ to pcSseg-3 invariably leads to a doubling of the RMSD, irrespective of the functional. The best combination (PBEP86/cc-pVTZ) leads to values very close to the ones in Table 3 (1.11 ppm for CDCl3 and 1.17 ppm for CCl4). Inspection of the residual plots (see ESI†) shows that for calculations with pcSseg-3, the slope of σcalcvs. δexp deviates more distinctly from −1 than for cc-pVTZ. Since this deviation cannot be compensated if m is fixed, cc-pVTZ performs significantly better.
Comparison of experimental shifts with DFT calculations using an implicit solvent model
We also performed geometry optimization and shielding calculation with an implicit solvent (conductor-like polarizable continuum model (CPCM)38) to explore whether the agreement with the experimental data in solution can be improved. We directly compared the differences between the experimental shifts in the two solvents with the differences between the shielding values before conversion to chemical shifts (without using eqn (1)–(3)). Thus, specific effects only present for certain functional groups are not obscured by the regression procedure. Ideally, −Δσcalc and Δδexp should only differ by (see above). But especially for 13C, it is observed that CPCM cannot fully account for the experimental changes in chemical shift between CDCl3 and CCl4 (Fig. 3). While the picture is less clear for protons, the largest differences between experimental and calculated differences for 13C can again be seen for carbonyl groups.
 | ||
Fig. 3 Difference between the difference in experimental shifts in CDCl3 and CCl4 (Δδexp) and the difference in calculated PBE0 shielding with implicit CHCl3 and CCl4 (Δδcalc = −Δσcalc) plotted against the experimental shifts in CDCl3. Note: since the experimental shift differences are mostly positive (see Fig. 2) a positive value for Δδexp − Δδcalc typically corresponds to an underestimation of the absolute shift difference by the calculation. The solid grey horizontal lines indicate  , the susceptibility corrected chemical shift of TMS in CCl4 referenced to external TMS in CDCl3 (see main text). , the susceptibility corrected chemical shift of TMS in CCl4 referenced to external TMS in CDCl3 (see main text). | ||
After conversion to chemical shifts using eqn (3), the RMSDs from the experimental values in the two solvents were again investigated. While the agreement with experimental 1H shifts improves slightly compared to the vacuum calculations (0.01–0.03 ppm), the use of an implicit solvent model only leads to an improvement for the CDCl313C shifts calculated with PBEP86. Table 4 summarizes the performance of the two DFT methods with the corresponding implicit solvents. The MAD and max. AD values are given in Tables S12 and S13 (ESI†). As the limitations of the CPCM model (lack of local H-bonding capacity) are expected to be more severe for chloroform than for CCl4, it is surprising to see that the agreement with experimental data in CCl4 is negatively affected by CPCM. Possible reasons for these findings are deficiencies in the CPCM implicit solvent model and/or more favourable error compensation in the vacuum calculations. For comparison, CPCM shieldings were also calculated for structures optimized in vacuum. Interestingly, lower RMSD values were obtained for the 13C shifts, whereas no difference was observed for the 1H shifts (for evaluation metrics see ESI†). This suggests that – at least for the common procedure using eqn (3) – geometries optimized at the BP86/def2-tzvp level using CPCM provide no advantage compared to geometries optimized in vacuum.
| DFT | Exp. | 1H | 13C | ||||
|---|---|---|---|---|---|---|---|
| Method | Solvent | All | sp2 | sp3 | All | sp2 | sp3 |
| PBE0 | CCl4 | 0.09 | 0.08 | 0.08 | 2.07 | 1.84 | 1.09 |
| PBEP86 | CCl4 | 0.10 | 0.11 | 0.07 | 1.53 | 1.21 | 0.99 |
| PBE0 | CDCl3 | 0.10 | 0.10 | 0.08 | 1.87 | 1.85 | 1.10 |
| PBEP86 | CDCl3 | 0.10 | 0.12 | 0.06 | 1.34 | 1.21 | 0.96 |
Conclusions
The presented dataset is intended for the calibration and assessment of chemical shift calculations in organic chemistry, particularly with respect to the treatment of solvent–solute interactions in CDCl3.Our experimental data show that specific interactions with the solute are present even in such apolar solvents. Especially the 13C shifts of carbonyl and nitrile groups are differentially affected by the two solvents. A direct comparison of calculated shieldings with chemical shifts recorded in CDCl3 and CCl4 implies that DFT in implicit solvent is not able to reproduce experimental values equally well for all functional groups. The likely reason are specific interactions with the solvent (e.g. H-bonds) that cannot be adequately described by implicit solvation. By converting the shieldings to chemical shifts using the common multi-standard regression (eqn (3)), the errors resulting from neglecting directed solvent-interactions are redistributed over the whole shift range, also affecting functional groups not engaging in interactions with the solvent. In the worst case, selective deficiencies of the solvation model can lead to higher inaccuracies in chemical shift prediction for all atoms. This effect may have added to the ambiguous outcome found in this study regarding the usefulness of implicit CHCl3. For 1H, there was no significant advantage from using an implicit solvent model. For 13C, the double-hybrid functional PBE86 with implicit solvent provided the best agreement with chemical shifts recorded in CDCl3, while the implicit solvent was detrimental to the performance of PBE0. Importantly, our data also imply that the explicit treatment of solute–solvent interactions will be necessary for an even more accurate chemical shift prediction. Ignoring an incomplete representation of the solvent shell potentially obscures the direction to further improvement of DFT chemical shift prediction and hampers its fair assessment.
Conflicts of interest
There are no conflicts to declare.Acknowledgements
S. R. gratefully acknowledges financial support by the Swiss National Science Foundation (grant number 200021-178762). The authors thank Dr Felix Pultar for providing some of the studied compounds and helpful discussions.References
- E. E. Kwan and R. Y. Liu, J. Chem. Theory Comput., 2015, 11, 5083–5089 CrossRef CAS.
- M. O. Marcarino, M. M. Zanardi, S. Cicetti and A. M. Sarotti, Acc. Chem. Res., 2020, 53, 1922–1932 CrossRef CAS PubMed.
- A. M. Sarotti and S. C. Pellegrinet, J. Org. Chem., 2009, 74, 7254–7260 CrossRef CAS PubMed.
- A. Mitra, P. J. Seaton, R. Ali Assarpour and T. Williamson, Tetrahedron, 1998, 54, 15489–15498 CrossRef CAS.
- F. C. Wermter, N. Mitschke, C. Bock and W. Dreher, Magn. Reson. Mater. Phys., Biol. Med., 2017, 30, 579–590 CrossRef CAS.
- S. Berger, Tetrahedron, 1981, 37, 1607–1611 CrossRef CAS.
- M. W. Lodewyk, M. R. Siebert and D. J. Tantillo, Chem. Rev., 2012, 112, 1839–1862 CrossRef CAS PubMed.
- CHESHIRE Chemical Shift Repository, https://cheshirenmr.info/, (accessed 27 May 2022).
- W. Hehre, P. Klunzinger, B. Deppmeier, A. Driessen, N. Uchida, M. Hashimoto, E. Fukushi and Y. Takata, J. Nat. Prod., 2019, 82, 2299–2306 CrossRef CAS PubMed.
- P. R. Rablen, S. A. Pearlman and J. Finkbiner, J. Phys. Chem. A, 1999, 103, 7357–7363 CrossRef CAS.
- R. Jain, T. Bally and P. R. Rablen, J. Org. Chem., 2009, 74, 4017–4023 CrossRef CAS PubMed.
- M. A. Iron, J. Chem. Theory Comput., 2017, 13, 5798–5819 CrossRef CAS PubMed.
- L. B. Krivdin, Prog. Nucl. Magn. Reson. Spectrosc., 2019, 112–113, 103–156 CrossRef CAS PubMed.
- G. L. Stoychev, A. A. Auer and F. Neese, J. Chem. Theory Comput., 2018, 14, 4756–4771 CrossRef CAS PubMed.
- V. A. Semenov, D. O. Samultsev and L. B. Krivdin, Magn. Reson. Chem., 2014, 52, 686–693 CrossRef CAS PubMed.
- P. Cmoch, P. Krzeczyński and A. Leś, Molecules, 2018, 23, 161 CrossRef.
- E. Artikis and C. L. Brooks, Biophys. J., 2019, 117, 258–268 CrossRef CAS PubMed.
- M. Foroozandeh, R. W. Adams, P. Kiraly, M. Nilsson and G. A. Morris, Chem. Commun., 2015, 51, 15410–15413 RSC.
- R. K. Harris, E. D. Becker, S. M. C. De Menezes, P. Granger, R. E. Hoffman and K. W. Zilm, Magn. Reson. Chem., 2008, 46, 582–598 CrossRef CAS.
- J. Rumble, CRC Handbook of Chemistry and Physics, CRC Press/Taylor and Francis, Boca Raton, FL, 103rd edn, 2022 Search PubMed.
- M. Pupier, J.-M. Nuzillard, J. Wist, N. E. Schlörer, S. Kuhn, M. Erdelyi, C. Steinbeck, A. J. Williams, C. Butts, T. D. W. Claridge, B. Mikhova, W. Robien, H. Dashti, H. R. Eghbalnia, C. Farès, C. Adam, P. Kessler, F. Moriaud, M. Elyashberg, D. Argyropoulos, M. Pérez, P. Giraudeau, R. R. Gil, P. Trevorrow and D. Jeannerat, Magn. Reson. Chem., 2018, 56, 703–715 CrossRef CAS PubMed.
- G. A. Landrum, RDKit: Open-Source Cheminformatics Software, https://www.rdkit.org, (accessed 17 May 2022).
- S. Riniker and G. A. Landrum, J. Chem. Inf. Model., 2015, 55, 2562–2574 CrossRef CAS PubMed.
- F. Neese, Wiley Interdiscip. Rev.: Comput. Mol. Sci., 2022, e1606 Search PubMed.
- A. D. Becke, Phys. Rev. A: At., Mol., Opt. Phys., 1988, 38, 3098–3100 CrossRef CAS PubMed.
- J. P. Perdew, Phys. Rev. B: Condens. Matter Mater. Phys., 1986, 33, 8822–8824 CrossRef PubMed.
- F. Weigend and R. Ahlrichs, Phys. Chem. Chem. Phys., 2005, 7, 3297–3305 RSC.
- F. Weigend, Phys. Chem. Chem. Phys., 2006, 8, 1057–1065 RSC.
- S. Grimme, J. Antony, S. Ehrlich and H. Krieg, J. Chem. Phys., 2010, 132, 154104 CrossRef PubMed.
- S. Grimme, S. Ehrlich and L. Goerigk, J. Comput. Chem., 2011, 32, 1456–1465 CrossRef CAS PubMed.
- K. Wolinski, J. F. Hinton and P. Pulay, J. Am. Chem. Soc., 1990, 112, 8251–8260 CrossRef CAS.
- C. Adamo and V. Barone, J. Chem. Phys., 1999, 110, 6158–6170 CrossRef CAS.
- T. H. Dunning, J. Chem. Phys., 1989, 90, 1007–1023 CrossRef CAS.
- Turbomole 7.0 basis set library.
- S. Kozuch and J. M. L. Martin, J. Comput. Chem., 2013, 34, 2327–2344 CAS.
- F. Jensen, J. Chem. Theory Comput., 2015, 11, 132–138 CrossRef CAS PubMed.
- C. Hättig, Phys. Chem. Chem. Phys., 2005, 7, 59–66 RSC.
- V. Barone and M. Cossi, J. Phys. Chem. A, 1998, 102, 1995–2001 CrossRef CAS.
- T. Kluyver, B. Ragan-Kelley, F. Pérez, B. Granger, M. Bussonnier, J. Frederic, K. Kelley, J. Hamrick, J. Grout, S. Corlay, P. Ivanov, D. Avila, S. Abdalla and C. Willing, Jupyter development team, IOS Press, 2016, pp. 87–90 Search PubMed.
- G. van Rossum and F. L. Drake, Python 3 Reference Manual, 2009.
- J. D. Hunter, Comput. Sci. Eng., 2007, 9, 90–95 Search PubMed.
- H. Nguyen, D. A. Case and A. S. Rose, Bioinformatics, 2018, 34, 1241–1242 CrossRef CAS PubMed.
- C. R. Harris, K. J. Millman, S. J. van der Walt, R. Gommers, P. Virtanen, D. Cournapeau, E. Wieser, J. Taylor, S. Berg, N. J. Smith, R. Kern, M. Picus, S. Hoyer, M. H. van Kerkwijk, M. Brett, A. Haldane, J. F. del Río, M. Wiebe, P. Peterson, P. Gérard-Marchant, K. Sheppard, T. Reddy, W. Weckesser, H. Abbasi, C. Gohlke and T. E. Oliphant, Nature, 2020, 585, 357–362 CrossRef CAS PubMed.
- N. M. O’Boyle, M. Banck, C. A. James, C. Morley, T. Vandermeersch and G. R. Hutchison, J. Cheminf., 2011, 3, 33 Search PubMed.
- P. Virtanen, R. Gommers, T. E. Oliphant, M. Haberland, T. Reddy, D. Cournapeau, E. Burovski, P. Peterson, W. Weckesser, J. Bright, S. J. van der Walt, M. Brett, J. Wilson, K. J. Millman, N. Mayorov, A. R. J. Nelson, E. Jones, R. Kern, E. Larson, C. J. Carey, İ. Polat, Y. Feng, E. W. Moore, J. VanderPlas, D. Laxalde, J. Perktold, R. Cimrman, I. Henriksen, E. A. Quintero, C. R. Harris, A. M. Archibald, A. H. Ribeiro, F. Pedregosa and P. van Mulbregt, Nat. Methods, 2020, 17, 261–272 CrossRef CAS PubMed.
- R. Ditchfield, Mol. Phys., 1974, 27, 789–807 CrossRef CAS.
- J. P. Perdew, M. Ernzerhof and K. Burke, J. Chem. Phys., 1996, 105, 9982–9985 CrossRef CAS.
- D. Flaig, M. Maurer, M. Hanni, K. Braunger, L. Kick, M. Thubauville and C. Ochsenfeld, J. Chem. Theory Comput., 2014, 10, 572–578 CrossRef CAS PubMed.
- M. T. de Oliveira, J. M. A. Alves, A. A. C. Braga, D. J. D. Wilson and C. A. Barboza, J. Chem. Theory Comput., 2021, 17, 6876–6885 CrossRef CAS PubMed.
Footnote |
| † Electronic supplementary information (ESI) available. See DOI: https://doi.org/10.1039/d2cp03205h |
| This journal is © the Owner Societies 2022 |