
 Open Access Article
 This Open Access Article is licensed under a
 Creative Commons Attribution 3.0 Unported Licence
Medium dependent optical response in ultra-fine plasmonic nanoparticles
Lasse K.
Sørensen
 *abc,
Daniil E.
Khrennikov
d,
Valeriy S.
Gerasimov
de,
Alexander E.
Ershov
de,
Sergey P.
Polyutov
df,
Sergey V.
Karpov
dg and
Hans
Ågren
*a
*abc,
Daniil E.
Khrennikov
d,
Valeriy S.
Gerasimov
de,
Alexander E.
Ershov
de,
Sergey P.
Polyutov
df,
Sergey V.
Karpov
dg and
Hans
Ågren
*a
aDepartment of Physics and Astronomy, Uppsala University, Box 516, SE-751 20 Uppsala, Sweden. E-mail: lasse.kragh.soerensen@gmail.com; hans.agren@physics.uu.se
bDepartment of Theoretical Chemistry and Biology, School of Engineering Sciences in Chemistry, Biotechnology and Health, Royal Institute of Technology, Stockholm, SE-10691, Sweden
cUniversity Library, University of Southern Denmark, DK-5230 Odense M, Denmark
dInternational Research Center of Spectroscopy and Quantum Chemistry, Siberian Federal University, Krasnoyarsk, 660041, Russia
eInstitute of Computational Modelling, Federal Research Center KSC SB RAS, Krasnoyarsk, 660036, Russia
fFederal Siberian Research Clinical Centre under FMBA of Russia, 660037, Kolomenskaya, 26 Krasnoyarsk, Russia
gL. V. Kirensky Institute of Physics, Federal Research Center KSC SB RAS, Krasnoyarsk, 660036, Russia
First published on 21st September 2022
Abstract
We study the influence of media on the interaction of ultra-fine plasmonic nanoparticles (≤ 8 nm) with radiation. The important role of the surface layer of the nanoparticles, with properties that differ from the ones in the inner part, is established. Using an atomistic representation of the nanoparticle material and its interaction with light, we find a highly inhomogeneous distribution of the electric field inside and around the particles. It is predicted that with an increase in the refractive index of the ambient medium, the extension of the surface layer of atoms increases, something that also is accompanied by an enhanced red shift of the plasmon resonance band compared to large particles in which the influence of this layer and its relative volume is reduced. It is shown that the physical origin for the formation of a surface layer of atoms near the nanoparticle boundary is related to the anisotropy of the local environment of atoms in this layer which changes the conditions for the interaction of neighboring atoms with each other and with the incident radiation. It is shown that a growth of the refractive index of the ambient medium results in an increase in the local field in the dielectric cavity in which a plasmonic nanoparticle is embedded and which is accompanied by a growth of the amplitude of the plasmon resonance. We predict that in the ultra-fine regime the refractive index sensitivity shows a decreasing trend with respect to size which is opposite to that for larger particles. With the applied atomistic model this work demonstrates close relations between field distributions and properties of ultra-fine nanoparticles.
1 Introduction
One of the important characteristics of plasmon nanotechnologies is that the localized surface plasmon wavelength relates to the nanostructure of a metallic surface or a particle and to the nature of a surrounding medium. Surface plasmon resonance (SPR) biosensor devices were early developed based on the generation of surface plasmons in which the optical scattering from thin metallic films was used as a sensitive indicator of the changes in the refractive index due to molecular surface binding events. Subsequently, many research works have firmly established that the frequencies and intensities of resonances are sensitive to the dielectric properties of the medium and to the refractive index of materials close to the particle surface, see e.g. ref. 1–16. A considerable amount of research has been devoted to resonant structures of silver and gold obtained by lithography or colloidal chemistry17–19 for the purpose of optical diagnostic applications. Mock et al.20 observed that individual plasmonic nanoparticles exhibit enhanced scattering behavior with respect to surface plasmon resonance and showed that the use of plasmonic nanoparticles could result in an even higher sensitivity to the local refractive index than in thin film SPR biosensing devices. Through optical dark-field microscopy studies of the dependence of the plasmon resonance spectra of individual silver nanoparticles on the local index of refraction they could show that as the local index is increased the spectrum from each of the nanoparticle undergoes a very regular shift, where the amount of red shift per index increase varied depending on the shape of the nanoparticle and the mode of excitation. Interest in this research area is not waning, as evidenced by recent publications. In particular, high sensitivity refractive index nanosensor based on plasmonic effects with spherical and spheroidal Ag particles is discussed in,21 size dependence of a single Au spherical nanoparticle is considered in,22 TDDFT calculations of SPR in small plasmonic clusters up to 120 atoms were carried out in,21 the shape effect of Au spherical and cubic nanoparticle was studied in,23 the effect of dielectric medium of small Au nanoparticle aggregates was explored in ref. 24.The observation of a linear relationship between shift and dielectric constant, even with extreme sensitivity, has frequently been confirmed.25–27 It is clear that a large index sensitivity is advantageous when using the nanoparticles for sensing applications. This index sensitivity is dependent on size (the tendency is that larger particles give higher sensitivity), on shape (shaped particles give higher sensitivity than spherical ones) and on material (silver particles are more sensitive to the medium than gold particles).25,26,28
Most of the established works have concerned “large” nanoparticles, >10 nm, while there still remains a great challenge to design and measure active plasmonic nanoparticles with arbitrary size, composition and structure in the “ultra-fine” region with the dimension of a few nanometers. This situation is unfortunate considering the great number of applications such particles bring about, in particular for biosensing in the biomedical area where ultra-fine plasmonic particles provide a number of distinct advantages like reduced interference with the research object, size compatibility of small clefts, pockets and other compartments of the target biostructures. They can more easily pass through membrane channels and be effectively rinsed from the body. In particular, it is of interest to explore in such applications if the shift of plasmon resonance and its extinction coefficient maintain the same simple relationship to the dielectric contrast towards a contact medium as for the larger particles. However, a problem is that the dielectric constant for such small nanoparticles vary in size and could become unpredictable for clusters with more complex shapes. Here the dielectric constant may deviate significantly from bulk value because the mean free path of the conduction electrons may exceed the particle size and because the volume of the surface layer, with deviating properties, may become large with respect to the total volume of the particle.
In order to test the relationships between red shifts in the plasmonic resonance with the refractive index of the ambient medium for ultra-fine particles of the order 1–10 nm we apply here a recently developed discrete interaction model29 and parametrize it for a medium dependence. We use this model to predict more precisely the relation of the surface plasmon resonance maximum wavelength and extinction cross section as a function of the refractive index for the benefit of various applications using ultra-fine plasmonic nanoparticles.
The goal of our work is to establish the physical mechanisms responsible for the evolution of the surface plasmon resonance of ultra-fine nanoparticles immersed in a dielectric medium, as well as to study the effect of this medium depending on its refractive index on the plasmon resonance.
The employed approach investigates features in the distribution of the local field inside particles and the degree of its inhomogeneity, as well as the influence of this factor on the field around the nanoparticle, taking into account an ambient medium. This makes it possible to reveal the surface layer of atoms in nanoparticle and its influence on its plasmonic spectrum. To establish the physics underlying the spectral behaviour of the ultra-fine particles we explore the role of the surface layer of atoms in excitation of the plasmon resonances taking into account the anisotropy of the local environment of atoms in this layer by other atoms and their significant electrodymanic influence on each other. Finally, we discuss some ramifications of our findings for the design of ultra-fine nanoparticles for applications.
2 Model
2.1 The extended discrete interaction model
The Extended Discrete Interaction Model (Ex-DIM),29–31 is a discrete structure model parameterized directly from experimental data with respect to the position of the SPR and maximum value of the extinction cross section from a fitted Mie theory.32 In the Ex-DIM each atom is represented by a Gaussian charge distribution and endowed with a polarizability and relaxation constants which govern the inter-atomic interaction.33–36 Since the Ex-DIM previously has been described in detail we will here only focus on the improvements in the model which entails accounting for the refractive index of the dielectric constant. The essential idea is to account for the medium by creating an effective scaled interaction between atoms in the particle and thereby creating an effective model suited for the size-range and media that is most relevant for the Ex-DIM. The model is fitted to the available data where a simple fitting function was chosen which best represented the data.By applying a weak uniform electric field E the frequency dependent polarizabilities from the fluctuating dipoles μ can be determined:
| Aμ = E. | (1) |
A is defined as:
| Aij = δijαij−1 − (1 − δij)T(2)ij | (2) |
where T(2)ij is the electrostatic interaction tensor between dipoles37 and αij now is defined as:
 | (3) |
In eqn (3), Ri,bulk is the bulk radius of the atom, Ri(fcn) the coordination number (fcn)38 scaled radius,29αi,s,kl is the assigned atomic polarizability, n the refractive index of the medium, and L(ω,P,T,n) a frequency-, size-, temperature- and media-dependent Lorentzian.
The geometric dependence of the surface plasmon resonance is determined by the frequency-, size-, temperature- and media dependent Lorentzian L(ω,P,T,n):
| L(ω,P,T,n) = N(Lx(ω,Px,T,n) + Ly(ω,Py,T,n) + Lz(ω,Pz,T,n)), | (4) |
 | (5) |
| Γi(Pi,T,n) = (Γ(Pi) + Γe–ph,d(T))/n2. | (6) |
The size dependent frequency ωi along with the size- and temperature dependent relaxation constants in eqn (6) are described in greater detail in ref. 31. The new update of the model refers to the introduction of the refractive index of the medium n in both the effective polarizability and the Lorentzian. While not completely independent the general idea is that the effect from the refractive index n of the medium in the effective polarizability is responsible for shifting the position of the SPR while in the Lorentzian n will shift the maximum value of the SPR by scaling the relaxation constant.
2.2 Local anisotropy and chaotization factors
The notion of local anisotropy of an environment as a geometrical characteristics was first introduced in40 and applied to interactions of disordered plasmonic nanoparticle aggregates with optical radiation. It was shown that the local anisotropy factor S strongly correlates with the local optical response and that it can be used for analyzing various complicated aggregates and nanocomposites without explicit solution of the electromagnetic problem. The factor S and the correlation of this parameter with the local field distribution makes it possible to qualitatively predict the sites where the electromagnetic energy is localized. In our work the notion of local anisotropy is used as a universal geometric characteristic to analyze the effects of local field enhancement in the atoms of a crystal lattice when approaching the boundary of a nanoparticle. Thus, the local anisotropy of atoms near the surface increases, which entails changing the conditions of their interaction with the incident radiation as compared to atoms near the center of the particle with isotropic surroundings.According to ref. 40 the local anisotropy tensor and its principal values read as follows:
 | (7) |
 and calculation of the variance of its principal values gives the local anisotropy factor Si. This parameter thus quantifies the degree of anisotropy of the local environment of the i-th atom and can be defined as the variance of depolarization factors,
| Si2 = 〈να2〉 − 〈να〉2. | (8) |
Eqn (8) evince that the larger the difference of the tensor principal values, the higher the local anisotropy of the environment. Si = 0 is only seen in the case of an isotropic environment of the i-th atom. This isotropic environment corresponds to a minimization in the difference of the tensor  components where an equality of the squares of the principal values is achieved.
The parameter Si depends on the coordinates of all atoms in the nanoparticle with j ≠ i. However, due to the fast cubic decay of the near-field component of the dipole radiation field, the neighbors within few coordination spheres of the i-th site give the largest input to Si.
The degree of chaotization of atomic light-induced dipoles, here called the chaotization factor, is a factor related to the local anisotropy and describes the orientational disorder of dipole moments, combined with the dispersion of their amplitudes. It is proposed in the following form
 | (9) |
2.3 Nanoparticle microscopic and macroscopic fields
The appearance of the electromagnetic fields inside and outside the nanoparticle is of great relevance in order to interpret the results for the medium effects on the plasmon generation. Using the Lorentz approach41 and the Ex-DIM generated fluctuating dipoles the microscopic field can be expressed as the total field created by each atom dipole moment in the form of a Gaussian charge distribution: | (10) |
Using given expressions for the T, see e.g.,29,42 where Rjμ → 0, an explicit expression for the field is
 | (11) |
The macroscopic field can be obtained from averaging the available microscopic field using the convolution of the Gaussian function:
 | (12) |
The program implementing these field equations is capable to calculate high resolution 3D complex field maps and store them in open-source spatial data format VTK (Visualization Toolkit) as a structured grid.43 The atomic structure of the Au nanoparticles was obtained from an perfect face-centered lattice by cutting out the stereolithography (STL) file that defines the shape of the particle using the open-source Paraview software.44 The difference in position and extinction cross section between a perfect face-centered lattice and a structure obtained from molecular dynamics at ambient temperature 293.15 K for spherical structures have been shown to be very small.31
3 Results and discussion
According to classical theory, the frequency of the particle plasmon resonance relates to the dielectric constant of the ambient medium (εm) as . Here ωp is the plasma frequency, and ε is the dielectric constant of the metal. So, the surface plasmon resonance ωpl experiences a red shift increasing with the growth of εm. Even using the dipolar approximation the extinction cross section of a metal nanoparticle with dielectric constant ε′ + iε′′ and radius R grows when the dielectric constant of the ambient medium increases13σext = 24π2R3εm3/2ε′′/λ[(ε′ + 2εm)2 + 2ε′′2]. In the present work we thus explore how these dependencies transform into the small size range, below 10 nm, where the notion of a bulk dielectric constant becomes questionable and where explicit atomistic models become warranted.
Fig. 1–3 present generalized dependencies on the ambient dielectric medium for the spectral position of the surface plasmon resonance in ultra-fine Au nanoparticles of different sizes. We here assume that the colloid is sufficiently diluted so that the nanoparticles can be treated as individual nanoparticles. Fig. 1 shows the dependence of the maximum of the extinction cross section (within the plasmonic absorption band) on the particle size at different refractive indices of an ambient medium as calculated by Ex-DIM. As can be seen from this figure, the maximum increases as the refractive index grows. Under these conditions, an increase in the particle size from 2.5 to 6.5 nm is accompanied by an accelerated growth in this plasmon maximum. For comparison this figure also shows the same dependencies calculated by Mie theory taking into account of a size correction to the dielectric constant. As can be seen from the data presented, there is in general a correlation between the results obtained with Ex-DIM and the Mie theory, however, with a growing, yet small, discrepancy between the two models with increasing refractive index. Here, instead of the classical approach to the size dependence of the relaxation constant the Mie theory modification was used with size corrections to the dielectric constant, based on the Karimi's paper32 by introducing the 1/R size dependence of the plasma frequency for ultra-fine Au nanoparticles following the nonlocal theory.45
 | ||
| Fig. 1 Comparison of the Mie theory and Ex-DIM calculations of the maximum of the plasmonic extinction cross section as a function of Au nanoparticle size for different values of the refractive index of the ambient medium. Calculations according to the Mie theory with size correction for the dielectric constant of Karimi32 are shown as solid lines. Discrete Ex-DIM data are shown as hollow circles and approximating functions are marked as dashed lines. | ||
 | ||
| Fig. 2 Maximum of the surface plasmon resonance of Au nanoparticles (in eV) as a function of their inverse diameter at different values of the refractive index of an ambient medium – discrete Ex-DIM data (hollow circles) and approximating functions (solid lines). | ||
 | ||
| Fig. 3 Maximum of the surface plasmon resonance of the Au nanoparticle (in eV) as a function of the refractive index of an ambient medium at the given Au nanoparticle size in the range 2.73–10.6 nm: discrete Ex-DIM data (hollow circles) and approximating functions (solid lines). | ||
Fig. 2 demonstrates the dependence of the plasmonic absorption band maximum on the inverse particle diameter (in inverse nanometers) at various values of the refractive index of the medium in the range n = 1.0–1.8. Here the absorption band maximum is expressed in eV for each particle size. In this representation, the dependencies appear as linear functions. The solid lines in this figure are approximating straight lines showing the general trend in the location of the discrete values, with some, small, deviation from linearity exposed by the high index data. As the particle size increases, the influence of the medium and size on the red shift resonance value decreases due to the reduction in the relative volume of the surface layer with respect to the volume of the entire particle.
Fig. 3 shows the dependence of the position of the surface plasmon resonance maximum (in eV) on the refractive index of the environment. A series of curves were obtained for different values of particle size in the range from 2.73 to 10.06 nm. As can be seen from these dependencies, there is a tendency to increase the value of the resonance red shift with growing refractive index of the medium. One finds that the red shift with respect to size for a given medium is anomalously strong in this small size range, much stronger than in the large size range beyond 8 nm. This can be explained in terms of chaotization of atomic dipoles of the surface volume, which grows in significance with respect to the core atoms when the particle becomes smaller. Thus, the smaller the particle size, the higher the sensitivity of the plasmon resonance to an increase in the refractive index of the medium, which manifests itself in a rapid increase in its red shift, see further discussion below.
The dependencies shown above and the identified patterns require interpretation and identification of the physical mechanisms underlying the discovered effects. The concept of local anisotropy of the surroundings (eqn (8)) as a universal geometrical characteristics is applied prediction of local field enhancement effects in atoms of a crystal lattice when approaching the particle boundary. Thus, the local anisotropy of positions of surrounding atoms around a given atom in the vicinity of the surface determines the conditions for interaction of atoms with incident radiation as well as with each other. These conditions are different for atoms located in the particle core with an isotropic environment like in a bulk and near the particle boundary.40,46 The boundary effect on the local anisotropy is clearly apparent in Fig. 4, which shows the radial distributions of the local anisotropy factor inside the Au nanoparticles of different sizes. This entails a change in the related chaotization parameter, eqn (9), for the surface layer compared to the core area, see Fig. 7 which demonstrates the radial distributions of the degree of chaotization of light-induced atomic dipoles inside Au nanoparticles of different size embedded in a dielectric medium with growing refractive indices n = 1.0, 1.2, 1.6, 1.8.
 | ||
| Fig. 4 Left: Radial dependence of the local anisotropy factor (S) inside the Au nanoparticles with diameters 3.13, 3.95, 5.17 and 5.98 nm in vacuum. Right: The spherical Au nanoparticles with diameters 3.13, 3.95, 5.17 and 5.98 nm. Au particles of a given size were cut out from an infinite perfect face-centered lattice using the own software. | ||
It is clear that the degree of chaotization at the surface layer is highly dependent on both the size of the particles and on the refractive index of their environment. One observes that in the case of the largest index (n = 1.8) and smallest diameter (D = 3.13 nm) the chaotization becomes noticable already at half the distance between center and surface, while in the opposite extreme chaoization can be discerned only at the 10% outer shell. This chaotization is mainly due to the interaction of dipoles with each other and the influence of the closely located particle boundary. Notably, that chaotization includes both directions of dipoles and their amplitudes.
The surface layer atoms are highly anisotropically surrounded in this area by other atoms, and the particle boundary itself can here be considered as a continuous defect – see Fig. 5. The spatial properties of such structures can be described by the local anisotropy factor, see eqn (8), introduced in40 to explain the local field enhancement effects in plasmonic nanoparticle aggregates. It is shown that the spatial distribution of the local anisotropy factor strongly correlates with extrema of the local field distribution.
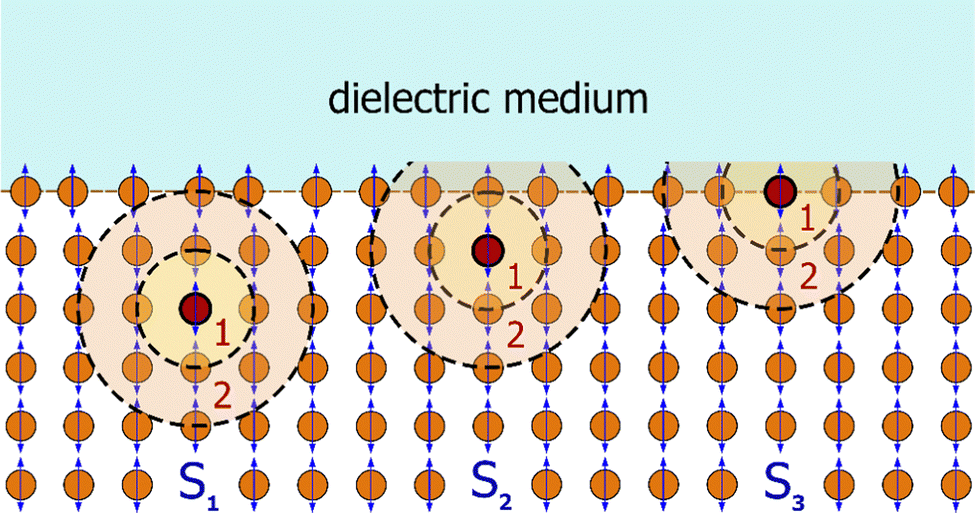 | ||
| Fig. 5 Demonstration of the origin of a locally anisotropic environment of atoms in the piece of the nanoparticle square crystal lattice near the boundary with an ambient dielectric medium. Surrounding atoms are located in the first (1) and in the second (2) coordination spheres (shown by dotted rings) around the given atoms (marked in dark red) which are located at different depths from the particle boundary (schematic representation). | ||
Fig. 5 explains in which part of a perfect crystal lattice the local anisotropy around each atom (shown as circles) can be detected. This Figure represents the case of vertical orientation of light-induced atomic dipoles and incident field polarization. As can be seen from this figure, the local anisotropy of surroundings increases when approaching the crystal boundary. It reaches a maximum at the crystal boundary due to the absence of surrounding atoms in the half-space outside the crystal. So the local anisotropy factor increases in the order S1 < S2 < S3.
Fig. 6 demonstrates the optical manifestation of the mechanism of local anisotropy. This Figure illustrates formation of a local field in the isotropic environment of atoms and in the absence of local anisotropy (like in the nanoparticle core). The figure also shows the contribution to the local field produced by the dipole moments of neighboring atoms at the location of a given atom, from both orthogonal and collinear atom configuration (relative to the polarization direction of the incident radiation).
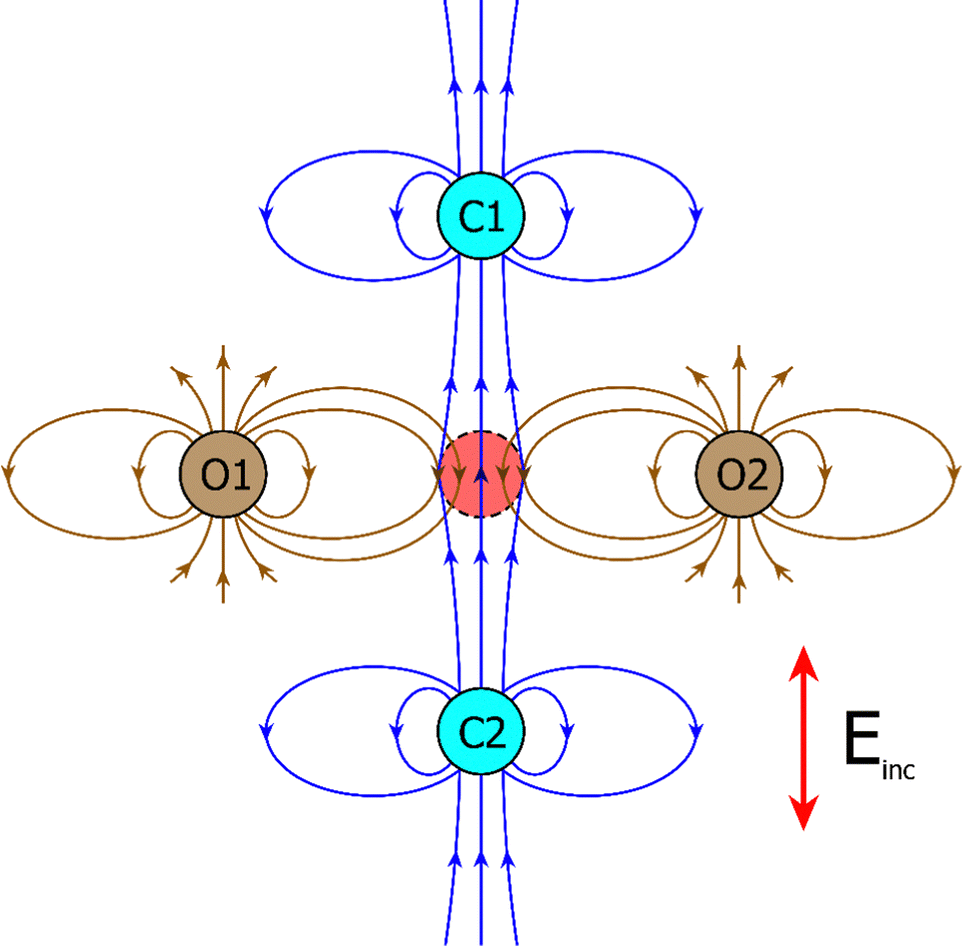 | ||
| Fig. 6 Formation of the local field shown with its electric field lines at the location of the given atom (marked by a dashed red circle) from neighboring dipole-interacting atoms in the case of isotropic surroundings. Field lines from collinear (C1, C2) and orthogonal (O1, O2) atomic dipoles showing coinciding (C1, C2) and opposite (O1, O2) directions with respect to the field lines entering the atom at its location (the case of interaction of neighboring atoms in the nanoparticle core). The polarization of incident field (Einc) is vertical. | ||
As can be seen from this figure, in the case of the orthogonal configuration (like at the upper layer of atoms in a crystal lattice in Fig. 5) the local field at the neighboring atoms is weakened, while in the case of the collinear configuration the local field is enhanced.
This Figure predicts a weakening of the internal field in the nanoparticle surface layer near the poles seen in Fig. 9 and 10 and locally enhanced field along equator (which is more pronounced for the larger particle with a size of 5.98 nm). The Figure shows formation of a local field in the conditions of strongly anisotropic surroundings of atoms and in the presence of maximum local anisotropy (the case of the nanoparticle surface layer). In the instance of an isotropic (3D) environment, the additional fields produced by all surrounding atoms are mutually compensated.
Comparison of radial dependences of the local anisotropy factor with the degree of chaotization of atomic dipoles, see Fig. 4 and 7, in the same conditions demonstrate their high correlation. This can be explained by the fact that the effect of chaotization of atomic dipoles in the surface layer is based on the local anisotropy of the surrounding atoms near the particle boundary. Fig. 8 shows that chaotization can cover thick surface layers of the nanoparticle and that it can penetrate deeply towards its center when the refractive index of ambient medium grows.
 | ||
| Fig. 7 Radial dependence of the degree of chaotization of atomic dipoles (eqn (9)) inside the Au nanoparticles with diameters 3.13, 3.95, 5.17 and 5.98 nm at the wavelength of the surface plasmon resonance maximum vs. the refractive index of the environment (in relative units). | ||
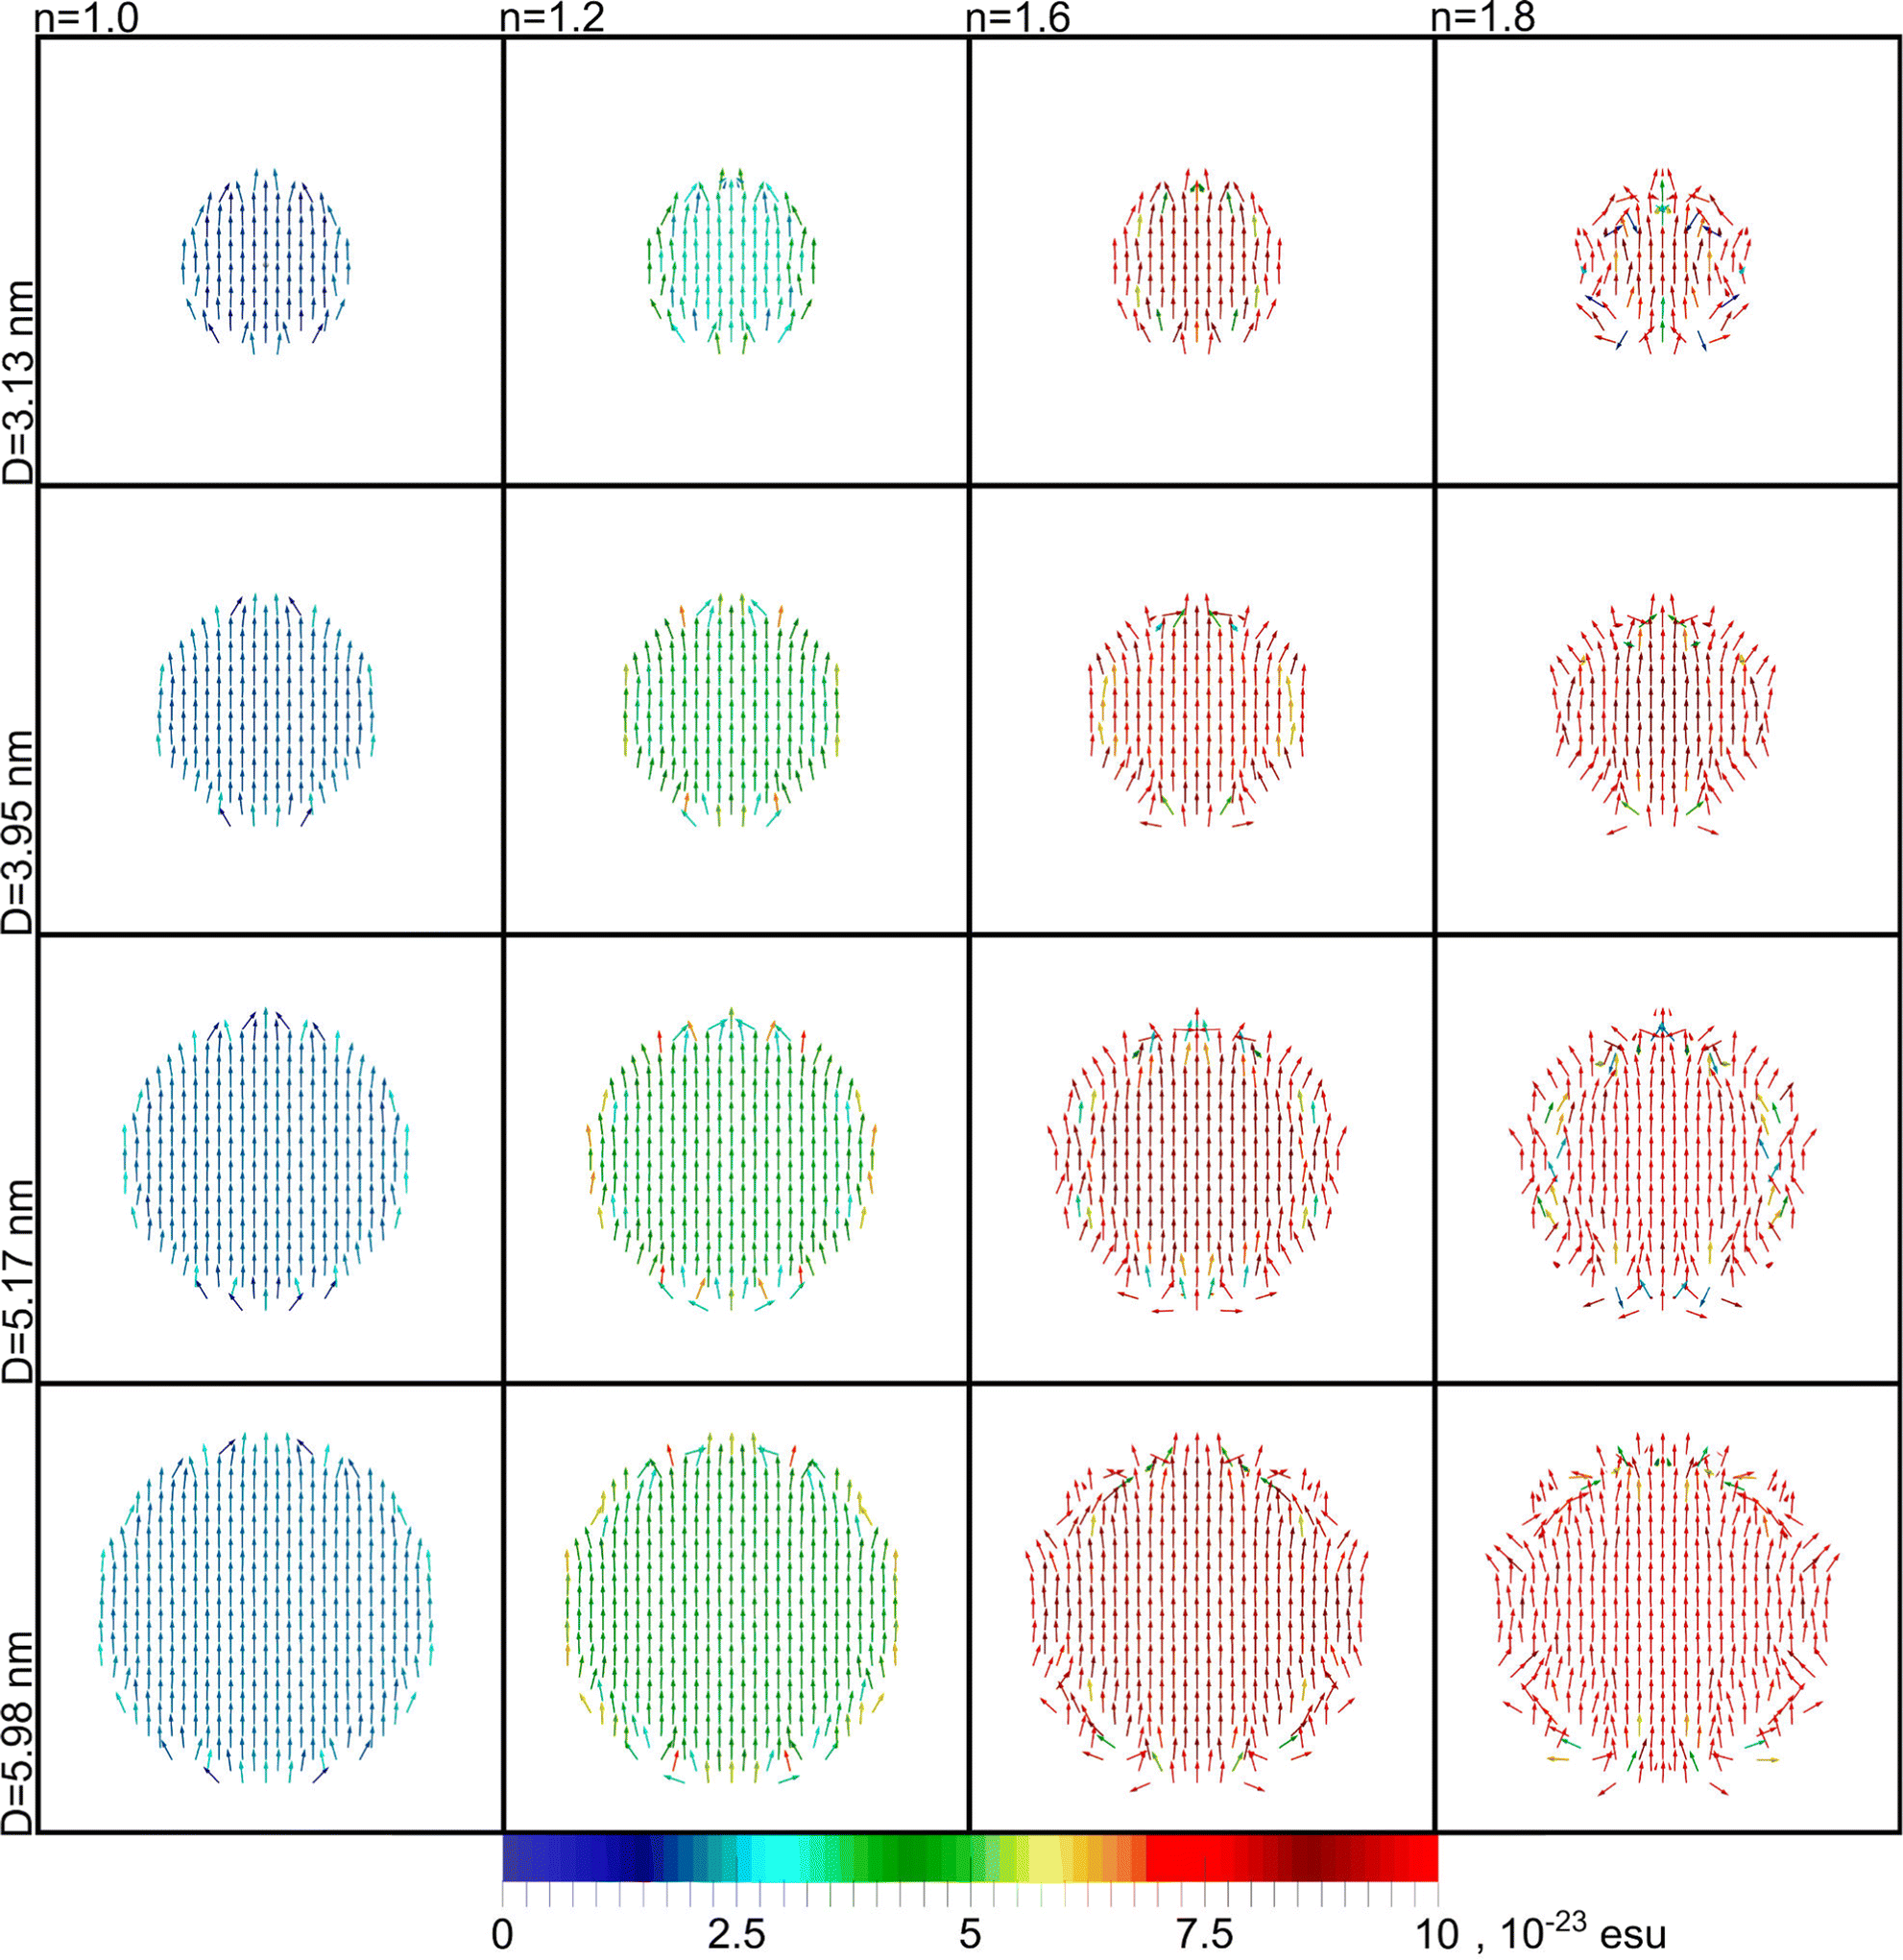 | ||
| Fig. 8 Orientational distribution of dipole moments (real parts) of atoms and their amplitudes inside the Au nanoparticles with diameters 3.13, 3.95, 5.17, 5.98 nm at different values of the refractive index of the ambient medium and at the wavelength of the surface plasmon resonance maximum. Polarization is vertical. Inhomogeneity and surface layers within the nanoparticles are clearly visible. The values of the dipole moment modulus are shown in color bar in e.s.u. | ||
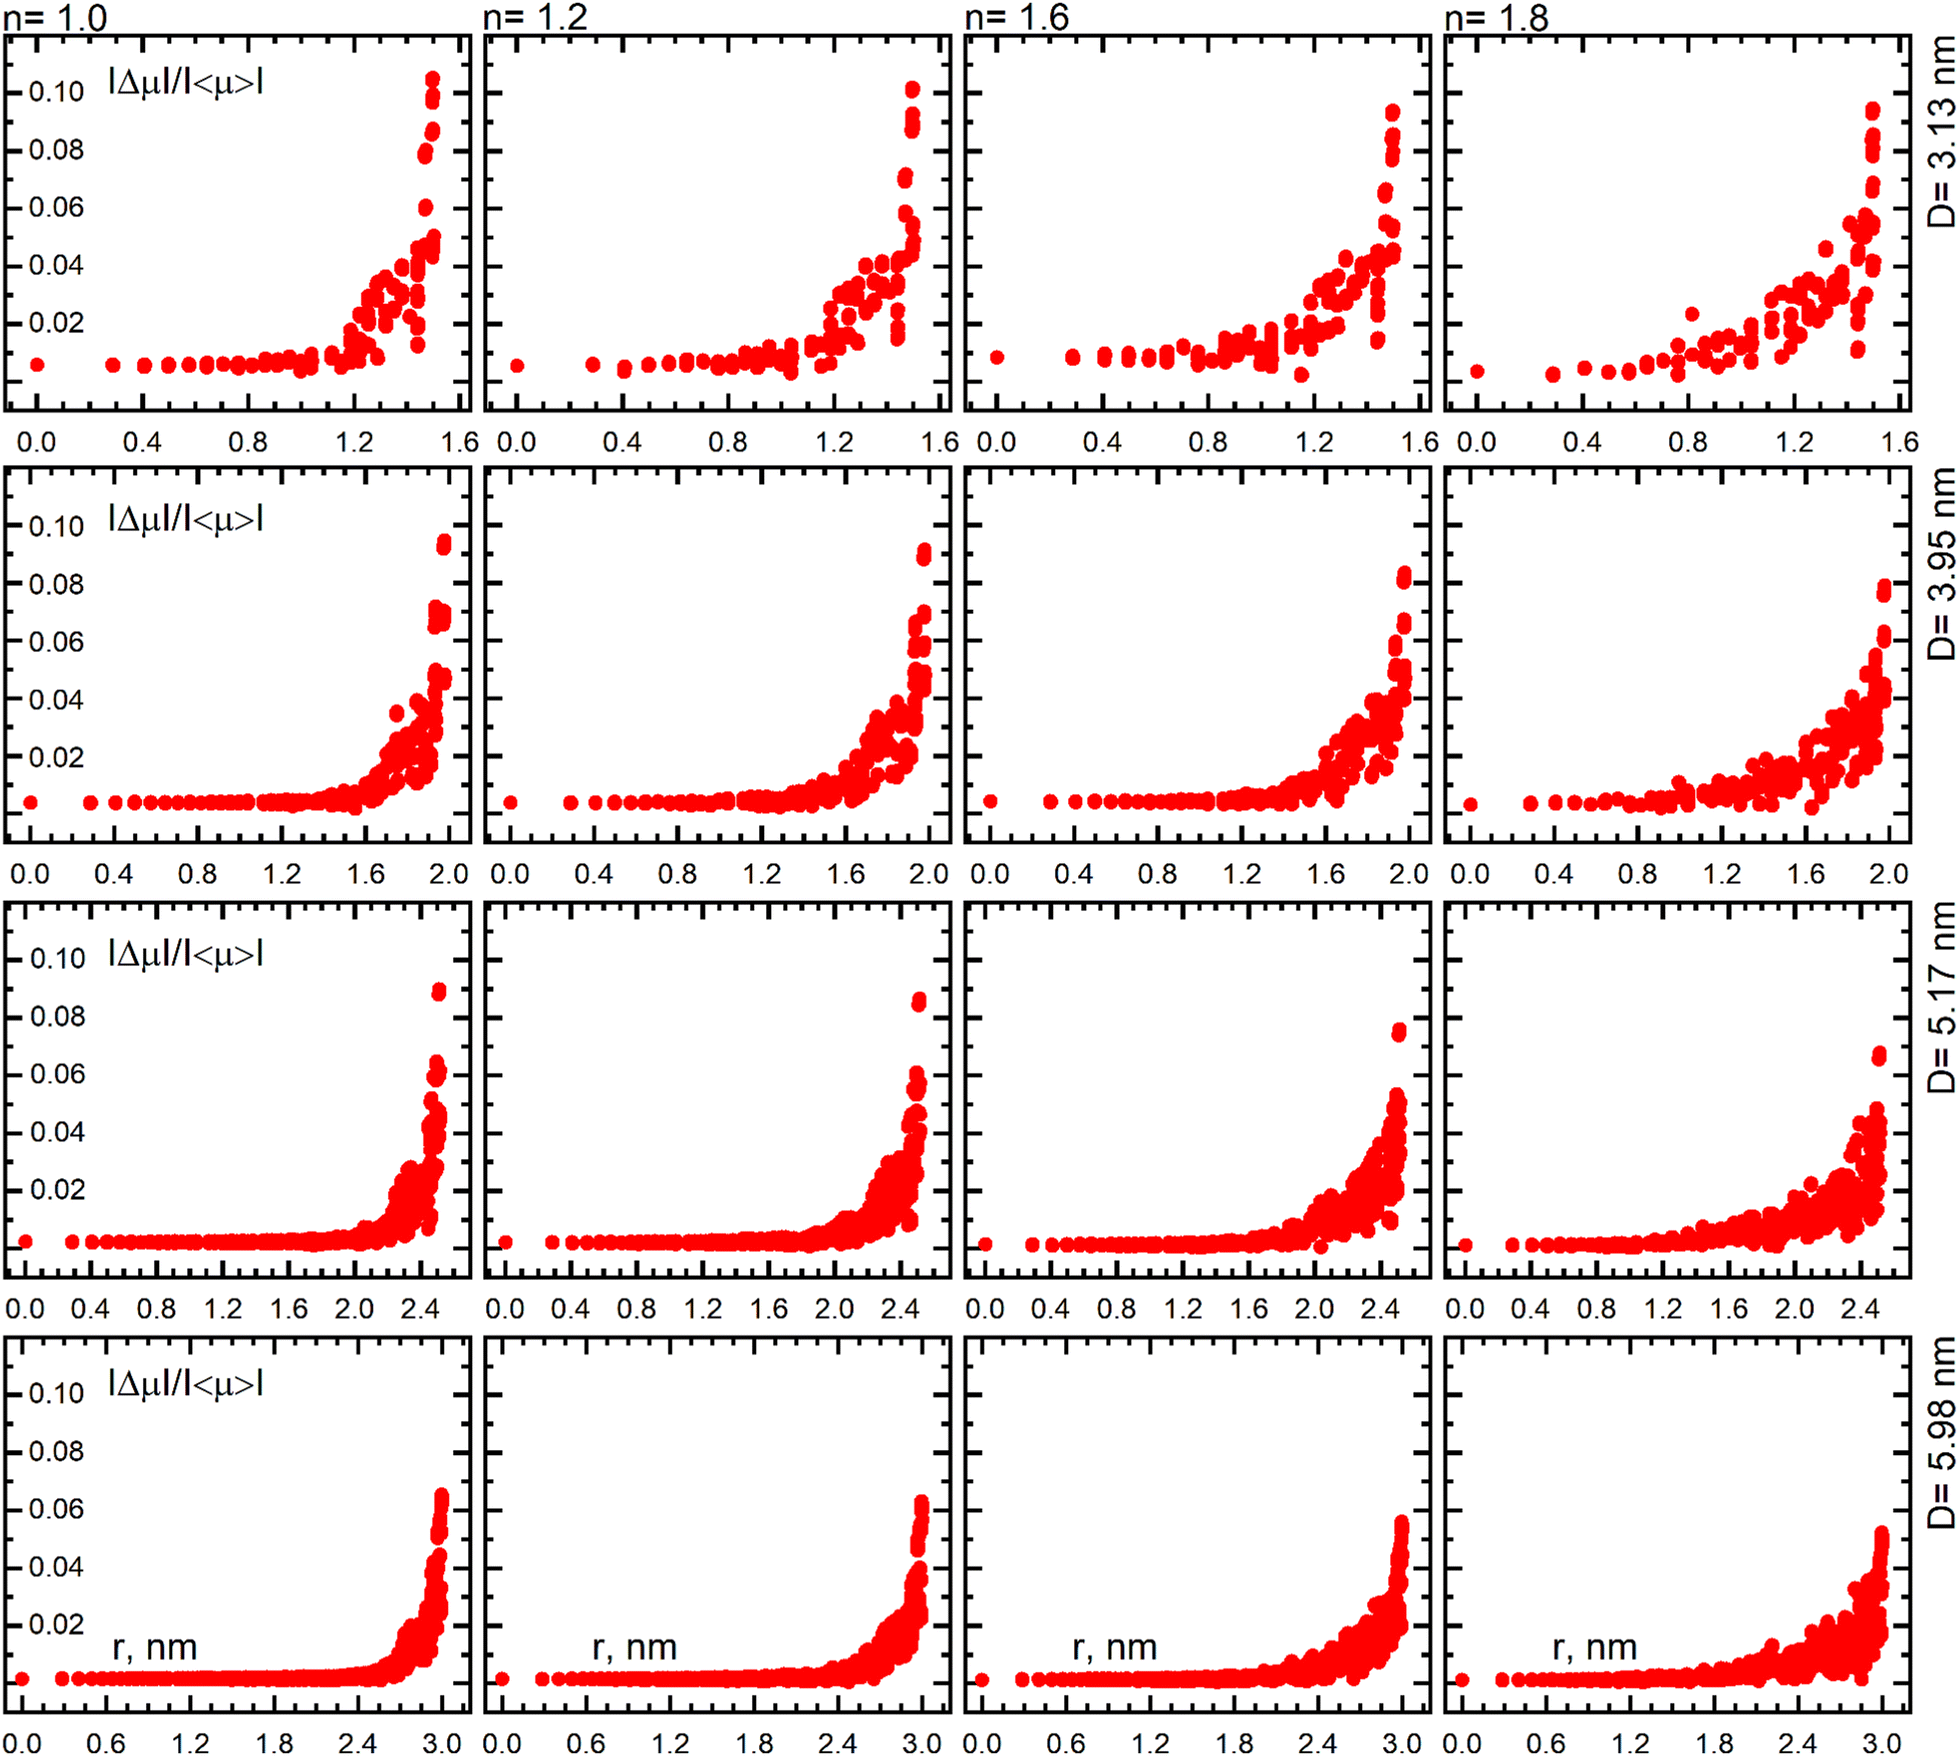
It is clear that the absolute extension of the perturbed surface layer does not depend much on the size of the nanoparticle at a given value of the medium refractive index, while the relative extent of the perturbed area in the surface layer (with respect to the particle size) grows with decreasing this size as displayed by Fig. 8. This extension grows considerably as the refractive index of the ambient medium increases at a given particle size.
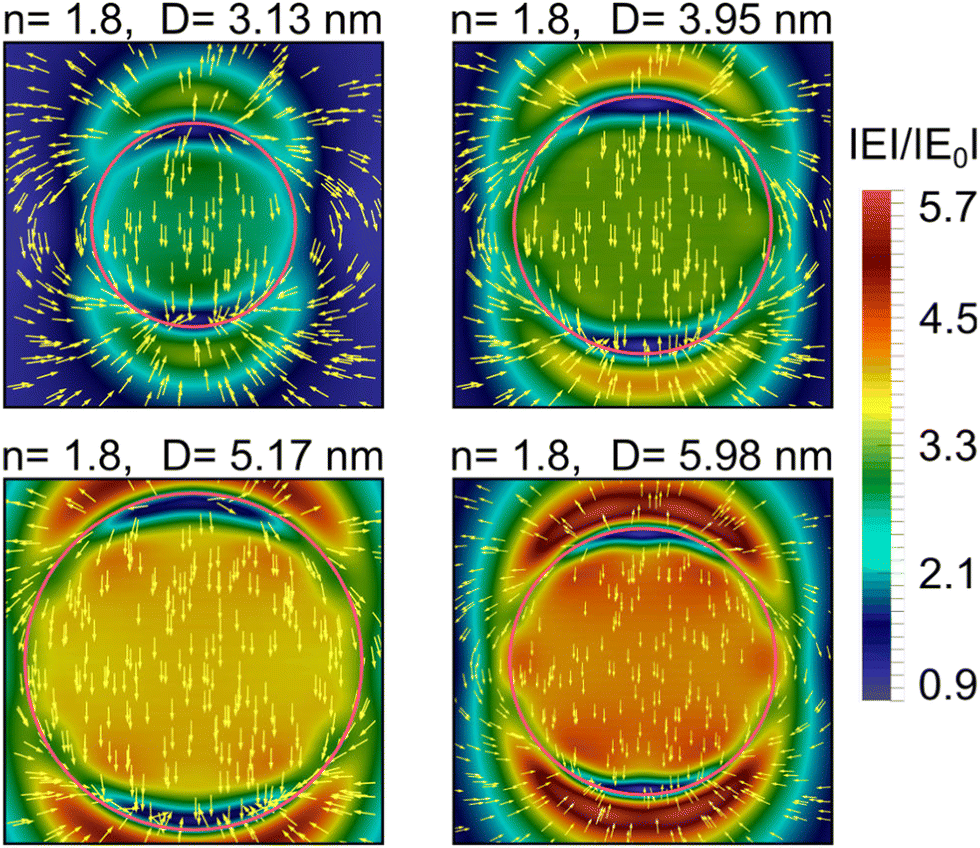
The medium effect on the field distribution dominates over the size effect as indicated by Fig. 9 and 10 which demonstrate distribution of the field strength modulus and the field direction inside and around the Au nanoparticles with different diameters and refractive indices of an ambient medium at the wavelength of the plasmon band maximum. The different color bars in Fig. 9 and 10 means that the field strength inside the particles increases with the particle size growth. The inhomogeneity within the nanoparticles is clearly distinguishable at the surface layers, as well as the formation of “cold spots” near the poles of the particles.
 | ||
| Fig. 9 The pattern of distribution of the field strength modulus (|E|/|E0|) and the field direction inside and around the Au nanoparticles with diameters of 3.13, 3.95, 5.17, 5.98 nm vs. the refractive index of the ambient medium n = 1.0; 1.2; 1.6; 1.8 at the wavelength of the maximum of surface plasmon resonance. The apparent size of the largest particle with a diameter of 5.98 nm with the field distribution image (in the bottom row) is shown to be smaller than the real one in order to cover the field distribution pattern around the particle. Polarization is vertical. Color bars used are different for different sizes due to the large difference in the field amplitudes and their high sensitivity to the medium refractive index. | ||
 | ||
| Fig. 10 The comparable distribution of the field strength modulus and the field direction inside and around the Au nanoparticles vs. the particle diameter in the ambient medium with the refractive index of n = 1.8 at the wavelength of the surface plasmon resonance. Polarization is vertical. Color bar is the same for the different sizes. | ||
The emergence of cold spots located beneath the nanopartilce surface at the poles, coincides with the areas of formation of the source and drain of the field direction. In these areas there is change of field directions from one pole – outward from the nanoparticle, and from the opposite pole – inward into the nanoparticle. The total fields inside and around the nanoparticle within the surface layer may have different phases, and this phase difference increases as the refractive index grows. If these phases correspond to different field directions, then the modulus of the field distribution shown in Fig. 9 can contain zero values in areas of cold spots.
Fig. 9 and 10 show, that the effect of ambient medium on field distribution is dominant compared to the size effect. Note, that different color bars in Fig. 9 and 10 means that the field strength inside the particles increases with the particle size. Growth of field inside larger particles at n = 1.8 in Fig. 10 is due to their higher polarization, proportional to the particle volume.
Fig. 9 demonstrates distributions of the local field inside and around nanoparticles of different size in ambient media with values of the refractive index in the range n = 1.0–1.8. It is clearly seen that the larger the refractive index the higher the field strength and that this trend is independent of the particle size. The general trends of these field distributions, displayed in Fig. 10, show also that the larger the particle the higher the field strength. The data in Fig. 10 are shown with the same color bar for all sizes as opposed to Fig. 9 in which each size corresponds to a different color bar. The results presented in Fig. 9 and 10, which are related to the data presented in Fig. 1–3, show that there is a distinct effect of the medium for refractive indices n ≤ 1.8, in fact the dependence of the plasmon shift on the medium refractive index must be considered as quite delicate. In contrast, the changes of field strengths and distributions can hardly be observed by eye between the particles in vacuum.
We also note that a nanometer wide cold stripe develops near the particle poles under the surface with much reduced field strength, while hot spot areas develop at longer distances from the particles. The maximum value of field strength is observed at some distance above the poles of the particle, but not on its surface. This observation has an obvious bearing on the positioning of plasmonic nanoparticles, or the structuring of SPR surfaces, when used for imaging or detection purposes.
In this regard, it should be emphasized that if ultra-fine plasmonic nanoparticles are employed to enhance the local field in SERS experiments, the molecules of the analyzed impurity must be located slightly above the particle surface.
As follows from Fig. 9, the larger the refractive index of the ambient medium, the farther from the surface of the particle the zone of maximum localization of the field near the poles is located.
In order to inspect the role of anisotropy and chaotization of dipoles we may first consider Fig. 11(a) which schematically shows the emergence of the electric field in a spherical dielectric cavity with refractive index n in which a metal particle is embedded. As can be seen from the schematic representation in Fig. 11(b), the polarization of molecules on the inner surface of a vacuum cavity carved inside an infinite dielectric medium results in emergence of a orientationally ordered monolayer of light-induced molecular dipoles. In this case, the field inside this dielectric cavity, created by the surface bound charges of these dipoles, is co-directed with the incident field, unlike the field inside the cavity of a conductive material.
 | ||
| Fig. 11 (a) Sketch of a field formation inside a dielectric spherical cavity with an embedded Au 5.98 nm sized nanoparticle and its spatial distribution of atomic dipole moments perturbed in the surface layer (for a given instantaneous phase value). E0 is the amplitude of the incident field, Ec is an additional field produced by bound charges – light-induced dipoles of the medium molecules located on the inner surface of the cavity; (b) the field strength enhancement factor inside a spherical vacuum cavity with diameter of 6 nm in infinite dielectric medium vs the value of refractive index n of dispersion-free medium. |E0| is the incident field modulus, |Ec| is the modulus of field produced by bound charges on the inner surface of a cavity. The spectral and size dependencies in the range 3–6 nm are negligible. | ||
Fig. 11(b) shows the dependence of the field strength modulus amplification factor inside a spherical dielectric cavity on the refractive index of its material in the range 1.0 to 2.0 into which the gold nanoparticles of 3.13, 3.95, 5.17, 5.98 nm diameter studied in this work can be embedded. As can be seen from the figure, the field enhancement factor grows up to the value of 1.45 with increasing refractive index. The latter is associated with higher values of the polarizability of the dielectric medium molecules, and therefore higher polarization of the material. We emphasize here that the total field inside the cavity is the sum of the incident field and the field created by the cavity itself. One can also note that in the particle size range from 3 to 6 nm, the dependence of the field enhancement factor inside the cavity on its size is negligibly small for a given value of the refractive index.
From these results it becomes clear why the influence of the medium on the degree of chaotization of the surface layer is greater than the influence of the particle size. The amplitudes of atomic dipoles and their interactions will grow as a consequence of increased value of the local field inside the spherical cavity. Strengthened by the enhanced local field, the dipole interactions additionally chaotize the dipoles of the surface layer atoms, which contributes to the penetration of chaotization into deeper layers of the particle.
Fig. 12 shows the dependence of plasmonic spectra of the 3.13, 3.95, 5.17, 5.98 nm Au nanoparticles in the ambient medium with refractive index of n = 1.2; 1.6; 1.8. This figure shows that the greater the refractive index, the higher the amplitude of the plasmon resonance due to enhancement of the local field inside the dielectric cavity. In addition, a red shift of the SPR band maximum is observed.
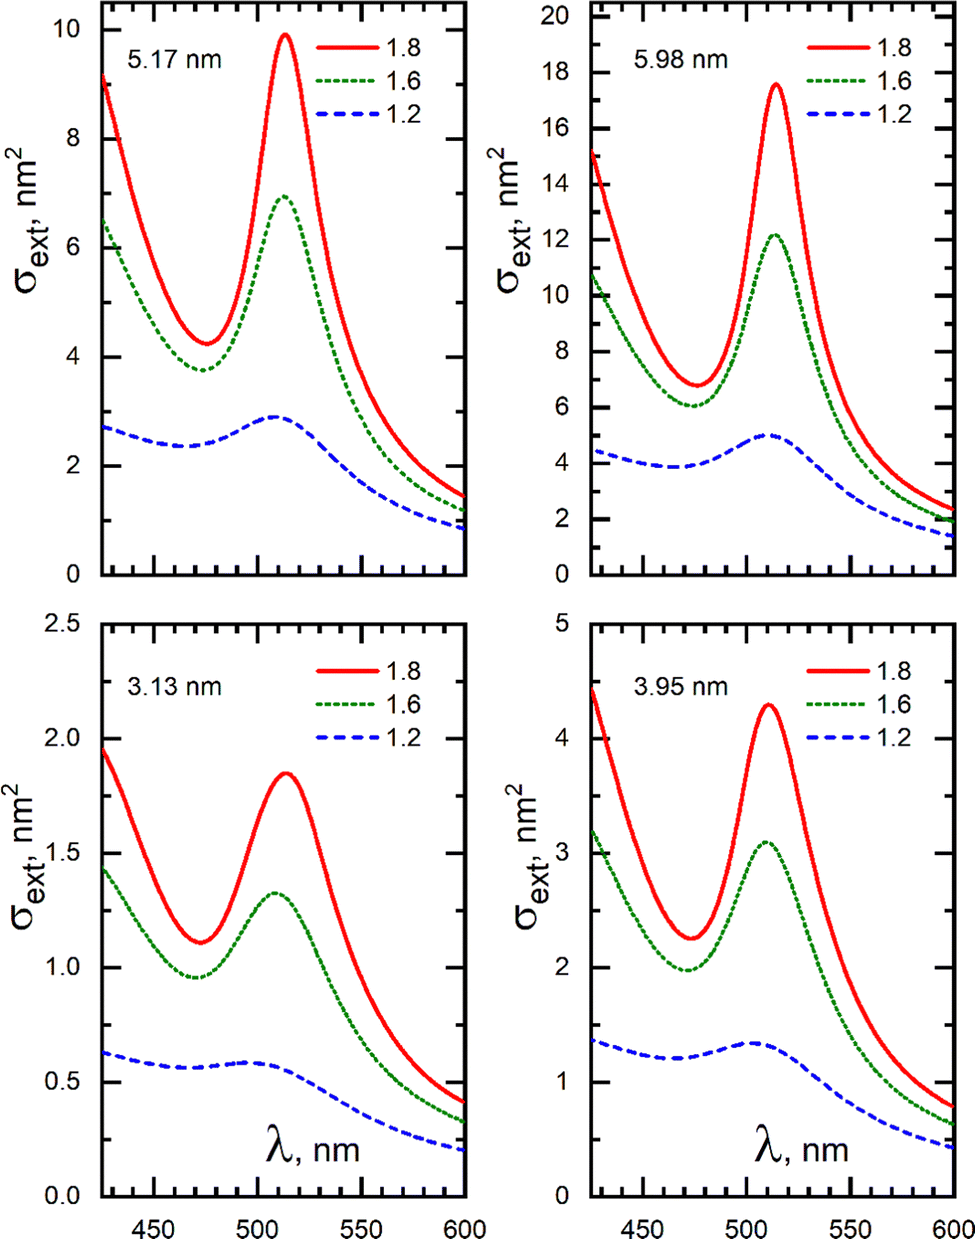 | ||
| Fig. 12 Extinction spectra of Au nanoparticles with diameters of 3.13, 3.95, 5.17, 5.98 nm in ambient media with refractive index of n = 1.2; 1.6; 1.8 (for each of the nanoparticle size the maximum value on the scale of the extinction cross-section is twice as large as for a previous smaller particle). | ||
Importantly, the red shift in smaller particles is noticeably greater with the same refractive index of the ambient medium indicating an increasing influence of the surface layer. It correlates with Fig. 3 – an increase in the particle size is accompanied by a slowdown in the size dependence of the red shift in the environment with a given refractive index, which is associated with a decrease in the relative volume of the surface layer and its contribution, as a shell, to the position of the plasmon resonance maximum.
If we proceed from the fact that the orientational ordering of atomic dipoles in a nanoparticle corresponds to a higher polarization and therefore to a higher dielectric constant and, vice versa, the disordered dipoles in the surface layer reduce the optical response of such a medium, its polarization, and dielectric constant, in this case we have a core–shell structure: a core with high dielectric constant (real part) and a shell with low dielectric constant. In such a model, an increase in the thickness of the shell (surface layer) of a particle with a given size and with a lower (compared to a core) dielectric constant (real part) is always accompanied by an increase in the spectral red shift of the surface plasmon resonance.31
It should be noted the possible difference in the plasmonic spectra of identical hydrosols observed in experiments, even with the same refractive index of ambient medium. This may occur if the red shift of plasmonic resonance is due to two factors: the refractive index of the homogeneous interparticle medium and an additional local increase in the refractive index in the thin optically dense (e.g., polymer) adsorption layer of nanoparticles. In this case, a nanoparticle should be also regarded as a “core–shell” structure with its intrinsic red shift immersed in a homogeneous dielectric medium, which creates an additional size independent red shift.47,48 In each case, this requires a more precise calculation.
Electrostatically stabilized hydrosols contain nanoparticles with a rarefied double electric layer consisting of hydrated ions.49 This type of adsorption layers, even its dense near-surface part does not significantly change the dielectric properties of the local medium near the particle surface compared to the aqueous interparticle homogeneous medium itself and has no significant effect on the position of the plasmon maximum.
Fig. 13 shows the dependence of e refractive index sensitivity (RIS) on the particle diameter for an aqueous medium obtained using the Mie theory with size correction for the Au dielectric constants by Karimi32 in the size range D = 5–25 nm covering the ultra-fine particle size range 5–10 nm (see also comments to Fig. 1). Two opposite trends are found in the dependence—a decrease in RIS in the ultra-fine size range and an increase in RIS in the large particle range up to 60 nm. These two trends converge at the minimum. The anomaly in the ultra-fine range is observed only at small refractive index values n ≤ 1.33.
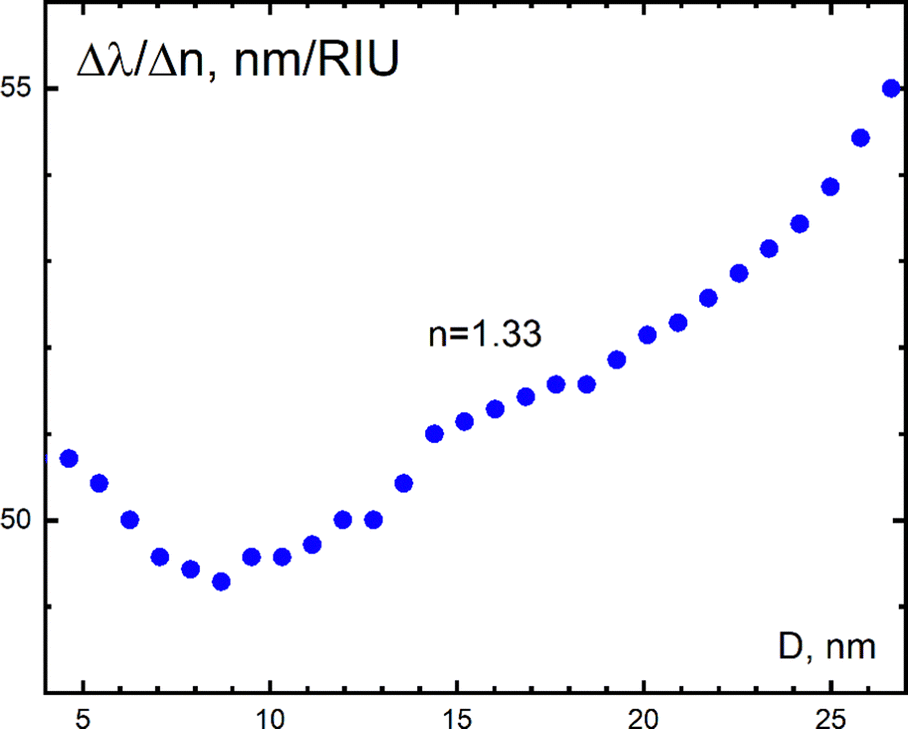 | ||
| Fig. 13 Non-monotonic dependence of the refractive index sensitivity (RIS) of Au nanoparticles in the size range 5–27 nm at the refractive index of aqueous medium (n = 1.33). The Mie theory calculations with size correction for the Au dielectric constants by Karimi.32 | ||
Fig. 14 demonstrates the dependence of RIS on the particle diameter for aqueous media obtained with Ex-DIM in the ultra-fine particle range. In fact, this is an enlarged fragment with the anomalous behavior in Fig. 13 within the 5–10 nm range. The maximum particle size of 10–12 nm for calculations using Ex-DIM is limited by computational capabilities.
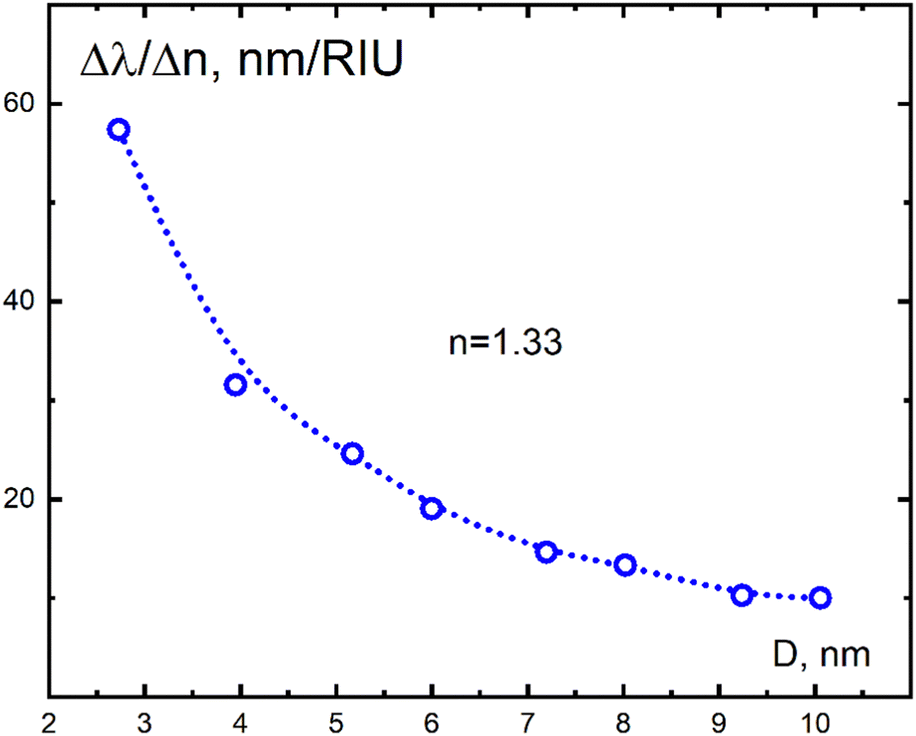 | ||
| Fig. 14 Dependence of the refractive index sensitivity (RIS) of Au nanoparticles on the nanoparticle size in the range 2.73–10 nm (an enlarged fragment of Fig. 13 in the ultra-fine size range 5–10 nm) at the refractive index of aqueous medium (n = 1.33). Ex-DIM calculations. | ||
The anomaly in the dependence in Fig. 13 and 14 finds an explanation within the Ex-DIM framework. This may be due to the fact that as the radius (R) of the particle grows, the relative extent of its surface layer (ΔR/R) rapidly decreases, taking into account the fact that the extent ΔR weakly depends on the radius at a given value n (see Fig. 8). This means that the contribution of the surface layer to the red shift31 reduces with increasing particle radius. Note that Fig. 13 and 14 describe only trends and the data can at this point not be considered as a strict quantitative description. Additional research is required to establish the reasons for the difference in RIS magnitudes in the size range of 8–10 nm in the calculations using Ex-DIM and the Mie theory, which may be related to differences in the physical mechanisms underlying the models.
If we focus on the potential applications of the results obtained in our work, we should note the following. Since our work is devoted to ultra-fine Au plasmonic nanoparticles, in which, unlike large plasmonic nanoparticles, different physical mechanisms are responsible for the red shift, practical applications of the results in future experimental studies may be quite specific. First of all, application can be related to such unique property of ultra-fine nanoparticles as their enhanced permeability. Such nanoparticles can penetrate the pores of biological cell membranes and provides conditions for intracellular laser hyperthermia of the malignant cells,50 as well as for targeted drug delivery. This is the basis for their applications in nanobiomedicine.
The use of ultra-fine plasmonic nanoparticles to increase the sensitivity of the SERS analyses for detection of ultra-small impurities is also specific, since the area of maximal localization of the electromagnetic field near the nanoparticle surface is located not on its surface, but at a certain distance from it. This means that the molecular impurity must lie slightly above the particle surface. To account for this, the particle surface, usually used as the field concentration area in the SERS analysis, must be coated in advance by a thin layer of some inert material with definite properties. However, the presence of an optically dense adsorption layer on the particle surface results in an additional red shift, along with the red shift on account of a liquid environment. If the size of the impurity molecule exceeds the extent of the maximum field concentration area, the optical signal is coming from the part of the molecule entering this area.
It is also notable that if ultra-fine nanoparticles are used for analytical purposes, it is useful to take into account that the sensitivity of these methods depends on the refractive index of the ambient medium: the larger the refractive index, the higher the local field around a nanoparticle, and the higher the sensitivity of the impurity detection method.
The information obtained can motivate the development of complex multifunctional nanostructures with tunable surface plasmon resonance.
4 Conclusion
This work was motivated by the fact that plasmonic spectra and, in particular, shifts of plasmonic bands of metallic nanoparticles are commonly used as sensitive probes to organic environments. For bioimaging applications there is a definite advantage of using ultra-fine (≤10 nm) nanoparticles as these more easily can move into cell channels, clefts and pockets, and as they are more easily rinsed from the body. While there is clear evidence that the understanding for large particles can be obtained through classical models of light-matter interaction, this is not fully the case for the smaller particles, where applications of either classical or quantum methods are limited. The motivation of this paper was thus to obtain a deeper explanation of the behaviour of ultra-fine nanoparticles with respect to the character of a medium in order to advance the utility of such nanoparticles for imaging and sensing. We use for the purpose an atomically resolved, semi-empiric, discrete interaction, method, previously presented by the authors,29 but which here is updated for parametrization of the dependence of a medium.We find that when a plasmonic nanoparticle is immersed in a dielectric medium the environment leads to an increase in the amplitude of the plasmon resonance and a shift towards the long wavelength range. This is due to an increase in the local field inside the dielectric cavity, co-directional with the incident field, which is associated with the emergence of a dipole-polarized layer of molecules located on the inner surface of the cavity. This field grows with the increase in the refractive index of the dielectric medium, which in turn is associated with higher polarizability of the molecules of such a medium at the plasmon resonance wavelength. The difference in the medium effect in ultra-fine and large plasmonic nanoparticles can here be compared with the corresponding difference in the spectral red shift. This red shift is noticeably larger for ultra-fine nanoparticles than for large ones of moderate size (assuming the same refractive index of the ambient medium), that indicates an increasing influence of the surface layer, see also ref. 10–15. In the case of ultra-fine nanoparticles, the resonance red shift is due to the influence of effects in the nanoparticle surface layer, as its relative volume fraction grows with decreasing size. As the size of the nanoparticles increases from ultra-fine to large, with an inflection point of 2R ≥ 8–10 nm, the surface layer effect is gradually fading. However, it is clear that in the ultra-fine size range, the medium effect dominates the contribution to the local field enhancement compared to the size effect manifested by the red-shift. The local field enhancement inside the cavity amplifies the mechanisms of the red shift.
A consequence of enhanced local field inside the spherical cavity is an increase in the amplitudes of atomic dipoles and their amplified interactions in the nanoparticle. The dipole interactions strengthened by enhanced local field additionally chaotize the dipoles of the surface layer atoms in conditions of local anisotropy of an environment near the particle boundary, which contributes to the penetration of chaotization into deeper layers of the ultra-fine nanoparticle. The local anisotropy of the nanoparticle crystal lattice is a geometric parameter increasing toward its boundary and constitutes the most fundamental factor underlying the physical differences between the ultra-fine nanoparticle surface layer and the core material.
A difference was found in the size dependence of the refractive index sensitivity (RIS) of the plasmon resonance in the ranges from ultra-fine to large sized nanoparticles—RIS changes its trend from decreasing to increasing passing through a minimum. Thus, in the range of ultra-fine nanoparticles below 8 nm the red shift dependence of the plasmon is characterized by a rapid fading with increasing ambient refractive index, which is especially pronounced in the case of the minimum particle sizes. It was found that this fading reduces with the size growth, which may be associated with a decrease in the relative volume of the surface layer with respect to the entire volume of the particles. In this case, the sensitivity to the refractive index reaches a minimum value in the size range of 8–10 nm. According to the available data, e.g.,10,13 with further growth of particle sizes up to 20–30 nm and much above, the sensitivity to increasing refractive index grows again due to enhancement of the local field in the dielectric cavity with increasing refractive index and strengthening of the processes responsible for the red shift of the plasmon resonance maximum in the “large” particle range.51
We believe that the optical response patterns found in our work represent general characteristics of ultra-fine plasmonic nanoparticles composed of different metals, e.g.,52 and can be used for designing or optimizing such particles for particular application purposes.
Conflicts of interest
There are no conflicts of interest to declare.Acknowledgements
[h] DEK, VSG, SVK acknowledge the support of the Russian Science Foundation (project no. 18-13-00363). L. K. S. acknowledges the support of Carl Tryggers Stiftelse, project CTS 18-441. We also acknowledge the Swedish National Infrastructure for Computing (SNIC) at the High Performance Computing Center North (HPC2N) partially funded by the Swedish Research Council through grant agreement no. 2021/3-22.Notes and references
- U. Kreibig and M. Vollmer, Optical Properties of Metal Clusters, Springer Berlin Heidelberg, Berlin, Heidelberg, 1995, vol. 25 Search PubMed.
- V. Klimov, Nanoplasmonics, Jenny Stanford Publishing, 2014 Search PubMed.
- M. M. Miller and A. A. Lazarides, J. Phys. Chem. B, 2005, 109, 21556–21565 CrossRef CAS.
- M. M. Miller and A. A. Lazarides, SPIE Proc., 2005, 5927, 59270D CrossRef.
- T. Jensen, M. Malinsky and C. H. R. van Duyne, J. Phys. Chem. B, 2000, 104, 10549–10556 CrossRef CAS.
- M. D. Malinsky, K. L. Kelly, G. C. Schatz and R. P. V. Duyne, J. Am. Chem. Soc., 2001, 123, 1471–1482 CrossRef CAS.
- N. Nath and A. Chilkoti, Anal. Chem., 2001, 74, 504–509 CrossRef PubMed.
- A. J. Haes, S. Zou, G. C. Schatz and R. P. V. Duyne, J. Phys. Chem. B, 2004, 108, 6961–6968 CrossRef CAS.
- A. Gole and C. J. Murphy, Chem. Mater., 2005, 17, 1325–1330 CrossRef CAS.
- N. G. Khlebtsov, L. A. Trachuk and A. G. Mel’nikov, Opt. Spectrosc., 2005, 98, 77–83 CrossRef CAS.
- M. K. Hongxing Xu, Sens. Actuators, B, 2002, 87, 244–249 CrossRef.
- B. N. Khlebtsov and N. G. Khlebtsov, J. Quant. Spectrosc. Radiat. Transfer, 2007, 106, 154–169 CrossRef CAS.
- M. A. Garcia, J. Phys. D: Appl. Phys., 2011, 44, 283001 CrossRef.
- F. Qin, X. Cui, Q. Ruan, Y. Lai, J. Wang, H. Ma and H. Q. Lin, Nanoscale, 2016, 8, 17645 RSC.
- K. L. Kelly, E. Coronado, L. L. Zhao and G. C. Schatz, J. Phys. Chem. B, 2002, 107, 668–677 CrossRef.
- C. Noguez, J. Phys. Chem. C, 2007, 111, 3806–3819 CrossRef CAS.
- W. Gotschy, K. Vonmetz, A. Leitner and F. Aussenegg, Opt. Lett., 1996, 21, 1099–1101 CrossRef CAS.
- J. Krenn, G. Schider, W. Rechberger, B. Lamprecht, A. Leitner and F. Aussenegg, Appl. Phys. Lett., 2000, 77, 3379–3381 CrossRef CAS.
- M. Mallin and C. Murphy, Nano Lett., 2002, 2, 1235–1237 CrossRef CAS.
- J. J. Mock, D. R. Smith and S. Schultz, Nano Lett., 2003, 3, 485–491 CrossRef CAS.
- C. Yu, R. Schira, H. Brune, B. von Issendorff, F. Rabilloud and W. Harbich, Nanoscale, 2018, 10, 20821–20827 RSC.
- A. Shafiqa, A. A. Aziz and B. Mehrdel, J. Phys.: Conf. Ser., 2018, 1083, 012040 CrossRef.
- H. B. Jeon, P. V. Tsalu and J. W. Ha, Sci. Rep., 2019, 9, 13635 CrossRef.
- A. Yuksel, M. Cullinan, E. T. Yu and J. Murthy, J. Quant. Spectrosc. Radiat. Transfer, 2020, 254, 107207 CrossRef CAS.
- H. Chen, X. Kou, Z. Yang, W. Ni and J. Wang, Langmuir, 2008, 24, 5233–5237 CrossRef CAS PubMed.
- A. D. McFarland and R. P. V. Duyne, Nano Lett., 2003, 3, 1057–1062 CrossRef CAS.
- D. V. Guzatov, S. V. Gaponenko and H. V. Demir, Z. Phys. Chem., 2018, 232, 1431–1441 CrossRef CAS.
- F. Qin, X. Cui, Q. Ruan, Y. Lai, J. Wang, H. Ma and H. Q. Lin, Nanoscale, 2016, 8, 17645 RSC.
- V. I. Zakomirnyi, Z. Rinkevicius, G. V. Baryshnikov, L. K. Sørensen and H. Ågren, J. Phys. Chem. C, 2019, 123, 28867–28880 CrossRef.
- V. I. Zakomirnyi, I. L. Rasskazov, L. K. Sørensen, P. S. Carney, Z. Rinkevicius and H. Ågren, Phys. Chem. Chem. Phys., 2020, 22, 13467–13473 RSC.
- L. K. Sørensen, D. E. Khrennikov, V. S. Gerasimov, A. E. Ershov, M. A. Vysotin, S. Monti, V. I. Zakomirnyi, S. P. Polyutov, H. Ågren and S. V. Karpov, Nanoscale, 2022, 14, 433–447 RSC.
- S. Karimi, A. Moshaii, S. Abbasian and M. Nikkhah, Plasmonics, 2019, 14, 851 CrossRef CAS.
- R. R. Birge, J. Chem. Phys., 1980, 72, 5312–5319 CrossRef CAS.
- B. Thole, Chem. Phys., 1981, 59, 341–350 CrossRef CAS.
- L. Jensen, P.-O. Åstrand, K. O. Sylvester-Hvid and K. V. Mikkelsen, J. Phys. Chem. A, 2000, 104, 1563–1569 CrossRef CAS.
- M. L. Olson and K. R. Sundberg, J. Chem. Phys., 1978, 69, 5400–5404 CrossRef CAS.
- A. Mayer, Phys. Rev. B: Condens. Matter Mater. Phys., 2007, 75, 045407 CrossRef.
- S. Grimme, J. Antony, S. Ehrlich and H. Krieg, J. Chem. Phys., 2010, 132, 154104 CrossRef PubMed.
- E. Ringe, M. R. Langille, K. Sohn, J. Zhang, J. Huang, C. A. Mirkin, R. P. Van Duyne and L. D. Marks, J. Phys. Chem. Lett., 2012, 3, 1479–1483 CrossRef CAS PubMed.
- S. V. Karpov, V. S. Gerasimov, I. L. Isaev and V. A. Markel, Phys. Rev. B: Condens. Matter Mater. Phys., 2005, 72, 205425 CrossRef.
- L. D. Landau, L. P. Pitaevskii and E. M. Lifshitz, Electrodynamics of Continuous Media, Course of Theoretical Physics, Butterworth-Heinemann, 2nd edn, 1984, vol. 8 Search PubMed.
- L. L. Jensen and L. Jensen, J. Phys. Chem. C, 2008, 112, 15697–15703 CrossRef CAS.
- W. Schroeder, K. Martin and B. Lorensen, The Visualization Toolkit, Kitware, 4th edn, 2006 Search PubMed.
- U. Ayachit, The ParaView Guide (Full Color Version): A Parallel Visualization Application, Kitware, Incorporated, 2015 Search PubMed.
- N. A. Mortensen, S. Raza, M. Wubs, T. Søndergaard and S. I. Bozhevolnyi, Nat. Commun., 2014, 5, 3809 CrossRef CAS PubMed.
- S. V. Karpov, V. S. Gerasimov, I. L. Isaev, O. P. Podavalova and V. V. Slabko, Colloid J., 2007, 69, 159–169 CrossRef CAS.
- P. Yu, Y. Yao, J. Wu, X. Niu, A. L. Rogach and Z. Wang, Sci. Rep., 2017, 7, 7696 CrossRef PubMed.
- A. S. Dileseigres, Y. Prado and O. Pluchery, Nanomaterials, 2022, 12, 292 CrossRef CAS PubMed.
- A. P. Gavrilyuk, I. L. Isaev, V. S. Gerasimov and S. V. Karpov, Colloid Polym. Sci., 2019, 298, 1–7 CrossRef.
- A. S. Kostyukov, A. E. Ershov, V. S. Gerasimov, S. A. Filimonov, I. L. Rasskazov and S. V. Karpov, J. Quant. Spectrosc. Radiat. Transfer, 2019, 236, 106599 CrossRef CAS.
- W. T. Doyle, J. Opt. Soc. Am. A, 1985, 2, 1031 CrossRef CAS.
- S. Peng, J. M. McMahon, G. C. Schatz, S. K. Gray and Y. Sun, Proc. Natl. Acad. Sci. U. S. A., 2010, 107, 14530–14534 CrossRef CAS PubMed.
| This journal is © the Owner Societies 2022 |