 Open Access Article
Creative Commons Attribution 3.0 Unported Licence
The structuring effect of the alkyl domains on the polar network of ionic liquid mixtures: a molecular dynamics study†
Valerio
Mazzilli
 ab,
Yanting
Wang
 cd and
Giacomo
Saielli
 *ab
*ab
aCNR Institute on Membrane Technology, Unit of Padova, Via Marzolo, 1 – 35131 Padova, Italy. E-mail: giacomo.saielli@unipd.it
bDepartment of Chemical Sciences, University of Padova, Via Marzolo, 1 – 35131 Padova, Italy
cCAS Key Laboratory of Theoretical Physics, Institute of Theoretical Physics, Chinese Academy of Sciences, 55 East Zhongguancun Road, P. O. Box 2735, Beijing 100190, China
dSchool of Physical Sciences, University of Chinese Academy of Sciences, 19A Yuquan Road, Beijing 100049, China
First published on 19th July 2022
Abstract
By using molecular dynamics simulations, we investigate the structural and dynamic properties of mixtures of 1,3-dimethylimidazolium bis(trifluoromethanesulfonyl)imide, [C1C1im][Tf2N] and 1-dodecyl-3-methylimidazolium bis(trifluoromethanesulfonyl)imide, [C12C1im][Tf2N] (also C1 and C12 in short). Such mixtures feature an imidazolium bistriflimide salt with a very short alkyl chain, not giving rise to any nano-segregation as a pure component, with another one with a longer alkyl chain that exhibits a substantial nano-segregation as a pure liquid. As the mole fraction of the long-chain component C12 is increased, the so-called pre-peak of the structure factor S(q), occurring in the region 1–3 nm−1, shows a shift to higher values of the wavevector q, mirroring a decrease of the corresponding correlation length. Moreover, the intensity of the pre-peak strongly increases with the C12 concentration. These results are in very good agreement with experimental X-ray scattering data in the literature. On the other hand, the diffusion of the ions is found to exhibit a simple behaviour consistent with the increased viscosity of the mixture, and these results are also in good agreement with NMR experimental data from the literature. The simulation results are rationalized as caused by a structuring effect, similar to the hydrophobic effect, of the alkyl domains of the C12 component dissolved in the “solvent” represented by the C1 cation, the Tf2N− anion and the C12 cation head. In short, the exclusion of the alkyl chains from the polar network, a process mostly governed by electrostatic interactions, favours the formation of hydrophobic domains, which in turn exert a structuring effect on the ions of the polar domains, favouring a stronger ionic interaction. This is finally reflected in a shorter correlation length and a higher intensity of the pre-peak of the structure factor S(q) as the C12 mole fraction is increased. At variance with the microscopic structure, the diffusion of all three types of ions is not strongly influenced by the nano-segregation and is essentially dependent on the viscosity of the mixture.
Introduction
Ionic liquids (ILs) are isotropic and fluid condensed phases entirely composed of ions. They are receiving increasing interest from the scientific community mainly because of their outstanding solvent and conductive properties.1 Recent reviews can be found covering the use of ILs as solvents for synthesis and catalysis,2 as electrolytes for energy storage and conversion3 and industrial applications.4 Typically, ILs are composed of relatively large and bulky organic cations, such as N-alkyl imidazolium or N-alkyl pyridinium derivatives, paired with inorganic and generally smaller and rigid anions, such as halides, tetrafluoroborate, hexafluorophosphate and bis(trifluoromethanesulfonyl)imide, also known as bistrifimide or Tf2N or TFSI.5 The last one is, in fact, an example of a rather hydrophobic, large and flexible anion that is capable of significantly extending to lower temperatures, the thermal range of stability of the liquid phase of ILs, thanks to its low charge density and weak coordinating ability.6One of the key properties of ILs is their heterogeneous structure, at the nano-scale level, due to the presence of ionic (polar) parts and hydrophobic alkyl carbon chains (non-polar parts), chemically linked in the same molecule, usually the cation. While ions and alkyl parts would be expected to phase-separate if belonging to different molecules, they instead produce complex nano-segregation in the isotropic phase of ILs, provided that the alkyl chains are of at least four carbon atoms or longer.7 Such micro-heterogeneity has been predicted first by molecular dynamics (MD) simulations8,9 and then experimentally confirmed.10
While the number of pure ILs is certainly large, due to the possibility of pairing together many different cations with several anions, an additional very efficient tool to finetune the physicochemical properties of ILs, such as density, viscosity, conductivity and solvent power, is to mix them together to create mixtures.11 Moreover, since it is possible to mix together ILs sharing a common cation or a common anion, the tuning of the properties can be pushed to a high level of “resolution”, as long as the two systems are miscible. An interesting question, however, arises in cases where ILs with very short alkyl chains, like 1,3-dimethylimidazolium or 1-ethyl-3-methylimidazolium (therefore, systems where nano-segregation is not expected to be found) are mixed with similar systems but having a longer alkyl chain. In this case, how do the structural and dynamic properties change in going from the homogeneous system (pure short-chain imidazolium salt) to the heterogeneous system, that is, their pure long-chain imidazolium counterpart? A word of caution is in order here: although imidazolium salts with much longer alkyl chains than C12 exist (therefore a C12 chain should be called an intermediate alkyl chain), it is known that, also depending on the counter–anion, such systems form ionic liquid crystal phases.12–14 However, we will not consider them here since we wish to avoid the complications due to the formation of long-range orientational and positional order.
An interesting system to study the effect of mixing two ILs sharing a common anion is given by short- and long-chain imidazolium bistriflimide salts. The reason is that N-alkyl imidazolium Tf2N salts have a large and overlapping range of the liquid phase for all chain lengths. Moreover, they are miscible in any proportion. Recently, a few experimental investigations have appeared in the literature concerning mixtures of imidazolium bistriflimide salts, for example, Cabry et al. reported extensive data from SAXS and MD simulations on a mixture of ethyl- and dodecylmetylimidazolium in a range of temperatures.15 Mixtures with longer alkyl chain systems have been investigated by Pontoni et al.16,17 who also observed the formation of smectic layers.
Structural features of 1,3-dimethylimidazolium bistriflimide, [C1C1im][Tf2N], mixtures with 1-dodecyl-3-methylimidazolium bistriflimide, [C12C1im][Tf2N], have been studied by Russina et al.18 using X-ray scattering experiments. The authors have investigated the presence of structural inhomogeneities in the system and how these depend on the composition. They have found that the so-called pre-peak in the scattering function, S(q), around 2–3 nm−1, grows in intensity with increasing mole fraction of the dodecyl component. The pre-peak indicates the existence of inhomogeneities in the density of the liquid mixture and its position with respect to the scattering vector q is related to the size of the inhomogeneities. It has also been found that the position of the peak, that is the value of q corresponding to the maximum of the scattering intensity, linearly depends on the cubic root of the volume fraction of the long-chain component. The authors have explained these observations as a result of correlations between nearest neighbours of aggregates (the alkyl chains) disperse in the “solvent”, that is the polar network made of anions and cationic imidazolium heads.
A very similar mixture with 1-ethyl-3-methylimidazolium, [C2C1im], as the short-chain component instead of 1,3-dimethylimidazolium mixed with 1-dodecyl-3-methylimidazolium, and [Tf2N] and [BF4] as counter–anions, were also studied recently by Di Pietro et al.19 using NMR spectroscopy. In particular, the authors focused on the dynamic properties of the mixtures including NMR relaxation times and diffusion coefficients of cations and anions as a function of the composition. One of the interesting findings is that the two mixtures show a quite different dynamic behaviour, with the tetrafluoroborate systems being mostly dominated by Coulomb interaction, while for the flexible and low charge density bistriflimide case, both Coulomb and van der Waals (VDW) interactions were found to be important in dictating the dynamic behaviour.
It is therefore of interest to investigate mixtures of N-alkylimidazolium bistriflimide salts also from a microscopic point of view in order to shed light on two important issues: (i) what is the microscopic mechanism responsible for the formation of the pre-peak in the structure factor S(q) and its peculiar dependence on the C12 concentration? (ii) what is the relationship between structural and dynamic properties of mixtures of these ILs? Are they affected in the same way by the increasing concentration of the long-chain component?
Here we present the results of fully atomistic MD simulation of structural and dynamic properties of the mixtures of 1,3-dimethylimidazolium, [C1C1im], and 1-dodecyl-3-methylimidazolium, [C12C1im], having bistrifimide as the counter–anion, in a range of compositions, from pure [C1C1im][Tf2N] to pure [C12C1im][Tf2N]. We have used a force field (FF) developed by Köddermann et al.20 specifically tuned to quantitatively reproduce both structural and dynamic properties of imidazolium bistrifimide ILs. Although the FF is non-polarizable, since the anion is very weakly coordinating and has a relatively low charge density, the authors have successfully parameterized the FF in order to obtain a quantitative agreement concerning diffusion coefficients.20,21 Therefore, we are quite confident that the result of the MD simulations will be able to describe quantitatively at a microscopic level the systems investigated and to draw insightful conclusions on the structure and dynamics of the mixtures.
Computational details
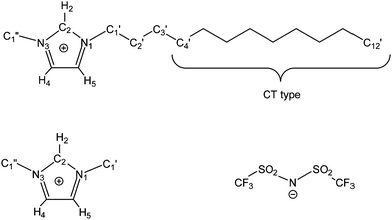
We prepared 11 simulation boxes of mixtures of [C1C1im][Tf2N] and [C12C1im][Tf2N] (C1 and C12 in short, hereafter, see also Fig. 1) with the C12 mole fraction xC12 ranging from 0.0 (pure C1) to 1.0 (pure C12) in step 0.1. Some details are reported in Table 1.| X C12 | N C1–NC12 | L/nm | q min/nm−1 |
|---|---|---|---|
| 0.0 | 3000–0 | 10.9143 | 1.151 |
| 0.1 | 2250–250 | 10.5338 | 1.193 |
| 0.2 | 1600–400 | 10.0122 | 1.255 |
| 0.3 | 1120–480 | 9.5021 | 1.322 |
| 0.4 | 600–400 | 8.2946 | 1.515 |
| 0.5 | 500–500 | 8.4570 | 1.486 |
| 0.6 | 400–600 | 8.6135 | 1.459 |
| 0.7 | 300–700 | 8.7651 | 1.434 |
| 0.8 | 200–800 | 8.9105 | 1.410 |
| 0.9 | 100–900 | 9.0517 | 1.388 |
| 1.0 | 0–1000 | 9.1886 | 1.368 |
The simulation boxes were built by randomly placing the appropriate number of C1 and C12 cations and Tf2N− anions in a large box (13–15 nm of the box size) using Packmol.22 For mixtures rich in the smaller size component, we used a larger total number of ion pairs to guarantee that the structure factor could be calculated up to a sufficiently small value of the scattering vector q. The systems first went through an energy minimization and then were simulated at T = 800 K for 5 ns in the NVT ensemble, followed by 2 ns at 700 K, 2 ns at 600 K, and 2 ns at 500 K simulations in cascade in the NPT ensemble at P = 1 atm using the Berendsen thermostat and barostat.23 Finally, the boxes were equilibrated for 20 ns at 400 K in the NPT ensemble. The last 10 ns of this run were used to evaluate the average box size to be fixed in the subsequent production NVT runs.
The final production runs, for all the systems, were obtained in the NVT ensemble with a timestep of 1 fs integrated with the leap-frog method at 400 K for 5 × 10⁷ steps, producing simulations of 50 ns. The cut-off distance for both Coulombic and VDW interactions was set to 1.4 nm, and the electrostatic interactions beyond this threshold were calculated using the Particle Mesh Ewald method with a grid spacing for FFT of 0.16 nm. All the simulations were carried out using GROMACS24–27 and the FF employed in the simulations was the one proposed by Köddermann et al.20 for short-chain imidazolium bistriflimide salts and extended to longer chains simply by replicating the methylene parameters. The FF is a refinement of the one developed by Canongia Lopes et al.,28 performing particularly well not only for structural properties, but also for dynamic properties even though it is a non-polarizable one.20,21 Nonetheless, in order to speed up the dynamics, we run all simulations at 400 K rather than room temperature. While this choice is expected not to significantly impact the structural properties of the mixtures, it does allow a faster equilibration and exploration of the phase space.
Average properties were calculated using the production run where the configurations were saved every 5 ps. The radial distribution functions (RDFs) and mean square displacements (MSDs) were obtained using the GROMACS built-in utilities. The diffusion coefficients D of the three types of particles were then obtained by a linear fit of the MSD in the range of 5–45 ns according to the Einstein relation MSD = 6Dt, where t is the time interval. Several structural properties were obtained using the software package TRAVIS.29,30 The analysis in TRAVIS was performed on a 100-frame trajectory sampled every 0.3 ns. In particular, we have calculated the X-ray structure factor S(q)31 and the alkyl domain distribution and size.32 The S(q) is calculated starting from the theoretical structure factor I(q) defined as:
 | (1) |
 | (2) |
 | (3) |
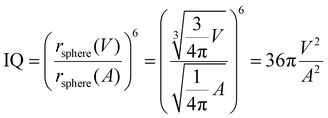
As have been reported in the work of Kirchner et al.,31 the domain analysis implemented in TRAVIS is based on the radical Voronoi tessellation, whose full description can be found in ref. 33–35. The Voronoi domains are composed of multiple Voronoi sites. In this study, every atom is a site, and it is surrounded by a Voronoi polyhedron or a Voronoi cell, which is built by using the VDW radius of the corresponding atom. Each of the polyhedron face is in contact with other Voronoi cell's faces. If the two Voronoi cells belong to the same group, i.e. cells built around the same alkylic carbon, and have a shared cell face, they merge together and enlarge that domain extent. The separation of different Voronoi cells of molecules is found to be a reliable method for domain search even in bulk phases.36 In this study, this method is applied to get insights into the alkyl domains within the system. Domains are composed of a discrete number of cells and their surface area A and volume V are calculated by summing these contributions. Moreover, the isoperimetric quotient (IQ) is defined as:
 | (4) |
The heterogeneity order parameter (HOP), first introduced by Voth and Wang,37 has been used to calculate the degree of deviation of the spatial distribution of the terminal methyl carbons on alkyl chains with respect to a perfectly random distribution. It is defined as:
 | (5) |
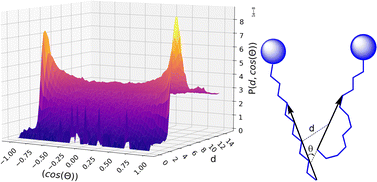
Finally, the orientational distribution of the relative molecular orientation has been calculated using a home-made code: we define the vector connecting carbon C4′ of the alkyl chain (the first CT type carbon atom of the chain, see Fig. 1) with the terminal methyl carbon, C12′, as the main chain vector. We also calculated its mid-point, which basically corresponds to the coordinate of C8′ for an all-trans alkyl chain but might be different for a chain with several gauche conformations. Then we calculated the probability distribution P(θ, R) to find two chain vectors at an angle θ and with their mid-points at a distance R.
Results and discussion
Structural properties
We begin our analysis by looking at the structural properties of the mixtures using some selected RDFs between atoms of the anion, cation and alkyl chain, along with the inspection of some snapshots. Fig. 2 and 3 show the RDFs of the ionic portion of the molecules, while Fig. S1 in the ESI† shows the RDFs involving the terminal methyl carbon of the alkyl chains in [C12C1im] molecules.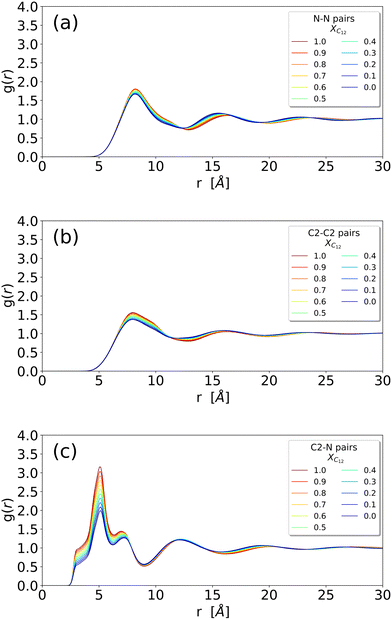 | ||
| Fig. 2 (a) RDF of the N–N distance between two anions; (b) RDF of the C2–C2 distance between two imidazolium heads (irrespective of being [C12C1im] or [C1C1im]); (c) RDF of the N–C2 distance between an anion and an imidazolium head (irrespective of being [C12C1im] or [C1C1im]) (see Fig. 1 for atom labelling). | ||
The different systems behave similarly when regarded at a close range without substantial differences in the shape of the RDFs. The close-range pattern of cation and anion is, therefore, present in all the systems, see Fig. 2(c). However, a closer inspection reveals an interesting trend: in Fig. 3 we show the cation–anion RDF (calculated between the carbon C2 on the cationic ring and the nitrogen on the anion) for various systems. The RDFs are normalized with respect to the height of the first peak at around 5 Å (Fig. 3(a)) and with respect to the height of the second peak at around 7 Å (Fig. 3(b)) in order to better see the relative positions of the peaks. It is clear that, by increasing the mole fraction of C12, the peaks shift towards shorter distances, indicating a stronger cation–anion interaction. This is clear both in Fig. 3(a) where, though the maximum does not change significantly, the sides of the peak at around 5.5 and 4.5 Å are shifting to the left with increasing C12 mole fraction, and more clearly in Fig. 3(b) where the maximum of the peak is clearly dependent on the mixture composition, see also Table S1 (ESI†) for an estimate of the position of the maxima. This trend of a closer cation ring–anion interaction is confirmed by the inspection of the RDF of the nitrogen of the anion with the other two carbons of the ring, see Fig. S2 in the ESI,† where the relative intensity of the shoulder at short distances (around 3.50 Å) increases with increasing mole fraction of C12. Therefore, it appears that the growth of the alkylic domains is responsible for a stronger structuring of the polar network.
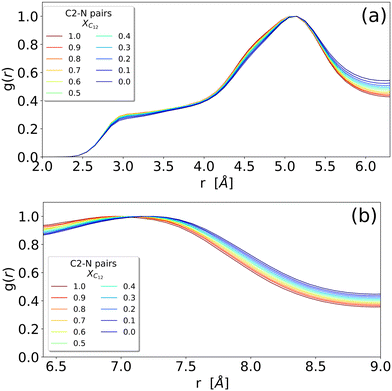 | ||
| Fig. 3 Enlarged versions of the (c) panel of Fig. 2 representing the RDF of the N–C2 distance between an anion and an imidazolium head (irrespective of being [C12C1im] or [C1C1im]) (see Fig. 1 for atom labelling). RDFs are normalized by the height of the respective peaks: (a) the peak around 5 Å and (b) the peak around 7 Å. | ||
The RDFs involving the terminal methyl group of C12 can be found in the ESI,† Fig. S1, and reveal a limited structure, as expected for a liquid phase.
In Fig. 4 we show some selected snapshots of the boxes highlighting the alkyl chains of [C12C1im].
 | ||
| Fig. 4 Snapshots of the equilibrium boxes at 400 K for compositions xC12 of (a) 0.1; (b) 0.2; (c) 0.5; and (d) 0.9. Alkyl chains (CT type carbons) are highlighted in blue while the rest of the atoms (ionic parts) are in yellow. The two sets are represented as a surface probed by particles with a radius of 0.14 nm. Snapshots have been generated using the VMD software.38 | ||
A certain degree of chain aggregation appears early with increasing the C12 mole fraction. To have a deeper understanding of the aggregation of alkyl chains, a feature which has been extensively documented for pure ILs both from MD simulations8,9,39 and experiments,10 we have calculated the HOP introduced by Voth and Wang.37 This parameter, see eqn (5) in the Computational details section, measures the degree of aggregation of particles in a given volume. For a perfect random distribution of positions, it is scaled to zero by subtracting the asymptotic values. A HOP larger than 1 indicates a certain degree of aggregation of the particles. In Fig. 5 we show the trend of the HOP of the terminal methyl group on the alkyl chain of the [C12C1im] cation for various compositions.
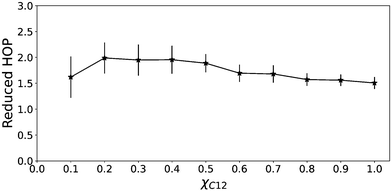 | ||
| Fig. 5 Heterogeneity order parameter of the terminal methyl of the alkyl chain of C12 as a function of the C12 mole fraction. | ||
As we can see, it appears that the HOP goes through a weak maximum. This profile suggests a competition between two opposite trends. On the one hand, at low C12 mole fractions, the “hydrophobic” effect favours the aggregation of the relatively few alkyl chains and the ensuing nano-segregation from the ionic parts. This mechanism was proposed already by Wang and co-workers in ref. 40 where the authors observed that the nano-segregation of alkyl chains in pure ILs is mostly driven by the strong electrostatic interactions of the ionic parts which “push” away the non-polar moieties, rather than by VDW interactions among the chains themselves. This aggregation increases with increasing C12 mole fraction. However, at the same time, the methyl terminal group used as a probe of the chain aggregation is also diluted within the increasingly large alkyl domains. Therefore, the HOP appears only slightly varying with the composition due to these two opposite effects.
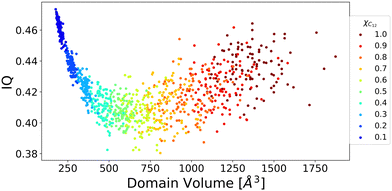
To further shed light on this issue, domain analysis was performed according to the theoretical description reported in the Computational section. Fig. 6 shows the domain's volume versus its IQ, which is used to describe the sphericity of a domain in IL simulations. The closer to 1 the numerical value, the more spherical in shape the domain is. A large deviation from 1 indicates an aspheric domain.
The calculated volumes and IQs suggest that, as expected, the size of the alkyl domains as well as the distribution of sizes increases with increasing C12 concentration, as suggested by the spread of the volume values for large C12 compositions. At the same time, the domains always appear far from a spherical shape, which can be attributed to the possibility of the alkyl chains to align roughly parallel to each other. To get insight into the chains’ arrangement within the alkyl domains, a distance-orientation analysis is performed for the system with composition xC12 = 0.80 as a representative example. The chains in these domains are in fact more likely to be aligned parallel or antiparallel to each other as it can be seen from Fig. 7, where the probability distribution of distance and orientation of side chains is reported. The probability exhibits a clear peak in intensity at a relatively close distance between the alkyl chains for orientations with cos(θ) = ±1, which corresponds to the two vectors highlighted in Fig. 7 (and defined in the Computational section) being parallel or antiparallel.
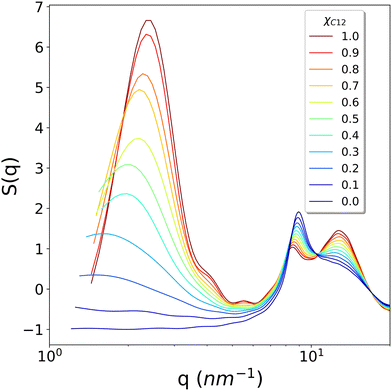
To conclude the structural analysis, the calculated X-ray structure factor S(q) for all the systems is shown in Fig. 8. For pure C1, a simple fluid with no nano-domain segregation, we observe that the whole region between the smallest available wavevector (1.151 nm−1) up to about 7 nm−1 is completely flat, indicating that no inhomogeneities are present in the fluid, as in simple organic molecular solvents. In contrast, for pure C12, we observe a well-defined intense pre-peak centred at around 2.3 nm−1, nonetheless still quite broad due to the liquid nature of the phase. On decreasing the mole fraction xC12, we observe a broadening of the pre-peak, a shift to lower q values and, most important, a gradual decrease of the intensity until the pre-peak disappears for systems with xC12 = 0.1 and 0, at least within the range of wavevectors available from the simulations. Remarkably, the loss of intensity does not show any abrupt change, but rather decreases regularly with the composition.
The calculated profiles well reproduce the experimental trends reported by Russina et al.18 who measured small angle X-ray scattering of [C12C1im]/[C1C1im][Tf2N] mixtures and noticed the growth of a peak in the region with q < 3 nm−1. This behaviour of S(q) is explained by Russina et al. by means of interacting pseudospherical aggregates. The pre-peak's q position contains the information about the distance between interacting pseudospherical aggregates while its broadening determines whether this distance peaked around certain values as in rich C12 mixtures, or it spans several q values as the content of C12 decreases. The substantial increment of the pre-peak, as the C12 mole fraction is increased, is therefore due to a “structuring” effect (akin to the hydrophobic effect when a non-polar molecule is solvated by water) of the ionic domains where the alkyl domains act as spacers. Again, this interpretation is also consistent with the proposed predominant role of the electrostatic interactions as the driving force for the nano-segregation in pure ILs reported in ref. 40.
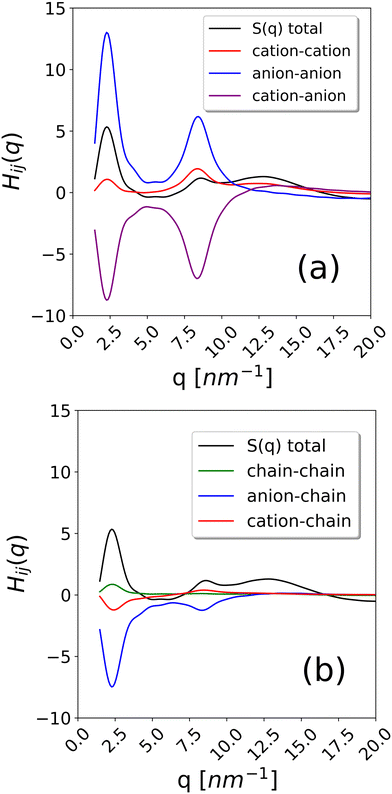
To further examine this issue, we have calculated the contributions to the total S(q) coming from cation–cation, anion–anion, cation–anion, chain–cation, chain–anion and chain–chain correlations. They are reported in Fig. 9 for the system with composition xC12 = 0.80 as an example. As it can be observed, the strongest positive contribution comes from anion–anion correlations, while the cation–cation correlations are also significant but negative. Weaker contributions are obtained from the chains. This confirms the interpretation of the alkyl domains being a sort of structuring agent of the ionic polar network, which, in turn, is the main resource responsible for the scattering intensity in the pre-peak region.
Finally, the position of the pre-peak as a function of the cubic root of C12 volume fraction,  , is depicted in Fig. 10, where we observe a linear dependence of the pre-peak position on the parameter
  . This trend, reported by Russina et al. in ref. 18, is reproduced almost quantitatively and might be attributed to the fact that alkyl domains on average stay closer as the content of C12 increases. Their structuring effect on the polar network then results in a closer packing of ions around the hydrophobic domains which is reflected in a larger value of the scattering vector. This interpretation of the results is supported by the RDFs shown in Fig. 3 which highlights a closer ionic interaction as the content of C12 increases.
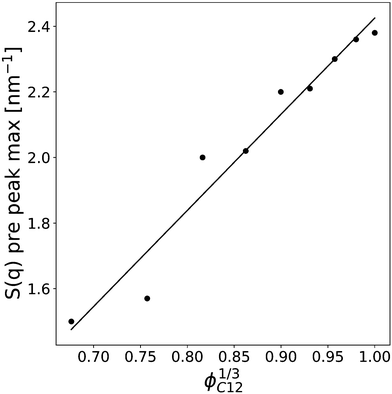 | ||
Fig. 10 The pre-peak position of the simulated systems (except for xC12 of 0.1 and for pure C1) are reported against the cubic root of the C12 volume fraction,  . . | ||
Dynamic properties
We now turn our attention to the dynamic properties of the mixtures. In Fig. 11 we show the diffusion coefficients D obtained by a linear fit of the MSD (see the Computational details section) for the three types of ions present in the mixtures. The diffusion coefficients appear to decrease rather smoothly with increasing C12 mole fraction because heavier cations make the movements of all ions slower. D(C12) is scaled by a factor of about 0.50 compared to D(C1) while it appears to be scaled by a factor of about 0.75 compared to the bistriflimide anion, see Table S2 in the ESI.† This is something that can be expected based on the Stokes–Einstein relation for the diffusion coefficient D of a particle with radius r in a medium with viscosity η, | (6) |
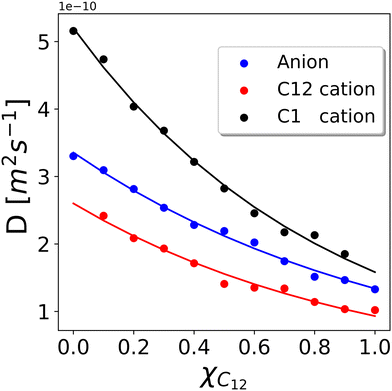 | ||
| Fig. 11 Diffusion coefficients D calculated according to the MSD of the C2 atoms representing cations and the MSD of the N atoms representing anions. The error bar has been estimated to be ±0.1 × 10⁻¹⁰ m2 s−1 by running three independent runs of the xC12 = 0.5 system. Solid lines are the fitting using the Grunberg and Nissan mixing law given in eqn (7). | ||
The solid lines in Fig. 11 represent a fitting using the Grunberg and Nissan mixing law42 which only involves the viscosities, η1 and η2, of the two pure phases to predict the viscosity η of the mixture:
 | (7) |
Assuming the validity of the Stokes–Einstein relation, eqn (6), for the diffusion coefficient, eqn (7) can be easily recast in a similar expression for D of a given molecule in the mixture as a function of D of the same molecule in the pure systems. This also allows estimating the infinite dilution limit of the diffusion coefficient of C1 in pure C12 and that one of C12 in pure C1, which are not available from the simulations. The values in the pure systems obtained from the fitting are reported in Table 2.
| Pure C12 | Pure C1 | |
|---|---|---|
| [Tf2N] | 1.34 | 3.35 |
| C12 | 0.93 | 2.60 |
| C1 | 1.58 | 5.20 |
Although the values of the diffusion coefficients qualitatively match the expected behaviour for different sizes of the ions and the viscosity of the mixture, it is worth mentioning that an unusual trend has been observed both from experiments43 and simulations44 in some ILs, where the larger cations have been observed to diffuse faster than the smaller anions, as an example in 3-ethyl-1-metylimidazolium tetrafluoroborate. The existence of partially arrested states, where the anions form a glassy network while the cations are still fluid, has been proposed as an explanation for such behaviour.44 In the present case, however, we expect to be far from the glass transition so that a normal behaviour simply dependent on the viscosity and the molecular size is observed. In fact, the ratio of the three diffusion coefficients is quite constant through various compositions (see Table S2 in the ESI†), suggesting that they are simply rescaled by the viscosity of the mixture that varies as a function of the composition.
The overall picture is that the dynamic properties of the constituent ions are not significantly affected by the nano-segregation and heterogeneous structure of the mixed systems. The very same behaviour was experimentally observed in mixtures of [C12C1im] with 1-ethyl-3-methylimidazolium salts (while in our simulations and in the experiments of ref. 18 the long-chain dodecylimidazolium is mixed with dimethylimidazolium) and bistriflimide.19 Similar to our results, the diffusion coefficients of the short- and long-chain cations varied smoothly with the composition following the viscosity change, while the anion was found in all cases to have an intermediate diffusion coefficient between the two cations.19
Conclusions
The results of our fully atomistic MD simulations of mixtures of [C1C1im][Tf2N] and [C12C1im][Tf2N] at various compositions show a very good agreement with the experimental results of Russina et al.18 concerning the trend in the intensity and position of the pre-peak in the X-ray structure factor S(q). Our results are also fully consistent with the experimental diffusion coefficient trends for similar mixtures reported by Di Pietro et al.19 This, on the one hand, confirms the goodness of the FF by Köddermann et al.20 for the description of both structural and dynamic properties of mixtures of bistriflimide imidazolium salts, while on the other hand, it gives a detailed microscopic description of the systems.What we can learn from the simulations is first, where the contributions to the structure factors S(q) come from. In agreement with previous studies of pure ILs, the anion–anion correlations are the most important positive contribution to the X-ray structure factor.45
The pre-peak maximum of the scattering is dependent on the mixture composition and varies from about 2.4 nm−1 in pure C12 to 1.5 nm−1 for the lowest C12 mole fraction when the pre-peak is still observable, that is xC12 = 0.2. These extreme values of the scattering factor correspond to correlation lengths from about 2.6 nm for the pure C12 to 4.2 nm for the diluted mixture, although in the last case the peak is very broad, and a proper determination of the maximum is necessarily affected by a large uncertainty. Nonetheless, the trend is clear from Fig. 10. By combining this result with the trend of the HOPs and the visual inspection of the snapshots, we can interpret them to be due to the fact that smaller and smaller aggregates of alkyl chains, when the mole fraction of C12 decreases, are more and more dispersed within the “solvent” represented by the anions and charged imidazolium heads. In contrast, by increasing the C12 content, the larger hydrophobic domains of alkyl chains have a secondary effect of reinforcing and increasing the structure of the polar domains. This is similar to that observed in the hydrophobic effect when water molecules belonging to the solvation shell of an apolar molecule establish a stronger network of hydrogen bonds compared to bulk water.
On the other hand, the complexity of the structure is not reflected in the dynamic behaviour. Diffusion coefficients follow a simple viscosity dependence on the mixture composition and the growing network of polar domains and alkyl chain aggregates does not seem to impact the diffusion of cations and anions except for the increased viscosity of the mixture.
Although this result might not appear too surprising, it is worth recalling here that the diffusion of a non-ionic probe like Xe in ionic liquids has been recently found to strongly depend on the nano-structuring of polar and hydrophobic domains.21,46 For example, for Xe dissolved in [CnC1im]Cl and [CnC1im][PF6], both 129Xe NMR experiments and MD simulations revealed that D(Xe) was increasing with increasing chain length, while D(ions) and IL viscosity are actually decreasing.46 In other words, the diffusion of Xe was faster in the more viscous systems, which is more evident for the chloride salts and less pronounced, though still present, for the hexafluorophosphate systems. On the other hand, a “normal” trend with respect to the viscosity was found, again both from NMR experiments and MD simulations, for Xe dissolved in pure [CnC1im][Tf2N].21 The above results highlight the importance of a close and detailed analysis of diffusion data in these complex ionic systems.
Conflicts of interest
There are no conflicts to declare.Acknowledgements
Simulations were run in part on the CINECA supercomputers through ISCRA project no. HP10B8AOVV and in part on the Linux clusters of the C3P Computational Community of the Department of Chemical Sciences of the University of Padova.The authors thank the Italian National Research Council and the Natural Science Foundation of China for financial support through the bilateral agreement CNR-NSFC 2021-2022, NSFC grant No. 22011530390. VM thanks ITM-CNR and DSCTM-CNR for sponsoring his PhD fellowship.
Notes and references
- Z. Lei, B. Chen, Y.-M. Y.-M. Koo and D. R. D. R. Macfarlane, Chem. Rev., 2017, 117, 6633 CrossRef PubMed.
- J. P. Hallett and T. Welton, Chem. Rev., 2011, 111, 3508 CrossRef CAS PubMed.
- M. Watanabe, M. L. Thomas, S. Zhang, K. Ueno, T. Yasuda and K. Dokko, Chem. Rev., 2017, 117, 7190 CrossRef CAS PubMed.
- A. J. Greer, J. Jacquemin and C. Hardacre, Molecules, 2020, 25, 5207 CrossRef CAS PubMed.
- T. Welton, Biophys. Rev., 2018, 10, 691 CrossRef CAS PubMed.
- O. Bortolini, C. Chiappe, T. Ghilardi, A. Massi and C. S. Pomelli, J. Phys. Chem. A, 2015, 119, 5078 CrossRef CAS PubMed.
- Y.-L. Wang, B. Li, S. Sarman, F. Mocci, Z.-Y. Lu, J. Yuan, A. Laaksonen and M. D. Fayer, Chem. Rev., 2020, 120, 5798 CrossRef CAS PubMed.
- S. M. Urahata and M. C. C. Ribeiro, J. Chem. Phys., 2004, 120, 1855 CrossRef CAS PubMed.
- Y. Wang and G. A. Voth, J. Am. Chem. Soc., 2005, 127, 12192 CrossRef CAS PubMed.
- A. Triolo, O. Russina, H.-J. Bleif and E. Di Cola, J. Phys. Chem. B, 2007, 111, 4641 CrossRef CAS PubMed.
- H. Niedermeyer, J. P. Hallett, I. J. Villar-Garcia, P. A. Hunt and T. Welton, Chem. Soc. Rev., 2012, 41, 7780 RSC.
- Y. V. Nelyubina, A. S. Shaplov, E. I. Lozinskaya, M. I. Buzin and Y. S. Vygodskii, J. Am. Chem. Soc., 2016, 138, 10076 CrossRef CAS PubMed.
- W. Cao, B. Senthilkumar, V. Causin, V. P. Swamy, Y. Wang and G. Saielli, Soft Matter, 2020, 16, 411 RSC.
- Y. Ji, R. Shi, Y. Wang and G. Saielli, J. Phys. Chem. B, 2013, 117, 1104 CrossRef CAS PubMed.
- C. P. Cabry, L. D’Andrea, K. Shimizu, I. Grillo, P. Li, S. Rogers, D. W. Bruce, J. N. Canongia Lopes and J. M. Slattery, Faraday Discuss., 2018, 206, 265 RSC.
- D. Pontoni, M. DiMichiel and M. Deutsch, J. Mol. Liq., 2021, 338, 116587 CrossRef CAS.
- D. Pontoni, M. DiMichiel and M. Deutsch, J. Mol. Liq., 2022, 355, 118874 CrossRef CAS.
- O. Russina, F. Lo Celso, N. V. Plechkova and A. Triolo, J. Phys. Chem. Lett., 2017, 8, 1197 CrossRef CAS PubMed.
- M. E. Di Pietro, F. Castiglione and A. Mele, J. Phys. Chem. B, 2020, 124, 2879 CrossRef CAS PubMed.
- T. Köddermann, D. Paschek and R. Ludwig, ChemPhysChem, 2007, 8, 2464 CrossRef PubMed.
- G. Saielli, F. Castiglione, M. Mauri, R. Simonutti and A. Mele, ChemPhysChem, 2021, 22, 1880 CrossRef CAS PubMed.
- L. Martínez, R. Andrade, E. G. Birgin and J. M. Martínez, J. Comput. Chem., 2009, 30, 2157 CrossRef PubMed.
- H. J. C. Berendsen, J. P. M. Postma, W. F. van Gunsteren, A. DiNola and J. R. Haak, J. Chem. Phys., 1984, 81, 3684 CrossRef CAS.
- E. Lindahl, M. J. Abraham, B. Hess and D. van der Spoel, GROMACS Source Code, 2020 DOI:10.5281/zenodo.4576055.
- H. J. C. Berendsen, D. van der Spoel and R. van Drunen, Comput. Phys. Commun., 1995, 91, 43 CrossRef CAS.
- M. J. Abraham, T. Murtola, R. Schulz, S. Páll, J. C. Smith, B. Hess and E. Lindahl, SoftwareX, 2015, 1–2, 19 CrossRef.
- S. Páll, M. J. Abraham, C. Kutzner, B. Hess and E. Lindahl, in Solving Softw. Challenges Exascale, ed. S. Markidis and E. Laure, 2015, pp.3–27 Search PubMed.
- J. N. C. Lopes, J. Deschamps and A. A. H. A. H. Padua, J. Phys. Chem. B, 2004, 108, 11250 CrossRef CAS.
- M. Brehm and B. Kirchner, J. Chem. Inf. Model., 2011, 51, 2007 CrossRef CAS PubMed.
- M. Brehm, M. Thomas, S. Gehrke and B. Kirchner, J. Chem. Phys., 2020, 152, 164105 CrossRef CAS PubMed.
- O. Hollóczki, M. Macchiagodena, H. Weber, M. Thomas, M. Brehm, A. Stark, O. Russina, A. Triolo, B. Kirchner, O. Hollõczki, M. Macchiagodena, H. Weber, M. Thomas, M. Brehm, A. Stark, O. Russina, A. Triolo and B. Kirchner, ChemPhysChem, 2015, 16, 3325 CrossRef PubMed.
- M. Brehm, H. Weber, M. Thomas, O. Hollóczki and B. Kirchner, ChemPhysChem, 2015, 16, 3271 CrossRef CAS PubMed.
- B. J. Gellatly and J. L. Finney, J. Mol. Biol., 1982, 161, 305 CrossRef CAS PubMed.
- C. H. Rycroft, Chaos An Interdiscip, J. Nonlinear Sci., 2009, 19, 41111 Search PubMed.
- M. Brehm and M. Thomas, Molecules, 2021, 26, 1875 CrossRef CAS PubMed.
- M. Thomas, M. Brehm and B. Kirchner, Phys. Chem. Chem. Phys., 2015, 17, 3207 RSC.
- Y. Wang and G. A. Voth, J. Phys. Chem. B, 2010, 114, 8735 CrossRef CAS PubMed.
- W. Humphrey, A. Dalke and K. Schulten, J. Mol. Graphics, 1996, 14, 33 CrossRef CAS PubMed.
- J. N. A. Canongia Lopes and A. A. H. Pàdua, J. Phys. Chem. B, 2006, 110, 3330 CrossRef CAS PubMed.
- H.-Q. Zhao, R. Shi and Y. Wang, Commun. Theor. Phys., 2011, 56, 499 CrossRef CAS.
- M. J. Frisch, G. W. Trucks, H. B. Schlegel, G. E. Scuseria, M. A. Robb, J. R. Cheeseman, G. Scalmani, V. Barone, G. A. Petersson, H. Nakatsuji, X. Li, M. Caricato, A. V. Marenich, J. Bloino, B. G. Janesko, R. Gomperts, B. Mennucci, H. P. Hratchian, J. V. Ortiz, A. F. Izmaylov, J. L. Sonnenberg, D. Williams-Young, F. Ding, F. Lipparini, F. Egidi, J. Goings, B. Peng, A. Petrone, T. Henderson, D. Ranasinghe, V. G. Zakrzewski, J. Gao, N. Rega, G. Zheng, W. Liang, M. Hada, M. Ehara, K. Toyota, R. Fukuda, J. Hasegawa, M. Ishida, T. Nakajima, Y. Honda, O. Kitao, H. Nakai, T. Vreven, K. Throssell, J. A. J. Montgomery, J. E. Peralta, F. Ogliaro, M. J. Bearpark, J. J. Heyd, E. N. Brothers, K. N. Kudin, V. N. Staroverov, T. A. Keith, R. Kobayashi, J. Normand, K. Raghavachari, A. P. Rendell, J. C. Burant, S. S. Iyengar, J. Tomasi, M. Cossi, J. M. Millam, M. Klene, C. Adamo, R. Cammi, J. W. Ochterski, R. L. Martin, K. Morokuma, O. Farkas, J. B. Foresman and D. J. Fox, Gaussian 16, Revision B.01, Gaussian Inc., Wallingford CT, 2016 Search PubMed.
- L. Grunberg and A. H. Nissan, Nature, 1949, 164, 799 CrossRef CAS PubMed.
- A. Noda, K. Hayamizu and M. Watanabe, J. Phys. Chem. B, 2001, 105, 4603 CrossRef CAS.
- P. E. Ramírez-González, L. E. Sanchéz-Díaz, M. Medina-Noyola and Y. Wang, J. Chem. Phys., 2016, 145, 191101 CrossRef PubMed.
- H. K. Kashyap, C. S. Santos, H. V. R. Annapureddy, N. S. Murthy, C. J. Margulis and E. W. Castner, Jr., Faraday Discuss., 2012, 154, 133 RSC.
- F. Castiglione, G. Saielli, M. Mauri, R. Simonutti and A. Mele, J. Phys. Chem. B, 2020, 124, 6617 CrossRef CAS PubMed.
Footnote |
| † Electronic supplementary information (ESI) available: Additional RDF figures and diffusion data. See DOI: https://doi.org/10.1039/d2cp02786k |
| This journal is © the Owner Societies 2022 |

