Modelling atomic layer deposition overcoating formation on a porous heterogeneous catalyst†
Received
1st June 2022
, Accepted 9th August 2022
First published on 11th August 2022
Abstract
Atomic layer deposition (ALD) was used to deposit a protective overcoating (Al2O3) on an industrially relevant Co-based Fischer–Tropsch catalyst. A trimethylaluminium/water (TMA/H2O) ALD process was used to prepare ∼0.7–2.2 nm overcoatings on an incipient wetness impregnated Co–Pt/TiO2 catalyst. A diffusion–reaction differential equation model was used to predict precursor transport and the resulting deposited overcoating surface coverage inside a catalyst particle. The model was validated against transmission electron (TEM) and scanning electron (SEM) microscopy studies. The prepared model utilised catalyst physical properties and ALD process parameters to estimate achieved overcoating thickness for 20 and 30 deposition cycles (1.36 and 2.04 nm respectively). The TEM analysis supported these estimates, with 1.29 ± 0.16 and 2.15 ± 0.29 nm average layer thicknesses. In addition to layer thickness estimation, the model was used to predict overcoating penetration into the porous catalyst. The model estimated a penetration depth of ∼19 μm, and cross-sectional scanning electron microscopy supported the prediction with a deepest penetration of 15–18 μm. The model successfully estimated the deepest penetration, however, the microscopy study showed penetration depth fluctuation between 0–18 μm, having an average of 9.6 μm.
1 Introduction
Atomic layer deposition (ALD) presents an interesting path to modify heterogeneous catalysts with active or inert inorganic compounds.1 ALD overcoating provides a versatile toolbox for catalyst active site modification and protection. ALD techniques enable precise control and conformality over other methods, such as solution-based overcoatings.2–4 Several publications give examples of ALD overcoatings preventing catalyst deactivation through leaching and sintering,4–6 where catalysts are modified through repeated self-limiting reaction cycles to achieve desired overcoating thicknesses with atomic-level precision. Due to these properties, ALD process is also relevant for very high aspect ratio materials and nanoporous structures, such as catalysts.7,8 After the deposition, overcoating structures can be modified to specific needs with temperature1,9,10 or reactive treatments.11 Although ALD gives a wide variety of tools to modify different materials, the precursor transport into the porous substrates is no trivial question.
Many of the successful examples9,10,12 present the ALD overcoating deposition on a catalyst surface and overcoating formation around a specific active metal site. However, less information is available on the precursor penetration into a porous heterogeneous catalyst. Therefore, it is important to understand the ALD process and precursor parameter effect on the achieved penetration depth. In literature, this has been addressed with models to predict a single parameter, such as precursor sticking probability,13 growth modes (growth-per-cycle behaviour)14–16 as well as experimental methods to select ALD process conditions (temperature, pressure and exposure time).17 Others present holistic models to estimate a full deposition process for varying precursors, experimental conditions and substrate materials.18–20 An especially interesting approach for catalytic application has been related to porous material deposition modelling.7,21–24 These examples present a foundation for modelling precursor transport and required exposure time to achieve the desired precursor penetration through the porous substrate. However, the previous modelling studies have not extensively been connected to microscopical examination and resulting catalytic performance. Our work presents a coupled diffusion–reaction differential equation model to estimate ALD overcoating penetration into a Co–Pt/TiO2 porous catalyst, similar to commercial catalysts listed by Rytter and Holmen.25 The model is used to estimate deposition thicknesses with a given set of catalyst structural parameters and precursor parameters. The presented model is compared against microscopy (TEM and SEM) measurement data.
2 Materials and methods
2.1 Atomic layer deposition precursor diffusion model
To address atomic layer deposition precursor transport into the selected TiO2 catalyst structure, a diffusion–reaction partial differential equation model was prepared based on the work of Yanguas-Gil and Elam,7,18,22 Keuter et al.23 and Ylilammi et al.19 In the presented model, the precursor was considered as an ideal gas with homogeneous concentration over the catalyst surface. The porous substrate (catalyst) was characterised by mean porosity, mean tortuosity and mean pore size, resulting in the utilisation of the mean diffusion coefficient (Knudsen diffusion coefficient, Dki). As the precursor diffuses through the porous material, the precursor density decreased because of interaction with surface reactive sites, following second-order reaction kinetics. A practical simplification was made to assume reactive sites having uniform distribution on the porous substrate, having equal reaction probability with the precursor molecule. After the surface reaction, the precursor molecule had no ability for desorption or surface migration.
The prepared model consists of two coupled diffusion–reaction differential equations:7,23
| |  | (1) |
| |  | (2) |
Eqn (1) gives the volumetric precursor density (nP), dependent upon the time (t) and the depth (z) inside the porous catalyst particle. As the extent of surface reaction depends on both precursor density and available reaction sites, the consumed precursor density is related to the ratio (![[s with combining macron]](https://www.rsc.org/images/entities/i_char_0073_0304.gif) ) of surface area (AO) and pore volume (VP). The β0 is a simplified estimation with the Langmuir equation for precursor sticking probability to the coated surface.4,9,24 The second coupled differential equation (eqn (2)) considers the fraction of available reaction sites Θ(t, z), where s0 is the average surface area of adsorption sites, also including the shielding effect of ligands (steric hindrance) on the precursor molecule surface coverage.8 The degree of surface coverage is determined as 1 − Θ(t, z). The gas phase diffusion coefficient in porous structures can be divided into two parts, i.e., into molecular diffusion and Knudsen diffusion (eqn (3)).
) of surface area (AO) and pore volume (VP). The β0 is a simplified estimation with the Langmuir equation for precursor sticking probability to the coated surface.4,9,24 The second coupled differential equation (eqn (2)) considers the fraction of available reaction sites Θ(t, z), where s0 is the average surface area of adsorption sites, also including the shielding effect of ligands (steric hindrance) on the precursor molecule surface coverage.8 The degree of surface coverage is determined as 1 − Θ(t, z). The gas phase diffusion coefficient in porous structures can be divided into two parts, i.e., into molecular diffusion and Knudsen diffusion (eqn (3)).
| |  | (3) |
where the gas phase diffusion coefficient is given by
Di, molecular diffusion coefficient by
Dmi and Knudsen diffusion coefficient by
Dki.
Due to catalyst pore dimensions and TMA partial pressure (1.3 kPa at 293 K), the transport of precursor molecules is dictated by Knudsen diffusion and therefore, Dmi−1 in eqn (3) can be neglected:
| |  | (4) |
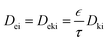
The estimated TMA mean free path (∼18 μm) was significantly larger than the catalyst average pore radius of 28 nm. In the case of porous materials, it should be considered that the whole volume of a catalyst particle is not available for the diffusion. In order to take this into account, the voidage of a porous particle is expressed with porosity value ε, and tortuosity (labyrinth factor) is expressed by value τ. The Knudsen diffusion coefficient considers molecular movement and interaction with pore walls in a perfectly straight and cylindrical structure. Therefore, the determination of effective diffusion coefficient is expanded to eqn (5):
| |  | (5) |
where
Dki is multiplied with a simplification factor of the tortuous, discontinuous and complex pore structure. Then, the effective diffusion coefficient (
Dei) for the studied porous catalytic material is based on Knudsen diffusion and is given as:
| |  | (6) |
Values of parameters in eqn (6), i.e., mean pore radius (r), porosity (ε) and tortuosity (τ) are presented in Table 1. In addition to the catalyst structural parameters, Table 2 gives trimethylaluminium (TMA) precursor parameters required for the used model. Fig. 1 presents a schematic for model domains and eqn (7)–(10) give the initial and boundary conditions applied to solve partial differential equations (eqn 1 and 2). The table presents only precursor parameters for TMA, neglecting the second half-reaction compound (H2O). This was due to the smaller mass and molecular dimensions of water, enabling easier and faster diffusion into the porous material. Therefore, TMA half-cycle was considered as the limiting factor in overcoating formation.19,23
Table 1 Catalyst structural parameters
| Parameter |
Value |
Source |
| Porosity, ε |
0.213 |
TiO2 support manufacturer |
| Tortuosity, τ |
32.1 |
TiO2 support manufacturer |
| Mean pore radius, r |
2.77 × 10⁻⁸ m |
BJH measurement |
| BET surface area, AO |
38.3 m2 gcat−1 |
BET measurement |
| Pore volume, VP |
2.65 × 10⁻⁷ m3 gcat−1 |
BJH measurement |
Table 2 Trimethylaluminium (TMA) precursor parameters
| Parameter |
Value |
Source |
|
Determined from TMA vapour pressure (1.3 kPa at 293 K).31
|
| Temperature, TP |
423.15 K |
— |
| Precursor mass, mP |
72.082 × 1.66 × 10−27 kg |
— |
| Maximum density of particles adhering to the surface, σP |
5 × 10¹⁸ m−2 |
8, 26–28
|
| Precursor density outside the porous material, nP (t, z = 0) |
3.21 × 10²³ m−3 |
|
| Sticking probability, β0 |
2 × 10⁻³ |
19, 27, 29, 30
|
 |
| | Fig. 1 Precursor depletion profile in depth and time domains of the model (left) with a set of initial and boundary conditions. Surface coverage profile in depth and time domains of the model (middle) with initial condition. A schematic illustration of the used model domains (right). | |
2.1.1 Initial conditions.
| | |
Θ(t = 0, z) = 1, ∀ z ∈ [0, 40 μm]
| (7) |
| | |
n
P(t = 0, z) = 0, ∀ z ∈ [0, 40 μm]
| (8) |
2.1.2 Boundary conditions.
| | |
n
P(t, z = 0) = 3.21 × 10²³ m−3, ∀ t ≥ 0
| (9) |
| |

| (10) |
2.2 Solution of partial differential equation system
The partial differential equation system was solved by applying Matlab software. The second derivative of spatial coordinate z (depth in the porous catalyst particle) was discretised using the finite differences method. This was done using a Matlab modification of the dss044 algorithm developed by Schiesser.32 In this algorithm, the second derivative is discretised applying five-point central difference formulas, based on fourth-order approximation. The formed system of ordinary differential equations (ODEs) was solved using the Matlab algorithm ode15s, suitable for stiff ODE systems.
2.3 Catalyst preparation
Stepwise co-impregnation was used to prepare the Co–Pt/TiO2 catalyst. In the first step, a TiO2 support (ACCU® SPHERE 0.4 mm ST32244, SBET 52 m2 g−1, Vpore 0.37 mL g−1 and dpore 28.9 nm) was dried at 100 °C under a vacuum for 1 h. The support was then co-impregnated twice with an aqueous solution of cobalt nitrate (Co(NO3)2·6H2O) and platinum(IV) nitrate (Pt(NO3)4). Between impregnation steps, the catalyst was dried in a rotary vacuum evaporator and calcined at 300 °C for 4 h. The resulting catalyst contained 21.0 wt% cobalt and 0.2 wt% platinum. The ALD (trimethylaluminium (TMA)/water) process was carried out using Picosun R-200 ALD equipment. Nitrogen (purity 99.999%) was used as a carrier gas and TMA deposition cycles (10, 20 and 30) were performed at 150 °C (TMA purity 99.999%, Sigma-Aldrich), with a stop-flow deposition and purge cycles of 10 s/80 s/10 s/80 s. The stop-flow cycle had a 0.7 s precursor pulse and 9.3 s equilibrium time. Deionised water was used as a second half-reaction reagent (with stop flow equilibrium time). The TMA and water were evaporated at room temperature. After the ALD process, the resulting catalyst samples required heat treatment to re-open catalyst active sites beneath alumina overcoating.10,33 The heat treatment was conducted in the tubular reactor prior to FT reaction. For catalyst characterisation experiments, the heat treatment was performed with a Micromeritics 3Flex 3500 instrument. The heat treatment was done in an N2 flow (40 N mL min−1 gcat−1), having a heating ramp rate 4 °C min−1 from 25 °C to 420 °C at atmospheric pressure.
2.4 Catalyst characterisation
2.4.1 Nitrogen adsorption and desorption.
The N2 physisorption experiments were carried out with a Micromeritics 3Flex 3500 instrument. A catalyst sample (∼300 mg) was placed in a VacPrep degassing station and kept at 150 °C for 12 h under a vacuum (10−2 mbar). After degassing, the tube was mounted on the measuring instrument. The catalyst surface area was estimated using the Brunauer–Emmett–Teller (BET)34 equation, and the Barrett–Joyner–Halenda (BJH)35 method was used for total pore volume and average pore diameter determination. The average pore diameter was evaluated from the nitrogen desorption branch.
2.4.2 Transmission electron microscopy (TEM).
The transmission electron microscopy studies were performed in a Jeol JEM 2800 analytical HR-TEM at an accelerating voltage of 200 kV. The samples are prepared by crushing the catalyst particles in a mortar and pestle. The powder is redispersed in acetone and sonicated to achieve suitable dispersion. Of this suspension, 10 μL is drop casted on an EMR holey carbon 400 square mesh Cu grid and air dried. Prior to TEM investigation, the grids are preserved under rotary vacuum conditions.
2.4.3 Scanning electron microscopy–energy-dispersive X-ray spectrometer (SEM–EDS).
Scanning electron microscopy (SEM) and energy-dispersive X-ray spectrometry (EDS) examinations were conducted with a Zeiss Crossbeam scanning electron microscope, having an EDAX (energy-dispersive X-ray) spectrometer. Sample casts were prepared by the addition of epoxy resin (∼23.3 g, EpoFix, Struers), mixing with ∼10 mg of carbon powder (VULCAN XC72R GP-3875, CABOT) and stirred by hand to achieve a homogeneous mixture. Then, 2.8 g of hardener (EpoFix hardener, Struers) was added into the cast mixture. The mixture was poured into a mould after inserting catalyst sample particles into the mould. The resin mixture was cured for 24 hours, and cured cast was ground to expose cross-sections of the catalyst particles. Before the SEM experiment, the cured cast was sputtered with Pt to induce a signal from the sample. Electron acceleration voltage was 15 keV.
3 Results and discussion
3.1 Overcoating penetration to the porous catalyst structure
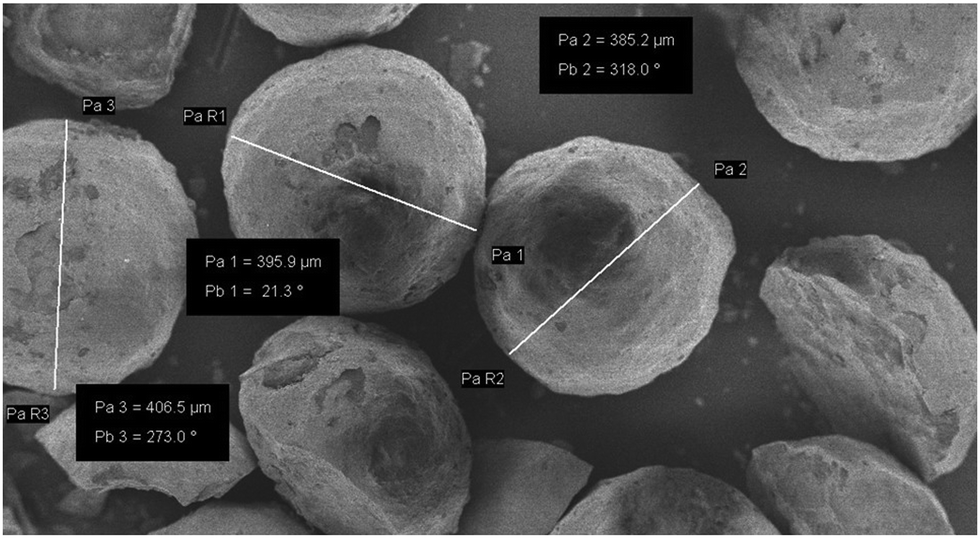
Fig. 2 presents a SEM image of overcoated catalyst sample particles. Catalyst support manufacturer (Saint-Gobain Norpro, ACCU® SPHERE ST32244) reported measured particle size distribution for catalyst support as 396 ± 23 μm. In order to address ALD overcoating penetration experimentally, catalyst particles (similar to Fig. 2) were casted in resin, sanded and polished to hemispherical shape.
 |
| | Fig. 2 Example SEM image of catalyst particles with measured diameters. | |
Fig. 3 gives the SEM–EDS line scan measurement spectra starting from the outside of the catalyst particle until the middle of the measured particle (∼200 μm). Alumina overcoating had a clear response at the surface of the catalyst particle, ranging from 0–18 μm. In addition to the ALD overcoating, a clear boundary was observed for Co at ∼75 μm. At a similar depth, the Ti response increased as relative atomic abundancy was increased from Co to the Ti response.
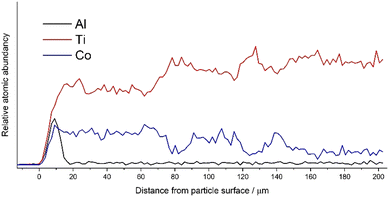 |
| | Fig. 3 SEM–EDS line scan from hemispherical catalyst particle having 30 cycle ALD overcoating. Atomic abundancies for Al, Ti and Co from the surface of the particle to the particle centre at 202 μm. | |
Line scan (Fig. 3) presents information only from the selected crosscut. Therefore, to address ALD overcoating penetration uniformity, Fig. 4 presents SEM–EDS elemental mapping images for two catalyst particles. Measured from these elemental mapping images (with ImageJ version 1.53 k), the overcoating depth had an average of 9.5 and 9.6 μm for fig. a and c respectively, while the deepest penetration was between 15–18 μm. The cobalt penetration ranged between 80–140 μm. The cobalt missing from the middle of the particles was an indication of successful grinding close to the assumed hemispherical shape. Interestingly, both cobalt elemental mapping and line scan show varying cobalt loading for distinct locations of the catalyst particle. This unevenness might have resulted from varying support densities having both anatase (80%) and rutile (20%) TiO2 crystallite phases or non-uniform tortuosity and porosity throughout the catalyst particle. With the precursor diffusion–reaction model, the expected overcoating penetration depth was 19 μm, corresponding well with Fig. 4, a measured maximum penetration depth of 15.2 μm.
 |
| | Fig. 4 SEM–EDS elemental mapping conducted on hemispherical catalyst particles having 30 cycle ALD overcoating. Elemental mapping channels for Al images (a and c), for cobalt images (b and d). In fig. (a), Al response at the middle of the particle resulted from the grinding process, leaving a small quantity of Al in this unexpected area. | |
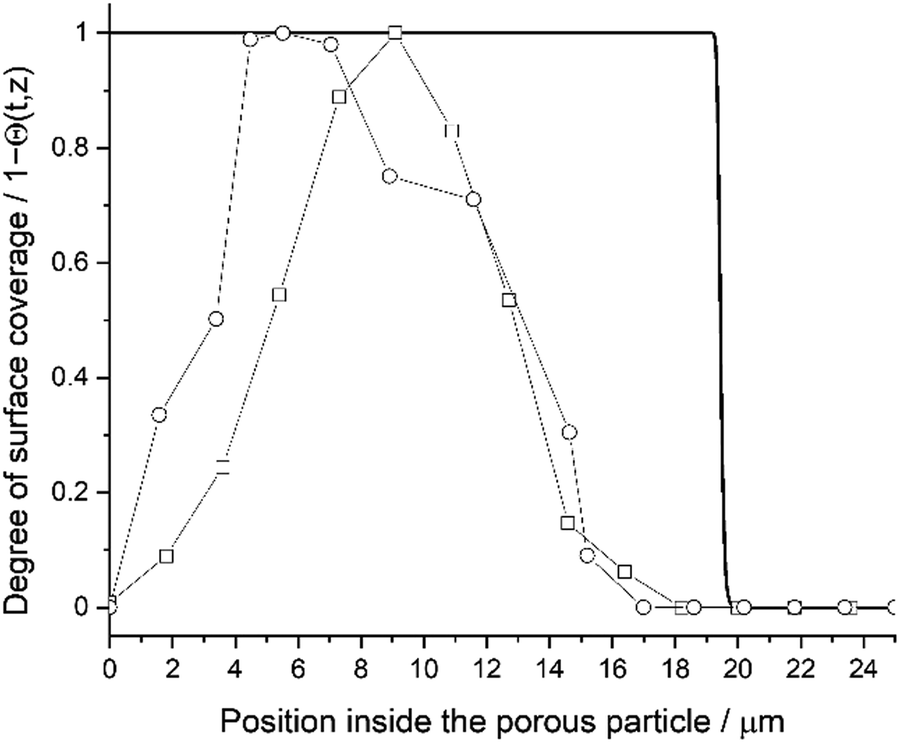
Fig. 5 presents a diffusion–reaction model estimate for the degree of surface coverage (Θ[t, z]) as a function of the position inside the porous particle. With the used catalyst structural parameters (Table 1), deposition process and precursor parameters (Table 2), the estimated degree of surface coverage remains constant until ∼19.1 μm, whereafter the precursor coverage depleted rapidly (Θ = 0 at 19.9 μm). In addition to the model prediction, Fig. 5 presents the measured SEM–EDS line scan data. When measuring the line scan from the deepest observed penetration depth, the penetration profile corresponds closely to the model prediction. The Gaussian-like distribution with the SEM–EDS measurement data resulted from X-ray scattering at the measured surface. Due to the scattering effect, the Al signal slowly increased until 4–9 μm and started to decrease after 6–10 μm. The deepest penetration depth was similar to SEM–EDS elemental mapping with 15–18 μm. Therefore, the diffusion–reaction model is slightly overestimating the penetration depth. The overestimation might result from several factors (discussed later in detail in the section “Diffusion–reaction model parameter sensitivity”). However, the most relevant misinterpretation might be related to the used precursor density outside the porous particle. The precursor density (m−3) was calculated from TMA vapour pressure (1.3 kPa at 293 K), thus giving the ideal maximum precursor density outside the catalyst particle.
 |
| | Fig. 5 Degree of surface coverage as a function of position inside the porous particle. Solid black line for model prediction overlayed with two separate SEM–EDS line scan measurements. First SEM–EDS line scan measurement with round markers and a repetition measurement from different location with square markers. | |
3.2 Overcoating thickness and conformality
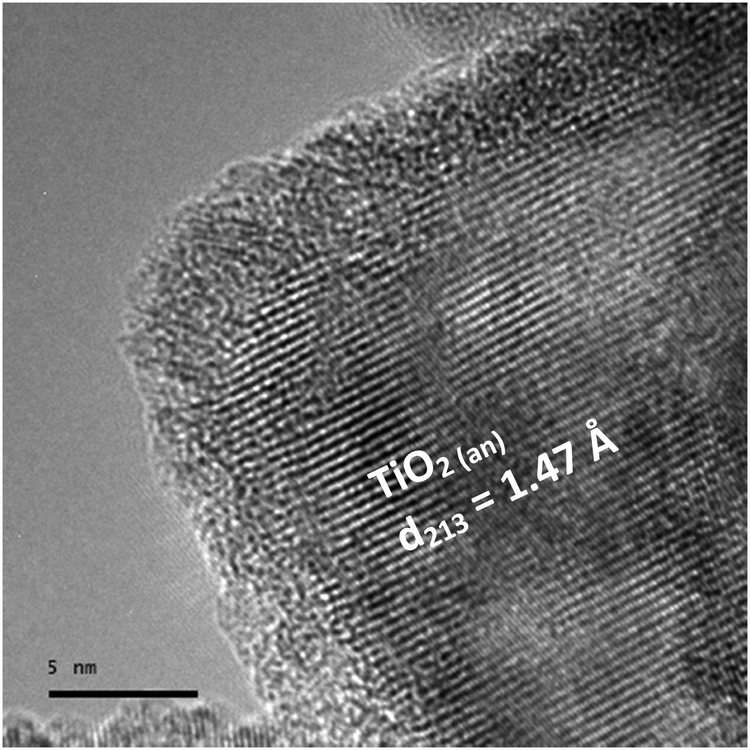
The previous section discussed the overcoating penetration depth into the catalyst particle. In addition to the penetration profile estimation, the presented diffusion–reaction model was utilised to estimate overcoating thickness on the catalyst surface. The model predictions were compared to experimental measurements. Fig. 6 gives the HR-TEM image of the TiO2 particle having a 30-cycle amorphous overcoating. The overcoating in Fig. 6 presents a rather uniform thickness of 2.93 ± 0.21 nm (0.98 Å per cycle). However, when considering several microscopy images from separate TiO2 particles, the average overcoating thickness was 2.15 ± 0.29 nm (0.72 Å per cycle). In literature, the growth-per-cycle of 0.98 Å per cycle for the TMA/H2O process has been reported for lateral high-aspect-ratio (LHAR) test structures at a deposition temperature 300 °C.20 Similar values have been reported by Ott et al.36 and Puurunen,16 with GPC decreasing linearly with deposition temperature from 1.2 Å per cycle (180 °C) to 0.9 Å per cycle (300 °C). The deposition temperature in our experiment was 150 °C; thus, a lower GPC was achieved compared to the silica-based test structures.
 |
| | Fig. 6 TiO2 support particle TEM image and amorphous 30 cycle ALD overcoating with measured overcoating thickness 2.93 ± 0.21 nm. | |
To present overcoating thickness variation, Fig. 7 gives the thickness measurement results as a histogram with a Gaussian distribution. Interestingly, a rather wide distribution of overcoating thicknesses were measured. The 30c sample deviation was clearly increased compared to the 20c sample. The overcoating distribution for the 30c sample was ranging from 1.25 to 3.75 nm. Table 3 summarises the measured thicknesses for 20 and 30 cycle ALD overcoating with experimental error and sample size. The same table also presents the model prediction thickness values for corresponding overcoated catalysts.
 |
| | Fig. 7 Histogram of TEM image analysis for overcoating thickness. Frequency of individual measurements are counted in 0.5 nm intervals. | |
Table 3 Measured (HR-TEM) and predicted overcoating thickness. Diffusion–reaction model uses an average GPC (0.685 Å per cycle) from the TEM measurements to give overcoating thicknesses
| ALD cycles |
HR-TEM results |
Growth-per-cycle (Å per cycle) |
Diffusion–reaction model |
| Overcoating thickness (nm) |
Experimental error ±2σ |
Sample size (n) |
Overcoating thickness (nm) |
| 10 |
— |
— |
— |
— |
0.68 |
| 20 |
1.29 |
0.16 |
18 |
0.65 |
1.36 |
| 30 |
2.15 |
0.29 |
30 |
0.72 |
2.04 |
According to Lu et al.,37 the TMA/H2O process on Pd nanoparticles, 4 different growth regions exist depending on the deposition cycles. With deposition cycles ≥ 30, the growth-per-cycle (GPC) is constant. The other three growth regions are the first deposition cycle, 2–12 cycles and 13–30 cycles. The first cycle yielded 1.6 times the mass gain with compared to the constant GPC region; while the second cycle mass gain was only 0.8 of the constant GPC region. After the second cycle, GPC increased stepwise again to 1.6 at cycle 12, and after that, stabilised slowly to constant GPC at cycle 30. Our findings in Table 3 are in contradiction with these results, as 20 deposition cycles resulted in a slightly lower GPC compared to 30 cycles. However, when considering the experimental error, there is no significant difference between the GPCs. Therefore, making conclusions on the different growth regions was not possible with the given results. To determine overcoating thickness with the diffusion–reaction model, an average of the measured GPC's was used (GPC = 0.681). If the presented model would be used to estimate overcoating thicknesses for higher amount of deposition cycles, the 30c sample GPC should be used in the calculation.
In addition to the prepared diffusion–reaction model and characterization experimental work, the overcoated samples were studied in the Fischer–Tropsch reaction. These results are reported in the supporting information, where 20 and 30 cycle ALD overcoated samples present a decreased rate of deactivation. Although the deactivation rate could be decreased (see Fig. S1, ESI†), this benefit comes with a price of promoted methanation activity and decreasing chain propagation α-value (see Table S2 and Fig. S2, ESI†). The chain propagation α-value was decreasing linearly with respect to overcoating thickness from 0.917 (non-overcoated catalyst) to 0.908 (30 deposition cycles).
3.3 Diffusion–reaction model parameter sensitivity
Parameter sensitivity analysis was used to determine each variable effect on the achieved penetration depth. In the presented diffusion–reaction model, there are two sets of parameters: catalyst structural (Table 1) and ALD precursor parameters (Table 2). From these parameters, the most significant effects were related to catalyst porosity (ε), catalyst tortuosity (τ), deposition time (t), precursor density outside the porous material (nP), maximum density of particles adhering to the surface (σP) and deposition temperature (TP).
3.3.1 Sensitivity related to deposition process and precursor parameters.
Fig. 8 presents achieved penetration depth for varying exposure time (t, seconds). In the fig. a, the slope at the adsorption front stays constant, and the exposure time mainly affects the penetration depth. This is as expected when β0, nP and σP remained constant. Although deposition time is an easy parameter to modify, the full ALD process duration will increase rapidly (see Fig. 8b) if no other parameters are changed to achieve deeper penetration into the catalyst particle.
 |
| | Fig. 8 Parameter sensitivity analysis, (a) degree of surface coverage profile variation with three exposure time (t) values, (b) achieved penetration depth (deepest penetration depth at Θ = 1) with varying deposition time (t). Used model parameter marked with surrounding circle. | |
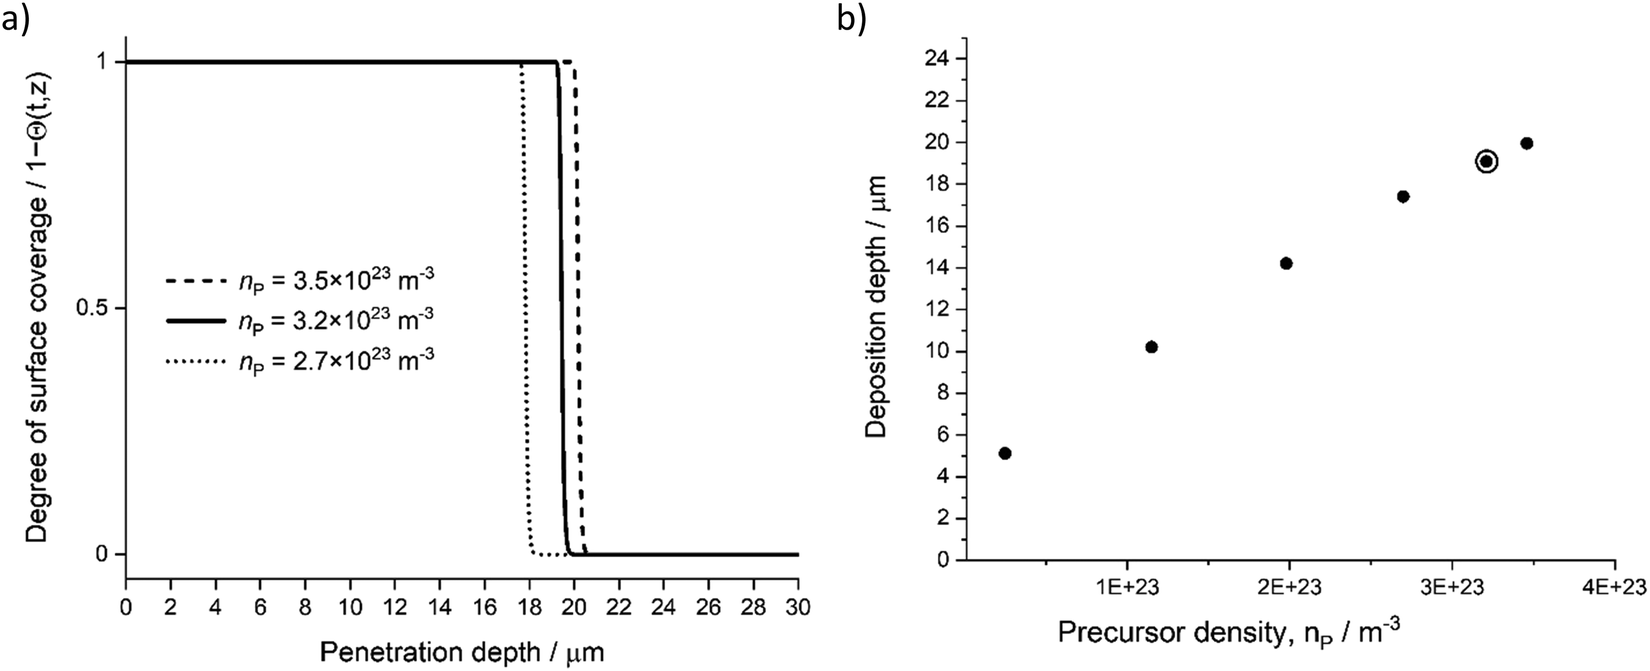
In addition to the deposition cycle time (single half-reaction time), precursor density outside the porous material (nP) influences the penetration depth. Fig. 9 presents the effect of varying precursor density (precursor pressure) introduced to the ALD chamber. With low precursor partial pressure, the precursor molecules are reacting with a given sticking probability (β0) on the available sites (σP) and depleting faster compared to higher partial pressures.
 |
| | Fig. 9 Parameter sensitivity analysis, (a) degree of surface coverage profile variation with three nP values, (b) achieved penetration depth (deepest penetration depth at Θ = 1) with varying nP. Used model parameter marked with surrounding circle. Corresponding TMA partial pressures were 100 Pa (penetration depth 5 μm), 460, 800, 1100, 1300, and 1400 Pa. | |
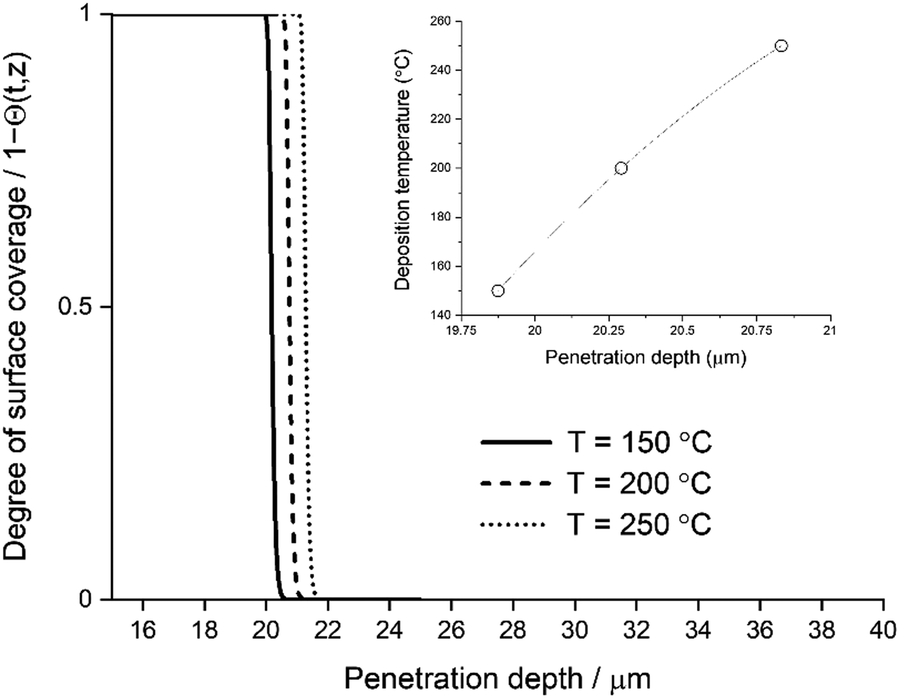
The deposition temperature has an effect on both penetration depth and achieved growth-per-cycle (GPC) in the TMA/H2O ALD process. Deeper penetration can be expected in an increased deposition temperature due to enhanced diffusion (TP at the eqn (6)) and a decreased surface OH group availability.28,38 Having less OH groups for TMA precursor adsorption, the precursor can travel deeper into the catalyst structure (see Fig. 10). In addition to the penetration depth, the achieved layer thickness will change due to OH group availability. Fig. 11 presents thickness profiles given by eqn (11):
| | | dAl2O3 = [1 − Θ(t, z)] × GPC × ALP cycles | (11) |
where the deposition temperature has an effect on both the degree of surface coverage and the GPC. Increasing the deposition temperature will decrease the achieved layer thickness through decreased GPC.
 |
| | Fig. 10 Main figure, the degree of surface coverage profile variation with deposition temperature 150, 200 and 250 °C. Merged figure, the achieved penetration depth with varying deposition temperature. | |
 |
| | Fig. 11 Estimated layer thickness for 10, 20 and 30 deposition cycles. Layer thickness determined with eqn (11) having a growth-per-cycle (GPC) of 0.0681 nm per cycle from the TEM microscopy studies. | |
Maximum density of particles adhering to the surface (σP) is dictated by the availability of reactive sites on the catalyst surface and precursor dimensions (see Fig. 12). Decreasing precursor size will allow for an increased surface saturation and less steric hindrance from neighbouring molecules. Altering the precursor structure would affect the σP through a different ligand arrangement and the bonding configuration.8 Similar to our work, Keuter et al.23 present a study with a tetrakis(ethylmethylamino)zirconium (TEMAZ) precursor on ZrO2 support, where the small number of surface adsorption sites and relatively large TEMAZ molecular dimensions results in film growth restrictions due to steric hindrance. In their study, the porous material surface has open reactive sites; however, most of these sites have been blocked by already-adsorbed precursor molecules. With a TMA precursor, the molecular dimensions are smaller, and less restrictions are present for adsorption reactions.
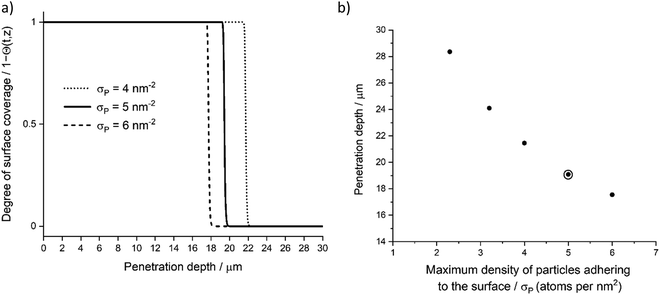 |
| | Fig. 12 Parameter sensitivity analysis, (a) degree of surface coverage profile variation with three σP values with 4, 5, and 6 atoms per nm2, (b) achieved penetration depth (deepest penetration depth at Θ = 1) with varying σP. Used model parameter marked with surrounding circle. | |
3.3.2 Sensitivity related to catalyst structural parameters.
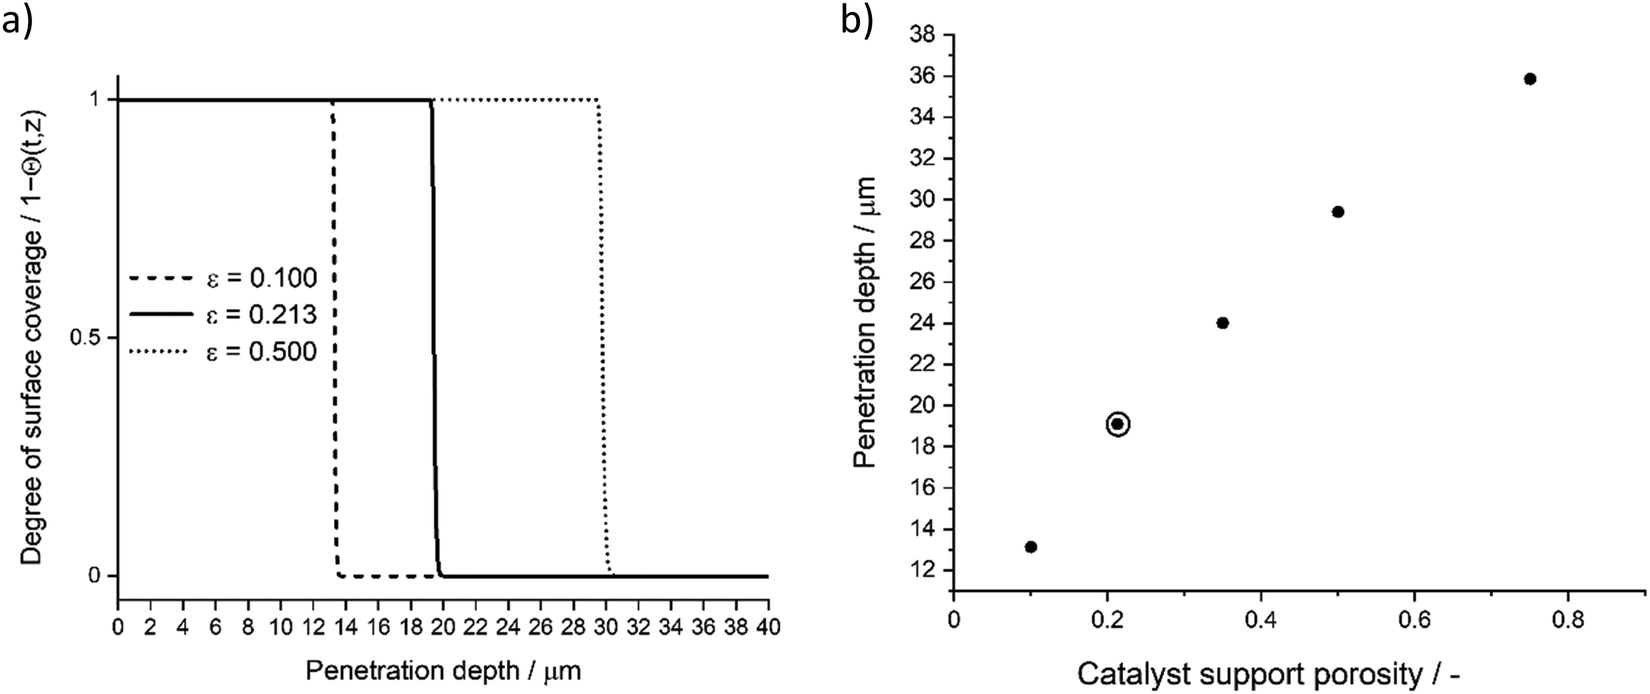
Catalyst porosity (ε) and tortuosity (τ) are present in the eqn (6). Dividing porosity per tortuosity, gives a simplified average of the catalyst structure. Typical high-range tortuosity values range between 6–10,39,40 therefore, the catalyst support used in our experiments had remarkably high tortuosity value (τ = 32.1). Fig. 13 presents the effect of varying tortuosity value to achieved penetration depth. In addition to catalyst tortuosity, porosity influences the achieved penetration depth. Fig. 14 presents the effect of varying values of porosity to the achieved penetration depth.
 |
| | Fig. 13 Parameter sensitivity analysis, (a) degree of surface coverage profile variation with three catalyst tortuosity (τ) values, (b) achieved penetration depth (deepest penetration depth at Θ = 1) with varying catalyst tortuosities (τ). Used model parameter marked with surrounding circle. | |
 |
| | Fig. 14 Parameter sensitivity analysis, (a) degree of surface coverage profile variation with three catalyst porosity (ε) values, (b) achieved penetration depth (deepest penetration depth at Θ = 1) with varying catalyst porosities (ε). Used model parameter marked with surrounding circle. | |
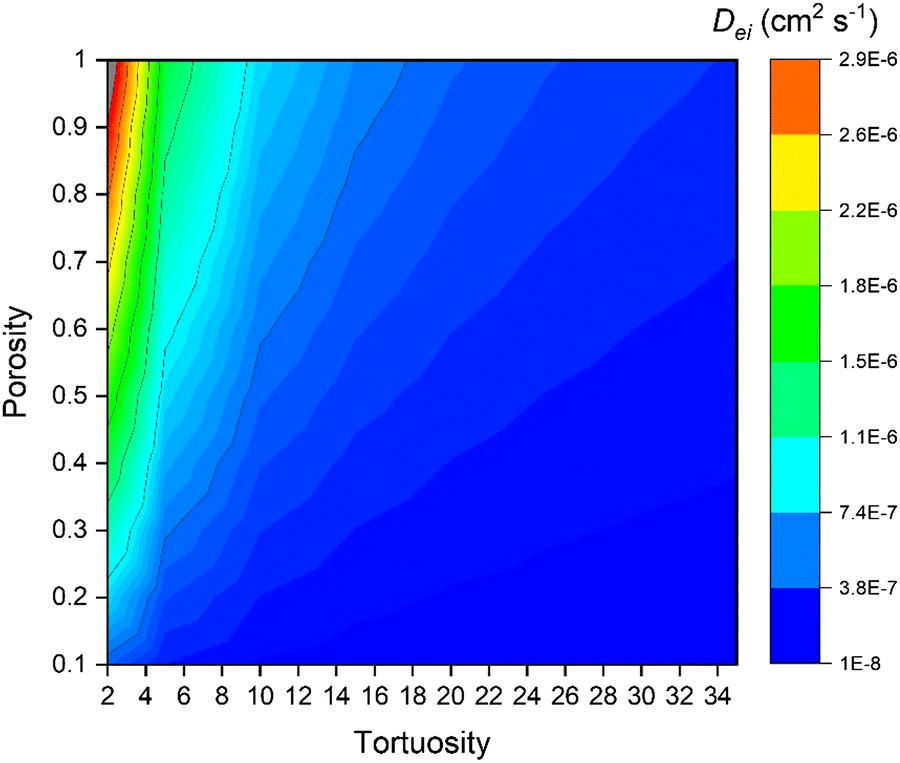
Fig. 15 presents the effect of porosity and tortuosity on the effective diffusion coefficient (Dei). With high tortuosity values, the porosity effect on the resulting Dei decreases. Although Dei is not greatly affected at the high tortuosity values, the slight change in the Dei (4.56 × 10⁻⁸ cm2 s−1 and 9.93 × 10⁻⁸ cm2 s−1 at ε = 0.2 and ε = 0.5 respectively with fixed τ = 32.1) has a rather high impact on the achieved penetration depth in Fig. 14.
 |
| | Fig. 15 The effect of porosity and tortuosity on the Knudsen diffusion coefficient (Dki). Knudsen diffusion determined with fixed values for the mean pore radius (r), temperature (TP), and precursor mass (mP). | |
3.4 Catalyst characterisation
The catalyst nitrogen sorption measurement results are presented in Table 4. BET surface area for non-overcoated Catalyst A is 38.3 m2 gcat−1, whereas ALD overcoated catalyst samples present the surface area between 41.3–41.6 m2 gcat−1. The increased surface area is related to overcoating temperature treatment, resulting in porous Al2O3 structure. Pore volumes remain closely unchanged with ALD overcoated samples, which could be expected, as overcoating thickness was between 0.68–2.04 nm; the resulting volume increase cannot be measured with the selected analysis method. However, the pore size measurement was able to give comparison data between catalyst samples. Comparing to the non-overcoated Catalyst A, the pore size was decreasing between 2.6–3.1 nm with overcoated samples. By assuming a cylindrical pore, the pore size decreasing was due to overcoating formation on the inner surface of the cylindrical hole. Therefore, dividing the pore size decrease by two would estimate layer thicknesses for overcoated samples, having a similar range as TEM and modelling results presented in Table 3.
Table 4 Nitrogen adsorption/desorption measurement results for the BET surface area, pore volume and pore size. Overcoated samples measured after temperature treatment
| Catalyst |
BET surface area (m2 g−1) |
Pore volume (mL g−1) |
Pore size (nm) |
| Experimental error (±2σ) for surface area was ±1 m2 g−1, pore volume ±0.01 mL g−1 and pore size ±0.1 nm. |
| TiO2 support (Saint-Gobain Norpro, ACCU® SPHERE ST32244) |
52 |
0.37 |
28.9 |
| Catalyst A |
38 |
0.27 |
27.7 |
| Catalyst A + 10c ALD |
42 |
0.26 |
25.1 |
| Catalyst A + 20c ALD |
41 |
0.25 |
24.6 |
| Catalyst A + 30c ALD |
42 |
0.26 |
24.8 |
The diffusion–reaction model utilised the Knudsen diffusion coefficient (Dki) to estimate precursor transport inside the catalyst particle. Pore size distribution analysis was relevant to address whether or not Knudsen diffusion coefficient should be position dependent. If the overcoating layer-by-layer growth has a significant effect on the resulting pore size, the Knudsen diffusion coefficient should take this growth into account.23 In order to determine which form of Dki is suitable for our catalyst selection and target overcoating thicknesses, the pore size distribution from the BJH adsorption measurement presented useful information, with an average pore size ranging between 24.6–27.7 nm. From these results, it was concluded that the targeted maximum deposition thickness (2–3 nm) had no significant effect on the modelled results through layer-by-layer overcoating formation. Although a fraction of small pores (<6 nm) was present, the filling of these pores and coverage of cobalt particles < 6 nm had no significant effect on the Fischer–Tropsch reaction. In the FT reaction, the Co particle size should exceed 10 nm to achieve high turnover frequency.41,42 For these reasons, the Knudsen diffusion coefficient was calculated with eqn (6), not considering layer-by-layer growth.
4 Conclusions
The Co–Pt/TiO2 Fischer–Tropsch porous catalyst was overcoated with an ALD (TMA/H2O) process. A diffusion–reaction differential equation model was prepared to address overcoating thickness and penetration to the porous catalyst sample. The model results were compared against SEM and TEM microscopy measurements, indicating wide distribution of penetration 0–18 μm, with an average penetration depth of 9.6 μm (corresponding to ∼5–10% depth from throughout particle penetration). This variation is significantly different to ideal test surfaces and non-porous materials, where ALD overcoating can produce highly conformal and uniform inorganic layers. In addition to penetration depth distribution, the overcoating thickness had an intrinsic variation within the catalyst particle from 1.29 ± 0.16 nm and 2.15 ± 0.29 nm for 20- and 30-cycle ALD overcoated samples, respectively. The presented model was also used to estimate these thicknesses, and the results were corresponding well with 1.36 nm and 2.04 nm for 20- and 30-cycle ALD overcoated samples, respectively. The presented model can be applied with little effort to other catalyst support structures and different precursor compounds. The diffusion–reaction model can be utilised to plan the ALD process on given catalyst structures.
Symbols and abbreviations
|
A
O
| BET surface area (m2 gcat−1) |
|
β
0
| Sticking coefficient of TMA |
|
D
ki
| Knudsen diffusion coefficient (m2 s−1) |
|
ε
| Porosity |
| GPC | Growth-per-cycle |
|
k
B
| Boltzmann constant (m2 kg s−2 K−1) |
|
m
P
| Precursor mass (kg) |
|
n
P
| Precursor density outside the porous material (m−3) |
|
r
| Mean pore radius (m) |
|
| Ratio of surface area (AO) per pore volume (VP) |
|
s
0
| Average surface area of adsorption sites (m2) |
|
σ
P
| Maximum density of particles adhering to the surface (m−2) |
|
τ
| Tortuosity |
|
T
| Temperature (K) |
|
T
P
| Precursor temperature (K) |
|
Θ
| Surface coverage (0 ≤ Θ ≤ 1) |
| TMA | trimethylaluminium, Al(CH3)3 |
|
V
P
| Pore volume (m3 gcat−1) |
Author contributions
Conceptualization (N. H., J. L. & M. R.), data curation (N. H., J. L., S. S. & Y. G.), formal analysis (N. H., J. L., L. K., J. Y., S. S. & Y. G.), investigation (N. H., S. S. & Y. G.), methodology (N. H. & J. L.), writing – original draft (N. H.), writing – review & editing (all authors).
Funding
European Union's Horizon 2020 research and innovation programme, under grant agreement No 768543 (ICO2CHEM project – From industrial CO2 streams to added value Fischer–Tropsch chemicals). M. P. acknowledges funding from the Academy of Finland by the profiling action on Matter and Materials, grant no. 318913. This work was carried out in the E-fuel research project (Dnro 43287/31/2020), with funding from Business Finland. The authors acknowledge all the participating companies during this study.
Conflicts of interest
The authors declare no conflict of interest.
Acknowledgements
We acknowledge the provision of facilities and technical support by Aalto University at Otanano – Nanomicroscopy center (Aalto-NMC). Associate Professor Riikka Puurunen, Aalto University, Department of Chemical and Metallurgical Engineering.
References
- B. J. O’Neill, D. H. K. K. Jackson, J. Lee, C. Canlas, P. C. Stair, C. L. Marshall, J. W. Elam, T. F. Kuech, J. A. Dumesic, G. W. Huber, B. J. Oneill, D. H. K. K. Jackson, J. Lee, C. Canlas, P. C. Stair, C. L. Marshall, J. W. Elam, T. F. Kuech, J. A. Dumesic and G. W. Huber, ACS Catal., 2015, 5, 1804–1825 CrossRef.
- L. F. Hakim, J. Blackson, S. M. George and A. W. Weimer, Chem. Vap. Deposition, 2005, 11, 420–425 CrossRef CAS.
- J. Qi, J. Chen, G. Li, S. Li, Y. Gao and Z. Tang, Energy Environ. Sci., 2012, 5, 8937–8941 RSC.
- P. Lu, C. T. Campbell and Y. Xia, Nano Lett., 2013, 13, 4957–4962 CrossRef CAS PubMed.
- X. Zhao, Y. Xue, Z. Lu, Y. Huang, C. Guo and C. Yan, Catal. Commun., 2017, 101, 138–141 CrossRef CAS.
- A. Satyanarayana Reddy, S. Kim, H. Young Jeong, S. Jin, K. Qadir, K. Jung, C. Ho Jung, J. Yeul Yun, J. Yeong Cheon, J. M. Yang, S. Hoon Joo, O. Terasaki and J. Young Park, Chem. Commun., 2011, 47, 8412–8414 RSC.
- A. Yanguas-Gil and J. W. Elam, Chem. Vap. Deposition, 2012, 18, 46–52 CrossRef CAS.
- R. L. Puurunen, J. Appl. Phys., 2005, 97, 121301 CrossRef.
- C. George, P. Littlewood and P. C. Stair, ACS Appl. Mater. Interfaces, 2020, 12, 20331–20343 CrossRef CAS PubMed.
- B. J. O’Neill, D. H. K. Jackson, A. J. Crisci, C. A. Farberow, F. Shi, A. C. Alba-Rubio, J. Lu, P. J. Dietrich, X. Gu, C. L. Marshall, P. C. Stair, J. W. Elam, J. T. Miller, F. H. Ribeiro, P. M. Voyles, J. Greeley, M. Mavrikakis, S. L. Scott, T. F. Kuech and J. A. Dumesic, Angew. Chem., Int. Ed., 2013, 52, 13808–13812 CrossRef PubMed.
- K. van de Kerckhove, M. K. S. Barr, L. Santinacci, P. M. Vereecken, J. Dendooven and C. Detavernier, Dalton Trans., 2018, 47, 5860–5870 RSC.
- J. Lu, J. W. Elam and P. C. Stair, Acc. Chem. Res., 2013, 46, 1806–1815 CrossRef CAS PubMed.
- J. Dendooven, D. Deduytsche, J. Musschoot, R. L. Vanmeirhaeghe and C. Detavernier, J. Electrochem. Soc., 2009, 156, P63 CrossRef CAS.
- R. L. Puurunen, Chem. Vap. Deposition, 2004, 10, 159–170 CrossRef CAS.
- R. L. Puurunen, Chem. Vap. Deposition, 2003, 9, 327–332 CrossRef CAS.
- R. L. Puurunen, Chem. Vap. Deposition, 2003, 9, 249–257 CrossRef CAS.
- K. Knemeyer, R. Baumgarten, P. Ingale, R. Naumann d’Alnoncourt, M. Driess and F. Rosowski, Rev. Sci. Instrum., 2021, 92, 025115 CrossRef CAS PubMed.
- A. Yanguas-Gil and J. W. Elam, J. Vac. Sci. Technol., A, 2012, 30, 01A159 CrossRef.
- M. Ylilammi, O. M. E. Ylivaara and R. L. Puurunen, J. Appl. Phys., 2018, 123, 205301 CrossRef.
- J. Yim, O. Ylivaara, M. Ylilammi, V. Korpelainen, E. Haimi, E. Verkama, M. Utriainen and R. Puurunen, Phys. Chem. Chem. Phys., 2020, 22(40), 23107–23120 RSC.
- C. Detavernier, J. Dendooven, S. Pulinthanathu Sree, K. F. Ludwig and J. A. Martens, Chem. Soc. Rev., 2011, 40, 5242–5253 RSC.
- A. Yanguas-Gil and J. W. Elam, ECS Trans., 2019, 41, 169–174 CrossRef.
- T. Keuter, N. H. Menzler, G. Mauer, F. Vondahlen, R. Vaßen and H. P. Buchkremer, J. Vac. Sci. Technol., A, 2015, 33, 01A104 CrossRef.
- R. G. Gordon, D. Hausmann, E. Kim and J. Shepard, Chem. Vap. Deposition, 2003, 9, 73–78 CrossRef CAS.
- E. Rytter and A. Holmen, Catal. Today, 2016, 275, 11–19 CrossRef CAS.
- S. Haukka, E. L. Lakomaa and A. Root, J. Phys. Chem., 1993, 97, 5085–5094 CrossRef CAS.
- V. Vandalon and W. M. M. Kessels, Appl. Phys. Lett., 2016, 108, 1–6 CrossRef.
- R. L. Puurunen, Appl. Surf. Sci., 2005, 245, 6–10 CrossRef CAS.
- J. Y. Kim, J. H. Ahn, S. W. Kang and J. H. Kim, J. Appl. Phys., 2007, 101, 073502 CrossRef.
- K. Arts, V. Vandalon, R. L. Puurunen, M. Utriainen, F. Gao, W. M. M. (Erwin) Kessels and H. C. M. Knoops, J. Vac. Sci. Technol., A, 2019, 37, 030908 CrossRef.
- M. Fulem, K. Růžička, V. Růžička, E. Hulicius, T. Šimeček, K. Melichar, J. Pangrác, S. A. Rushworth and L. M. Smith, J. Cryst. Growth, 2003, 248, 99–107 CrossRef CAS.
-
W. Schiesser, The Numerical Method of Lines – Integration of Partial Differential Equations, Academic Press, 1st edn, 1991 Search PubMed.
- N. Heikkinen, L. Keskiväli, P. Eskelinen, M. Reinikainen and M. Putkonen, Catalysts, 2021, 11, 672 CrossRef CAS.
- S. Brunauer, P. H. Emmett and E. Teller, J. Am. Chem. Soc., 1938, 60, 309–319 CrossRef CAS.
- E. P. Barrett, L. G. Joyner and P. P. Halenda, J. Am. Chem. Soc., 1951, 73, 373–380 CrossRef CAS.
- A. W. Ott, J. W. Klaus, J. M. Johnson and S. M. George, Thin Solid Films, 2009, 517, 5950 CrossRef CAS.
- J. Lu, B. Liu, J. P. Greeley, Z. Feng, J. A. Libera, Y. Lei, M. J. Bedzyk, P. C. Stair and J. W. Elam, Chem. Mater., 2012, 24, 2047–2055 CrossRef CAS.
- A. C. Dillon, A. W. Ott, J. D. Way and S. M. George, Surf. Sci., 1995, 322, 230–242 CrossRef CAS.
-
H. S. Fogler, Elements of Chemical Reaction Engineering, 6th edn, 2006, pp. 813–866 Search PubMed.
- R. K. Sharma, D. L. Cresswell, E. J. Newson and E. J. Newson, Ind. Eng. Chem. Res., 1991, 30, 1428–1433 CrossRef CAS.
- J. P. den Breejen, J. R. A. Sietsma, H. Friedrich, J. H. Bitter and K. P. de Jong, J. Catal., 2010, 270, 146–152 CrossRef CAS.
- J. P. den Breejen, P. B. Radstake, G. L. Bezemer, J. H. Bitter, V. Frøseth, A. Holmen and K. P. de Jong, J. Am. Chem. Soc., 2009, 131, 7197–7203 CrossRef CAS PubMed.
|
| This journal is © the Owner Societies 2022 |
Click here to see how this site uses Cookies. View our privacy policy here. 
 Open Access Article
 This Open Access Article is licensed under a
  *a,
Juha
Lehtonen
*a,
Juha
Lehtonen