
 Open Access Article
 This Open Access Article is licensed under a Creative Commons Attribution-Non Commercial 3.0 Unported Licence
Downward fingering accompanies upward tube growth in a chemical garden grown in a vertical confined geometry†
Yang
Ding‡
 a,
Carlos M.
Gutiérrez-Ariza‡
b,
Mingchuan
Zheng
*a,
Amy
Felgate
a,
Anna
Lawes
a,
C. Ignacio
Sainz-Díaz
b,
Julyan H. E.
Cartwright
*bc and
Silvana S. S.
Cardoso
*a
a,
Carlos M.
Gutiérrez-Ariza‡
b,
Mingchuan
Zheng
*a,
Amy
Felgate
a,
Anna
Lawes
a,
C. Ignacio
Sainz-Díaz
b,
Julyan H. E.
Cartwright
*bc and
Silvana S. S.
Cardoso
*a
aDepartment of Chemical Engineering and Biotechnology, West Cambridge Site, University of Cambridge, Philippa Fawcett Drive, Cambridge CB3 0AS, UK. E-mail: mz474@cam.ac.uk; sssc1@cam.ac.uk
bInstituto Andaluz de Ciencias de la Tierra, Consejo Superior de Investigaciones Científicas-Universidad de Granada, Avenida de las Palmeras, 4, E-18100 Armilla, Granada, Spain. E-mail: julyan.cartwright@csic.es
cInstituto Carlos I de Física Teórica y Computacional, Facultad de Ciencias, Universidad de Granada, Avenida de Fuente Nueva, s/n, E-18071 Granada, Spain
First published on 19th July 2022
Abstract
Chemical gardens are self-assembled structures of mineral precipitates enabled by semi-permeable membranes. To explore the effects of gravity on the formation of chemical gardens, we have studied chemical gardens grown from cobalt chloride pellets and aqueous sodium silicate solution in a vertical Hele–Shaw cell. Through photography, we have observed and quantitatively analysed upward growing tubes and downward growing fingers. The latter were not seen in previous experimental studies involving similar physicochemical systems in 3-dimensional or horizontal confined geometry. To better understand the results, further studies of flow patterns, buoyancy forces, and growth dynamics under schlieren optics have been carried out, together with characterisation of the precipitates with scanning electron microscopy and X-ray diffractometry. In addition to an ascending flow and the resulting precipitation of tubular filaments, a previously not reported descending flow has been observed which, under some conditions, is accompanied by precipitation of solid fingering structures. We conclude that the physics of both the ascending and descending flows are shaped by buoyancy, together with osmosis and chemical reaction. The existence of the descending flow might highlight a limitation in current experimental methods for growing chemical gardens under gravity, where seeds are typically not suspended in the middle of the solution and are confined by the bottom of the vessel.
1 Introduction
Chemical gardens are plant-like structures resulting from mineral precipitation; they have been known for about four centuries.1–3 Since the 1970s, chemical gardens have been a subject of research in the context of understanding certain materials science phenomena including cement hydration and corrosion mechanics.4–6 Chemical gardens continue to be of interest in those areas, such as the reverse silicate garden effects observed during the hydration of cement.7 They are also recognised as laboratory analogues to geological structures, including hydrothermal vents in the ocean floor8–10 and sub-seafloor fluid-filled conduits.11 The formation of abiotic semi-permeable membranes via these reactions may have been a key factor responsible for the possible origin of life in ocean floor hydrothermal vents.12–15 Chemical-garden membranes here could be “rudimentary inorganic analogues” to cell membranes,16 and have significance in understanding how early life may have developed.17,18 The role of chemical gardens as potential environments to develop life has also been explored for astrobiological applications.19–26Chemical gardens have been shown to produce a wide range of precipitate structures, including lobes, spirals, hairs, filaments, worms, flowers, bulbs, plumes, tubes, and fingers.27–43 Precipitate colour depends on both the oxidation state of the metal cation and the coordination of water molecules around the precipitate structures. Taking the system of cobalt chloride and sodium silicate as an example, the precipitate varies in colour from pink to blue/green depending on whether there is octahedral or tetrahedral coordination of local water molecules.31,44 But changes in concentrations of the solutes produce greater changes in the precipitate structure than changing the metal cation,33 showing that the chemical garden is just as much dependent on physics as it is on chemistry.
In classical chemical gardens, there is a concentration difference between the two sides of a semi-permeable precipitate membrane. Water is transported across the membrane by osmotic flow, from the external to the internal solution,45,46 and the metal salt continues to dissolve as more water is transported. The pressure on the inside of the membrane increases until it exceeds the mechanical strength of the precipitate membrane, which then ruptures at certain locations. From the rupture points, the metal salt solution is expelled into the surrounding solution as a jet, whose driving force is the pressure gradient between the inside of the membrane and the outside, which may also be affected by buoyancy.27 This leads to a complex interaction between reactive-convective, osmotic, viscous, and buoyancy forces in determining the growth of the chemical garden. The transient nature of a classical chemical garden, with the seed particle being gradually consumed, also adds to the complexity of the system.
Many previous investigations into chemical gardens have sought to reduce or eliminate buoyancy effects in order to simplify a highly complex system. A way to achieve this is to carry out the experiment under microgravity,47,48 which is difficult here on Earth. Studies have thus been carried out in setups known as “confined geometries” to lower the spatial dimensions of the problem. These include quasi-2D geometries such as horizontal Hele–Shaw cells11,32–34,39,40,49–55 and quasi-1D geometries such as microfluidic channels.56–61 In such setups, the vertical dimension is so small that gravity can be considered to produce negligible effects on the overall physics.
However, from wet corrosion environments to submarine hydrothermal vents, the effects of buoyancy cannot be ignored if these chemical garden phenomena are to be fully understood. Any attempt to base self-assembling materials on a chemical garden based, or chemobrionic technology2,3,62,63 will need to anticipate and manipulate buoyancy effects. Instances where buoyancy itself has been the centre of study are rare in the current literature; there has been only one recent study for chemical gardens grown in a vertical Hele–Shaw cell via injection-growth.64 This research aims to address the gap in knowledge of chemical garden dynamics in the presence of buoyancy forces with the pellet-growth technique in a vertical Hele–Shaw cell.
2 Materials and methods
Experiments have been carried out in a vertical Hele–Shaw cell with a constant gap of 1.0 mm. The cell consists of a pair of transparent methacrylate plates (130 × 100 × 6 mm) fitted to stainless steel frames and was illuminated with uniform lighting from a LED lightbox. Aqueous sodium silicate (Na2SiO3) solutions with different concentrations in the range of 1.5–3.0 M were prepared by dilution of a commercial 6.25 M concentrated solution with respect to silica (Honeywell Fluka). Cobalt(II) chloride hexahydrate (CoCl2·6H2O, ACS reagent, Acros Organic) crystals were pressed into pellets sized 10 mm in diameter and 1.0 mm in thickness using a KBr Port-A-Press Kit (International Crystal Laboratories) under an equivalent pressure of 110 MPa.Fig. 1 shows a schematic of the experimental procedure. To initiate an experiment, a CoCl2·6H2O pellet is placed in the centre of the Hele–Shaw cell. The cell is then moved to be vertical. Na2SiO3 solution with a desired concentration is injected into the cell by a syringe. The process of each experiment is recorded by a Nikon D300s digital single-lens reflex (DSLR) camera (4288 × 2848 pixels) with a Hoya circular polarizing lens filter in front of the cell. Samples of the CoCl2 solution formed within the region enclosed by a precipitate membrane are collected. The concentration is measured using an Agilent Cary 60 ultraviolet-visible spectrophotometer.
 | ||
| Fig. 1 Schematic of the experimental procedure. A pellet of CoCl2·6H2O crystals was placed in the middle of the Hele–Shaw cell, which was then immersed in Na2SiO3 solution. The process was recorded by a camera. | ||
To visualise the fluid flow patterns resulting from the chemical garden growth process, we also performed the experiments under dual-field-lens schlieren optics.65 A schematic of the setup is shown in Fig. 2. White light emerges from a slit or pinhole and is collimated by the first lens to create a beam whose diameter determines the field of view. This beam goes through the sample and is then focused by the second lens. Placing a spatial filter (knife edge) at where the light is focused enables the camera to capture changes in light intensity due to changes in refractive index in the sample. In our setup, a white Mi-LED Fiber Optic LED illuminator (Dolan-Jenner) was used as the light source and a pair of achromatic lenses (Edmund Optics) 76.6 mm in diameter and 849.9 mm focal length acted as the field lenses. A vertical knife edge was used as a spatial filter, and a Nikon D3400 (24MP sensor) with a 70–300 mm F4-5.6 APO DG macro lens (Sigma) was used to record the experiment.
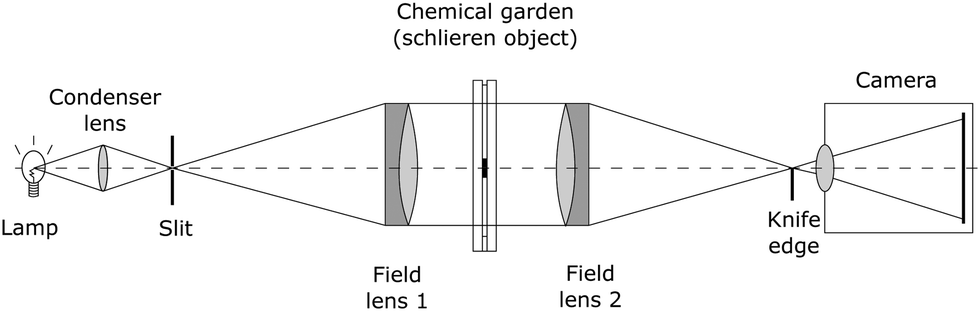 | ||
| Fig. 2 Schematic of the schlieren setup. White light emerges from a slit and is collimated by the first lens to create a beam whose diameter determines the field of view. This beam goes through the sample and is then focused by a second lens. Placing a spatial filter (knife edge) at where the light is focused enables the camera to capture changes in light intensity due to changes in refractive index in the sample. | ||
X-ray diffraction analyses were performed using a Bruker D8 Discover microfocus diffractometer with a PILATUS3R 100 K A detector with a Cu Kα wavelength. The micromorphology of the precipitate materials obtained was characterised with an FEI Quanta 400 scanning electron microscope (SEM) and analysed chemically in situ in the microscope by electron energy dispersive X-ray analysis (EDX).
The densities and dynamic viscosities of Na2SiO3 and CoCl2 solutions with various concentrations were measured experimentally. The density of each solution was measured by an Anton Paar DMA 35N Density Meter, and the viscosity of the fluid was measured using a Couette viscometer with a cup diameter of 34 mm and a bob of 32 mm diameter and 34 mm length.
3 Results and discussion
3.1 Formation process
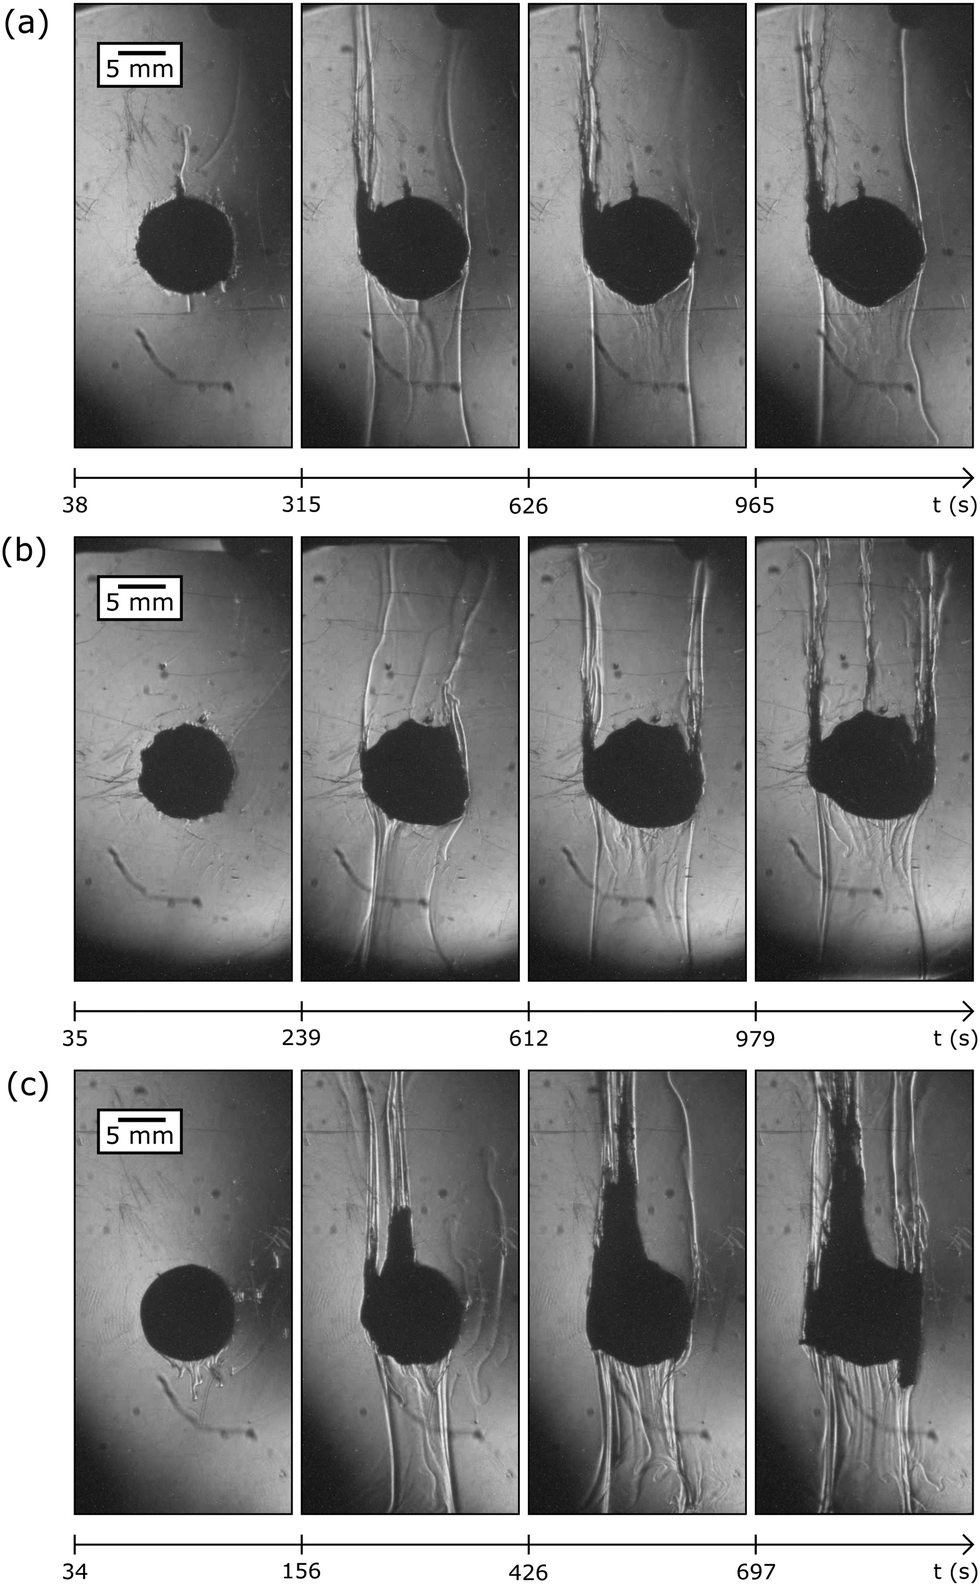
Fig. 3 shows photographs of the vertically confined chemical gardens taken at time intervals throughout their respective experiments for a range of different Na2SiO3 concentrations. Videos showing the growth processes are provided as part of the ESI.† | ||
| Fig. 3 Photographs of chemical gardens confined in a vertical Hele–Shaw cell showing both upward tube growth and downward finger growth when a CoCl2 pellet reacts with (a) 1.5 M, (b) 2.0 M and (c) 3.0 M Na2SiO3. | ||
Immediately as the CoCl2 pellet comes in contact with the Na2SiO3 solution, the pellet begins to dissolve, and Co2+ ions are released and react with SiO32− ions. A semi-permeable membrane forms and encloses the region occupied by the pellet. The membrane separates the saturated Co2+ ions inside the membrane enclosure from the dilute SiO32− ions outside, which leads to a steep concentration difference across the membrane. An osmotic pressure gradient develops owing to this concentration difference, which causes water molecules to permeate through the membrane and accumulate in the enclosure. This gradually increases the internal pressure. The internal pressure drives Co2+ out of the membrane to form precipitates with SiO32−, which thickens the membrane.
During the early stages of the growth process, the precipitation membrane is of low mechanical strength and cannot withstand the sudden increase of the internal pressure. Parts of the membrane crack as little pores, and the internal Co2+ solution is ejected out through them. The rising jets are generated by this internal solution, being buoyant in the surrounding silicate solution. Vertical tubular structures form around jets when they rise and the two solutions react. These tubes grow upwards through an oscillatory process of capping and re-rupture. Previous studies have revealed that the external surface of a tube is rich in silicate while the internal surface is made up of cobalt oxides.27
An interesting phenomenon that must be noted here is the formation of precipitates descending from the base of the pellet, which is visible in Fig. 3(b) and (c). This phenomenon was not previously reported for chemical gardens in 3D geometry or horizontal Hele–Shaw cells. The descending structure extended and spread under its own density, with precipitates forming around its peripheries at Na2SiO3 concentrations of 2.0 M and above. As the front extended, parallel layers of precipitates formed. There were therefore two modes of release from the rupturing of the initial membrane: upwards from the pellet, forming vertical tubes that grew up; and downwards from the pellet, forming descending fingers directed towards and along the bottom of the cell. In other words, the morphology of the materials formed in the ascending flows was different from those of the descending flows. Fine tubes or filaments formed upwards, whereas broad and rugged fingers formed downwards.
Later, towards the end of the experiment, an explosive rupture of the chemical-garden membrane can occur. This is similar to that observed in experiments conducted in horizontal Hele–Shaw cells,51 and is due to the continuous build-up of internal pressure inside the chemical garden membrane due to the gradual closure of pores within the membrane as the reaction proceeds. The explosion of a chemical garden is characterised by pellet shattering and sudden ejection of Co2+ solution out of the membrane. Each time the membrane pores are blocked and vertical filaments are capped by precipitates, there is no route for the internal aqueous solution of Co2+ to be released. Therefore, the internal pressure increases until the overall critical stress of the membrane is reached, whence the chemical garden ruptures via a rapid explosive phenomenon.51 The existence of this phenomenon implies that osmosis plays an important role in the overall physicochemical process of the chemical garden growth. However, we would like to note that the phenomenon of explosion itself has not been the focus of this work; it can be studied as part of a separate work in the future.
3.2 Upward tube growth
In the experiments, green tubular filaments have been observed to grow upwards, as shown in Fig. 3. At low SiO32− concentrations, we observed long and thin tubular filaments growing from the edge of the membrane. However, if the silicate concentration is large, tubes tend to be shorter and appear in clusters. Tubes twist and interweave with each other, which we ascribe to interactions and coalescence between plumes.27 The upward growth direction is sustained by the internal pressure and buoyancy forces. The internal pressure is supplied by the osmotic pressure while the buoyancy force is sustained by the density difference.The growth behaviour of the tubular filaments is presented in Fig. 4. Some filaments grew continuously throughout the whole experiment, although the growth speed may slow down during the later phase. In other instances, growth completely slowed down, due to reduced flow through the filament or complete capping over. However, many filaments grew periodically. An oscillatory growth pattern can be seen across the whole concentration range under investigation, caused by repeated capping and bursting of filament tips. Deposits formed at the tip of a filament and would block its growth. Thereafter, the internal pressure built up, and the filament tip ruptured so that growth could resume. This oscillatory behaviour coincides with that described in the literature for injection experiments,66 where the experiments carried out in this study can be considered within the ‘popping’ and ‘budding’ regimes. A difference from those injection experiments with a pump is that, in our case, with a pellet experiment set-up, growth is sustained not by external pumping but by the intrinsic physio-chemical properties of internal pressure, osmotic effects, and buoyancy forces.50
 | ||
| Fig. 4 Oscillatory growth profiles of tubular filaments formed by the CoCl2 pellet reacting with Na2SiO3 concentrations of (a) 1.25 M, (b) 1.5 M, (c) 2.0 M and (d) 2.5 M. | ||
 | ||
| Fig. 5 Plot of average upward tubular filament growth rates against sodium silicate concentrations. Error bars were obtained using growth rates estimated from multiple tubes. | ||
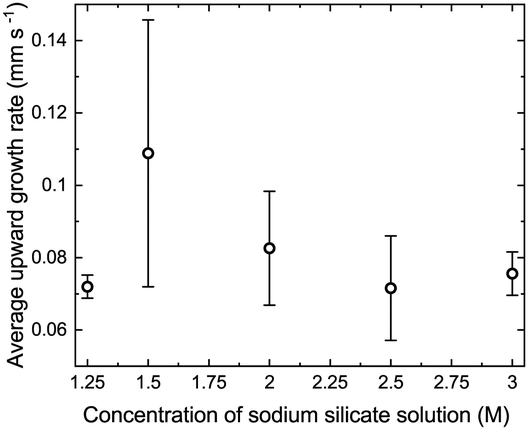
Tube growth rates are determined by osmotic pressure across the membrane, the dissolution rate of the pellet, and the solubility of the metal salt. Inside the membrane, the Co2+ solution is saturated and the concentration is the same in every case. Thus, the osmotic pressure decreases as Na2SiO3 outside the membrane is more concentrated. Fig. 5 summarises the average growth rates of the upward tubes against concentrations of sodium silicate solution used; similar average filament growth rates within the range 60–82 μm s−1 have been observed across different silicate concentrations. Overall, no clear trend with external solution concentration can be seen. In injection experiments, constant average growth velocities had been observed along with the oscillatory growth character,66,67 which agrees with the results we have obtained. However, a dependence on flow rate was found in injection experiments,11,39,40,54 which we have not seen in our experiments here. Our explanation is that a higher silicate concentration can both increase and decrease upward outflow, which may result in a non-dependence between growth rates of tubes and silicate concentration. More details of this will be discussed in Section 3.5.
3.3 Downward finger growth
The downward growing precipitate fingers, as displayed in Fig. 6(a1) and (b1), that descend from the pellets, are previously unreported features of chemical gardens. They are observed in the vertical configuration of this study when the concentration of silicate is 2.0 M or above. Rough growth fronts of these fingers are shown in Fig. 6(a2) and (a3) and (b2)–(b5). There are no similar morphological structures when the silicate concentration is lower than 1.5 M.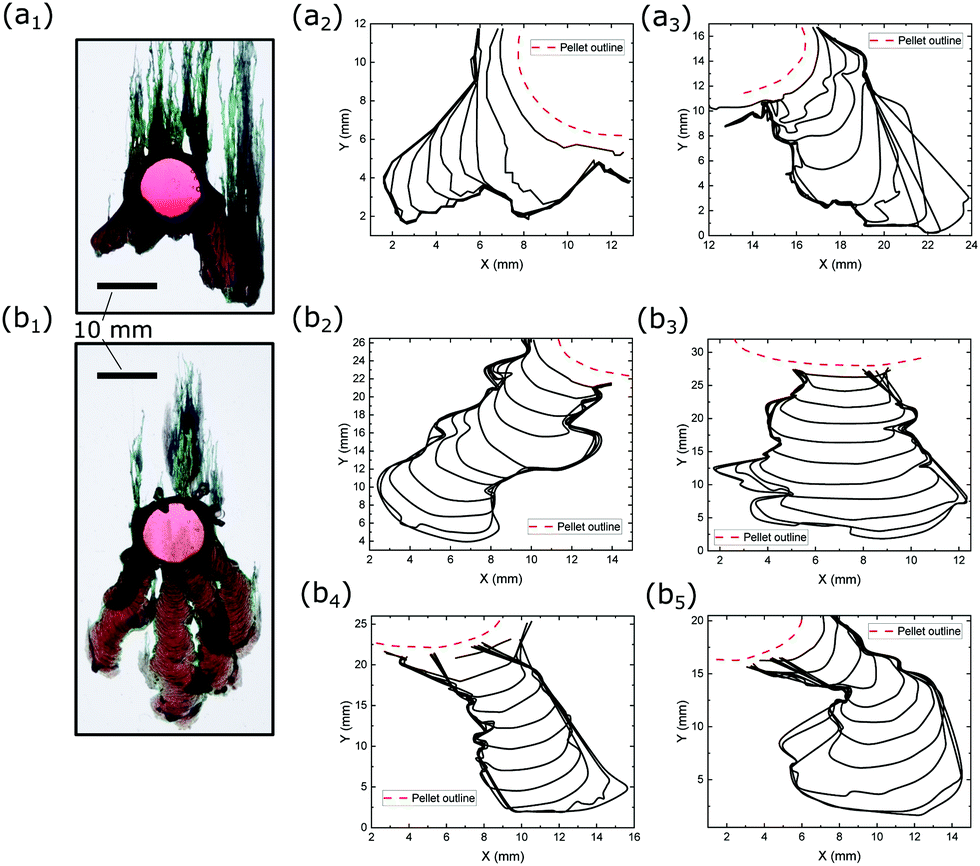 | ||
| Fig. 6 Contours of downward fingers formed by the reaction between a CoCl2 pellet and (a) 2.0 M and (b) 3.0 M Na2SiO3 solutions. | ||
The lack of observation of structures, however, does not imply that no flow exists. In order to better understand this phenomenon, experiments were also performed with schlieren optics. Under schlieren optics, a descending flow can be observed for all concentrations of silicates studied. In Fig. 7, two fluid flows can be seen: one upwards and the other downwards. Both upward and downward fluid flows are different in refractive index to the external medium of sodium silicate, owing to a different composition, and so are clearly visible under schlieren optics. The descending flow started before the ascending flow. At low concentrations of silicate and before the precipitation process, the descending flow could be distinguished only by schlieren optics. Films showing this fluid dynamics are provided in the ESI.†
 | ||
| Fig. 7 Schlieren images showing both upward and downward flows due to the reaction between a CoCl2 pellet and (a) 1.0 M (b) 1.5 M, and (c) 3.0 M sodium silicate solution. The width of the window is 30 mm. | ||
A wealth of different descending fingers were observed, and these have been tracked over time in Fig. 6. The contours are evenly spaced, showing an approximately constant speed for the fingering fronts. From here, the growth speeds of the descending fingers against the total lengths of the finger paths (which are normalised to the height scale of gravity flow, estimated to be 5.0 mm) were plotted in Fig. 8. It is shown that the speeds are approximately constant, between 0–20 μm s−1, for the entire duration of the flow and for all silicate concentrations, hence revealing no clear dependence on the concentration of silicate. There are a few anomalous points that give spikes in the speed, which were due to the direction changing of the descending fingers. Given that the speed of the descending flow front was approximately constant, the average speed could be calculated for each flow. All flow fronts had an average speed between 5.79–12.7 μm s−1.
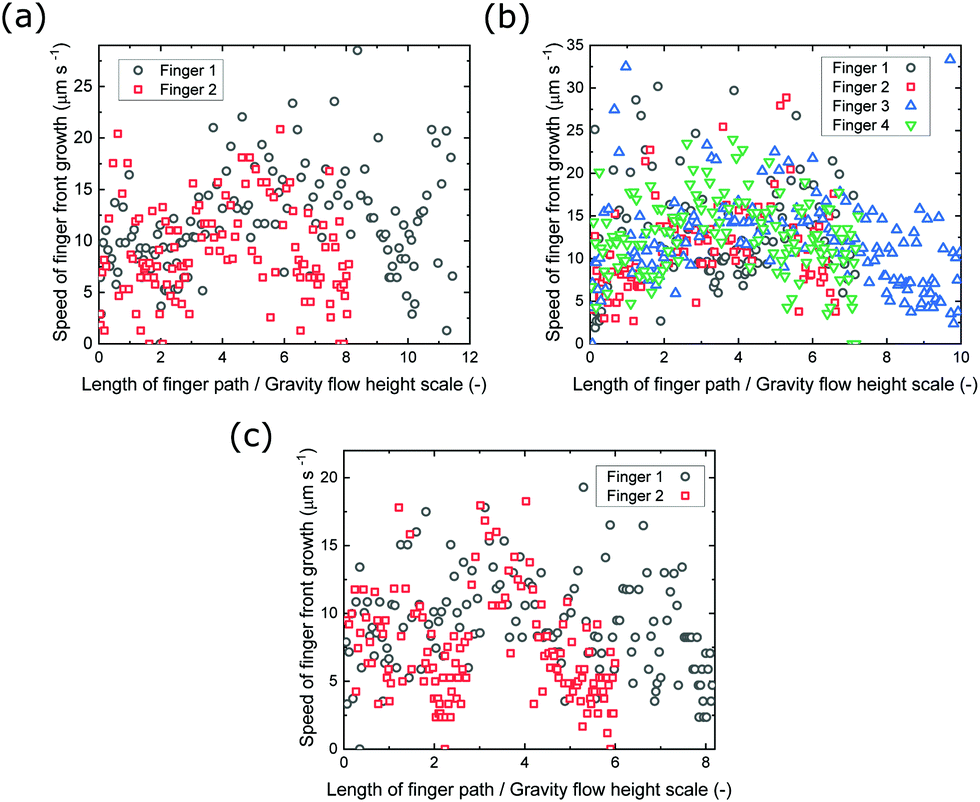 | ||
| Fig. 8 Growth speeds of the descending fingers against the total lengths of the finger paths from CoCl2 pellet reacting with Na2SiO3 concentrations of (a) 2.0 M, (b) 2.5 M and (c) 3.0 M. Lengths of the finger paths were normalised to the height scale of gravity flow, which is estimated to be 5.0 mm. | ||
The existence of the descending flow and precipitate structure might highlight a limitation in current experimental studies of chemical gardens under buoyancy. Classical experiments of 3D gardens grown from a seed are still carried out by many scholars and have produced a lot of important results.68–72 Typically, the procedure involves placing a seed crystal of metal salt at the bottom of the vessel and filling it with solution. Thereafter, precipitation occurs around the seed and forms a semi-permeable membrane, and we will then observe tubular filaments just like the upward-growing tubes reported in this paper. But, because the seed touches the bottom of the beaker, its bottom is confined by a surface; the physics related to the downward flow and precipitate growth will be interfered and rendered not observable. To this end, a potential implication is that future studies of chemical gardens under gravity may benefit from having the seed suspended in the middle of the solution instead of touching the bottom.
3.4 Materials characterisation
In X-ray diffractograms of the tubes formed, the most crystalline phases can be characterised, as displayed in Fig. 9. No significant differences have been observed between compositions of the upper zones of the tubes and the bottom zones close to the seed. The main component is cobalt chloride, whose reflections are marked with a c. Sodium chloride crystals – reflections marked with h – are observed in samples analysed without washing. In some samples, amorphous phases are seen as broad peaks in the diffractograms, especially in the range of 15–38° (2θ units), and these correspond to silicates. A reflection at 38.5° might be assigned to the presence of cobalt hydroxide, but this assignment is not firm owing to the lack of a reflection at 19° (JCPDS file#74-1057). The reflections of cobalt oxides can be observed at 31–32°, 37–38°, and 45.5°, although with low intensities which indicate phases of low crystallinity.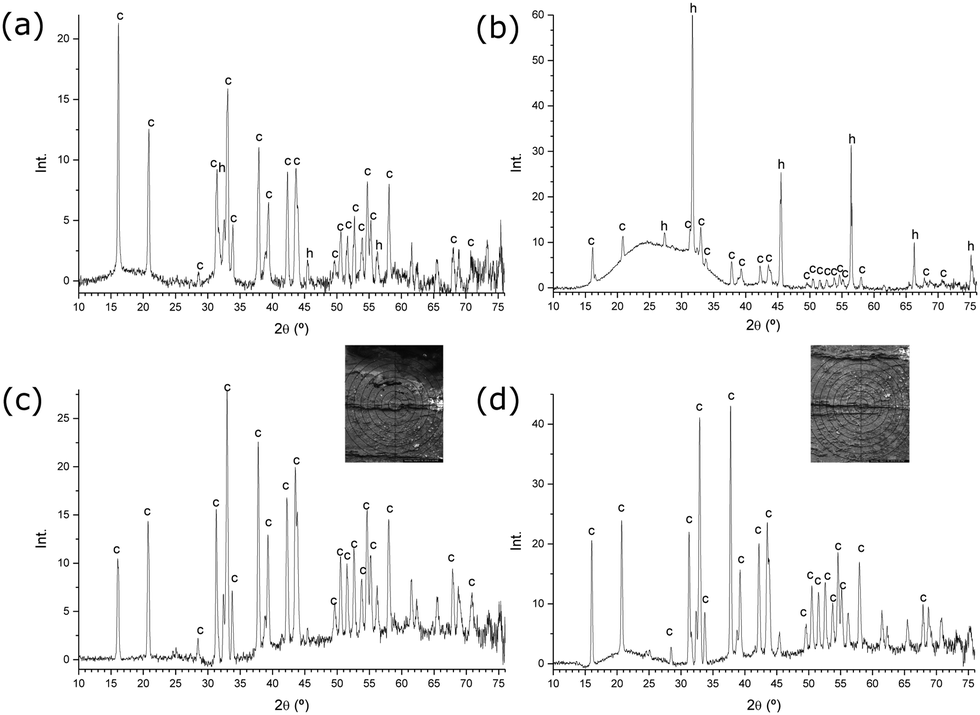 | ||
| Fig. 9 X-ray diffraction patterns of chemical-garden tubes formed: (a) and (b) without washing; (c) and (d) after washing. The reflections marked with c and h are from cobalt chloride and halite, respectively. The images are the microfocus positions on the tubes. | ||
Interesting differences can be detected upon observing these structures under SEM. Whereas in the structures formed with 1.0 M silicate, the tubular structures are more straight (Fig. 10(a)), in the samples formed with 3.0 M silicate, several tubes starting from the membrane can be observed showing the oscillatory patterns discussed before in Sections 3.1 and 3.2 (Fig. 11(a)–(c)). Radial crystal growth can be observed for both concentrations, as seen in Fig. 10(f) and 11(d), which points towards the direction perpendicular to the external tube surface; this is a similarity between the morphological patterns of the two growth processes under different silicate concentrations.
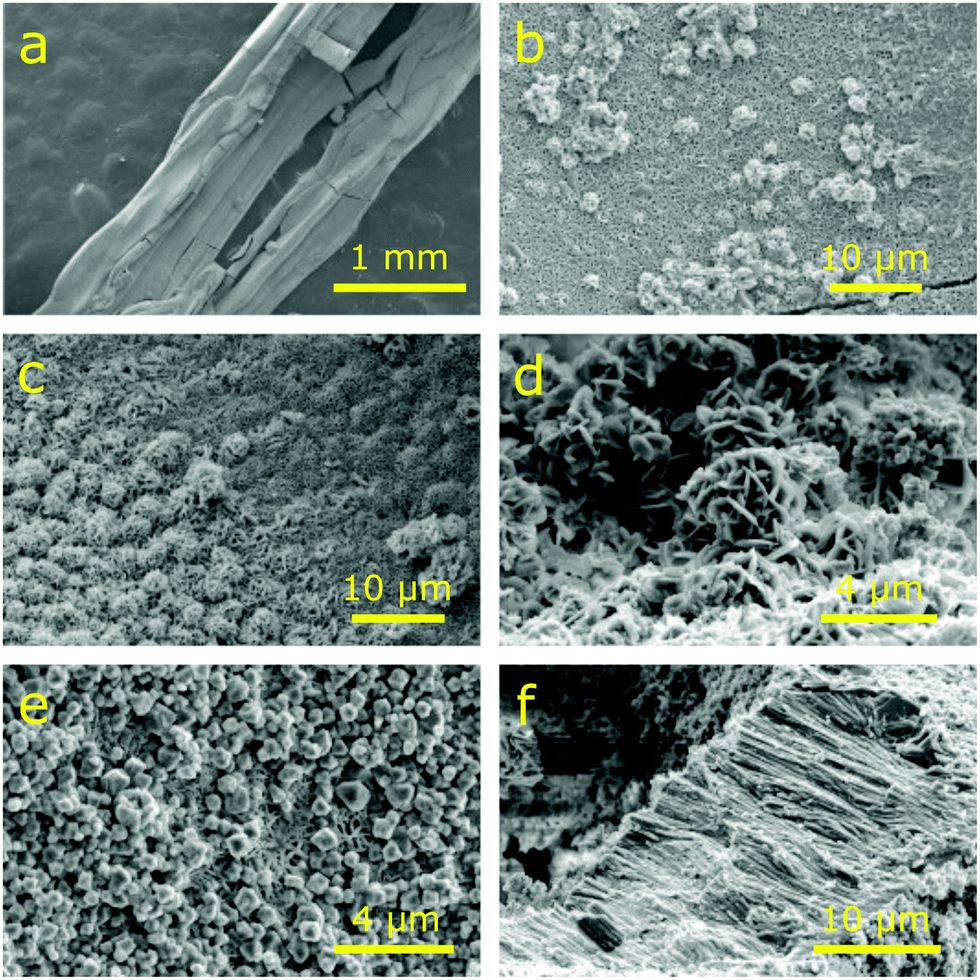 | ||
| Fig. 10 SEM micrographs of precipitate structures formed with 1.0 M sodium silicate solution. | ||
 | ||
| Fig. 11 SEM micrographs of precipitate structures formed with 3.0 M sodium silicate solution. | ||
In the internal surface of the tubes formed with 1.0 M silicate (Fig. 10), crystals of cobalt hydroxide/oxide are observed (Fig. 10(b)–(d)), along with sodium chloride crystals (Fig. 10(e)). From EDX analysis, it is seen that, in general, the silicate concentration is higher in the solid that is close to the boundaries, whereas the internal zones have more Cl− and Co2 + ions (Fig. 12(a) and (b)). On the contrary, in structures formed with 3.0 M silicate solutions (Fig. 12(c)–(f)), some phases of cobalt oxide/hydroxide are formed with low chloride content.
 | ||
| Fig. 12 SEM micrographs of solids formed in the chemical gardens together with EDX chemical analyses with 1.0 M (a and b) and 3.0 M (c)–(f) sodium silicate. | ||
In the solids that precipitate below the initial pellet, a striated internal surface is observed. Many tiny microtubes are visible in the electron microscope arising from this internal surface with an average internal diameter of 5–10 μm (Fig. 11(a) and (c)). These microtubes are mainly cobalt oxide/hydroxides with a small proportion of silicate, whereas the internal surface of the downwards fingers has also silicate with cobalt oxide and a certain amount of sodium chloride (Fig. 12(c)).
3.5 Fluid flows
The physical properties of solutions taking part in the experiments are listed in Table 1. A sample of the solution of cobalt within the enclosure occupied by the original was collected; its concentration was found to be 3.4 M, which is close to its saturated solubility in water under room temperature.73| c (M) | ρ (× 103 kg m−3) | μ (× 10−3 Pa s) | |
|---|---|---|---|
| Na2SiO3 | 0.5 | 1.0371 | 1.38 |
| 1 | 1.0636 | 1.63 | |
| 1.5 | 1.1002 | 2.01 | |
| 2 | 1.1438 | 2.52 | |
| 2.5 | 1.1774 | 3.18 | |
| 3 | 1.2107 | 4.16 | |
| CoCl2 | 3.4 | 1.3448 | 4.86 |
Fluid flows in this system are driven continuously by the inflow of water into the pellet through the membrane, which dissolves the CoCl2 pellet inside the membrane and drives more flow through osmotic pumping.52 As we have seen from Fig. 7, there are fluid flows both upwards and downwards, the difference between which is likely due to buoyancy. The saturated solution of CoCl2 has a density of approximately 1.34 g cm−3, and this is denser than the external Na2SiO3 solution for all experiments. Thus, depending on the concentration of cobalt chloride, its solution can be denser or less dense than the surrounding sodium silicate, so it can be either positively or negatively buoyant (i.e., tending to flow upward or downward). Moreover, there are two cations in this system, sodium and cobalt, and two anions, chloride and silicate: initially, we had two solutions, cobalt chloride and sodium silicate; after reaction, we had solid cobalt silicates but also aqueous sodium chloride solution. In a previous work, we were able to find the entrance of sodium cations through the semi-permeable membrane.31
It can be helpful to consider a couple of order-of-magnitude calculations to compare the effects of buoyancy against the effects of osmosis in this system. The overall pressure due to gravity is given as Δρgh, where Δρ is the density difference between the internal CoCl2 solution and the external Na2SiO3, g is the acceleration due to gravity, and h is the height scale of the flow. In our experiments, the density difference between the internal saturated CoCl2 solution and the outside Na2SiO3 is about 200 kg m−3, and the height scale whereon downwards flow occurs is around 5.0 mm, as mentioned in Section 3.3. This allows us to calculate the pressure due to gravity to be around 10 Pa.
The overall osmotic pressure, Π, across the membrane may be calculated from the thermodynamic properties of the chemicals in water based on the relation74
| Π = RT (ϕCocCo − ϕSicSi), | (1) |
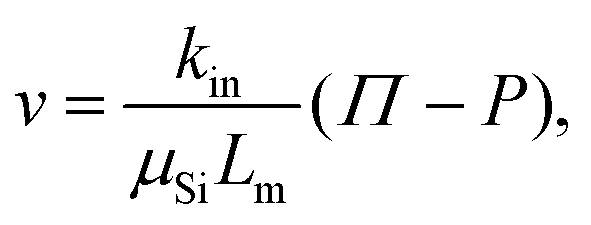
The osmotic flow can be described by a version of the Kedem–Katchalsky model45,46,51,52
 | (2) |
The speed of flow controlled by gravity can be given by Darcy's law51,52
 | (3) |
If we apply the speed calculated in eqn (2) and (3), (i.e., if we make u = v), invoking the Δρgh given before, then kout is calculated to be ∼9 × 10⁻¹³ m2, a value that is close in order of magnitude to the data for outflow permeability obtained from our previous research on horizontal pellet-grown gardens.51,52 This implies that, although osmosis is involved in this system, as evident in the rapid explosive rupture of the membrane,51 buoyancy forces are able to create an effect as large as that of osmosis, thus are able to determine the behaviour of both downward and upward flows.
Conceptually, for both upward and downward flows, the effects of having a more concentrated silicate solution in the outside medium will be threefold: first, the precipitation reaction will be faster; then, buoyancy effects will be less because the difference between densities of the silicate and cobalt chloride solutions reduces; next, the overall osmotic flow will reduce because osmotic pressure of the silicate solution increases, which reduces the amount of inward osmotic flow. Therefore, in the downward direction, an increase in silicate concentration will always decrease the downward flow rate. In the upward direction, an increase in silicate concentration will decrease osmosis, and hence a decrease in the upward flow rate, but will also reduce buoyancy, and hence increase the upward flow. As we noted in Section 3.2, there is no obvious dependence of the average growth rates of tubes on sodium silicate concentration. It might be that neither of the opposing effects has a dominant effect on the process, which can be explained by the calculations above.
We consider that, at low silicate concentrations, <2.0 M, the downward flow is likely sodium chloride rich and cobalt ion poor, so it is denser than the silicate medium and descends under negative buoyancy forces but does not precipitate. The upward flow at the same silicate concentration must have a high enough cobalt ion concentration to precipitate, yet low enough to be positively buoyant in the silicate. At higher silicate concentrations, 2.0–3.0 M, the supersaturation level can be reached earlier and precipitation can also occur in the downward as well as in the upward flow.
The discussions above may have explained why the upward flow differs from the downward flow, but we do not yet have an explanation for how the actual morphological patterns of the upward and downward precipitate structures have emerged. More specifically, we do not yet know why the downward flow produces precipitates resembling fingers and upward flow produces precipitates resembling tubular filaments. We believe that these patterns are caused by certain mechanical instabilities related to the difference in flow behaviour between upward and downward flows, which is probably enhanced when combined with interfacial phenomena such as surface tension effects.87–89 We would like to highlight that, except when addressing gas bubbles,28 surface tension has not been frequently discussed by scholars studying chemical gardens.
It should be noted that, when experiments are performed in a Hele–Shaw cell made of polished glass surfaces, the point at which the downward precipitation occurs shifts; for experiments with 3.0 M silicate solution, downward precipitation was no longer observed. We believe this is due to the differing roughness factors of methacrylate and polished glass surfaces, which will probably reflect in the physics of the system as differing values of kout or nucleation rates. Further studies will be needed to confirm the effects of material selection of the Hele–Shaw cell plates.
4 Conclusions
We have studied chemical gardens grown from a CoCl2 pellet and Na2SiO3 solution in a vertical Hele–Shaw cell. The oscillatory growth pattern of vertical tubular filaments has been observed for upward growing structures, similar to the growth of tubular structures in the literature. Growth rates of the filaments have been measured. A new feature in the experiments is the downward fluid flow driven by gravity. At silicate concentrations above 2.0 M, precipitation from this descending flow results in downward growing fingers. The study has been an attempt to address the scarcity of the literature centring on the effects of buoyancy in the formation of chemical gardens.We hope that, in the future, studies can reveal more details of how the combined effects of osmosis and buoyancy give rise to the morphological patterns observed in our experiments. We look forward to a good mathematical description of the physicochemical process. Both analytical modelling58 and computational fluid dynamics (CFD) simulation90,91 will help understand this complex phenomenon. In our view, to explain the observed morphological behaviour, we need to discuss the effects of interfacial phenomena, in particular that of surface tension.87–89
We also look forward to experiments with pellet-grown vertical chemical gardens in similar setups but under other physicochemical conditions, such as with a different metal or in a different solution. Although the explosive rupturing of the membrane was observed in this study and of some relevance to our discussions, it has not been the focus of investigation in the present work. Future studies will be carried out specifically to address this phenomenon—to quantitatively demonstrate if and how gravity may affect the explosion behaviour of chemical gardens in confined geometries. The existence of the downward flow and growth implies that experimental studies of chemical gardens under gravity may benefit from having the seed at a suspended position, so that physics beneath the garden may be revealed. Effects of the choice of material for the Hele–Shaw cell plates should be systematically looked at—if glass plates will consistently produce a different outcome from methacrylate plates. The gap size of the Hele–Shaw cell may also affect the outcomes of experiments and should be investigated in a next work.
Author contributions
Y. D., C. M. G.-A., C. I. S.-D., J. H. E. C., and S. S. S. C. designed the methodology. Y. D., C. M. G.-A., A. F., A. L., and C. I. S.-D. performed the experiments and analysed the results. Y. D., C. M. G.-A., M. Z., C. I. S.-D., J. H. E. C., and S. S. S. C. interpreted the results and prepared the manuscript. C. I. S.-D., J. H. E. C., and S. S. S. C. conceptualised and supervised the research.Conflicts of interest
There are no conflicts of interest to declare.Acknowledgements
S. S. S. C. acknowledges the financial support from the UK Leverhulme Trust project RPG-2015-002. J. H. E. C. and C. I. S.-D. acknowledge the financial support from the Spanish MINECO projects FIS2016-77692-C2-2PP and PCIN-098. S. S. S. C., C. I. S.-D. and J. H. E. C. acknowledge the financial and networking support from the European COST action CA17120. C. M. G.-A. thanks Teresa Huertas-Roldán for help with schlieren optics.References
- J. Glauber, Furni Novi Philosophici, Joannem Janssonium, Amsterdam, 1658 Search PubMed.
- L. M. Barge, S. S. S. Cardoso, J. H. E. Cartwright, G. J. T. Cooper, L. Cronin, A. De Wit, I. J. Doloboff, B. Escribano, R. E. Goldstein, F. Haudin, D. E. H. Jones, A. L. Mackay, J. Maselko, J. J. Pagano, J. Pantaleone, M. J. Russell, C. I. Sainz-Díaz, O. Steinbock, D. A. Stone, Y. Tanimoto and N. L. Thomas, Chem. Rev., 2015, 115, 8652–8703 CrossRef CAS PubMed.
- S. S. S. Cardoso, J. H. E. Cartwright, J. Čejková, L. Cronin, A. De Wit, S. Giannerini, D. Horváth, A. Rodrigues, M. J. Russell, C. I. Sainz-Díaz and A. Tóth, Artif. Life, 2020, 26, 315–326 CrossRef PubMed.
- D. D. Double and A. Hellawell, Nature, 1976, 261, 486–488 CrossRef CAS.
- R. D. Coatman, N. L. Thomas and D. D. Double, J. Mater. Sci., 1980, 15, 2017–2026 CrossRef CAS.
- T. S. Sørensen, J. Colloid Interface Sci., 1981, 79, 192–208 CrossRef.
- S. S. S. Cardoso, J. H. E. Cartwright, O. Steinbock, D. A. Stone and N. L. Thomas, Struct. Chem., 2017, 28, 33–37 CrossRef CAS.
- D. S. Kelley, J. A. Karson, D. K. Blackman, G. L. Früh-Green, D. A. Butterfield, M. D. Lilley, E. J. Olson, M. O. Schrenk, K. K. Roe, G. T. Lebon, P. Rivizzigno and the AT3-60 Shipboard Party, Nature, 2001, 412, 145–149 CrossRef CAS PubMed.
- S. S. S. Cardoso and J. H. E. Cartwright, Proc. R. Soc. A, 2017, 473, 20170387 CrossRef PubMed.
- P. Wang and Z. Jian, Sci. China: Earth Sci., 2019, 62, 1473–1488 CrossRef.
- L. A. M. Rocha, C. Gutiérrez-Ariza, C. Pimentel, I. Sánchez-Almazo, C. I. Sainz-Díaz, S. S. S. Cardoso and J. H. E. Cartwright, Geochem., Geophys., Geosyst., 2021, 22, e2021GC009724 CrossRef.
- W. Martin and M. J. Russell, Philos. Trans. R. Soc., B, 2007, 362, 1887–1925 CrossRef CAS PubMed.
- W. Martin, J. Baross, D. Kelly and M. J. Russell, Nat. Rev. Microbiol., 2008, 6, 805–814 CrossRef CAS PubMed.
- L. M. Barge, E. Branscomb, J. R. Brucato, S. S. S. Cardoso, J. H. E. Cartwright, S. O. Danielache, D. Galante, T. P. Kee, Y. Miguel, S. Mojzsis, K. J. Robinson, M. J. Russell, E. Simoncini and P. Sobron, Origins Life Evol. Biospheres, 2017, 47, 39–56 CrossRef CAS PubMed.
- J. M. García-Ruiz, E. Nakouzi, E. Kotopoulou, L. Tamborrino and O. Steinbock, Sci. Adv., 2017, 3, e1602285 CrossRef PubMed.
- F. M. Möller, F. Kriegel, M. Kieß, V. Sojo and D. Braun, Angew. Chem., Int. Ed., 2017, 56, 2340–2344 CrossRef PubMed.
- J. H. E. Cartwright and M. J. Russell, Interface Focus, 2019, 9, 20190104 CrossRef.
- E. Kotopoulou, M. Lopez-Haro, J. J. Calvino Gamez and J. M. García-Ruiz, Angew. Chem., Int. Ed., 2020, 60, 1396–1402 CrossRef PubMed.
- L. M. Barge, S. S. S. Cardoso, J. H. E. Cartwright, I. J. Doloboff, E. Flores, E. Macías-Sánchez, C. I. Sainz-Díaz and P. Sobrón, Proc. R. Soc. A, 2016, 472, 20160466 CrossRef PubMed.
- J. Cosmidis and A. S. Templeton, Nat. Commun., 2016, 7, 12812 CrossRef CAS PubMed.
- S. McMahon, T. Bosak, J. P. Grotzinger, R. E. Milliken, R. E. Summons, M. Daye, S. A. Newman, A. Fraeman, K. H. Williford and D. E. G. Briggs, J. Geophys. Res.: Planets, 2018, 123, 1012–1040 CrossRef CAS PubMed.
- S. D. Vance, L. M. Barge, S. S. S. Cardoso and J. H. E. Cartwright, Astrobiology, 2019, 19, 685–695 CrossRef PubMed.
- S. S. S. Cardoso, J. H. E. Cartwright and C. I. Sainz-Díaz, Icarus, 2019, 319, 337–348 CrossRef CAS.
- S. McMahon and J. Cosmidis, J. Geol. Soc., 2021, 179, jgs2021–050 Search PubMed.
- C. I. Sainz-Díaz, B. Escribano, I. Sánchez-Almazo and J. H. E. Cartwright, Geophys. Res. Lett., 2021, 48, e2021GL092883 CrossRef.
- Y. Liu, X. Wu, Y.-Y. S. Zhao, L. Pan, C. Wang, J. Liu, Z. Zhao, X. Zhou, C. Zhang, Y. Wu, W. Wan and Y. Zou, Sci. Adv., 2022, 8, eabn8555 CrossRef CAS PubMed.
- J. H. E. Cartwright, J. M. García-Ruiz, M. L. Novella and F. Otálora, J. Colloid Interface Sci., 2002, 256, 351–359 CrossRef CAS.
- D. A. Stone and R. E. Goldstein, Proc. Natl. Acad. Sci. U. S. A., 2004, 101, 11537–11541 CrossRef CAS PubMed.
- L. M. Barge, I. J. Doloboff, L. M. White, G. D. Stucky, M. J. Russell and I. Kanik, Langmuir, 2012, 28, 3714–3721 CrossRef CAS PubMed.
- W. L. Noorduin, A. Grinthal, L. Mahadevan and J. Aizenberg, Science, 2013, 340, 832–837 CrossRef CAS PubMed.
- J. H. E. Cartwright, B. Escribano, S. Khokhlov and C. I. Sainz-Díaz, Phys. Chem. Chem. Phys., 2011, 13, 1030–1036 RSC.
- F. Haudin, J. H. E. Cartwright, F. Brau and A. De Wit, Proc. Natl. Acad. Sci. U. S. A., 2014, 111, 17363–17367 CrossRef CAS PubMed.
- F. Haudin, V. Brasiliense, J. H. E. Cartwright, F. Brau and A. De Wit, Phys. Chem. Chem. Phys., 2015, 17, 12804–12811 RSC.
- F. Haudin, J. H. E. Cartwright and A. De Wit, J. Phys. Chem. C, 2015, 119, 15067–15076 CrossRef CAS.
- S. S. S. Cardoso, J. H. E. Cartwright, A. G. Checa and C. I. Sainz-Díaz, Acta Biomater., 2016, 43, 338–347 CrossRef CAS PubMed.
- E. A. B. Hughes, R. L. Williams, S. C. Cox and L. M. Grover, Langmuir, 2017, 33, 2059–2067 CrossRef CAS PubMed.
- P. Kumar, D. Horváth and A. Tóth, Soft Matter, 2020, 16, 8325–8329 RSC.
- P. Kumar, D. Sebök, A. Kukovecz, D. Horváth and A. Tóth, Langmuir, 2021, 37, 12690–12696 CrossRef CAS PubMed.
- S. Wagatsuma, T. Higashi, Y. Sumino and A. Achiwa, Phys. Rev. E, 2017, 95, 052220 CrossRef PubMed.
- I. Ziemecka, F. Brau and A. De Wit, Chaos, 2020, 30, 013140 CrossRef CAS PubMed.
- P. Knoll, D. S. D’Silva, D. I. Adeoye, M. G. Roper and O. Steinbock, ChemSystemsChem, 2021, 3, e2000061 CAS.
- D. Spanoudaki, E. Pavlidou and D. Sazou, ChemSystemsChem, 2021, 3, e2000054 CrossRef CAS.
- M. Emmanuel, E. Lantos, D. Horváth and A. Tóth, Soft Matter, 2022, 18, 1731–1736 RSC.
- J. H. E. Cartwright, B. Escribano and C. I. Sainz-Díaz, Langmuir, 2011, 27, 3286–3293 CrossRef CAS PubMed.
- O. Kedem and A. Katchalsky, Biochim. Biophys. Acta, 1958, 27, 229–246 CrossRef CAS.
- S. S. S. Cardoso and J. H. E. Cartwright, R. Soc. Open Sci., 2014, 1, 140352 CrossRef PubMed.
- D. E. H. Jones and U. Walter, J. Colloid Interface Sci., 1998, 203, 286–293 CrossRef CAS PubMed.
- J. H. E. Cartwright, B. Escribano, C. I. Sainz-Díaz and L. S. Stodieck, Langmuir, 2011, 27, 3294–3300 CrossRef CAS PubMed.
- F. Brau, F. Haudin, S. Thouvenel-Romans, A. De Wit, O. Steinbock, S. S. S. Cardoso and J. H. E. Cartwright, Phys. Chem. Chem. Phys., 2018, 20, 784–793 RSC.
- Y. Ding, J. H. E. Cartwright and S. S. S. Cardoso, Interface Focus, 2019, 9, 20190064 CrossRef PubMed.
- Y. Ding, C. M. Gutiérrez-Ariza, C. I. Sainz-Díaz, J. H. E. Cartwright and S. S. S. Cardoso, Angew. Chem., Int. Ed., 2019, 58, 6207–6213 CrossRef CAS PubMed.
- Y. Ding, J. H. E. Cartwright and S. S. S. Cardoso, Phys. Rev. Fluids, 2020, 5, 082201 CrossRef.
- Q. Wang, K. S. Hernesman and O. Steinbock, ChemSystemsChem, 2020, 2, e1900037 CAS.
- L. A. M. Rocha, J. H. E. Cartwright and S. S. S. Cardoso, Phys. Chem. Chem. Phys., 2021, 23, 5222–5235 RSC.
- L. A. M. Rocha, L. Thorne, J. J. Wong, J. H. E. Cartwright and S. S. S. Cardoso, Langmuir, 2022, 38, 6700–6710 CrossRef CAS PubMed.
- B. C. Batista and O. Steinbock, J. Phys. Chem. C, 2015, 119, 27045–27052 CrossRef CAS.
- Y. Ding, B. Batista, O. Steinbock, J. H. E. Cartwright and S. S. S. Cardoso, Proc. Natl. Acad. Sci. U. S. A., 2016, 113, 9182–9186 CrossRef CAS PubMed.
- P. S. Eastham, M. N. J. Moore, N. G. Cogan, Q. Wang and O. Steinbock, J. Fluid Mech., 2020, 888, A20 CrossRef CAS.
- M. Emmanuel, D. Horváth and A. Tóth, CrysEngComm, 2020, 22, 4887–4893 RSC.
- Q. Wang and O. Steinbock, Langmuir, 2021, 37, 2485–2493 CrossRef CAS PubMed.
- D. Spanoudaki, F. Brau and A. De Wit, Phys. Chem. Chem. Phys., 2021, 23, 1684–1693 RSC.
- E. A. B. Hughes, M. Chipara, T. J. Hall, R. L. Williams and L. M. Grover, Biomater. Sci., 2020, 8, 812–822 RSC.
- E. A. B. Hughes, T. E. Robinson, R. J. A. Moakes, M. Chipara and L. M. Grover, Commun. Chem., 2021, 4, 145 CrossRef CAS.
- L. A. M. Rocha, J. H. E. Cartwright and S. S. S. Cardoso, Chaos, 2022, 32, 053107 CrossRef CAS PubMed.
- G. S. Settles, Schlieren and Shadowgraph Techniques, Springer, Berlin, 2001 Search PubMed.
- S. Thouvenel-Romans and O. Steinbock, J. Am. Chem. Soc., 2003, 125, 4338–4341 CrossRef CAS PubMed.
- S. Thouvenel-Romans, W. van Saarloos and O. Steinbock, Europhys. Lett., 2004, 67, 42–48 CrossRef CAS.
- C. Pimentel, J. H. E. Cartwright and C. I. Sainz-Díaz, ChemSystemsChem, 2020, 2, e2000023 CrossRef CAS.
- G. D. Zissi, G. Angelis and G. Pampalakis, ChemSystemsChem, 2021, 3, e2000018 CrossRef CAS.
- E. A. B. Hughes, O. Jones-Salkey, P. Forey, M. Chipara and L. M. Grover, ChemSystemsChem, 2021, 3, e2000062 CrossRef CAS.
- J. M. Weber and L. M. Barge, ChemSystemsChem, 2021, 3, e2000058 CrossRef CAS.
- M. Zouheir, T.-A. Le, J. Torop, K. Nikiforow, M. Khatib, O. Zohar, H. Haick and T.-P. Huynh, ChemSystemsChem, 2021, 3, e2000063 CrossRef CAS.
- H. W. Foote, J. Am. Chem. Soc., 1923, 45, 663–667 CrossRef CAS.
- A. J. Staverman, Recl. Trav. Chim. Pays-Bas, 1951, 70, 344–352 CrossRef CAS.
- R. A. Robinson and R. H. Stokes, Electrolyte Solutions, Dover, New York, 2nd edn, 2002 Search PubMed.
- H. Park and P. Englezos, Fluid Phase Equilib., 1998, 153, 87–104 CrossRef CAS.
- J. T. H. Andres and S. S. S. Cardoso, Phys. Rev. E: Stat., Nonlinear, Soft Matter Phys., 2011, 83, 046312 CrossRef PubMed.
- J. T. H. Andres and S. S. S. Cardoso, Chaos, 2012, 22, 037113 CrossRef PubMed.
- S. S. S. Cardoso and J. T. H. Andres, Nat. Commun., 2014, 5, 5743 CrossRef CAS PubMed.
- I. Cherezov and S. S. S. Cardoso, Phys. Chem. Chem. Phys., 2016, 18, 23727–23736 RSC.
- S. S. S. Cardoso and J. H. E. Cartwright, Nat. Commun., 2016, 7, 13266 CrossRef PubMed.
- I. Cherezov, S. S. S. Cardoso and M. C. Kim, Chem. Eng. Sci., 2018, 181, 298–310 CrossRef CAS.
- M. C. Kim and S. S. S. Cardoso, Phys. Fluids, 2018, 412, 094102 CrossRef.
- P. Ghoshal, M. C. Kim and S. S. S. Cardoso, Fluids, 2017, 3, 1 CrossRef.
- P. Ghoshal and S. S. S. Cardoso, Phys. Chem. Chem. Phys., 2018, 20, 21617–21628 RSC.
- J. Lasser, M. Ernst and L. Goehring, J. Fluid Mech., 2021, 917, A14 CrossRef.
- V. Kang, H. Isermann, S. Sharma, D. I. Wilson and W. Federle, Acta Biomater., 2021, 128, 357–369 CrossRef PubMed.
- S. Sharma and D. I. Wilson, J. Fluid Mech., 2021, 919, A39 CrossRef CAS.
- L. McGachy, J. Heyda, J. Tomas and J. Čejková, Colloids Surf., A, 2021, 621, 126541 CrossRef CAS.
- J. Y. M. Chew, S. S. S. Cardoso, W. R. Paterson and D. I. Wilson, Chem. Eng. Sci., 2004, 59, 3381–3398 CrossRef CAS.
- J. R. Mac Intyre, A. Puisto, M. Korhonen, M. Alava and J. Ortín, Phys. Rev. Fluids, 2021, 6, 084305 CrossRef.
Footnotes |
| † Electronic supplementary information (ESI) available: Videos showing flow dynamics in the Hele–Shaw cell created from photography and schlieren imaging. See DOI: https://doi.org/10.1039/d2cp01862d |
| ‡ These authors contributed equally to this work. |
| This journal is © the Owner Societies 2022 |