
 Open Access Article
 This Open Access Article is licensed under a
 Creative Commons Attribution 3.0 Unported Licence
Ion transport mechanism in anhydrous lithium thiocyanate LiSCN Part I: ionic conductivity and defect chemistry†
Markus
Joos
 a,
Maurice
Conrad
bc,
Ashkan
Rad
a,
Payam
Kaghazchi
d,
Sebastian
Bette
ab,
Rotraut
Merkle
*a,
Robert E.
Dinnebier
a,
Thomas
Schleid
b and
Joachim
Maier
a
a,
Maurice
Conrad
bc,
Ashkan
Rad
a,
Payam
Kaghazchi
d,
Sebastian
Bette
ab,
Rotraut
Merkle
*a,
Robert E.
Dinnebier
a,
Thomas
Schleid
b and
Joachim
Maier
a
aMax Planck Institute for Solid State Research, Heisenbergstr. 1, 70569, Stuttgart, Germany. E-mail: r.merkle@fkf.mpg.de
bInstitut für Anorganische Chemie, University of Stuttgart, Pfaffenwaldring 55, 70569, Stuttgart, Germany
cPresent address; Institut für Photovoltaik, University of Stuttgart, Pfaffenwaldring 47, 70569, Stuttgart, Germany
dForschungszentrum Jülich GmbH, Institute of Energy and Climate Research, Materials Synthesis and Processing (IEK-1), 52425, Jülich, Germany
First published on 5th August 2022
Abstract
This work reports on the ion transport properties and defect chemistry in anhydrous lithium thiocyanate Li(SCN), which is a pseudo-halide Li+ cation conductor. An extensive doping study was conducted, employing magnesium, zinc and cobalt thiocyanate as donor dopants to systematically vary the conductivity and derive a defect model. The investigations are based on impedance measurements and supported by other analytical techniques such as X-ray powder diffraction (XRPD), infrared (IR) spectroscopy, and density functional theory (DFT) calculations. The material was identified as Schottky disordered with lithium vacancies being the majority mobile charge carriers. In the case of Mg2+ as dopant, defect association with lithium vacancies was observed at low temperatures. Despite a comparably low Schottky defect formation enthalpy of (0.6 ± 0.3) eV, the unexpectedly high lithium vacancy migration enthalpy of (0.89 ± 0.08) eV distinguishes Li(SCN) from the chemically related lithium halides. A detailed defect model of Li(SCN) is presented and respective thermodynamic and kinetic data are given. The thiocyanate anion (SCN)− has a significant impact on ion mobility due to its anisotropic structure and bifunctionality in forming both Li–N and Li–S bonds. More details about the impact on ion dynamics at local and global scale, and on the defect chemical analysis of the premelting regime at high temperatures are given in separate publications (Part II and Part III).
1. Introduction
With the growing interest in solid state lithium ion batteries, solid lithium ion conductors are intensively studied, and significant progress has been achieved.1–5 A common strategy is to create a cation lattice with a flat potential landscape (high defect concentration and low activation energy), e.g. by choosing a highly polarizable anion lattice.6 A famous example is the Li2S–P2S5 binary system, which contains several crystalline phases, such as Li3(PS4) and Li2(P2S6) as well as glass ceramics.5 These compounds are essentially pseudo-binaries with the general formula LixA (A = PyS2y+2). In contrast to normal binaries, the molecular (complex) anion has an internal structure and can coordinate to Li+ in different ways. The coordination becomes most complex when the cation can interact with different elements of the anion ligand, e.g. in (CN)−, (OCN)−, (SCN)−, (N(CN)2)− or (C(CN)3)−, often with different strengths of interaction. This molecular coordination chemistry is well established in liquid systems, but poorly studied for solids. Therefore, the investigation of Li(SCN) was motivated by its unique cation – to – anion coordination chemistry, which results in peculiar ion transport characteristics. In this sense, Li(SCN) serves as a model material which provides new insight into the parameters which affect ionic conductivity.In terms of defect chemistry, some of the better understood binary lithium systems include LiH,7 Li3N,8,9 lithium chalcogenides,10,11 and lithium halides.12–14 LiI has become an established additive for performance enhancement in various battery systems,15–19 and a number of fundamental studies helped to understand its role as an additive.20–25 Lithium thiocyanate (often referred to as a pseudo-halide) is chemically and structurally similar to lithium iodide, since they both have a large polarizable anion,26,27 are hygroscopic and form hydrates.28–31 However, in contrast to LiI and other halides, little is known about the defect chemistry of Li(SCN). Previous ion transport studies predominantly focused on composites as potential battery electrolytes including liquid electrolytes,32,33 polymer blends,34–37 or inorganic salt eutectics.38,39 Transport properties of pure Li(SCN) were (so far) investigated only by Poulsen.30 The fact that Li(SCN) does not follow the trend in conductivities of lithium halides with anion size (suggesting that it would have the highest value in the row LiF–LiCl–LiBr–LiI–Li(SCN)) indicates the significance of its singular coordination chemistry, and motivates us to elucidate the origins.
In the present publication, we focus on ion transport and defect chemistry. Electrochemical measurements and doping experiments show Li(SCN) to be Schottky defective and lithium vacancies  to be the majority charge carriers. We will first discuss the doping experiments to identify the mobile carrier, then identify the defect-chemical regimes (Brouwer diagrams) describing the defect chemistry semi-quantitatively, and finally extract quantitative data with respect to formation and migration energies and even mobilities and concentrations. These findings contribute to a better understanding of the transport behavior in electrolytes with complex anions (bidentate ligands). All experimental and computational details are given in the ESI.† In Part II of this series of publications we discuss the frequency dependence of the ion conductivity in Li(SCN),40 and Part III reports on the defect chemistry in the premelting regime.41
2. Results and discussion
2.1. Doping experiments
Anhydrous Li(SCN) is stable beyond its melting point at 274 °C and does not decompose up to at least 550 °C.42 Compacted pellets of nominally pure (undoped) Li(SCN) were measured both by electrochemical impedance spectroscopy (EIS) and by direct current (DC) experiments. The first task was to identify the ionic or electronic nature of the conductivity. From an electromotive force (EMF) measurement with Li and LiAl electrodes at 110 °C, a Li+ transference number of tLi+ ≥ 0.99 (ESI† Fig. S8b) was estimated. In this configuration, most probably a solid electrolyte interface (SEI) layer of thermodynamically stable compounds formed, which kinetically stabilizes the Li(SCN) – Li metal interface (thermodynamically, taking the values of the analogous sodium compounds as a reference,43 one expects an exothermic reaction with the conversion of Li(SCN) and Li metal into Li2S and Li(CN)). This measurement shows that Li(SCN) is a Li+ cation conducting material with negligible electronic contributions. Correspondingly, impedance spectra with Li+ blocking ruthenium electrodes show a Warburg-type low frequency feature at elevated temperatures at which the respective frequencies fall into the measurement range (ESI† Fig. S9). Note that the measured conductivities of a previous study (ESI† Fig. S13a) are higher than the present values due to incomplete drying.42Aliovalent bulk doping is a well-established method to identify the nature of mobile defects (vacancies or interstitials). However, one has to stay within the solubility limit of the dopant, as otherwise formed secondary phases might also affect the conductivity. Mg2+, Zn2+, and Co2+ are suitable cations to investigate the solid solution behavior of Li+ conductors, given their chemical and size similarity (cf. ESI† Fig. S6). ICP-OES analysis confirmed the overall dopant concentration to be close to the nominal values (ESI† Fig. S7). Owing to the low dopant concentrations and the size similarity, it is not surprising that there is no clear trend in the comparison of the unit cell volumes (ESI† Fig. S6b). Fig. 1 and Fig. S6a (ESI†) show that Mg2+, Zn2+, and most likely also Co2+ are soluble in Li(SCN) up to about 3–5 mol%. The changes in conductivity – discussed in more detail in section 2.2 – indicate that Mg2+, Zn2+, and Co2+ are indeed incorporated and active as dopants.
 | ||
| Fig. 1 Doping of Li(SCN) with Mg(SCN)2: nominally undoped Li(SCN) (black), Mg2+-doped Li(SCN) (blue) and two-phase samples of Li(SCN) and Mg1.02Li3.96(SCN)6 (dark red). (a) Conductivities as a function of inverse temperature, and (b) XRPD patterns. Reflections marked with an asterisk belong to an unknown side phase (most likely a decomposition product of Mg(SCN)2·4 H2O), and the blue bars at the bottom represent anhydrous Li(SCN) as a reference.31 | ||
For Mg2+ concentrations ≥ 10 mol%, reflections of a new phase appear in the diffractograms (cf.Fig. 1b and ESI† Fig. S1). EIS and temperature dependent in situ XRPD42 showed that this new phase has a structural transition between 47 and 62 °C into a high temperature modification with higher symmetry. The phase transition can also be recognized from the shape of the impedance spectra as well as the dielectric constant εr (cf. ESI† Fig. S10). Due to synthetic difficulties and limitations of powder diffraction, an ab initio crystal structure solution was only possible of the high temperature modification, which was performed at 55 °C (longer synthesis times at high temperatures even lead to a highly disordered, different material; cf.Fig. 1b, grey pattern). The structure of lithium–magnesium thiocyanate indicates a variable lithium-to-magnesium ratio, and the final Rietveld44 refinement yielded the following composition (cf. ESI† Fig. S1):
| (4 − 2x)Li(SCN) + (1 + x)Mg(SCN)2 → Mg1+xLi4−2x(SCN)6 (x = 0.02) | (1) |
Apart from recently prepared tri-cationic cyanamides with the composition Li2MSn2(NCN)6 (M = Mg45 und Mn46), anhydrous thiocyanates, nitrides or cyanides of lithium and any divalent transition metal are unknown so far, which makes the structure of Mg1.02Li3.96(SCN)6 a hitherto unknown structure type (details in the ESI†). Mixed alkali and alkaline earth metal pseudo-halides are rare,47–49 and even though Na4Mg(SCN)6 has a very similar composition, its crystal structure is very different. The observation that the new phase Mg1.02Li3.96(SCN)6 has a much higher conductivity than even highly doped Li(SCN) is related to the coordination polyhedra of Mg2+ and Li+ in this structure (ESI† Fig. S3 and S4), and will be discussed later.
The impedance spectra and temperature dependence of εr for both undoped and doped Li(SCN) (Fig. 2 and ESI† Fig. S12) are obviously more complex compared to other Li+ ion conductors.10,11,23 This complexity is rooted in the frequency dependent conductivity of Li(SCN) and will be discussed in detail in Part II.40 In the present work, only the DC resistance (low frequency intersection with the real axis) is of importance, thus only the low frequency part of the spectra was fitted with the circuit shown in Fig. 2.
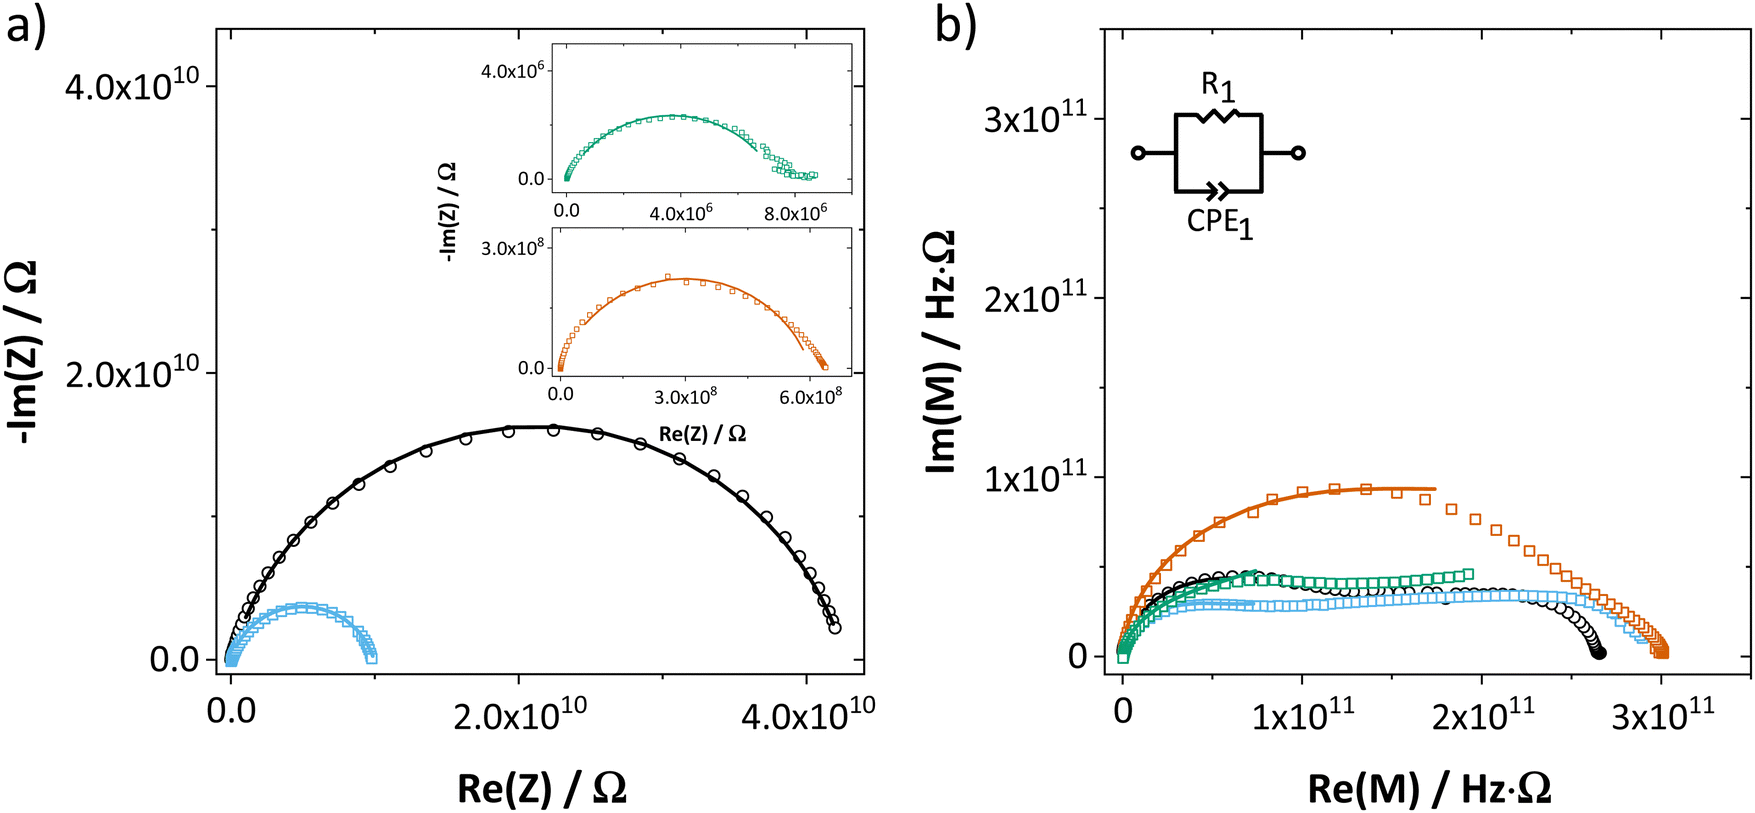 | ||
| Fig. 2 (a) Impedance and (b) complex modulus of undoped Li(SCN) (black circles), as well as 1.5 mol% doped Li(SCN) (squares) using Mg2+ (blue), Zn2+ (red) and Co2+ (green) as dopant (T = 68–69 °C). The impedance spectra were fitted with the shown equivalent circuit. | ||
2.2. Defect chemical model
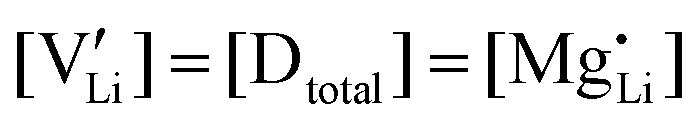
In order to investigate the defect chemistry of single-phase Li(SCN), dopant concentrations of 5 mol% were not exceeded. The ionic conductivity of undoped Li(SCN) shows two slope changes as indicated in Fig. 3a. Such behavior is common for many ion conductors (e.g. LiH and Li2S),7,10 and is typically used as a basis for assigning three regimes: I intrinsic, II extrinsic, and III association. In the intrinsic regime the conductivity is dominated by the material's native defects. Since Li(SCN) is considered a pseudo-halide with a densely packed structure, one can expect the material to be Schottky defective:13,14 | (2) |
 . The transition to the extrinsic regime is marked by a more shallow slope in Fig. 3a. In the extrinsic regime the mobile carrier concentration is fixed by a dopant
  (or possible donor-type impurity). The concentration of
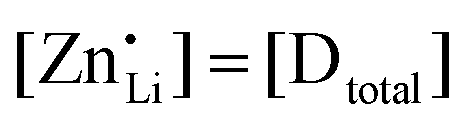
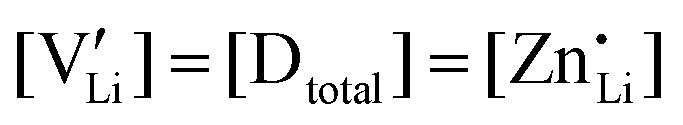
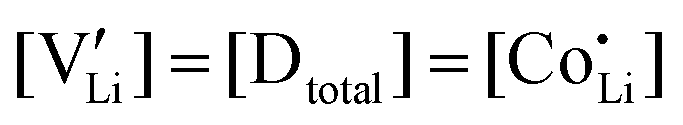
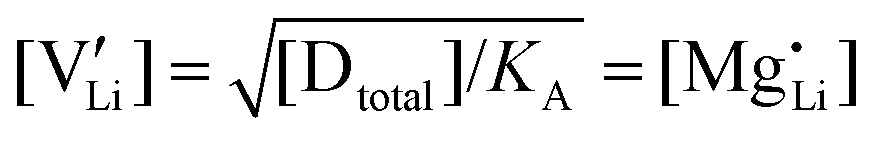
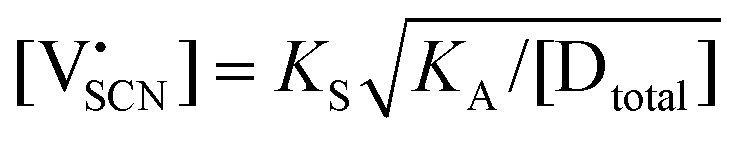
  can be increased by donor doping, e.g. with a bivalent cation of suitable ionic radius such as Mg2+, Zn2+ or Co2+ (Fig. 3b):
 | (3) |
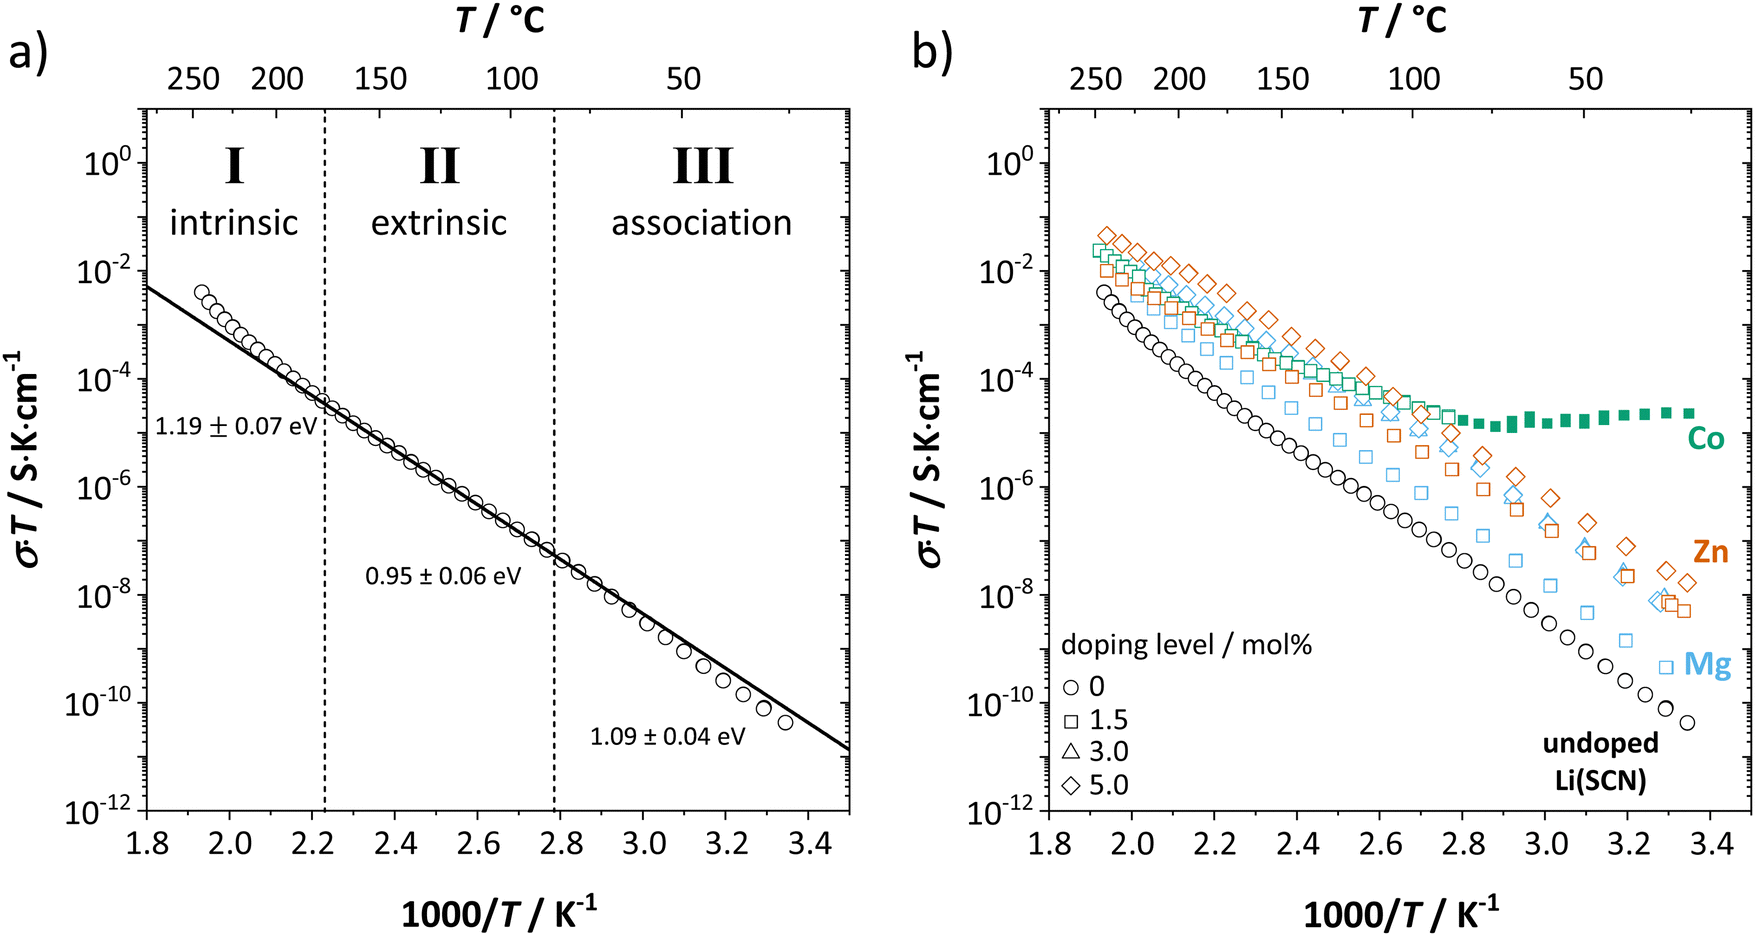 | ||
| Fig. 3 (a) Assignment of defect chemical regimes in undoped Li(SCN). (b) Comparison of conductivities from undoped Li(SCN) (black), Mg2+-doped (blue), Zn2+-doped (red) and Co2+-doped Li(SCN) (green). The green full symbols correspond to the temperature range where for Co2+-doped Li(SCN) electronic conductivity prevails (−0.11 eV apparent activation energy). | ||
The conductivity increases with the concentration of all D2+ dopants (Fig. 3b and Fig. S14, ESI†), which shows that indeed  are the dominant mobile defects. Acceptor doping of the (SCN)− anion with Li2S and Li2(SO4) was attempted, yet despite employing different preparation methods was unsuccessful, as indicated by the unchanged conductivities (ESI† Fig. S13b).
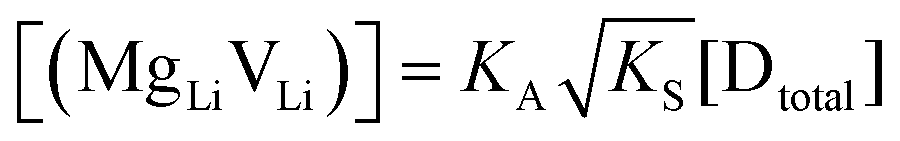
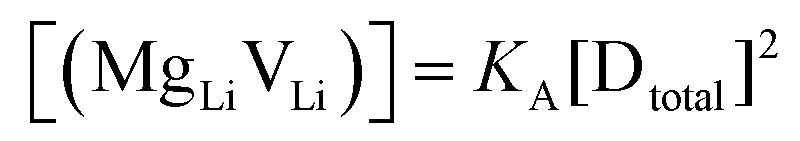
At lower temperatures defects tend to form associated species (DLiVLi) according to:
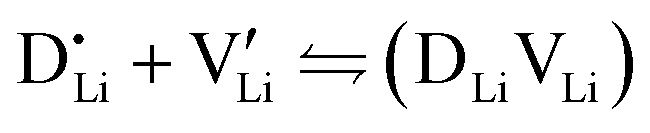 | (4) |
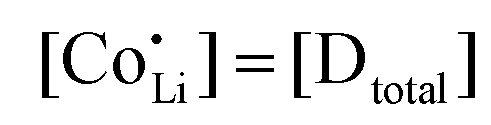
Since mobile lithium vacancies are formed only by dissociation of these associates, the activation energy increases in regime III of Fig. 3a. While all donor dopants increased the conductivity, the ion transport behavior depends on the dopant element. The formation of associates was observed for both undoped and Mg2+-doped Li(SCN) (Fig. 3b), while Zn2+- and Co2+-doping showed a distinctively different behavior (intrinsic to extrinsic transition at 180 °C, extrinsic to association transition at 88 °C). In the case of Zn2+, the measured conductivities do not show any significant changes in slope, which suggests that no associated species form and merely the extrinsic regime is observed. In contrast, the incorporation of Co2+ in Li(SCN) does not only increase the concentration of  , but surprisingly also leads to electronic conductivity. Galvanostatic DC measurements (ESI† Fig. S11a) revealed a dominant electronic conduction below 84 °C. Except for 1.5 mol% Mg2+-doped Li(SCN), the intrinsic regime was not observed for any other doped sample, as the transition to intrinsic is too close to the melting point (a small intrinsic regime would be expected for a Schottky defective material, since both the cation and anion lattice become increasingly disordered before finally the material melts).
The observed differences in transport behavior with specific dopants can be understood from the crystal structures and coordination chemistry of the respective thiocyanates (Fig. 4). Li+ in Li(SCN) is coordinated to six (SCN)− anions, forming octahedra with three Li–S and three Li–N bonds.31 The Li–S bonds are rather weak, given the strong mismatch in polarizability according to the Pearson HSAB concept.50 This results in a high tendency of Li(SCN) to form coordination compounds with oxygen-containing ligands, e.g. H2O or THF,51,52 to replace Li–S with Li–O bonds. An even more extreme situation is observed for Mg2+, for which thiocyanate hydrates rather decompose upon drying than form Mg–S bonds.53 The strong tendency of Mg2+ in magnesium thiocyanates to coordinate with oxygen containing molecules (compared to e.g. Zn2+ and Co2+)54 suggests that this cation has a strong preference for electrostatic interactions with negatively charged species. This suggests that  defects can act as effective trapping sites for
  forming associates.
 | ||
| Fig. 4 Comparison of the metal cation coordination polyhedra in Li(SCN),31 Co(SCN)2,55 and Zn(SCN)2.56 The shown structure of Zn(SCN)2 is the β-modification (for more details, cf. ESI†). | ||
This concept also explains the higher conductivity of the new Mg1.02Li3.96(SCN)6 phase (Fig. 1a). Since Mg2+ has a greater disfavor for Mg–S bonds than Li+, the (SCN)− anions largely coordinate via their nitrogen atom to magnesium, meaning that Li+ has to bind to sulfur (ESI† Fig. S3 and S4). This results in a more facile formation of  , increasing the concentration of mobile defects and lifting the ionic conductivity by more than four orders of magnitude. In contrast, both Zn(SCN)2 and Co(SCN)2 form stable M–S bonds in their anhydrous form and are not hygroscopic or prone to form coordination compounds with oxygen containing ligands.55–57 Thus it is expected that both
  and
and  have a far lower tendency to form associates with
  than
than  . In Zn2+-doped Li(SCN) this negligible association is clearly reflected in the conductivity data (Fig. 3), while in Co2+-doped Li(SCN) it is overshadowed by an electronic contribution.
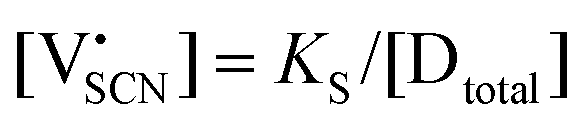
Assuming ideally dilute behavior, the mass action law for reaction (2) can be written as:
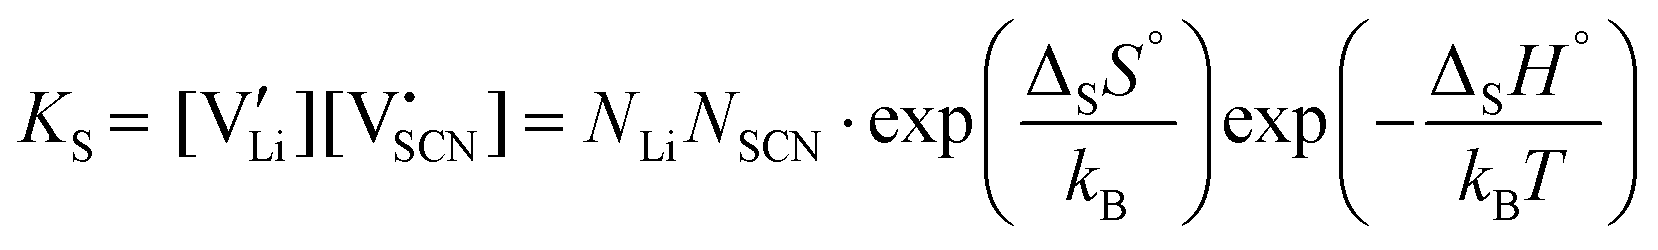 | (5) |
 and
and  are the respective defect concentrations, NLi and NSCN (both equal to 4/VUC) are the number of available defect sites (VUC = 240.56 Å3 unit cell volume),31 ΔSS° and ΔSH° are the standard entropy and enthalpy of defect formation, and kB and T are Boltzmann's constant and temperature. Defect association can be accounted for by reaction (4), and the mass action law reads:
 | (6) |
 and
and  are associate, dopant and vacancy concentration, and ΔAS° and ΔAH° are the standard entropy and enthalpy of association. Since the doping occurs on the Li+ sites, ND is equivalent to NLi, and NA equals 2NLi. The total dopant concentration is
  , and the Brouwer approximations in Table 1 can be derived.10,58
| Mg | Zn | Co | |
|---|---|---|---|
| Regime I intrinsic |

|
|

|
|
|
|
|
|
|||
| Regime II extrinsic |
|
|
|

|
|

|
|
|
|||
| Regime III association |
|
||
|
|||

|
It can be reasonably assumed that the concentrations of electronic carriers are negligible compared to ionic defects (for Co2+-doping some additional considerations are discussed below). If the enthalpies and entropies are known, the changes in defect concentration with temperature can be semi-quantitatively drawn as done in Fig. 5a.
 | ||
Fig. 5 Defect concentrations of ionic defects in Li(SCN)-doped systems; (a) as a function of temperature, and (b) as a function of dopant concentration (Brouwer diagrams). The dotted line denotes the transition, where for Co2+-doping the  ionic conductivity surpasses the one of electronic charge carriers. ionic conductivity surpasses the one of electronic charge carriers. | ||
The results of the doping experiments were used to construct the Brouwer diagrams displayed in Fig. 5b. The defect chemical analysis of Li(SCN) shows that changes in ion transport induced by doping are specific to the coordination chemistry of the dopant;  forms associates,
  does not and
  can even induce predominant electronic conduction. This phenomenon of dopant specific transport behavior is most likely connected with the specific coordination chemistry of hard-cation – soft-anion ion conductors.
The electronic conductivity for Co2+-doped Li(SCN) cannot unambiguously be interpreted. As long as  is fixed via the electroneutrality condition by the donor dopant concentration, and also the elemental lithium activity remains constant, the reaction:
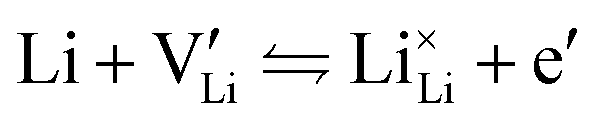 | (7) |
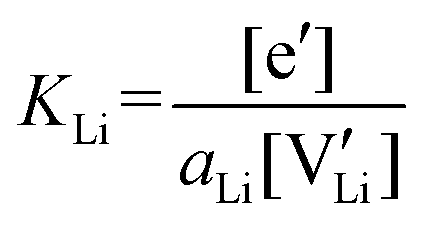 | (8) |
2.3. Determination of defect mobility and defect concentrations
The mobility of
of  can be calculated from
  and
and  in the extrinsic regime:
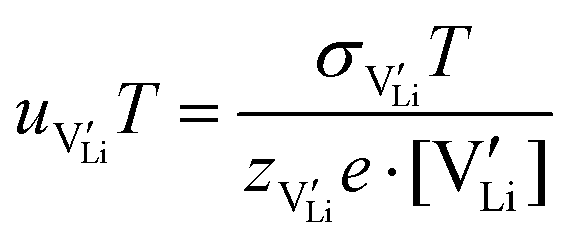 | (9) |
 and e are the charge of
  (equal to 1) and of an electron.
According to:
 | (10) |
 | (11) |
 | ||
| Fig. 6 (a) Calculated mobilities of lithium vacancies for all dopants. Solid lines correspond to linear fits. In case of Co2+-doping, only data above 153 °C were used for the fitting. (b) Calculated defect concentrations in 1.5 mol% Mg2+-doped Li(SCN). | ||
r
Li is the distance to a neighboring available site of  (3.16 Å), N is the number of neighboring sites (equal to 2), and ν0 is the jump attempt frequency (∼1013 Hz).10,58 Knowing the mobility, the Schottky mass action constant KS is calculated from the linear fit of regime I in undoped Li(SCN) (Fig. 3a) by inserting
  and eqn (11) into eqn (9) with the result:
 | (12) |
The association equilibrium constant KA is calculated by linearly fitting the conductivity data in regime III of Mg2+-doped Li(SCN) (Fig. 3b) and inserting that expression together with  into eqn (9), which yields:
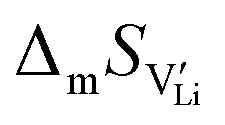
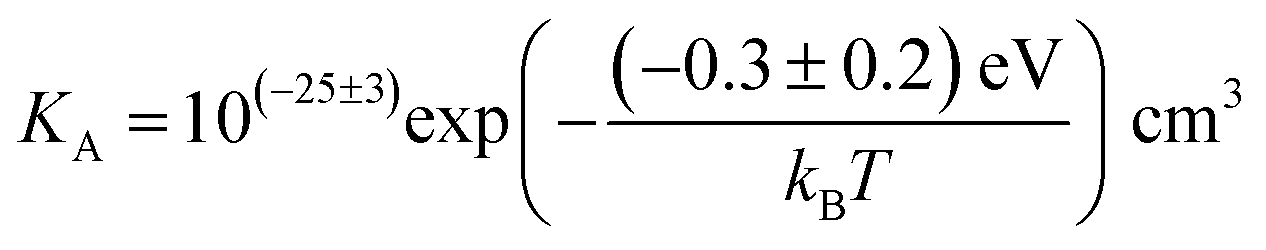 | (13) |
The corresponding entropies are obtained from eqn (5), (6), (10) and the enthalpies in eqn (11)–(13). The results are summarized in Table 2.


2.4. DFT calculations
To complement the experimental results, DFT calculations were performed for the possible defect formation enthalpies in Li(SCN) using the PBE exchange–correlation functional59 which is broadly applied for calculations of ionic solids. For a fully relaxed cell, lattice parameters of 12.988 Å, 3.682 Å, and 5.311 Å were obtained. The cell volume is noticeably larger compared to the experimental value (+5.5%). In particular the lattice parameter in a direction (between the “layers” of Li(SCN) double chains, cf. Fig. S2, ESI†) is overestimated by 6.9%. This suggests that in this direction van der Waals forces make an important contribution, which tend to be underestimated in standard functionals.The formation energies of defect pairs in undoped Li(SCN) were calculated, and found to be lower for Schottky pairs (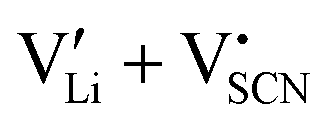 , 0.34 eV) than Frenkel pairs (
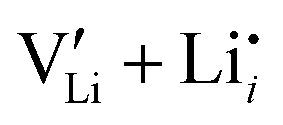 , 1.1 eV). This sequence matches with the results from doping experiments in section 2.3. The numerical value is rather low compared to the experimental result in Table 2 (0.6 ± 0.3 eV), although within the estimated experimental error. Migration barriers were calculated for
  and
and  (technical details are specified in the ESI†). For
  two possibilities were considered (Fig. S2c and d, ESI†): (i) straight along b direction, (ii) “zigzag” path via the shortest distances between regular Li sites. The “zigzag” path yields the lower barrier of 0.08 eV compared to the direct path (0.26 eV). This relative magnitude appears reasonable, as the “zigzag” path has the shorter individual jump distance. However, the absolute values are significantly lower than the experimental values (Table 2). This is most probably related to the overestimation of the cell volume in the present calculations. The barrier for the Li interstitial in b direction amounts to 0.88 eV. Thus, Li interstitials are not only less favorable with respect to defect formation, but also regarding defect migration.
2.5. Comparison to other lithium ion conductors
It is interesting to compare Li(SCN) with other, chemically similar Li+ cation conductors (Fig. 7). Naively, one might expect the conductivity of Li(SCN) between Li3N and Li2S, which is evidently not the case. In addition, while the chemical properties and behavior (including structure and reactivity) of Li(SCN) are similar to those of the lithium halides, the situation is more complex concerning ion transport.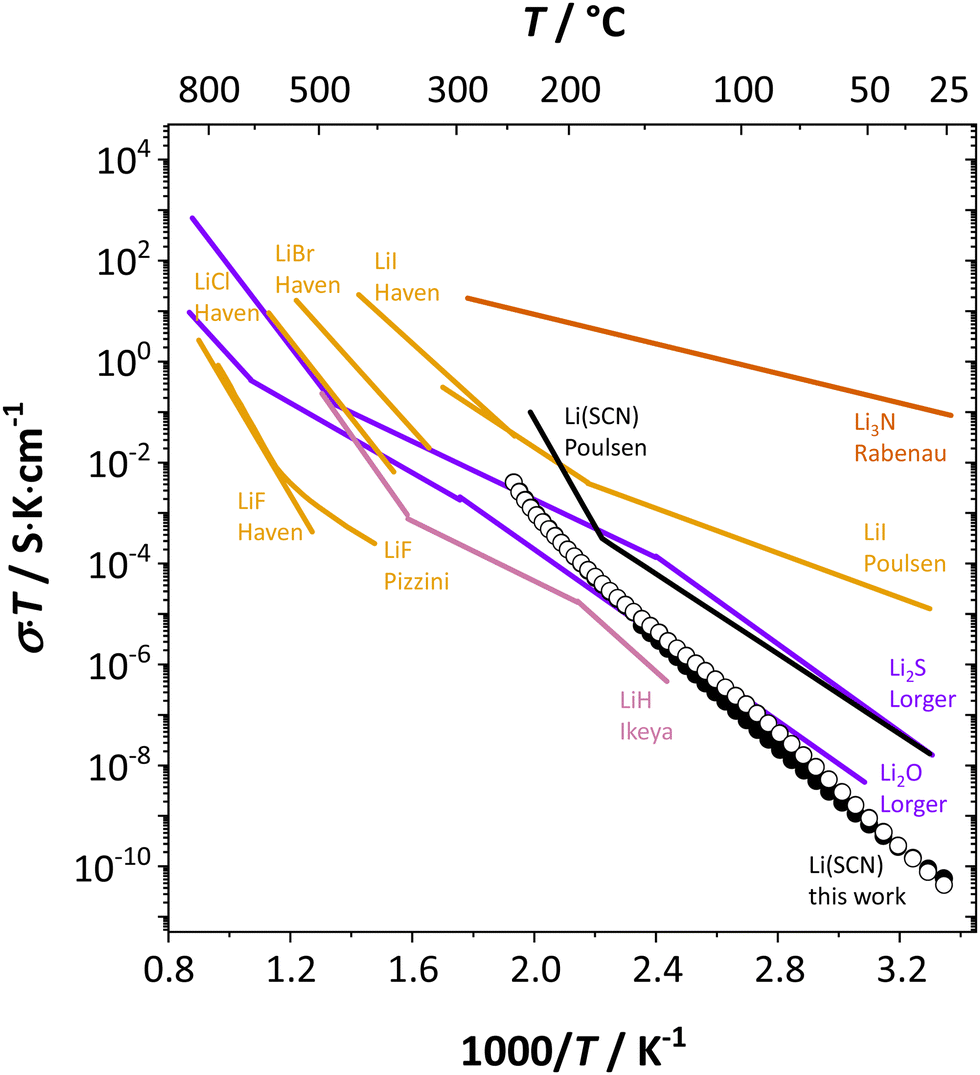 | ||
| Fig. 7 Comparison of Li(SCN) conductivity (black circles) with literature data (black line)30 and different Li+ cation conducting materials; LiH (magenta),7 Li3N (red),60 chalcogenides (purple),10,11 and halides (orange).13,14,23 | ||
Table 3 compares data of relevant Li+ systems to Li(SCN) data of the present work. The literature entropy values or association energy data (as far as available) are very similar to the present Li(SCN) data, giving confidence in their magnitudes. Despite Li(SCN) and all LiX compounds being Schottky defective, Li(SCN) deviates from some trends seen for LiX. In the series H−/F−, Cl−, Br− and I−, defect formation and migration enthalpies decrease, but defect formation is always energetically more costly than migration. Li(SCN) breaks this relation, with a relatively low formation enthalpy and a high migration enthalpy. As will be shown in more detail in Part II,40 this deviation is closely related to the specific ion transport mechanism in Li(SCN). The important difference between Li(SCN) and the lithium halides is the bidentate, anisotropic (SCN)− anion, since Li+ can coordinate both to 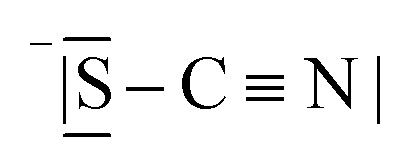 and −〈N
![[double bond, length as m-dash]](https://www.rsc.org/images/entities/char_e001.gif) CS〉, with Li–N bonds being more favorable than Li–S bonds. While defect formation is comparatively facile (weak Li–S bonds), ion migration is inhibited by the rigid anion lattice (strong Li–N bonds) and a slow relaxation process (anisotropic shape) after an initial ion jump. This emphasizes the importance of specific chemical interactions, which affect ionic mobilities at least as much as (simplistic) geometrical/size and electrostatic arguments.
CS〉, with Li–N bonds being more favorable than Li–S bonds. While defect formation is comparatively facile (weak Li–S bonds), ion migration is inhibited by the rigid anion lattice (strong Li–N bonds) and a slow relaxation process (anisotropic shape) after an initial ion jump. This emphasizes the importance of specific chemical interactions, which affect ionic mobilities at least as much as (simplistic) geometrical/size and electrostatic arguments.
| Compound | ΔSH° (eV) | ΔSS° (kB) |
|
|
ΔAH° (eV) | ΔAS° (kB) | Ref. |
|---|---|---|---|---|---|---|---|
| LiH expt. | 2.3 ± 0.3 | 0.54 ± 0.02 | −0.50 ± 0.05 (MgLiVLi) | 7 | |||
| LiF expt. | 2.6 ± 0.2 | 0.67 ± 0.02 | 12, 14, 61, 62 | ||||
| DFT | 2.2–2.9 | 0.6 | 63 | ||||
| LiCl expt. | 2.12 | 0.41 | 12, 14 | ||||
| LiBr expt. | 1.80 | 0.39 | 12, 14 | ||||
| LiI expt. | 1.2 ± 0.1 | 4.5 | 0.41 ± 0.03 | 4.9 | 12, 14, 20 | ||
| Li(SCN) expt. | 0.6 ± 0.3 | 5 ± 2 | 0.89 ± 0.08 | 7.7 ± 0.9 | −0.3 ± 0.2 (MgLiVLi) | −8 ± 6 (MgLiVLi) | This work |


3. Conclusion
This investigation of anhydrous Li(SCN) shows its specific ion transport properties and defect chemistry. The material forms Schottky pairs, of which lithium vacancies are the mobile defects throughout the investigated temperature range. The solubility limit for Mg2+, Zn2+ and Co2+ donor doping is estimated to be around 3–5 mol%. Higher Mg2+-concentrations led to the formation of a previously unknown phase Mg1.02Li3.96(SCN)6, whose crystal structure was solved from XRPD data. The derived defect model for anhydrous Li(SCN) shows that the formation of defect associates depends on the employed dopant; more specifically on the (dis-)favor to form M–S bonds with the (SCN)− anion. The comparison of the defect formation and migration enthalpy of Li(SCN) with similar materials emphasizes the impact of the (SCN)− anion on ion transport. Although the highly polarizable anion facilitates defect formation, its very asymmetric interaction of sulfur and nitrogen with Li+ cations hinders the migration of mobile defects, which renders the material a poor conductor. More details about this impact as well as the defect chemistry close to the melting point will be given in separate publications (Part II40 and III41).Author contributions
All authors have contributed to the experimental results, calculations and writing of the manuscript, and have given their approval to the final version of the manuscript.Conflicts of interest
There are no conflicts to declare.Acknowledgements
The authors acknowledge the technical assistance provided by members in the MPI FKF. XRPD measurements were mostly performed by Helga Hoier, and XRPD sample preparation was supported by Eva Brücher. Measurement cells and set-up were constructed with the support of Florian Kaiser, Udo Klock and Uwe Traub. We also want to thank Masahiko Isobe for the numerous attempts of crystal growth, Samir Hammoud for ICP-OES measurements, and Maximilian Hödl for proof reading the manuscript. Open Access funding provided by the Max Planck Society.References
- C. Cao, Z. Bin Li, X. L. Wang, X. B. Zhao and W. Q. Han, Front. Energy Res., 2014, 2, 1–10 CrossRef.
- J. Janek and W. G. Zeier, Nat. Energy, 2016, 1, 1–4 CrossRef.
- J. C. Bachman, S. Muy, A. Grimaud, H. H. Chang, N. Pour, S. F. Lux, O. Paschos, F. Maglia, S. Lupart, P. Lamp, L. Giordano and Y. Shao-Horn, Chem. Rev., 2016, 116, 140–162 CrossRef CAS PubMed.
- K. Takada, J. Power Sources, 2018, 394, 74–85 CrossRef CAS.
- Ö. U. Kudu, T. Famprikis, B. Fleutot, M. D. Braida, T. Le Mercier, M. S. Islam and C. Masquelier, J. Power Sources, 2018, 407, 31–43 CrossRef.
- Z. Zhang, Y. Shao, B. Lotsch, Y. S. Hu, H. Li, J. Janek, L. F. Nazar, C. W. Nan, J. Maier, M. Armand and L. Chen, Energy Environ. Sci., 2018, 11, 1945–1976 RSC.
- M. Ikeya, J. Phys. Soc. Japan, 1977, 42, 168–174 CrossRef CAS.
- H. Obayashi, A. Gotoh and R. Nagai, Mater. Res. Bull., 1981, 16, 581–585 CrossRef CAS.
- T. Lapp, S. Skaarup and A. Hooper, Solid State Ionics, 1983, 11, 97–103 CrossRef CAS.
- S. Lorger, R. E. Usiskin and J. Maier, Adv. Funct. Mater., 2019, 29, 1–11 CrossRef.
- S. Lorger, R. Usiskin and J. Maier, J. Electrochem. Soc., 2019, 166, A2215–A2220 CrossRef CAS.
- H. Mehrer, Diffusion in Solids, Springer, 2007 Search PubMed.
- Y. Haven, Recueil, 1950, 69, 1471–1489 CrossRef CAS.
- S. Pizzini, J. Appl. Electrochem., 1971, 1, 153–161 CrossRef CAS.
- C. C. Liang, J. Electrochem. Soc., 1973, 120, 1289 CrossRef CAS.
- A. H. Ahmad and A. K. Arof, Ionics, 2002, 8, 433–438 CrossRef CAS.
- K. H. Park, D. Y. Oh, Y. E. Choi, Y. J. Nam, L. Han, J. Y. Kim, H. Xin, F. Lin, S. M. Oh and Y. S. Jung, Adv. Mater., 2016, 28, 1874–1883 CrossRef CAS PubMed.
- T. Liu, G. Kim, E. Jónsson, E. Castillo-Martinez, I. Temprano, Y. Shao, J. Carretero-González, R. N. Kerber and C. P. Grey, ACS Catal., 2019, 9, 66–77 CrossRef CAS.
- H. Zhang, P. Zuo, J. Hua, Y. Ma, C. Du, X. Cheng, Y. Gao and G. Yin, Electrochim. Acta, 2017, 238, 257–262 CrossRef CAS.
- B. J. H. Jackson and D. A. Young, J. Phys. Chem. Solids, 1969, 30, 1973–1976 CrossRef CAS.
- C. R. Schlaikjer and C. C. Liang, J. Electrochem. Soc., 1971, 118, 1447 CrossRef CAS.
- G. Eichinger, Z. Naturforsch., 1978, 33b, 511–514 CrossRef CAS.
- F. W. Poulsen, Solid State Ionics, 1981, 2, 53–57 CrossRef CAS.
- W. Weppner, W. Welzel, R. Kniep and A. Rabenau, Angew. Chem., Int. Ed. Engl., 1986, 25, 1087–1089 CrossRef.
- A. M. Al-Rikabi, J. Chem. Soc. Pak., 1989, 11, 1–3 CAS.
- L. Di Sipio, L. Oleari and G. De Michelis, Coord. Chem. Rev., 1966, 1, 7–12 CrossRef CAS.
- J. W. Bats, P. Coppens and Å. Kvick, Acta Crystallogr., 1977, B33, 1534–1542 CrossRef CAS.
- V. I. Nikolaev, J. Russ. Phys. -Chem. Soc., 1929, 61, 939 CAS.
- D. A. Lee, Inorg. Chem., 1964, 3, 289–290 CrossRef CAS.
- F. W. Poulsen, Acta Chem. Scand., 1985, A39, 290–292 CrossRef CAS.
- O. Reckeweg, A. Schulz, B. Blaschkowski, Th. Schleid and F. J. DiSalvo, Z. Naturforsch., 2014, 69b, 17–24 CrossRef.
- B. M. L. Rao, D. J. Eustace and J. A. Shropshire, J. Appl. Electrochem., 1980, 10, 757–763 CrossRef CAS.
- B. M. L. Rao and G. E. Milliman, J. Electrochem. Soc., 1980, 127, 2333–2335 CrossRef CAS.
- M. Watanabe, K. Sanui, N. Ogata, F. Inoue, T. Kobayashi and Z. Ohtaki, Polym. J., 1985, 17, 549–555 CrossRef CAS.
- M. Watanabe, M. Rikukawa, K. Sanui and N. Ogata, Macromolecules, 1986, 19, 188–192 CrossRef CAS.
- K. Mitani and K. Adachi, J. Polym. Sci., 1995, B33, 947–954 CrossRef.
- P. V. Wright, J. Mater. Chem., 1995, 5, 1275–1283 RSC.
- C. Liu and C. A. Angell, Solid State Ionics, 1996, 86–88, 467–473 CrossRef CAS.
- K. Hasegawa, M. Tatsumisago and T. Minami, J. Electrochem. Soc., 1999, 146, 3539–3542 CrossRef CAS.
- M. Joos, M. Conrad, I. Moudrakovski, M. W. Terban, A. Rad, P. Kaghazchi, R. Merkle, R. E. Dinnebier, Th. Schleid and J. Maier, Phys. Chem. Chem. Phys., 2022 10.1039/d2cp01837c.
- M. Joos, M. Conrad, S. Bette, R. Merkle, R. E. Dinnebier, Th. Schleid and J. Maier, Phys. Chem. Chem. Phys., 2022 10.1039/d2cp01841a.
- M. Joos, PhD thesis, University of Stuttgart, 2021.
- D. D. Wagman, W. H. Evans, V. B. Parker, R. H. Schumm and R. L. Nuttall, Selected Values of Chemical Thermodynamic Properties Compounds of Uranium, Protactinium, Thorium, Actinium, and the Alkali Metals, Natl. Bur. Stand., 1981, 156 Search PubMed.
- H. M. Rietveld, J. Appl. Crystallogr., 1969, 2, 65–71 CrossRef CAS.
- X. Qiao, A. J. Corkett, R. P. Stoffel and R. Dronskowski, Z. Anorg. Allg. Chem., 2021, 647, 2162–2166 CrossRef CAS.
- A. J. Corkett and R. Dronskowski, Dalton Trans., 2019, 48, 15029–15035 RSC.
- C. Wickleder and P. Larsen, Z. Anorg. Allg. Chem., 2001, 627, 1279–1282 CrossRef CAS.
- C. Wickleder and P. Larsen, Chem. Mater., 2004, 16, 4016–4021 CrossRef CAS.
- O. Reckeweg and F. J. Disalvo, Z. Naturforsch., 2016, 71b, 161–164 CrossRef.
- R. G. Pearson, J. Am. Chem. Soc., 1963, 85, 3533–3539 CrossRef CAS.
- M. Conrad, M. Joos, S. Bette, R. E. Dinnebier, J. Maier and Th. Schleid, Dalton Trans., 2021, 50, 12292–12300 RSC.
- M. Joos, M. Conrad, S. Bette, R. Merkle, R. E. Dinnebier, Th. Schleid and J. Maier, J. Phys. Chem. Solids, 2022, 160, 110299 CrossRef CAS.
- M. Joos, M. Conrad, R. Merkle, Th. Schleid, J. Maier, R. E. Dinnebier and S. Bette, Dalton Trans., 2021, 50, 6949–6991 RSC.
- C. W. Bock, A. K. Katz and J. P. Glusker, J. Am. Chem. Soc., 1995, 117, 3754–3765 CrossRef CAS.
- E. Shurdha, S. H. Lapidus, P. W. Stephens, C. E. Moore, A. L. Rheingold and J. S. Miller, Inorg. Chem., 2012, 51, 9655–9665 CrossRef CAS PubMed.
- L. A. Aslanov, V. M. Ionov and K. Kynev, Kristallografiya, 1976, 21, 1198–1199 CAS.
- K. Kynev and R. Dafinowa, C. R. Acad. Bulg. Sci., 1967, 20, 939–942 Search PubMed.
- J. Maier, Physical Chemistry of Ionic Materials, John Wiley & Sons, Ltd, 2004 Search PubMed.
- J. P. Perdew, K. Burke and M. Ernzerhof, Phys. Rev. Lett., 1996, 77, 3865–3868 CrossRef CAS PubMed.
- A. Rabenau, Lithiumnitrid und verwandte Stoffe, Westdeutscher Verlag; Stuttgart, 1981, vol. 53 Search PubMed.
- T. G. Stoebe and R. A. Huggins, J. Mater. Sci., 1966, 1, 117–126 CrossRef.
- O. S. Spencer and C. A. Plint, J. Appl. Phys., 1969, 40, 168–172 CrossRef CAS.
- J. Pan, PhD thesis, University of Kentucky, 2016.
Footnote |
| † Electronic supplementary information (ESI) available. See DOI: https://doi.org/10.1039/d2cp01836e |
| This journal is © the Owner Societies 2022 |