
 Open Access Article
 This Open Access Article is licensed under a
 Creative Commons Attribution 3.0 Unported Licence
A Cr2O3-doped graphene sensor for early diagnosis of liver cirrhosis: a first-principles study
Yuvam
Bhateja
 a,
Ritam
Ghosh
b,
Jiri
Sponer
c,
Sanhita
Majumdar
d and
Giuseppe
Cassone
*e
a,
Ritam
Ghosh
b,
Jiri
Sponer
c,
Sanhita
Majumdar
d and
Giuseppe
Cassone
*e
aDept. of Physics, Politecnico Di Milano, Piazza Leonardo da Vinci, 32, 20133 Milano, Italy. E-mail: yuvam.bhateja@mail.polimi.it
bNil Ratan Sircar Medical College and Hospital, Raja Bazar 138, 700014 Kolkata, India
cInstitute of Biophysics of the Czech Academy of Sciences, Královopolská 135, 61265 Brno, Czechia
dCenter of Excellence for Green Energy and Sensor Systems, Indian Institute of Engineering Science and Technology, Shibpur, Botanical Garden Road, 711103 Howrah, India. E-mail: email2sm@gmail.com
eInstitute for Chemical-Physical Processes, National Research Council of Italy, Viale F. Stagno d'Alcontres 37, 98158 Messina, Italy. E-mail: cassone@ipcf.cnr.it
First published on 16th August 2022
Abstract
Liver cirrhosis is among the leading causes of death worldwide. Because of its asymptomatic evolution, timely diagnosis of liver cirrhosis via non-invasive techniques is currently under investigation. Among the diagnostic methods employing volatile organic compounds directly detectable from breath, sensing of limonene (C10H16) represents one of the most promising strategies for diagnosing alcohol liver diseases, including cirrhosis. In the present work, by means of state-of-the-art Density Functional Theory calculations including the U correction, we present an investigation on the sensing capabilities of a chromium-oxide-doped graphene (i.e., Cr2O3–graphene) structure toward limonene detection. In contrast with other structures such as g-triazobenzol (g-C6N6) monolayers and germanane, which revealed their usefulness in detecting limonene via physisorption, the proposed Cr2O3–graphene heterostructure is capable of undergoing chemisorption upon molecular approaching of limonene over its surface. In fact, a high adsorption energy is recorded (∼−1.6 eV). Besides, a positive Moss–Burstein effect is observed upon adsorption of limomene on the Cr2O3–graphene heterostructure, resulting in a net increase of the bandgap (∼50%), along with a sizeable shift of the Fermi level toward the conduction band. These findings pave the way toward the experimental validation of such predictions and the employment of Cr2O3–graphene heterostructures as sensors of key liver cirrhosis biomarkers.
1 Introduction
Liver cirrhosis and chronic liver disease (CLD) are among the leading causes of death worldwide.1 As an example, according to ref. 2, cirrhosis was revealed to be the 11th leading cause of death and the 15th major cause of morbidity in 2016, causing 2.2% of deaths and 1.5% of total lifelong disabilities worldwide. CLD was the cause of about 1.32 million deaths in 2017, with a men-to-women ratio of 2![[thin space (1/6-em)]](https://www.rsc.org/images/entities/char_2009.gif) :1. Another report in ref. 3 estimates that age-standardized demises due to cirrhosis in some of the most densely populated nations like India reach a death rate equal to 23.6 per 100000 inhabitants, corresponding to 2% of the total deaths. Moreover, CLD mortality rates in India have increased progressively since 1980.4
:1. Another report in ref. 3 estimates that age-standardized demises due to cirrhosis in some of the most densely populated nations like India reach a death rate equal to 23.6 per 100000 inhabitants, corresponding to 2% of the total deaths. Moreover, CLD mortality rates in India have increased progressively since 1980.4
Liver cirrhosis is the final common pathway of most kinds of liver damage, where scar tissue replaces healthy tissue blocking the flow of blood through the liver and, hence, preventing it from adequately functioning. The main causes of cirrhosis are chronic diseases like alcoholic liver disease, chronic hepatitis (including B, C, and D types), non-alcoholic steatohepatitis (NASH), autoimmune hepatitis, and several genetic disorders.5 Cirrhosis can be diversified into two stages, namely compensated and decompensated cirrhosis. The former shows no symptoms as remaining healthy hepatocytes can still compensate for the loss caused by fibrosis. By contrast, the development of signs and symptoms starts in decompensated cirrhosis. The current standard for liver diagnosis is biopsy.4 Since most of the CLD patients present fairly late clear symptoms – well after the onset of the decompensation stage – the development of detection techniques capable of unambiguously identifying and tracking the progression of cirrhosis as early as possible is urgent.4 Although blood samples can be used to detect liver disorders, the most reliable non-invasive diagnostic methods exploiting volatile metabolite compounds useful for the detection of CLD from breath include dimethyl sulfide,6–8 ethanol,9,10 acetaldehyde,7,9 acetone,11 and pentane.7,11
In 2015, the results of a longitudinal study reported a significant reduction in the breath of the levels of 5 volatile organic compounds in patients' liver following successful liver transplants: limonene, methanol, 2-pentanone, 2-butanone, and carbon disulfide.12 Among these species, limonene has shown the best diagnostic capabilities.12 Moreover, an elevated level of limonene in patients with hepatic encephalopathy has also independently been reported in a parallel study.13 Limonene (C10H16) is an aliphatic hydrocarbon classified as a cyclic monoterpene, naturally occurring in the liquid phase at room temperature. It is a major compound present in several common dietary foods, including citric fruits and coffee.14 Among other things, D-limonene is a commonly used food additive known for its orange flavor.15 As an extensive part of the human diet, enzymes like CYP2C9 and CYP2C19 – belonging to the CYP450 class which, in turn, represents the dominant group of enzymes in the liver – are responsible for its metabolization.16,17 Thus, by detecting the limonene levels in human breath, it is possible to measure the activity of hepatocytes. Of course some other factors like, e.g., racial ethnicity, certainly affect the synthesis of CYP450 enzymes. For instance, 3–5% of Caucasians are poor metabolizers of CYP2C19 compared with larger fractions recorded in the Asian population (i.e., 12–23%).18 Similarly, whereas several drugs – such as Deleverdine – inhibit, some others like Phenytoin enhance the activity of the enzymes.18 Thus, an extensive study can help establish a reference line for limonene concentration in a patient's breath. Many studies have reported on the strong antioxidant nature of monoterpenes, including limonene, via the 2,2-diphenyl-1-picrylhydrazyl (DPPH) free radical method.19–21 As a consequence, limonene holds the peculiar property of strongly reducing the sp2 hybridized planar carbon of graphene into the sp3 tetrahedral orbital structure.
Graphene is a highly two-dimensional (2D) material, which offers a very broad application range in gas sensors. Single-layer graphene has an absolute maximum surface-area-to-volume ratio equal to 2630 m2 g−1 (see, e.g., ref. 22) in a layered material exhibiting, at the same time, a very large room-temperature mobility.23 This way, graphene-based sensors are very sensitive toward the adsorption of gases and are highly scalable for wearable sensors.24,25 In addition to the fact that graphene shows a great long-term atmospheric stability,26 it emerges a negligible dependency on the electrode electrical contacts in the graphene sensing mechanism, the latter being mainly attributed to charge transfer phenomena at the graphene surface.27 All these factors make graphene prone to be employed for the development of gas sensing devices. Nonetheless, graphene-based gas sensors present some drawbacks such as the absence of an intrinsic electronic bandgap, a quite low selectivity, and a poor response time.
Metal oxide semiconductor (MOS)-based gas sensors have recently attracted some attention due to their controllable size and morphology, low cost, selectivity, excellent response time, and good recoverability.28–33 However, in contrast to graphene-based sensors, they offer smaller surface areas and require higher operating temperatures. It has been observed that the employment of reducing gases causes an increase in the electronic bandgap in p-type MOS sensors.34,35 As a consequence, the coupling of graphene and MOSs may in principle contribute toward the possibility of overcoming some of the respective shortcomings. By means of appropriate doping with MOS, defects can be introduced in pristine graphene, which enhance its semiconducting nature resulting in better sensing properties of the gas sensor such as selectivity, response time, etc. Moreover, the doped MOS typically acts as a positive catalyst for the kinetics of chemical reactions. The analyte is first adsorbed on the surface of the metal additive, followed by migration (spillover effect) to the graphene surface. The activated species thus undergoes oxidation, increasing the surface conductivity.36–38
Chromium oxide (Cr2O3), being a p-type MOS, exhibiting a high work function in its parent (∼5 eV) and oxidized state (∼6.7 eV),39 is a good candidate for acting as a sensor for the diagnosis of CLDs. Moreover, the Cr2O3–graphene heterostructure exhibits highly p-type nature and shows a significant relative change in the bandgap upon adsorption of reducing gases. All these promising aspects – when combined with the evidence that Density Functional Theory (DFT) computations give access to robust and detailed knowledge essential for the design of promising heterostructures40,41 and sensor prototypes42 – led us to carefully investigate, by means of first-principles computational techniques, the electronic properties of both Cr2O3 and Cr2O3–graphene structures (this latter also in the presence of limonene) for evaluating their capabilities in acting as potential breath sensors for early diagnosis of CLDs. Albeit Cr2O3–graphene heterostructures have already been investigated for applications in lithium-ion batteries,43,44 supercapacitors,45 nanomedicines,46 electrochemical reactions,47 and protective coatings,48 their potential application as gas sensors is, to the best of our knowledge, discussed here for the first time.
2 Methods
The main goal of the present investigation is that of studying a graphene prototypical structure doped with Cr2O3 nanoparticles, also from the point of view of a gas molecule approaching the graphene side of this combined heterostructure. This structure can be approximated to a Cr2O3–graphene heterostructure periodic in a two-dimensional (2D) plane. The choice of a Cr-terminated Cr2O3 slab at the heterostructure interface is due to its higher thermodynamic stability compared with other possible terminations.49To adequately deal with the strong correlation between the d electrons of the Cr atoms, a simplified version of the DFT+U50 method was used. In particular, by adopting the value reported in ref. 51 and performing several benchmark calculations, it was concluded that a value of U = 4 eV appropriately describes the system, being a balanced compromise between the accuracy of the bandgap evaluation and the correct spin values determined for the Cr2O3 unit cell. Finally, an additional dipole correction was also employed to fix the non-vanishing dipole moment created by the slab perpendicular to its own plane.52
The kinetic energy cutoffs for wavefunctions and charge density were set at 50 Rydberg (Ry) and 500 Ry, respectively. A Monkhorst–Pack grid was centered at the Γ point. All structural optimizations were performed at this latter symmetry point to reduce the computational demand of the calculations since the final relaxed structure did not show any appreciable difference from a calculation performed with finer k-point meshes. On the other hand, all single point calculations for the unit cells including the Cr2O3(0001) surface and the Cr2O3–graphene heterostructure were performed with a fine k-point mesh of 15 × 15 × 1. The electronic band structure was determined for the Cr2O3–graphene heterostructure unit cell over a path of Γ–A–H high-symmetry points. A complete set of 308 Kohn–Sham states equal to the total number of electrons in the system was used for this analysis. Finally, a 3 × 3 supercell of the layered unit cell, consisting of a total amount of 342 atoms, was used for investigating the adsorption mechanism, with a 5 × 5 × 1 k-point mesh in the single-point self-consistent-field calculations, and plotted using the gnuplot software.
Löwdin population analysis was performed by projecting the wavefunctions onto their standard (pseudo) atomic basis sets. By using a simple Gaussian broadening with spread equal to 0.002 Ry, the projected Density of States (DOS) and the Löwdin electron populations were hence determined. The Projected Density of States (PDOS) is generated using PAW projectors and all-electron basis functions.
3 Results and discussion
3.1 Cr2O3(0001) slab
The hexagonal unit cell of bulk Cr2O3 has been optimized until the sum of forces on all atoms was beneath 0.025 eV Å−1, with a convergence threshold of 10−12 eV for every single point calculation. At the final structural optimization step, the difference in energy between subsequent iteration structures was below 0.0007 eV. The resulting optimized structure shows lattice constants equal to 4.949 Å and 14.347 Å, respectively. These sizes are comparable with those obtained experimentally, which exhibit values equal to 4.951 Å and 13.566 Å, respectively.53 Cr2O3 is a highly correlated material and, when it is modeled via common Density Functional Theory (DFT) approaches, it typically exhibits an underestimated bandgap as it also occurs for other correlated systems modeled via DFT methods.54–56 The employment of the DFT+U method only partially reduces this specific drawback, leading to a bandgap estimate of 2.8 eV, a value closer to the experimental one (i.e., 3.2 eV).57 Besides, as proven during multiple preliminary tests we performed, the Fermi level of the density of states (DOS) of bulk Cr2O3 is also improved to a larger extent by means of the incorporation of the Hubbard U term. This way, from our calculations it emerges that the Cr2O3 bulk structure manifests a strongly antiferromagnetic behavior with a magnetic ordering of the type + − + − and an individual magnetic moment of the Cr atoms equal to 2.95μB, a value which is not optimal but in fairly good agreement with that obtained in laboratory experiments and reported in ref. 58 (i.e., 2.76μB). The DOS of bulk Cr2O3, as determined by the DFT+U framework described in the Methods section, is displayed in Fig. 1. | ||
| Fig. 1 Density of states (DOS) of bulk Cr2O3 determined at the revPBE/PAW DFT level. The Fermi level is marked by the vertical dashed line. | ||
Notwithstanding the distance modification between the second and the third layer (i.e., O(2)3–Cr(3)) appears to be overestimated by ∼10% in numerical calculations with respect to experiments (see the second row of Table 1), the remainder estimates show a fairly good agreement between ab initio computational predictions and laboratory experiments. In despite of the fundamental interest carried by calculations performed in the bulk structure, the current study focuses on the properties carried by surfaces of the investigated systems. This way, a 10 Å vacuum was introduced on either side of the Cr2O3 slab to avoid inter-slab (self) interactions. The Cr2O3 slab consisted of 18 atomic layers, of which the bottom 7 layers were kept fixed, the top layers were left free to move, even though only the top 4 layers showed a significant change in the interlayer distances during our simulations. Table 1 reports the change in the interlayer distances recorded along with a quantitative comparison with the available computational59 and experimental60 data.
3.2 Cr2O3–graphene heterostructure
Similarly to the Cr2O3 case, the hexagonal unit cell of graphene has been optimized until the sum of forces on all atoms resulted to be beneath 0.025 eV Å−1, with a convergence threshold of 10−12 eV for every single point calculation. The obtained lattice constant (i.e., 2.473 Å) exhibits a slight mismatch with respect to half of the typical Cr2O3 lattice constant. Since graphene is a highly two-dimensional (2D) material which is largely susceptible to any kind of strain, the lattice constant of Cr2O3 has slightly been adjusted (i.e., by a decrease of 0.06%) of the Cr2O3 lattice constant to exactly match the 2 × 2 cell dimension of graphene. Because of the negligible topological modification, the faintly strained Cr2O3 did not show any change of the electronic properties with respect to the unmodified Cr2O3 structure. In this way, a 2 × 2 graphene supercell has been stacked over the Cr2O3 slab unit cell. This combined system has then been subjected to multiple structural optimizations performed at several spacing between Cr2O3 and graphene, also by employing conceptually different DFT methods modeling dispersion interactions, such as Grimme's D361 (DFT+D3) and the exchange-hole dipole moment62,63 method (DFT+XDM). As expected, different results have been obtained depending on the adopted dispersion correction method, as reported in Table 2 where some fundamental properties are listed. In both cases, a weak van der Waals binding between Cr2O3 and graphene has been observed, as also atomistically visualized in Fig. 2.| Properties | DFT+D3 | DFT+XDM |
|---|---|---|
| Interlayer distance [Å] | 3.07 | 2.87 |
| Bandgap [eV] | 0.30 | 0.13 |
| Adsorption energy [eV] | 13.56 | 35.52 |
| Average charge transfer per C atom | 0.0075 e | 0.0085 e |
 | ||
| Fig. 2 Top and side view of the Cr2O3–graphene heterostructure optimized via (a) DFT+D3 and (b) DFT+XDM dispersion correction methods. | ||
The heterostructure simulated within the DFT+XDM framework exhibits a 6.5% lower interlayer distance compared to the same heterostructure where dispersion corrections are approximated by DFT+D3. Moreover, by stacking together graphene and Cr2O3, it turns out that a net charge transfer from the former to the latter takes place because of the lower work function of graphene (i.e., 4.6 eV64) from Cr2O3 (i.e., 4.8 eV65). Thus, Cr2O3 acts as a p-type doping agent to graphene. These findings are in agreement with those reported in ref. 66, where the magneto-electric properties of Cr2O3–graphene heterostructures have been investigated.
It is noteworthy the fact that a notable difference emerges between the system treated with Grimme's D3 corrections and that simulated by using XDM dispersion interactions. In fact, a more negative value of the total potential energy of the system of 22 eV is recorded when the XDM dispersion correction is adopted. On the other hand, carbon atoms of graphene show an altered magnetic moment in both cases due to the strong antiferromagnetic nature of Cr2O3. As reported elsewhere, however, to carefully check for the complete stability of the simulated structures, evaluation of the respective phonon spectra would be in order.41 Unfortunately, preliminary calculations have revealed that the size and the complexity of the simulated system would commit a computational effort rendering this kind of analysis prohibitive for the scope of the present article.
Fig. 3 displays the electronic band structure of the Cr2O3–graphene heterostructure as simulated by DFT+XDM. Red curves illustrate spin-up electronic configurations whereas the black ones show spin-down configurations. The green line at 3.8317 eV marks the Fermi energy level, which resides inside of the valence band, showcasing the high p-type doping in the semiconductor slab. At the K high-symmetry point, the structure exhibits a direct bandgap of 0.13 eV. From the electronic band structure evaluation a series of useful quantities can be extracted. For instance, inspired by some recent work,67 in Table 3 the effective masses and group velocities of the conduction and valence bands near the K high-symmetry point are listed. It turns out that the group velocities calculated via parabolic approximations are several times larger than those recorded in semiconducting monolayer MoS2.68 Moreover, values measured for the effective mass corroborate the semiconducting nature of the investigated Cr2O3–graphene heterostructure. Finally, Fig. 4a and b show the DOS of the latter heterostructure optimized by using the D3 and XDM dispersion correction methods, respectively.
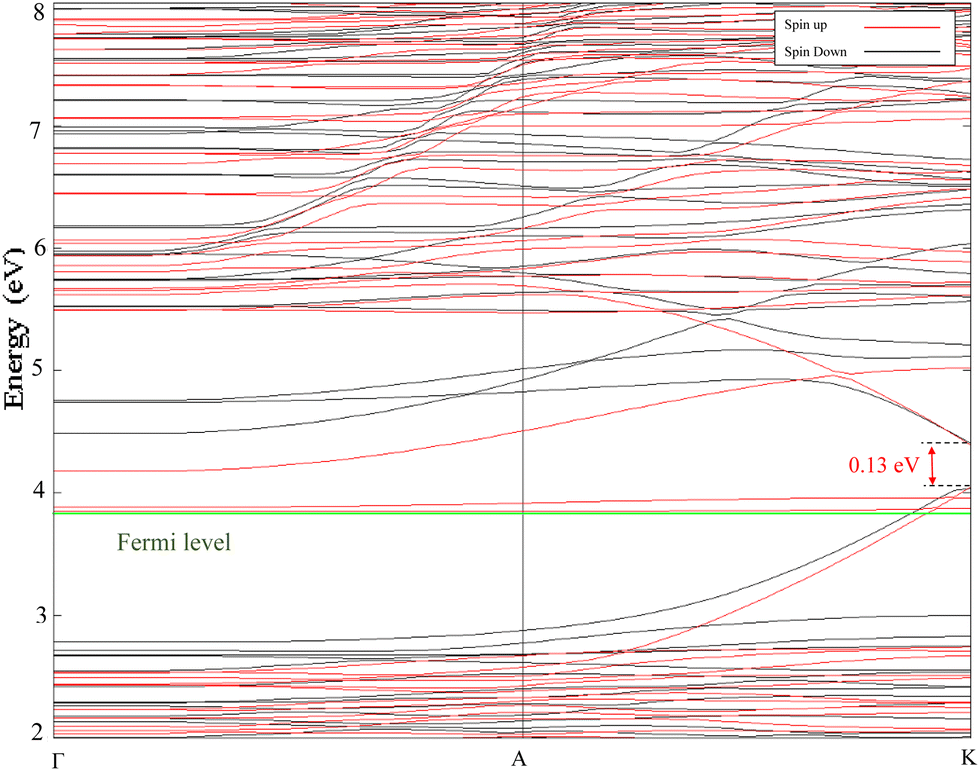 | ||
| Fig. 3 Energy band structure of the Cr2O3–graphene heterostructure optimized via the DFT+XDM dispersion correction method. | ||
| Conduction band | Valence band | |||
|---|---|---|---|---|
| Effective electron mass mc | Group velocity Vg,c | Effective hole mass mv | Group velocity Vg,v | |
| Spin up | −0.1921m0 | −1.9376 × 10⁵ m s−1 | 0.3150m0 | 1.1815 × 10⁵ m s−1 |
| Spin down | −0.1141m0 | −3.2608 × 10⁵ m s−1 | 0.3938m0 | 0.9452 × 10⁵ m s−1 |
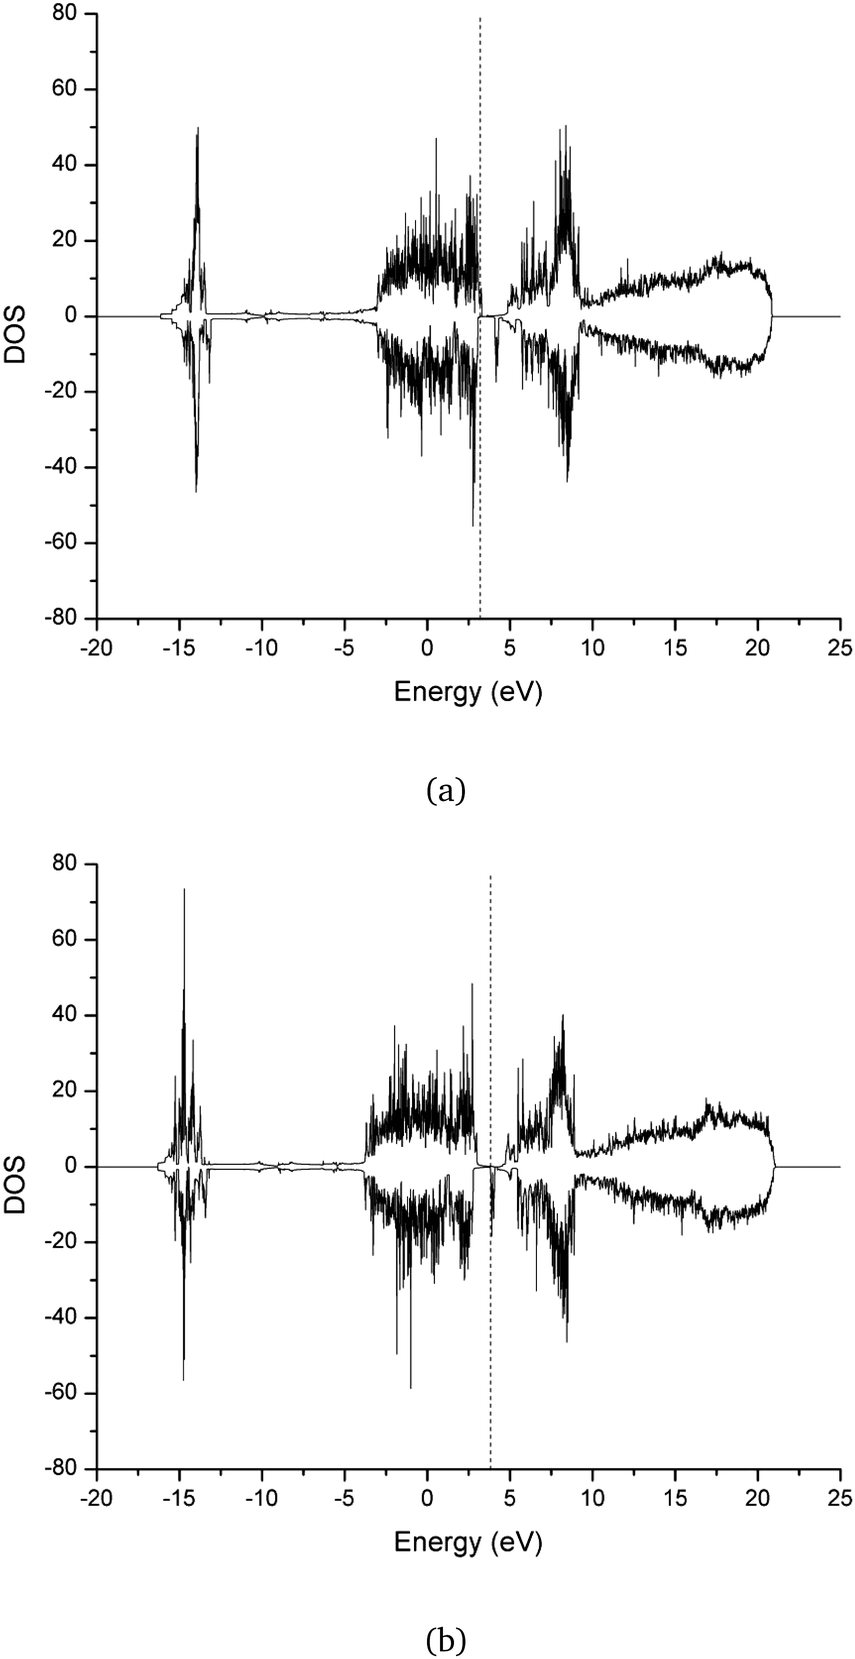 | ||
| Fig. 4 DOS of the Cr2O3–graphene heterostructure optimized via (a) DFT+D3 and (b) DFT+XDM dispersion correction methods. Fermi levels are marked by vertical dashed lines. | ||
3.3 Adsorption of limonene
In this section, the capabilities offered by the Cr2O3–graphene heterostructure toward the limonene molecule adsorption are discussed. Due to the higher accuracy afforded with respect to Grimme's D3 semi-empirical corrections, we have decided to adopt uniquely the XDM dispersion model in the DFT simulations exploring the adsorption of limonene on the surface of this heterostructure. Among other things, the XDM model has been proven to be among the most suited candidates for surface adsorption calculations,69 graphene adsorption,70,71 as well as for layered materials.72Notwithstanding the limonene molecule has been left to relax on the graphene side of the Cr2O3–graphene heterostructure from different relative directions, the most thermodynamically stable – and hence likely – orientation resulted to be in the direct chemisorption of the molecule. Albeit a richer statistical analysis of this aspect would be in order by exploiting, e.g., ab initio molecular dynamics and metadynamics,75 as recently done by some of ours for chelation and sequestration76,77 as well as for other chemical reactions,78–81 it falls out of the scope of the current investigation which is mainly focused on the electronic rather than nuclear properties of the adsorption phenomenon of limonene on the Cr2O3–graphene heterostructure. Moreover, although a dynamical description of the system would enable the incorporation of other factors concerning the gas sensing capabilities, the recovery time – being order of magnitudes longer than simulation timescales affordable by classical and quantum molecular dynamics simulations – can be easily estimated according to transition state theory from the adsorption energy82 as:
 | (1) |
Limonene, similarly to other terpene gases, is a strong reducing agent19–21 and hence leads to the reduction of the carbon atoms – labeled as C179 and C298 in Fig. 5 – of graphene, from planar sp2 to tetrahedral sp3 hybridization, as shown in Fig. 5. Our simulations not only revealed the loss of hydrogen from the sp3 carbon of the propenyl branch of limonene and the transfer of this hydrogen atom to one carbon atom of graphene, but also the formation of a bond between the carbon atom of limonene with one carbon atom of the graphene slab. It turns out that the adsorption energy and the induced change of the bandgap are equal to −1.632 eV and 46.15%, respectively. Even though the limited size of the simulation supercell may in principle affect the bandgap estimate, these values – reported in Table 4 – are significantly larger than those recently found in other similar simulation studies.73,74 Additionally to the evidence that our computations predict a completely different way of adsorption of the molecule (i.e., chemisorption), all these findings indicate a better sensitivity of the proposed heterostructure material toward limonene compared to other reported materials like sensitive g-C6N6 monolayers73 and germanane.74 This large adsorption energy gives rise to an estimated recovery time τ at room temperature equal to 2.61 × 10¹⁴ s. Similarly to the adsorption of simpler gases by some other (hetero)structures operating at 300 K83,84 such a value is too high for rendering the Cr2O3–graphene system suitable as a reusable gas sensor at room temperature. However, considering higher temperature operational circumstances, the calculated recovery time drops at 3.65 × 10⁷ s, 2.82 × 10³ s, and 5.11 s, at 400 K, 500 K, and 600 K, respectively. Thus, at relatively high temperatures the proposed heterostructure can be used as a promising reusable gas sensor for detecting limonene with high selectivity and sensitivity. Furthermore, it is worth stressing the fact that in spite of the large τ at lower temperature regimes, the large Eads would ensure anyway the high capability of sensing very low concentrations of limonene molecules affording very high sensitivity even at low temperatures.
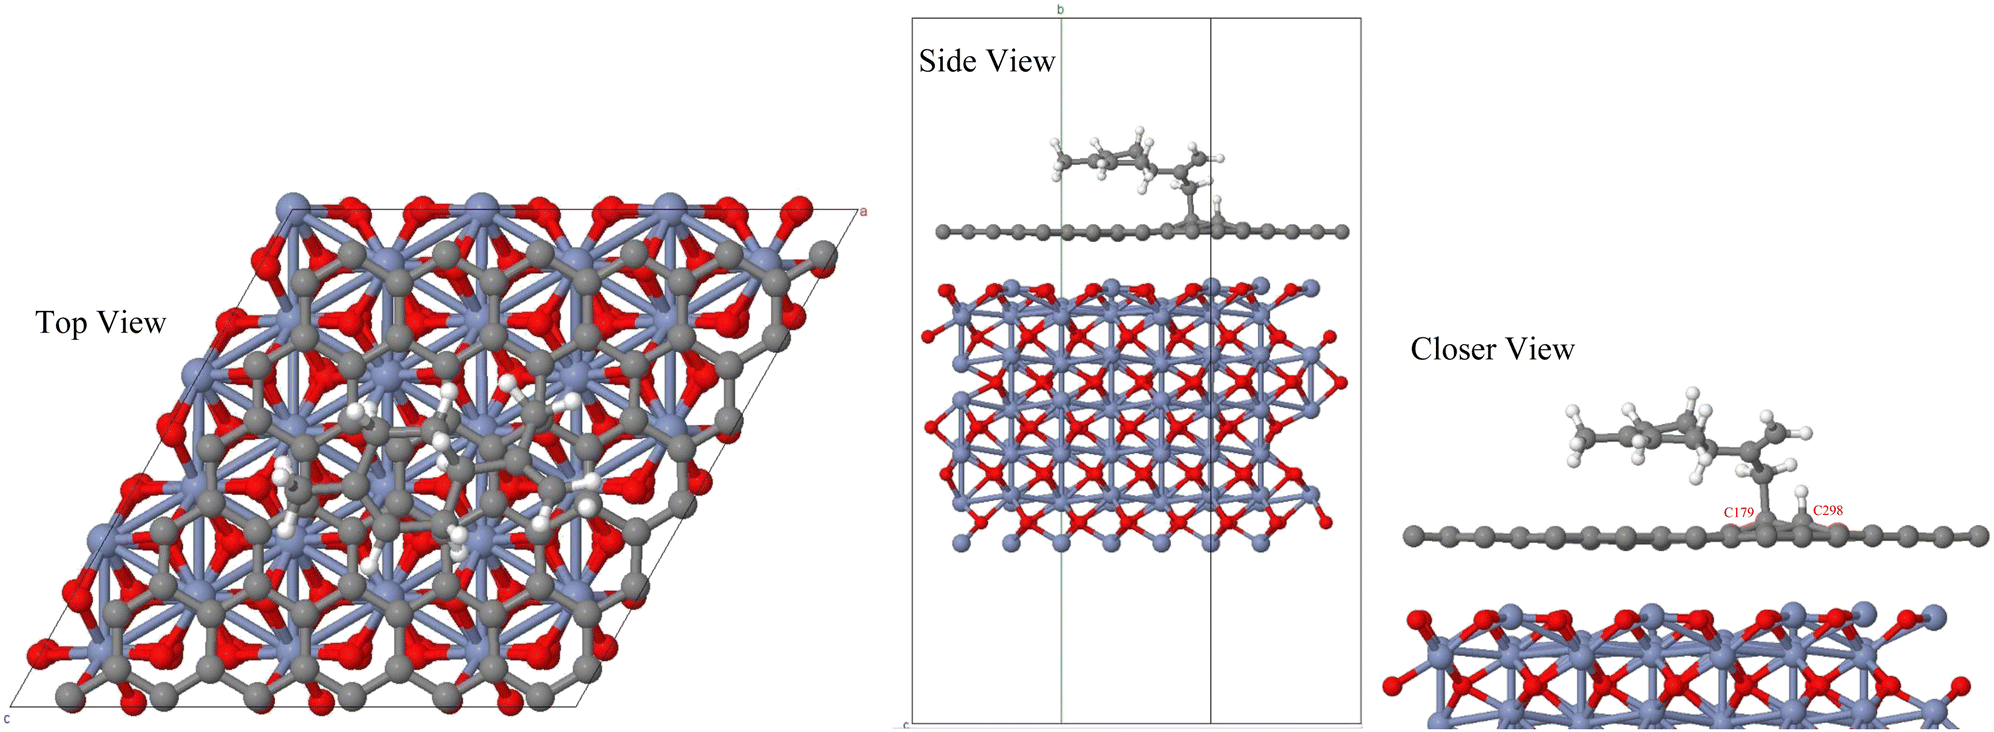 | ||
| Fig. 5 Adsorption of limonene on the Cr2O3–graphene heterostructure. | ||
Contrarily to the trend reported in other works,73,74 a net increase of the bandgap of the investigated heterostructure from 0.13 eV to 0.19 eV is observed upon limonene adsorption. Such a result can be efficiently rationalized by evoking the Moss–Burstein effect, in which limonene behaves as a high n-type doping agent in the p-type degenerate semiconducting heterostructure. Fig. 6 shows the DOS of the system pre (Fig. 6a) and post (Fig. 6b) adsorption. The Fermi level shifts, indeed, from the interior of the valence band (Fig. 6a) toward the conduction band (Fig. 6b), causing a positive Moss–Burstein shift once the adsorption phenomenon is concluded. Fig. 7a shows the Projected Density of States (PDOS) of the free limonene gas molecule (red curve) compared with the DOS of the whole Cr2O3–graphene heterostructure system after limonene adsorption (black curve), whilst Fig. 7b displays a magnification around the Fermi level. The fact that the energy levels of the limonene molecule are mainly restricted to a region falling below 0 eV, whereas they are almost negligible near the Fermi level of the whole structure, indicates a dominance of the perturbation on the heterostructure chemistry over the change in electronic properties observed. In addition, upon adsorption, graphene is no longer a perfect 2D material since a few atoms appear in tetrahedral geometry, as shown in Fig. 8. Thus, it is reasonable to expect that a measurable increase of the electrical resistance of the sensor upon limonene adsorption should be observed.
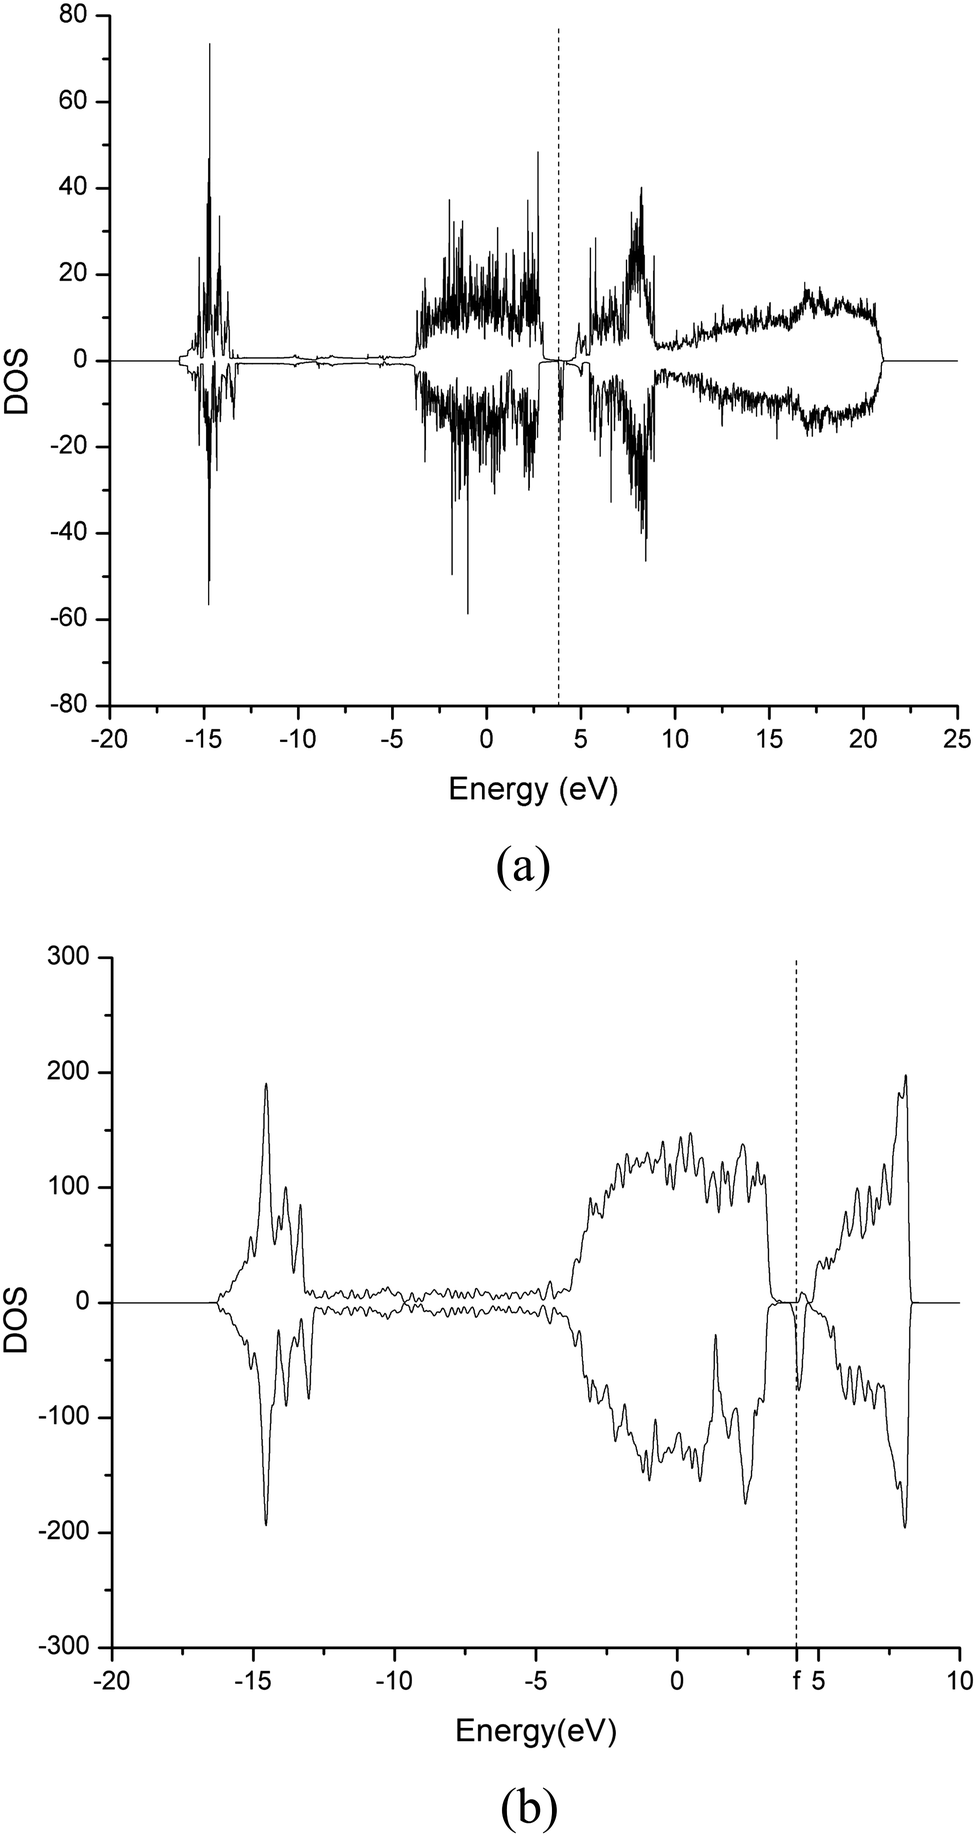 | ||
| Fig. 6 DOS of the Cr2O3–graphene heterostructure before (a) and after (b) limonene adsorption. Fermi levels are marked by vertical dashed lines. | ||
 | ||
| Fig. 7 Projected Density of States (PDOS) of the limonene gas molecule with respect to the DOS of the whole heterostructure after limonene adsorption (a). Plot (b) magnifies the PDOS near the Fermi level. | ||
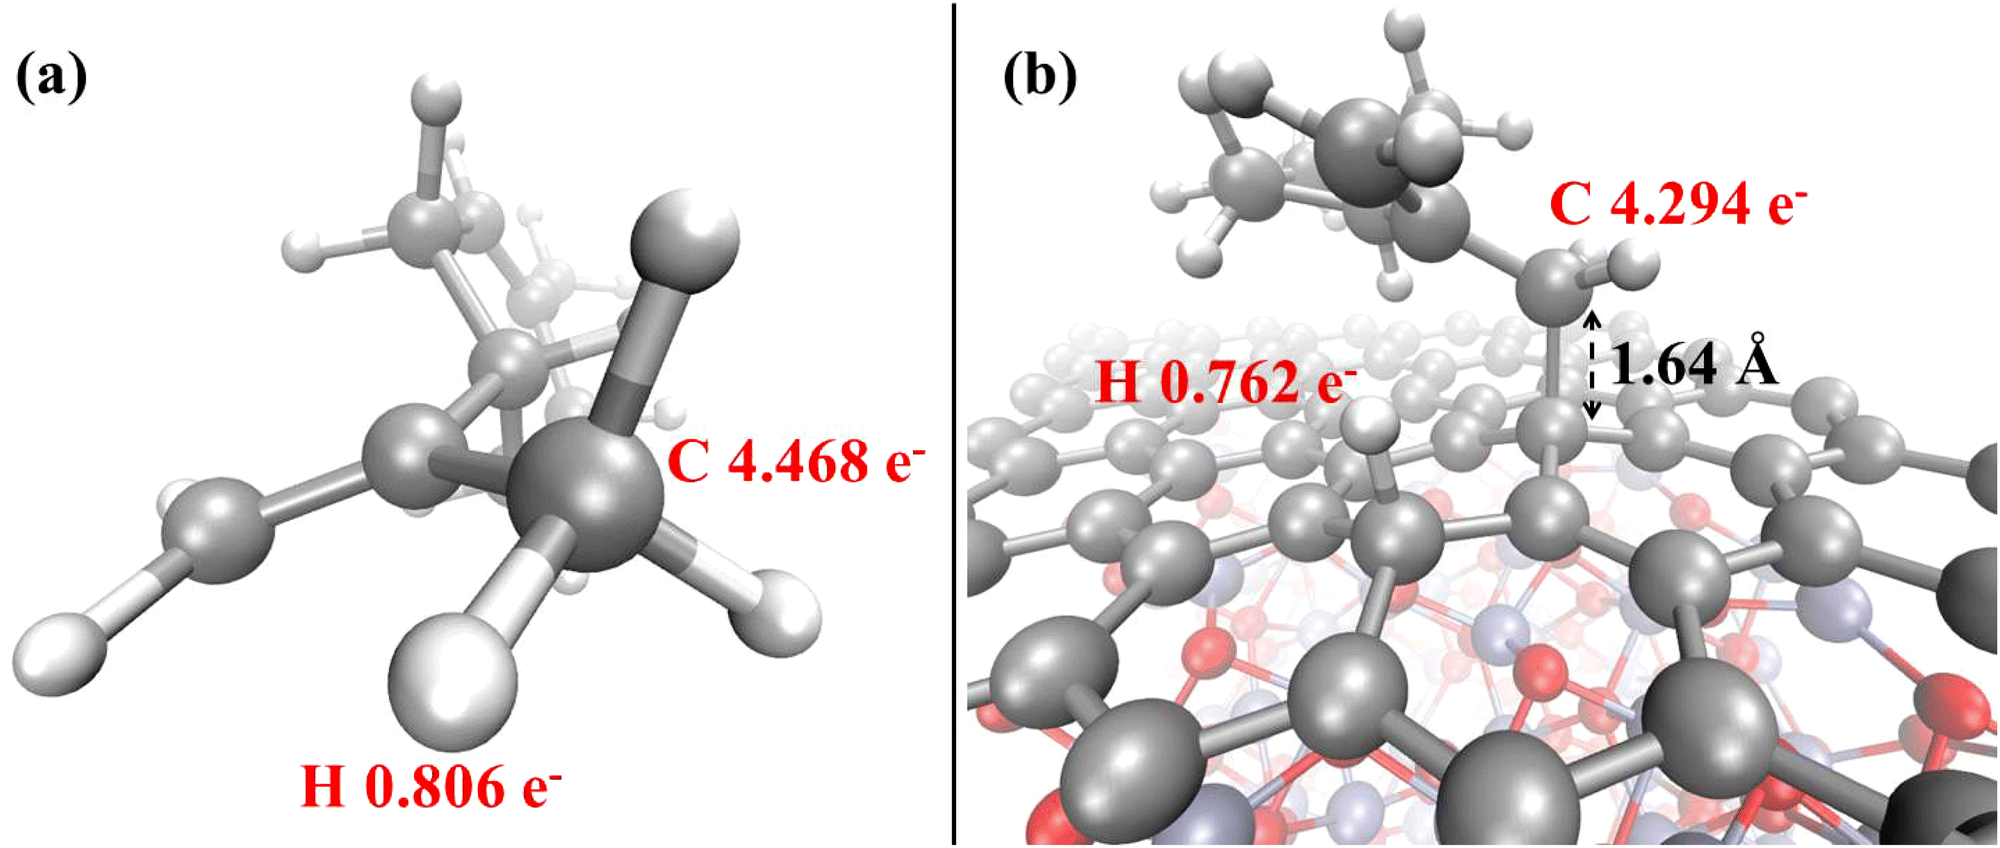 | ||
| Fig. 8 Löwdin electron population analysis for the relevant atoms of the limonene molecule before (a) and after (b) adsorption on the Cr2O3–graphene heterostructure. | ||
Additionally to the modification of the electrical properties upon adsorption, a further remark can be made on the alteration of the magnetization of the system. In fact, a series of interesting and recent theoretical studies revealed that the adsorption of some gas molecules induced a measurable transformation of a series of magnetic properties in supported metal dimers.83,85 In our system, upon the adsorption of the non-magnetic limonene molecule, the net magnetization decreases in absolute value from −3.25 μB to −2.00 μB, while the absolute magnetization remains unperturbed. Finally, the overall picture is supplemented by the evidence that the limonene atoms directly involved in the adsorption phenomenon undergo a net decrease of the local electron population upon chemisorption. In fact, as witnessed by the Löwdin population analysis shown in Fig. 8, the methyl carbon atom of the propenyl branch of the gas limonene molecule is characterized by an average electron population equal to 4.468 (Fig. 8a), which decreases to 4.294 (Fig. 8b) once the molecule is chemisorbed onto the graphene surface, indicating that a partial electron transfer from the aliphatic hydrocarbon to the Cr2O3–graphene heterostructure spontaneously takes place.
4 Conclusions
In this work, the electronic properties of a heterostructure composed of chromium oxide (Cr2O3) and graphene have been characterized by means of Density Functional Theory (DFT) calculations including the U correction. In particular, key peculiarities held by this heterostructure have been disclosed with the aim of evaluating the possibility of adsorbing promising gaseous biomarkers for liver cirrhosis such as limonene molecules.By comparing the outcomes stemming from conceptually different models approximating dispersion interactions – such as Grimme's D3 and the exchange-hole dipole moment (XDM) correction – it turns out that the adsorption phenomenon is more adequately simulated by the DFT+XDM model, a finding in accordance with other investigations conducted on different structures, including adsorption on pure graphene and other layered materials.
Stacking of Cr2O3 on graphene causes a net decrease of the charge density from intrinsic graphene whilst Cr2O3 starts behaving as a p-type doping agent. Moreover, our calculations have revealed a clear modification of the Density of States (DOS) of the Cr2O3–graphene heterostructure upon limonene adsorption, including a strong change of the Fermi level and a sizable increment of ∼50% of the electronic bandgap. Although this increase can be quantitatively affected by the supercell size of our simulations, such a significant relative change of the bandgap accompanied by the large adsorption energy recorded (∼−1.6 eV) strongly indicates a high sensitivity carried by the investigated Cr2O3–graphene heterostructure toward the detection of volatile biomarkers of the limonene type. Incidentally, the Fermi level of the heterostructure shifts from the interior of the valence band toward the conduction band causing a positive Moss–Burstein shift upon limonene adsorption. All these findings pave the way toward the development of sensors from Cr2O3-doped graphene heterostructures capable of detecting biomarker molecules of the limonene class and, hence, allowing timely diagnosis of early forms of liver cirrhosis.
Conflicts of interest
There are no conflicts to declare.Notes and references
- J. M. Paik, P. Golabi, Y. Younossi, A. Mishra and Z. M. Younossi, Hepatology, 2020, 72, 1605–1616 CrossRef PubMed.
- S. Cheemerla and M. Balakrishnan, Clin. Liver Dis., 2021, 17, 365–370 CrossRef PubMed.
- P. S. Mukherjee, S. Vishnubhatla, D. N. Amarapurkar, K. Das, A. Sood, Y. K. Chawla, C. E. Eapen, P. Boddu, V. Thomas, S. Varshney, D. S. Hidangmayum, P. Bhaumik, B. Thakur, S. K. Acharya and A. Chowdhury, PLoS One, 2017, 12, e0187033 CrossRef PubMed.
- W.-C. Zhou, Q.-B. Zhang and L. Qiao, World J. Gastroenterol., 2014, 20(23), 7312–7324 CrossRef PubMed.
- American Liver Foundation, 2021.
- T. Y. Khalid, B. D. L. Costello and R. Ewen, Metabolomics, 2013, 9, 938–948 CrossRef CAS.
- I. A. Hanouneh, N. N. Zein, F. Cikach, L. Dababneh, D. Grove, N. Alkhouri, R. Lopez and R. A. Dweik, Clin. Gastroenterol. Hepatol., 2014, 12, 516–523 CrossRef CAS PubMed.
- K. Eng, N. Alkhouri, F. Cikach, N. Patel, C. Yan, D. Grove, R. Lopez, E. Rome and R. A. Dweik, J. Breath Res., 2015, 9, 026002 CrossRef PubMed.
- M. Netzer, G. Millonig, M. Osl, B. Pfeifer, S. Praun, J. Villinger, W. Vogel and C. Baumgartner, Bioinformatics, 2009, 25, 941–947 CrossRef CAS PubMed.
- S. Nair, K. Cope, R. H. Terence and A. M. Diehl, Am. J. Gastroenterol., 2001, 96, 1200–1204 CrossRef CAS PubMed.
- P. Lettéron, V. Duchatelle, A. Berson, B. Fromenty, C. Fisch, C. Degott, J. P. Benhamou and D. Pessayre, Gut, 1993, 34, 409–414 CrossRef PubMed.
- R. Fernández Del Río, M. E. O'Hara, A. Holt, P. Pemberton, T. Shah, T. Whitehouse and C. A. Mayhew, EBioMedicine, 2015, 2(9), 1243–1250 CrossRef PubMed.
- M. E. O'Hara, R. F. del Río, A. Holt, P. Pemberton, T. Shah, T. Whitehouse and C. A. Mayhew, J. Breath Res., 2016, 10, 046010 CrossRef PubMed.
- E. Ce and Y. Sg, J. Nutrition, 1994, 125, 607–614 Search PubMed.
- N. Kishimoto and A. Kashiwagi, Food Sci. Technol. Res., 2022, 28, 113–118 CrossRef CAS.
- T. Shimada, M. Shindo and M. Miyazawa, Drug Metab. Pharmacokinet., 2002, 17, 507–515 CrossRef PubMed.
- M. Miyazawa, M. Shindo and T. Shimada, Drug Metab. Dispos., 2002, 30, 602–607 CrossRef CAS PubMed.
- K. L. Hall-Boyer, The top 100 drug interactions, 2003 DOI:10.1016/S0196-0644(03)00621-8.
- K.-G. Lee and T. Shibamoto, J. Agric. Food Chem., 2002, 50, 4947–4952 CrossRef CAS PubMed.
- J. Graßmann, Vitam. Horm., 2005, 72, 505–535 CrossRef.
- John Wiley & Sons, Ltd, Flavour Fragrance J., 2009, 24, 266–275 Search PubMed.
- M. Pumera, Chem. Rec., 2009, 9, 211–223 CrossRef CAS PubMed.
- Z.-S. Wu, W. Ren, L. Wen, L. Gao, J. Zhao, Z. Chen, G. Zhou, F. Li and H.-M. Cheng, ACS Nano, 2010, 4, 3187–3194 CrossRef CAS PubMed.
- E. Singh, M. Meyyappan and H. S. Nalwa, ACS Appl. Mater. Interfaces, 2017, 9, 34544–34586 CrossRef CAS PubMed.
- Y. Ju Yun, W. G. Hong, N.-J. Choi, B. Hoon Kim, Y. Jun and H.-K. Lee, Sci. Rep., 2015, 5, 10904 CrossRef PubMed.
- D. Marchenko, A. Varykhalov, A. Rybkin, A. M. Shikin and O. Rader, Appl. Phys. Lett., 2011, 98, 122111 CrossRef.
- J. D. Fowler, M. J. Allen, V. C. Tung, Y. Yang, R. B. Kaner and B. H. Weiller, ACS Nano, 2009, 3, 301–306 CrossRef CAS PubMed.
- S. Yang, Y. Liu, W. Chen, W. Jin, J. Zhou, H. Zhang and G. S. Zakharova, Sens. Actuators, B, 2016, 226, 478–485 CrossRef CAS.
- Y. Wang, Y. Wang, J. Cao, F. Kong, H. Xia, J. Zhang, B. Zhu, S. Wang and S. Wu, Sens. Actuators, B, 2008, 131, 183–189 CrossRef CAS.
- H.-J. Kim, H.-M. Jeong, T.-H. Kim, J.-H. Chung, Y. C. Kang and J.-H. Lee, ACS Appl. Mater. Interfaces, 2014, 6, 18197–18204 CrossRef CAS PubMed.
- S. Yang, Y. Liu, W. Chen, W. Jin, J. Zhou, H. Zhang and G. S. Zakharova, Sens. Actuators, B, 2016, 226, 478–485 CrossRef CAS.
- S. Majumdar, Ceram. Int., 2015, 41, 14350–14358 CrossRef CAS.
- I. Das, A. Nandi, R. Majumder, H. Saha and S. Majumdar, J. Electron. Mater., 2021, 50, 3537–3545 CrossRef CAS.
- G. F. Fine, L. M. Cavanagh, A. Afonja and R. Binions, Sensors, 2010, 10, 5469–5502 CrossRef CAS PubMed.
- D. E. Williams, Sens. Actuators, B, 1999, 57, 1–16 CrossRef CAS.
- A. Nandi, P. Nag, D. Panda, S. Dhar, S. M. Hossain, H. Saha and S. Majumdar, ACS Omega, 2019, 4, 11053–11065 CrossRef CAS PubMed.
- D. Panda, A. Nandi, S. K. Datta, H. Saha and S. Majumdar, RSC Adv., 2016, 6, 47337–47348 RSC.
- S. Majumdar, A. Nandi and H. Saha, IEEE Sens. J., 2018, 18, 6517–6526 CAS.
- M. T. Greiner, L. Chai, M. G. Helander, W.-M. Tang and Z.-H. Lu, Adv. Funct. Mater., 2012, 22, 4557–4568 CrossRef CAS.
- M. Yang, L. Chen, F. Kong, J. Guo, H. Shu and J. Dai, Phys. Chem. Chem. Phys., 2022, 24, 6926–6934 RSC.
- W. X. Zhang, Y. Yin and C. He, J. Phys. Chem. Lett., 2021, 12, 5064–5075 CrossRef CAS PubMed.
- S.-Y. Xia, L.-Q. Tao, T. Jiang, H. Sun and J. Li, Appl. Surf. Sci., 2021, 536, 147965 CrossRef CAS.
- W. Yue, S. Tao, J. Fu, Z. Gao and Y. Ren, Carbon, 2013, 65, 97–104 CrossRef CAS.
- S. Khamlich, Z. Nuru, A. Bello, M. Fabiane, J. Dangbegnon, N. Manyala and M. Maaza, J. Alloys Compd., 2015, 637, 219–225 CrossRef CAS.
- P. Asen, S. Shahrokhian and A. I. zad, J. Electroanal. Chem., 2018, 823, 505–516 CrossRef CAS.
- I. Talat, A. Arshad and Q. Mansoor, Ceram. Int., 2021, 47, 889–898 CrossRef CAS.
- L. Xia, B. Li, Y. Zhang, R. Zhang, L. Ji, H. Chen, G. Cui, H. Zheng, X. Sun and F. Xie, Inorg. Chem., 2019, 58, 2257–2260 CrossRef CAS PubMed.
- F. Venturi, J. Pulsford and T. Hussain, Mater. Lett., 2020, 276, 128283 CrossRef CAS.
- A. Rohrbach, J. Hafner and G. Kresse, Phys. Rev. B: Condens. Matter Mater. Phys., 2004, 70, 125426 CrossRef.
- M. Cococcioni and S. de Gironcoli, Phys. Rev. B: Condens. Matter Mater. Phys., 2005, 71, 035105 CrossRef.
- F. Maldonado, C. Novillo and A. Stashans, Chem. Phys., 2012, 393, 148–152 CrossRef CAS.
- J. Neugebauer and M. Scheffler, Phys. Rev. B: Condens. Matter Mater. Phys., 1992, 46, 16067–16080 CrossRef CAS PubMed.
- L. W. Finger and R. M. Hazen, J. Appl. Phys., 1980, 51, 5362 CrossRef CAS.
- J. P. Perdew and M. Levy, Phys. Rev. Lett., 1983, 51, 1884–1887 CrossRef CAS.
- L. J. Sham and M. Schlüter, Phys. Rev. Lett., 1983, 51, 1888–1891 CrossRef.
- P. Mori-Sánchez, A. J. Cohen and W. Yang, Phys. Rev. Lett., 2008, 100, 146401 CrossRef PubMed.
- R. Zimmermann, P. Steiner, R. Claessen, F. Reinert, S. Hüfner, P. Blaha and P. Dufek, J. Phys.: Condens. Matter, 1999, 11, 1657–1682 CrossRef CAS.
- L. M. Corliss, J. M. Hastings, R. Nathans and G. Shirane, J. Appl. Phys., 1965, 36, 1099–1100 CrossRef CAS.
- A. Rohrbach, J. Hafner and G. Kresse, Phys. Rev. B: Condens. Matter Mater. Phys., 2004, 70, 125426 CrossRef.
- F. Rohr, M. Bäumer, H.-J. Freund, J. Mejias, V. Staemmler, S. Müller, L. Hammer and K. Heinz, Surf. Sci., 1997, 372, L291–L297 CrossRef CAS.
- S. Grimme, J. Comput. Chem., 2006, 27, 1787–1799 CrossRef CAS PubMed.
- A. D. Becke and E. R. Johnson, J. Chem. Phys., 2007, 127, 154108 CrossRef PubMed.
- A. Otero-de-la Roza and E. R. Johnson, J. Chem. Phys., 2012, 136, 174109 CrossRef CAS PubMed.
- K. Matsumoto, Frontiers of Graphene and Carbon Nanotubes, 2015 Search PubMed.
- M. Wilde, I. Beauport, F. Stuhl, K. Al-Shamery and H.-J. Freund, Phys. Rev. B: Condens. Matter Mater. Phys., 1999, 59, 13401–13412 CrossRef CAS.
- S. Cao, Z. Xiao, C.-P. Kwan, K. Zhang, J. P. Bird, L. Wang, W.-N. Mei, X. Hong and P. A. Dowben, Appl. Phys. Lett., 2017, 111, 182402 CrossRef.
- C. He, F. Han and W. Zhang, Chin. Chem. Lett., 2022, 33, 404–409 CrossRef CAS.
- D. K. Ferry, Semicond. Sci. Technol., 2016, 31, 11LT01 CrossRef.
- M. S. Christian, A. Otero-de-la Roza and E. R. Johnson, J. Chem. Theory Comput., 2016, 12, 3305–3315 CrossRef CAS PubMed.
- M. S. Christian, A. Otero-de-la Roza and E. R. Johnson, Carbon, 2017, 118, 184–191 CrossRef CAS.
- M. S. Christian, A. Otero-de-la Roza and E. R. Johnson, Carbon, 2017, 124, 531–540 CrossRef CAS.
- A. Otero-de-la Roza, L. M. LeBlanc and E. R. Johnson, J. Phys. Chem. Lett., 2020, 11, 2298–2302 CrossRef CAS PubMed.
- W. Zhang, H. Yan and C. He, Appl. Surf. Sci., 2021, 566, 150716 CrossRef CAS.
- U. Srimathi, V. Nagarajan and R. Chandiramouli, Appl. Surf. Sci., 2019, 475, 990–998 CrossRef CAS.
- A. Laio and M. Parrinello, Proc. Natl. Acad. Sci. U. S. A., 2002, 99, 12562–12566 CrossRef CAS PubMed.
- G. Cassone, H. Kruse and J. Sponer, Phys. Chem. Chem. Phys., 2019, 21, 8121–8132 RSC.
- G. Cassone, D. Chillè, V. Mollica Nardo, O. Giuffrè, R. C. Ponterio, J. Sponer, S. Trusso, F. Saija and C. Foti, Dalton Trans., 2020, 49, 6302–6311 RSC.
- G. Cassone, J. Phys. Chem. Lett., 2020, 11, 8983–8988 CrossRef CAS PubMed.
- G. Cassone, F. Pietrucci, F. Saija, F. Guyot and A. M. Saitta, Chem. Sci., 2017, 8, 2329–2336 RSC.
- G. Cassone, J. Sponer, J. E. Sponer, F. Pietrucci, A. M. Saitta and F. Saija, Chem. Commun., 2018, 54, 3211–3214 RSC.
- C. A. Petroff, G. Cassone, J. Šponer and G. R. Hutchison, Adv. Mater., 2021, 33, 2007486 CrossRef CAS PubMed.
- Y.-H. Zhang, Y.-B. Chen, K.-G. Zhou, C.-H. Liu, J. Zeng, H.-L. Zhang and Y. Peng, Nanotechnology, 2009, 20, 185504 CrossRef PubMed.
- L. Yu and F. Li, Phys. Chem. Chem. Phys., 2022, 24, 9842–9847 RSC.
- S. Impeng, A. Junkaew, P. Maitarad, N. Kungwan, D. Zhang, L. Shi and S. Namuangruk, Appl. Surf. Sci., 2019, 473, 820–827 CrossRef CAS.
- L. Yu, F. Li, J. Zhao and Z. Chen, Adv. Powder Mater., 2022, 1, 100031 CrossRef.
| This journal is © the Owner Societies 2022 |