 Open Access Article
Creative Commons Attribution 3.0 Unported Licence
Sodium to cesium ions: a general ladder mechanism of ion diffusion in prussian blue analogs†
Johan
Nordstrand
 *a,
Esteban
Toledo-Carrillo
a,
Lars
Kloo
 b and
Joydeep
Dutta
 a
a
aFunctional Materials, Applied Physics Department, School of Engineering Sciences, KTH Royal Institute of Technology, AlbaNova universitetscentrum, SE-106 91, Stockholm, Sweden. E-mail: johanno3@kth.se
bApplied Physical Chemistry, Department of Chemistry, KTH Royal Institute of Technology, SE-100 44 Stockholm, Sweden
First published on 13th May 2022
Abstract
Prussian blue analogs (PBAs) form crystals with large lattice voids that are suitable for the capture, transport and storage of various interstitial ions. Recently, we introduced the concept of a ladder mechanism to describe how sodium ions inside a PBA crystal structure diffuse by climbing the frames formed by aligned cyanide groups in the host structure. The current work uses semi-empirical tight-binding density functional theory (DFTB) in a multiscale approach to investigate how differences in the size of the monovalent cation affect the qualitative and quantitative aspects of the diffusion process. The results show that the ladder mechanism represents a unified framework, from which both similarities and differences between cation types can be understood. Fundamental Coulombic interactions make all positive cations avoid the open vacant areas in the structure, while cavities surrounded by partially negatively charged cyanide groups form diffusion bottlenecks and traps for larger cations. These results provide a new and quantitative way of understanding the suppression of cesium adsorption that has previously been reported for PBAs characterized by a low vacancy density. In conclusion, this work provides a unified picture of the cation adsorption in PBAs based on the newly formulated ladder mechanism.
Introduction
Atomic diffusion in crystalline materials is immensely important for many applications in the modern world. Hence, understanding such processes is critical to scientific progress in many areas. Some interesting materials to investigate in-depth are Prussian Blue Analogs (PBAs),1,2 which display many special properties that affect the diffusion inside the material.PBAs form crystal structures with wide lattice spacing. When used as an electrode material, iron atoms in the crystal matrix can accept electrons (by electrochemical reduction), allowing the crystal to intercalate additional cations. This makes them effective for energy storage3 and desalination by capacitive deionization (CDI), among many potential applications.4–18 The versatile nature of PBAs further enables applications in carbon capture,19 Fenton reactions,20 sensing,21 and biomedicine.22,23 At the extreme end, it can even be applied for cesium decontamination24–28 because the huge Cs+ ions can passively replace K+ ions in the matrix formed by the host structure.
In all the applications, the compositions of PBAs and their crystal structures impact the performance. The diverse family of PBA materials29–32 is characterized by the general composition M[M′(CN)6], where M and M′ are metal ions such as iron (Fe), copper (Cu), sodium (Na+), potassium (K+), etc.33 The materials can also contain high densities of defects.34,35 Generally, the composition and vacancy content will have a substantial impact on the macroscopic ion diffusion rates, uptake capacity, energy content, stability, etc., when cations such as sodium (Na+) are diffusing through the PBAs.33,35 A key question is thus how the interplay between guest cations and the different forms of the crystal structure framework determines the diffusive properties.
Cesium is relevant to consider for diffusion in PBAs because it represents the extreme case of large monovalent inorganic cations. Studies focusing on cesium have highlighted that the interplay between these ions and the surrounding host structural framework is critical. For instance, materials of high purity are beneficial for the diffusion and uptake capacity of smaller ions,35 but high vacancy densities are reported to instead be beneficial for the uptake of cesium ions.34 While such results have led to ideas about how the materials work with respect to different cations, a unified theory of cation diffusion could provide a deeper understanding of the processes by connecting these disparate observations and proposed models in the literature.
Recently, we proposed a ladder mechanism to describe how Na+ diffuses through PBAs by climbing inner structural frames formed by oriented cyanide interactions.36 That study also included simulations of analogous cations, such as Li+. That work also shows that such a model can be combined with macroscopic,37–39 finite-element (FEM)16,40–42 simulations to successfully predict device-level performance. Still, previous studies have argued that larger ionic size changes the diffusion pathways, and therefore it is important to also investigate how well the proposed mechanism translates to the diffusion of larger ions. This work exploits quantum-chemical calculations to investigate the interactions also of larger monovalent cations up to cesium and establish a unified platform for the cation diffusion mechanism in PBAs. Thus, the current study seeks to explain experimental observations for different systems and cation size as qualitative and quantitative consequences of the underlying mechanism of cation transport.
Theory
In order to answer the question of how monovalent cations behave in a PBA material, we need a method that allows us to estimate the atomistic properties without prior investigation of the experimental systems.34 Thus, the current study is based on quantum-chemical calculations using a semi-empirical tight-binding density functional theory (DFTB) approach. This is a suitable level of theory because it allows simulations of large systems with reasonable accuracy. Here, such simulations were implemented employing the xTB program developed by Grimme and co-workers.43–45 For the computations, we used the GFN-1 method with default configurations. Stack sizes and thread counts were selected based on the general advice in the xTB documentation.46 Further details are provided in ref. 47.The modeled system used corresponds to the structure of PB with and without vacancies. In both cases, the model was designed to consist of 2 × 2 × 2 supercells translated by periodic boundary conditions. The vacancy systems were based on unit cells corresponding to so-called insoluble PB, iron(III) hexacyanoferrate(II) (Fe4[Fe(CN)6]3·6H2O) (no zeolitic water), while the non-vacant systems were based on unit cells corresponding to what is typically referred to as soluble PB, hexacyanoferrate(III) (AFe[Fe(CN)6]). In these materials, A is a cation in the crystal structure matrix, taken as potassium (K+) in this work. In the simulations with a Cu-based PBA (hereafter denoted Cu-PBA), the first Fe in the formulae above (the formally divalent M ion) is replaced with Cu (Fig. 2).
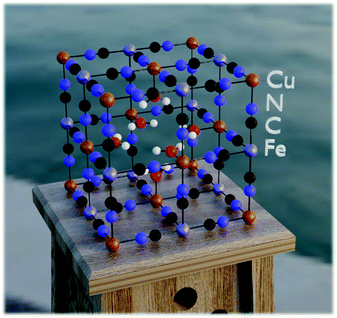
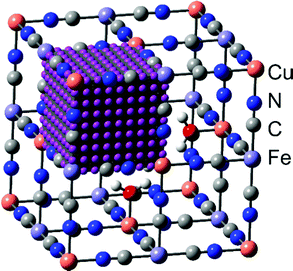
Specifically, regarding the PB model structure,2 the lattice size of the unit cell was 10.13 Å in all directions. Thus, alternating Cu/Fe metal ions are spaced at a 10.13/2 Å distance. The N and C atoms are positioned at 1.925 Å and 3.14 Å from the nearest Cu ion. The unit cell structure is shown in Fig. 1. Ref. 2 further explains that PB is considered to have a cubic space group Fm![[3 with combining macron]](https://www.rsc.org/images/entities/char_0033_0304.gif) m. We used periodic boundary conditions to model the crystal. The metal ions occupy 4a and 4b Wyckoff positions. Carbon, Nitrogen, and coordinated oxygen occupy 24e positions.
m. We used periodic boundary conditions to model the crystal. The metal ions occupy 4a and 4b Wyckoff positions. Carbon, Nitrogen, and coordinated oxygen occupy 24e positions.
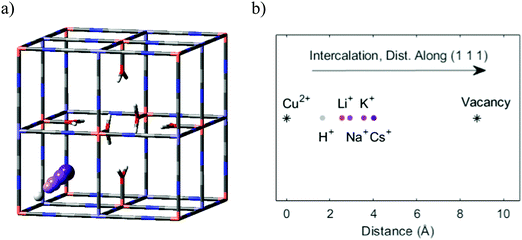
In order to investigate the diffusion properties, we added a model cation to one of the central cavities in one of the unit cells and scanned the energy landscape using single-point DFTB calculations. The total energy in the system for a 9 × 9 × 9 grid of positions of the intercalated cation in the void (Fig. 2) was calculated. Notably, the extra ion was added along with a corresponding host structure electron, such that the bulk crystal was always charge-neutral.
Having estimated the energies for all 729 positions of the intercalated cation, the next step is to use this energy landscape to deduce the diffusion rate of the cation inside the crystal. One way to achieve this is by using self-consistent mean-field theory combined with a Monte Carlo technique.48 Briefly, the principle is based on the assumption that the rate at which an ion moves between energy minima depends exponentially on the energy barrier (eqn (1), see ref. 49). Thus, the hopping rate Γ is a function of the attempt frequency ν*, the energy barrier ΔEb, the Boltzmann constant kB, and the thermodynamic temperature T. In this work, these estimates were obtained by using the program KineCluE.50 Using the assumptions above, it generates predictions of the diffusion constants of the different cations in different PBA host frameworks. In summary, the methods described so far make it possible to obtain quantitative predictions of the cation diffusion rate, without requiring any parameter fitting to models or experimental data of an investigated system.
Γ = ν*![[thin space (1/6-em)]](https://www.rsc.org/images/entities/char_2009.gif) exp(−ΔEb/kBT) exp(−ΔEb/kBT) | (1) |
The blockage simulation introduced at the final stage of this work is used to compare the number of sites that the Cs+ ions can reach in the presence of K+ in a nanoparticle of the materials. Previous studies have reported that the composition of Cu-PBA is AyCu[Fe(CN)6]1−x, where y = 2 − 4x.34 This means the average number of K+ ions in a unit cell is nmean,x = 4(2 − 4x). The maximum possible content of interstitial cations in a unit cell is nmax = 8 K+ ions (or Cs+ ions), based on the number of cavities. If only a depth d of a spherical particle with radius r is reachable from the surface, then the maximum fraction of content η that could be reached this region is described by eqn (2). Based on the data in ref. 34, we have used a typical nanoparticle radius of 20 nm and have calculated d by assuming that an ion that gets trapped upon entering an enclosed cavity has the potential to reach the two outermost layers of a unit cell. In this context, it is notable that a larger nanoparticle radius than 20 nm decreases the surface-to-volume ratio, which also reduces the relative maximum cation adsorption.
 | (2) |
Experimental data
Experiments
All theoretical model predictions need to be validated with respect to experimental results. Therefore, in this work, we also prepared and characterized a Cu-PBA for comparison.Crystals of Cu-PBA were grown on a graphite foil (Minseal, thickness 0.18 mm) following the procedures described elsewhere.10 In brief, a solution A was prepared consisting of 2 mM of potassium ferricyanide (K3Fe(CN)6), and a solution B of 2 mM of copper(II) chloride (CuCl2). A 5 × 5 cm piece of graphite foil was immersed for an hour in solution A before the deposition. In order to grow Cu-PBA particles on the graphite foil, solution B was added drop-wise to solution A under continuous stirring. The stirring was maintained for 1 hour after the addition of solution B was completed. The container was then sealed and placed in an oven at 80 °C for 8 h. After cooling the solution to room temperature, the graphite foil was removed from the solution, rinsed thoroughly with deionized water, and dried in an oven at 60 °C over night.
The morphology of the resulting Cu-PBA was studied by scanning electron microscopy (SEM) using a GEMINI Ultra 55 microscope (Zeiss). Fourier-transform infrared spectroscopy was used to characterize the functional groups present in the structure of Cu-PBA, using a ThermoFisher, Nicolet iS10 spectrometer. Cu-PBA deposited on the graphite foil was electrochemically characterized using a conventional three-electrode setup connected to a potentiostat/galvanostat Interface 1010E (Gamry) with Platinum (Pt) wire as a counter electrode, Ag/AgCl as a reference electrode, and the Cu-PBA-graphite system as working electrode immersed into an aqueous solution of 0.5 M KCl as electrolyte. Cyclic voltammetry was applied in the potential range between 0.4 and 1.1 V, using different scan rates from 10 to 200 mV s−1. Impedance spectra were recorded at open-circuit potential with an amplitude of the sinusoidal wave of 10 mV within a frequency ranging from 100 kHz to 10 mHz. Impedance results were used to calculate the diffusion coefficient based on eqn (3).51 All characterization results are given in the ESI,† Section 1.
 | (3) |
In eqn (3), D is the diffusion coefficient, T is the thermodynamic temperature, R is the gas constant, S is the electrode area, n is the number of electrons transferred, F is the Faraday constant, C is the ion concentration and σ is the Warburg coefficient as obtained from the linear fitting of the impedance data (Fig. 3), following the eqn (4).52 Here, Zre is the real part of the impedance, Rs is the series resistance, Rct is the charge transfer resistance and ω is the angular frequency.
| Zre = Rs + Rct + σω−1/2. | (4) |
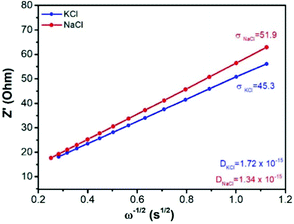 | ||
| Fig. 3 The real component of the impedance spectra as a function of frequency, and the corresponding Warburg coefficient and calculated effective diffusion coefficient in the Cu-PBA material. | ||
Fig. 3 shows the Warburg and diffusion coefficients calculated from the results of impedance spectroscopy. These values will be highly important in this study as a benchmark for the theoretical model predictions of the diffusion rates.
Literature data
For a deeper discussion of cesium ion adsorption, the modeling predictions in this work were validated against also data obtained from the literature. We have selected results from studies offering data for cesium ion adsorption at different defect densities. All data from these studies were extracted using the WebPlotDigitizer53 software.Results and discussion
Defining the ladder mechanism
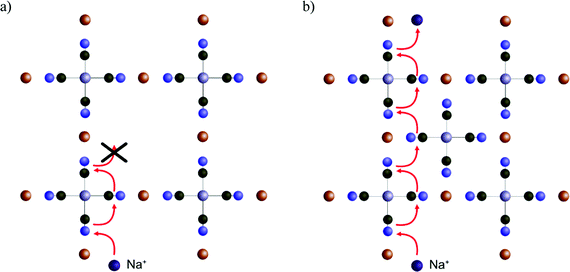
Before investigating the more extreme case of Cs+ intercalation, let us have a look at the core transport principles of smaller cations in PB materials. Electrostatic opposites attract each other, and thus the cations will be drawn to the negatively charged CN-groups and will be repelled by the positively charged M/M′-type ions of the host framework (e.g. Fe3+ and Fe2+). This, together with the ion size, will determine the energy landscape of the cations at various positions in the voids of the host crystal structure.Fig. 4 shows an energy scan for the PB containing a central vacancy. Because of the electrostatic attraction of opposites, it is energetically favorable for Na+ and K+ to reside closer to the inner wall with CN− groups. In contrast, the vacant unit cell center represents a much less favorable pathway, since the cation would have to be moved away from the negative groups. Notably, this energy is so high that the diffusion rate through the vacant regions will be lower by several orders of magnitude, effectively blocking that pathway. Here, the four cyanide groups surrounding a face form a frame, and the face is impervious if any of the cyanide groups will be missing. This means a cation diffuses through the crystal by climbing along with the “intact” frames. In recent work, we have defined this concept as a ladder mechanism.36 In analogy, a ladder is broken if either a step or side rail is missing.
The bottleneck of diffusive transport
However, we can go further by looking at three possible variants of cation transport. The variants above form two extremes in terms of energy, with the ion moving diagonally close to the cyanide groups (Diagonal, Table 1) or passing close to the vacancy (Vacant, Table 1). The intermediary option represents a passage through a unit cell without a central vacancy, characterized by intact frames on all sides (Enclosed, Table 1). Because the cation energy is lower close to the cyanide groups, we would expect that a cation that is surrounded by cyanide groups on all sides would be stabilized and yield lower overall energy at the center. Indeed, the simulations indicate that the required energy for a diagonal transition is higher if there is no central vacancy. This shows that the energy-well formed at the interstitial site retards the diffusion process (Table 1).| Method | Transition | Barrier (kcal mol−1) | Diffusion (cm2 s−1) |
|---|---|---|---|
| Theory | Diagonal | 7.4 | 4.20 × 10⁻¹¹ |
| Enclosed | 15.8 | 3.30 × 10⁻¹⁵ | |
| Vacant | 34.5 | 4.60 × 10⁻²⁹ | |
| Experiment | 1.72 × 10⁻¹⁵ |
Normally, we would expect the pathway with the lowest energy barrier to be the primary pathway for transport. That would mean that the diffusion constant of the system can be properly described by this lowest energy barrier. However, comparisons with experimental data suggest that the effective diffusion constant actually corresponds to the intermediary transport option. While the diagonal transitions close to a vacancy are faster, this suggests that ion transport in a unit cell without a central vacancy essentially represents a bottleneck.
This result makes sense when considering the ladder pathway in unit cells with or without a central vacancy (Fig. 5). There is a structural and compositional limitation to how the defects can look because PB is formed from cations M (e.g. Fe3+) and complexes M′(CN)6 (e.g. Fe(CN)6). Thus, an ion diffusing deeper into the crystal will eventually face a problem. It is always possible to pass diagonally between faces around a single Fe(CN)6 unit, but a passage between the faces of two different Fe(CN)6 units will be energetically less favorable. The only way such a transition can occur without the presence of a vacancy nearby is if the groups are oriented such that they enclose a cavity on all sides. Therefore, the pathway through the enclosed interstitial sites becomes the bottleneck for ion diffusion.
The trend for larger cations
What happens to the diffusion rates and pathways as the cations become larger? To start, we can again consider the energy levels of Na+ and K+ in the unit cell voids. For the smaller Na+ ion, the position with the lowest energy can be found in the middle of the frame. However, there are also other local energy minima along the pathway from frame to frame. K+ is larger than Na+, and the main effect of this is that the position of the central minimum for K+ is shifted further towards the open vacancy. Also, the energy level near the center is lower. On the one hand, this indicates that the tight frame has become less favorable, while on the other hand, this also shows that the larger K+ ion can benefit from the electrostatic support from all surrounding cyanide groups.Electrostatic opposites attract, and the same trends appear for monovalent cations of all sizes. As the ions get larger, the diffusion becomes slower, and the energetically favorable intercalation position resides closer to the vacancy (Fig. 6). However, even the larger Cs+ ion experiences the electrostatic pull from the cyanide groups. This places its favorable intercalation position closer to the wall than the central vacancy. As a consequence, the shift raises a question about the primary transport pathway of Cs+ in comparison with the smaller cations. Is the most favorable transport pathway for Cs+ to move away from the negatively charged frame groups and pass near the vacancy? Or is it more favorable to become stationary to retain its low-energy position? Or is it more favorable for Cs+ to pass via the frames and enclosed interstitial sites?
Qualitative mechanism of Cs+ transport
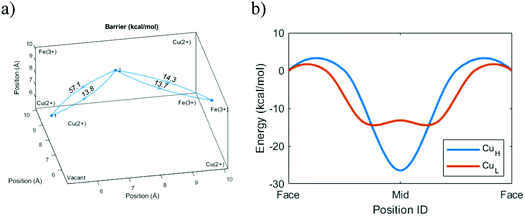
The void energy scan for Cs+ shows that the energy required for passing near the central vacancy is much higher than the energy for passing between frames to an adjacent cavity. There is thus no fundamental difference between Cs+ and the smaller ions. Negative still electrostatically attracts positive, and for this reason, it is unfavorable for Cs+ to move away from the cyanide groups into the vacant regions. Despite its size, the attraction to the cyanide groups means that passing between frames is still a viable pathway of diffusion.However, the previous sections have shown that a diffusing ion that avoids the vacancy must pass through enclosed cavities. Following the energy landscapes shown in Fig. 6(b), the larger ions tend to intercalate farther out into the cavity and experience the interaction from more cyanide groups on all sides. Thus, we would expect that Cs+ requires much more energy to pass out of an enclosed cavity than an open one. The simulations verify that this is the case and the energy required in the enclosed case is much higher (Fig. 7).
In summary, we have learned that there is no fundamental qualitative difference between monovalent ions of different sizes with respect to diffusion pathways. They can all be described in terms of the same ladder mechanism of ion transport, which predominantly arises from the coulombic interaction between the cations and the negatively charged groups in the host crystal structure matrix.
Quantitative behavior of Cs+ transport
Having learned that the same qualitative mechanism of diffusion can be applied to all monovalent cations, a natural question that arises is how the quantitative differences affect the practical applications. In the case of Na+ and K+, the interactions in the enclosed cavities stabilize the ions and thereby reduce the diffusion rates. However, the diffusion rates are still high enough to allow PB materials to exhibit good performance in applications where they are used as electrodes, including cycling between charging and discharging. Still, the trend is that the diffusion becomes slower the larger the cation. So, what are the effects of Cs+?The bottleneck of diffusion of Cs+ was noted to be the required energy of 27 kcal mol−1. Because the diffusion rate depends exponentially on the energy barrier, this corresponds to a much slower diffusion rate than, for instance, considering the 16 kcal mol−1 barrier of K+ diffusion. Specifically, the simulated diffusion rate for Cs+ is 3.3 × 10⁻²³ cm2 s−1. Considering the Einstein equation of diffusion54 (eqn (5)), the mean-squared distance a particle moves 〈x2〉 depends on the time t and the diffusion coefficient D. As a consequence, a Cs+ ion is expected move approximately 0.2 Å in a day inside a crystal of Cu-PBA. This would seemingly disqualify Cu-PBA for any application involving cesium cations. This conclusion agrees well with previously reported energy scans.34 Notably, previous studies have also reported that cesium can replace other cations in PBA due to its strong affinity for adsorption.55
| 〈x2〉 = 2Dt | (5) |
An interesting point here is thus that both major pathways retard diffusion. Missing cyanide groups in the structure become a bottleneck for diffusion in PBA by blocking transport pathways. Meanwhile, fully enclosed cavities trap the ions for energetic reasons. This effect can be observed for smaller cations as well, for which the route through an enclosed pathway becomes rate-limiting. The results highlight the importance of a smooth internal energy landscape for facile ion transport. Both high barriers and deep energy wells retard diffusion. Cesium experiences both types of detrimental effects, which limits the overall diffusion rate.
Adsorption of Cs+ as a surface phenomenon
There is a caveat that turns the previous conclusion around. The results mean that the PB crystal structure retards Cs+ from moving out of the cavity. However, the stabilizing effect only applies when the cations are already trapped inside and does not explicitly prevent them from moving into the cavity. In fact, the energy landscape scan shown in Fig. 7 highlights that a Cs+ ion coming from an open region experiences a relatively low energy barrier for entering into another cavity, even an enclosed one. This observation suggests that Cs+ adsorption under realistic timescales should mainly be regarded as a surface phenomenon (thus, adsorption rather than absorption).Earlier experimental results from the literature here work as a feasibility test. In one study, the authors used PB to passively adsorb Cs+ by the replacement of native K+ ions in the material. They found that the replacement of K+ was suppressed when the K+ concentration was high (few defects). By treating Cs+ adsorption as a surface effect, the total quantity of K+ that can be replaced should be capped by the available sites on the surface that Cs+ can access (Fig. 8). This trend agrees well with the experimental data under reasonable assumptions (see details in the Theory section above).
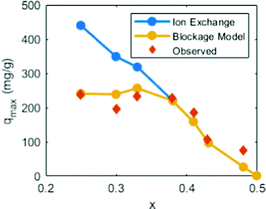 | ||
| Fig. 8 The passive substitution of K+ for Cs+ in Cu-PBA nanoparticles. Data from ref. 34 the ordinate shows the substitution quantity. The abscissa shows the vacancy concentration in the material, which refers to the structural composition K2−4xCu[Fe(CN)6]1−x. The blue curve (ion exchange) denotes the ideal maximum substitution if Cs+ replaces all K+. The red diamonds (observed) denote the experimentally observed replacements. The yellow curve (based on our blockage model) denotes the computed substitution based on the above described Cs+-blockage model. | ||
Another interesting experimental result is that many previous studies have used the Langmuir isotherm to describe the adsorption of cesium ions.26,56–58 The authors argue that the PBAs adsorb cesium ions via both physisorption and chemisorption, and therefore the replacement of potassium ions in the material is just one of the adsorption pathways. This makes sense from the perspective of the results shown in this work. If it is exceedingly difficult for Cs+ to migrate deeper into the PB-type materials, adsorption at the surface qualifies as the key mechanism. Thus, the results in this study indicate that the Langmuir isotherm could be a relevant modeling tool for this type of adsorption, both experimentally and theoretically.
In summary, molecular and macroscopic results verify the applicability of the ladder mechanism of transport for all cations, both qualitatively and quantitatively. As the forces arise from fundamental coulombic interactions, the qualitative mechanism remains the same. Since the practical timescale is limited, the quantitative differences will make slow diffusion appear like a surface interaction.
Sensitivity analysis
In a theoretical study, it is always important to question how reliable the results are and how changes in the modeling conditions may affect the general conclusions of the work. To begin with, the quantum-chemical approach used in this work yields excellent predictions of fundamental properties, such as the diffusion and migration rates of sodium ions in water. This works as a sensible calibration indicating that the calculations are reasonably accurate.In this work, we did not account for changes in PBA lattice size during electrochemical charging. However, the maximal change in size is only around 1%, and the model correctly predicts the experimental trend for increasing cation size due to charging. Also, the change in energies from using different unit cell sizes is minor and does not change any of the conclusions. In fact, the difference in energy for the transition paths is huge (Fig. 7), and therefore it is unlikely that any random noise of low magnitude arising from unit cell variations could change any of the main conclusions. Aside from investigating the sensitivity of the model system, we have also probed the predicted results (such as those shown in Fig. 4) against experimental X-ray diffraction (XRD) results in the literature to validate the model used, as mentioned previously.
Experiments aiming at the ion diffusion rates in PBAs have given results that vary in several orders of magnitude even for the same material composition. For instance, the vacancy content and purity of the material can significantly influence effective diffusion. Also, the predicted diffusion rate depends exponentially on the activation energy, which risks inflating the errors. Still, the predictions yielded theoretical results close to the reported experimental results. more important, the difference in energy between different transition modes is quite much larger than any random variation. That is, for transitions near a vacancy, through an enclosed cavity, or an open diagonal transition, the difference in diffusion constant is so large that the conclusions are reliable irrespective of small errors. Hence, the ladder mechanism is reliable for cation systems studied in this work.
For the macroscopic modeling of Cs+ adsorption as a surface phenomenon, the assumptions made will have a strong impact on the predicted results. For instance, the size distribution of the nanoparticles has a dramatic impact on the surface-to-volume ratio. Also, the morphology of the nanoparticle surface on the nanoscale, as well as the vacancy structure on the surface, will affect how large the effective nanoparticle surface is. Thus, many factors influence the material volume the Cs+ can access from the surface. On the other hand, the predicted trend agrees remarkably well with the experimental results. We also note that any representative nanoparticle size in the experimentally observed range of 20–40 nm yields a result in good comparison with experimental data. Still, the main point of this section is to demonstrate that the ladder mechanism of cation diffusion is compatible with macroscopically determined experimental results.
Conclusions
This study has demonstrated that a ladder mechanism for cation diffusion can be applied to all monovalent alkali metal cations in PBAs. The vacant regions are always impervious regarding diffusion, even for the large Cs+, and the cations instead migrate by climbing between frames (faces surrounded by negatively charged cyanide groups). In analogy, a ladder is broken if either a step or the railing is missing. In analogy, the frame becomes a bottleneck if any of the cyanide groups are missing. Also, cavities fully enclosed with cyanide groups energetically stabilize the cations from all sides and therefore significantly retards diffusion as well through energetical trapping. Because all ionic transport must follow at least one of these possible pathways, the transport through an enclosed cavity becomes rate-limiting.Even if the same mechanism of cation diffusion can be applied, the quantitative difference in diffusion rates causes the huge Cs+ ion to become stuck in enclosed cavities. However, it can still enter such a cavity via an open region, and therefore we can conclude that Cs+ adsorption is predominantly a surface effect.
Conflicts of interest
There are no conflicts of interest to declare.Acknowledgements
J. N. would like to thank the Swedish research council (Diary No. 2018-05387), J. Gust. Richert foundation (Diary No. 2020-00584), and the MISTRA Terraclean project (Diary No. 2015/31) for funding the work. E. T. thanks the National Research and Development Agency of Chile – ANID (former CONICYT) for the Doctoral scholarship “Beca Chile” 2018-72190682. Also, we thank SNIC PDC supercomputing center (PDC-2021-9) for providing computing resources. Finally, J. N. sincerely thanks the support team at PDC for their excellent advice and quick response times.References
- A. Kraft, Bull. Hist. Chem., 2014, 39, 18–25 CAS
.
-
M. J.-P. Muñoz and E. C. Martínez, Prussian Blue Based Batteries, Springer, Cham, 2018, vol. 3 Search PubMed
.
- H. Yi, R. Qin, S. Ding, Y. Wang, S. Li, Q. Zhao and F. Pan, Adv. Funct. Mater., 2021, 31, 2006970 CrossRef CAS
.
- S. Porada, R. Zhao, A. Van Der Wal, V. Presser and P. M. Biesheuvel, Prog. Mater. Sci., 2013, 58, 1388–1442 CrossRef CAS
.
- M. E. Suss, S. Porada, X. Sun, P. M. Biesheuvel, J. Yoon and V. Presser, Energy Environ. Sci., 2015, 8, 2296–2319 RSC
.
- J. Choi, P. Dorji, H. K. Shon and S. Hong, Desalination, 2019, 449, 118–130 CrossRef CAS
.
- A. Kalfa, B. Shapira, A. Shopin, I. Cohen, E. Avraham and D. Aurbach, Chemosphere, 2020, 241, 125003 CrossRef CAS PubMed
.
- C. Zhong, Y. Deng, W. Hu, J. Qiao, L. Zhang and J. Zhang, Chem. Soc. Rev., 2015, 44, 7484–7539 RSC
.
- A. Hemmatifar, M. Stadermann and J. G. Santiago, J. Phys. Chem. C, 2015, 119, 24681–24694 CrossRef CAS
.
- X. Zhang and J. Dutta, ACS Appl. Energy Mater., 2021, 4, 8275–8284 CrossRef CAS
.
- W. Tang, J. Liang, D. He, J. Gong, L. Tang, Z. Liu, D. Wang and G. Zeng, Water Res., 2019, 150, 225–251 CrossRef CAS
.
- X. Zhao, H. Wei, H. Zhao, Y. Wang and N. Tang, J. Electroanal. Chem., 2020, 873, 114416 CrossRef CAS
.
- E. Toledo-Carrillo, X. Zhang, K. Laxman and J. Dutta, Electrochim. Acta, 2020, 358, 136939 CrossRef CAS
.
- J. Nordstrand and J. Dutta, J. Phys. Chem. C, 2019, 123, 16479–16485 CrossRef CAS
.
- J. Nordstrand and J. Dutta, Langmuir, 2020, 36, 8476–8484 CrossRef CAS
.
- J. Nordstrand and J. Dutta, Langmuir, 2020, 36, 1338–1344 CrossRef CAS PubMed
.
- J. Nordstrand and J. Dutta, Physics, 2020, 2, 309–324 CrossRef
.
- S. Ahualli and G. R. Iglesias, Interface Sci. Technol., 2018, 24, 169–192 CAS
.
- P. K. Thallapally, R. K. Motkuri, C. A. Fernandez, B. P. McGrail and G. S. Behrooz, Inorg. Chem., 2010, 49, 4909–4915 CrossRef CAS PubMed
.
- C. Zhao, B. Liu, X. Li, K. Zhu, R. Hu, Z. Ao and J. Wang, Chem. Commun., 2019, 55, 7151–7154 RSC
.
- A. A. Karyakin, Electroanalysis, 2001, 13, 813–819 CrossRef CAS
.
- C. R. Patra, Nanomedicine, 2016, 11, 569–572 CrossRef CAS PubMed
.
- Z. Qin, Y. Li and N. Gu, Adv. Healthcare Mater., 2018, 7, 1–13 Search PubMed
.
- D. Parajuli, A. Kitajima, A. Takahashi, H. Tanaka, H. Ogawa, Y. Hakuta, K. Yoshino, T. Funahashi, M. Yamaguchi, M. Osada and T. Kawamoto, J. Environ. Radioact., 2016, 151, 233–237 CrossRef CAS
.
- C. Vincent, Y. Barré, T. Vincent, J. M. Taulemesse, M. Robitzer and E. Guibal, J. Hazard. Mater., 2015, 287, 171–179 CrossRef CAS PubMed
.
- G. R. Chen, Y. R. Chang, X. Liu, T. Kawamoto, H. Tanaka, A. Kitajima, D. Parajuli, M. Takasaki, K. Yoshino, M. L. Chen, Y. K. Lo, Z. Lei and D. J. Lee, Sep. Purif. Technol., 2015, 143, 146–151 CrossRef CAS
.
- S. C. Jang, Y. Haldorai, G. W. Lee, S. K. Hwang, Y. K. Han, C. Roh and Y. S. Huh, Sci. Rep., 2015, 5, 1–10 Search PubMed
.
- J. Wang, S. Zhuang and Y. Liu, Coord. Chem. Rev., 2018, 374, 430–438 CrossRef CAS
.
- S. Kjeldgaard, I. Dugulan, A. Mamakhel, M. Wagemaker, B. B. Iversen and A. Bentien, R. Soc. Open Sci., 2021, 8, 201779 CrossRef CAS PubMed
.
- F. S. Hegner, J. R. Galán-Mascarós and N. López, Inorg. Chem., 2016, 55, 12851–12862 CrossRef CAS
.
- S. Vafakhah, L. Guo, D. Sriramulu, S. Huang, M. Saeedikhani and H. Y. Yang, ACS Appl. Mater. Interfaces, 2019, 11, 5989–5998 CrossRef CAS PubMed
.
- G. Du and H. Pang, Energy Storage Mater., 2021, 36, 387–408 CrossRef
.
- A. Simonov, T. De Baerdemaeker, H. L.-B. Boström, M. L. Ríos Gómez, H. J. Gray, D. Chernyshov, A. Bosak, H. B. Bürgi and A. L. Goodwin, Nature, 2020, 578, 256–260 CrossRef CAS PubMed
.
- A. Takahashi, H. Tanaka, K. Minami, K. Noda, M. Ishizaki, M. Kurihara, H. Ogawa and T. Kawamoto, RSC Adv., 2018, 8, 34808–34816 RSC
.
- M. Qin, W. Ren, R. Jiang, Q. Li, X. Yao, S. Wang, Y. You and L. Mai, ACS Appl. Mater. Interfaces, 2021, 13, 3999–4007 CrossRef CAS PubMed
.
- J. Nordstrand, E. Toledo-carrillo, S. Vafakhah, L. Guo, H. Y. Yang and J. Dutta, ACS Appl. Mater. Interfaces, 2022, 14(1), 1102–1113 CrossRef CAS PubMed
.
- J. Nordstrand and J. Dutta, npj Clean Water, 2021, 4, 1–7 CrossRef
.
- J. Nordstrand and J. Dutta, J. Electrochem. Soc., 2021, 168, 013502 CrossRef CAS
.
- J. Nordstrand, K. Laxman, M. T.-Z. Myint and J. Dutta, J. Phys. Chem. A, 2019, 123, 6628–6634 CrossRef CAS PubMed
.
- H. K. Mutha, H. J. Cho, M. Hashempour, B. L. Wardle, C. V. Thompson and E. N. Wang, Desalination, 2018, 437, 154–163 CrossRef CAS
.
-
J. Nordstrand and D. Joydeep, COMSOL Conference 2020 Grenoble, COMSOL, Grenoble, 2020 Search PubMed
.
- W. Xiaobing, L. Jinqiu, L. Yang, L. Sen, L. Dong, M. Tingting, J. An, H. Yanshe and G. Fengwei, Water, Air, Soil Pollut., 2021, 232, 1–10 CrossRef
.
- C. Bannwarth, E. Caldeweyher, S. Ehlert, A. Hansen, P. Pracht, J. Seibert, S. Spicher and S. Grimme, Wiley Interdiscip. Rev.: Comput. Mol. Sci., 2021, 11, 1–49 Search PubMed
.
- C. Bannwarth, S. Ehlert and S. Grimme, J. Chem. Theory Comput., 2019, 15, 1652–1671 CrossRef CAS PubMed
.
- S. Spicher and S. Grimme, Angew. Chem., Int. Ed., 2020, 59, 15665–15673 CrossRef CAS PubMed
.
- Grimme group, xTB Documentation, https://xtb-docs.readthedocs.io/en/latest/setup.html, (accessed 22 April 2022).
- S. Grimme, C. Bannwarth and P. Shushkov, J. Chem. Theory Comput., 2017, 13, 1989–2009 CrossRef CAS PubMed
.
- M. Nastar and V. Barbe, Faraday Discuss., 2007, 134, 331–342 RSC
.
- L. T. Kong and L. J. Lewis, Phys. Rev. B: Condens. Matter Mater. Phys., 2006, 74, 1–4 CrossRef
.
- T. Schuler, L. Messina and M. Nastar, Comput. Mater. Sci., 2020, 172, 109191 CrossRef CAS
.
- Y. You, X. L. Wu, Y. X. Yin and Y. G. Guo, Energy Environ. Sci., 2014, 7, 1643–1647 RSC
.
- Y. Huang, M. Xie, Z. Wang, Y. Jiang, Y. Yao, S. Li, Z. Li, L. Li, F. Wu and R. Chen, Small, 2018, 14, 1–10 Search PubMed
.
- A. Rohatgi, WebPlotDigitizer, https://arohatgi.info/WebPlotDigitizer%0D, (accessed 30 November 2021).
-
H. C. Berg, Random Walks in Biology, Princeton University Press, New Jersey, 2018 Search PubMed
.
- A. K. Vipin, B. Fugetsu, I. Sakata, A. Isogai, M. Endo, M. Li and M. S. Dresselhaus, Sci. Rep., 2016, 6, 1–14 CrossRef PubMed
.
- H. A. Alamudy and K. Cho, Chem. Eng. J., 2018, 349, 595–602 CrossRef CAS
.
- J. Huo, G. Yu and J. Wang, Sci. Total Environ., 2021, 761, 143286 CrossRef CAS PubMed
.
- I. Lee, C. W. Park, S. S. Yoon and H. M. Yang, Chemosphere, 2019, 224, 776–785 CrossRef CAS PubMed
.
Footnote |
| † Electronic supplementary information (ESI) available: Scanning microscope images for the CuPB (Fig. S1); FTIR spectrum of CuPB (Fig. S2); cyclic voltammogram of CuPB (Fig. S3). See DOI: https://doi.org/10.1039/d2cp01156e |
| This journal is © the Owner Societies 2022 |

