 Open Access Article
Creative Commons Attribution 3.0 Unported Licence
Pre-Dewar structure modulates protonated azaindole photodynamics†
Ritam
Mansour
 a,
Saikat
Mukherjee
 *a,
Max
Pinheiro
Jr.
 a,
Jennifer A.
Noble
 b,
Christophe
Jouvet
 b and
Mario
Barbatti
 *ac
*ac
aAix Marseille University, CNRS, ICR, Marseille, France. E-mail: saikat.mukherjee@univ-amu.fr
bAix-Marseille University, CNRS, PIIM, Marseille, France
cInstitut Universitaire de France, 75231 Paris, France. E-mail: mario.barbatti@univ-amu.fr
First published on 6th May 2022
Abstract
Recent experimental work revealed that the lifetime of the S3 state of protonated 7-azaindole is about ten times longer than that of protonated 6-azaindole. We simulated the nonradiative decay pathways of these molecules using trajectory surface hopping dynamics after photoexcitation into S3 to elucidate the reason for this difference. Both isomers mainly follow a common ππ* relaxation pathway involving multiple state crossings while coming down from S3 to S1 in the subpicosecond time scale. However, the simulations reveal that the excited-state topographies are such that while the 6-isomer can easily access the region of nonadiabatic transitions, the internal conversion of the 7-isomer is delayed by a pre-Dewar bond formation with a boat conformation.
Introduction
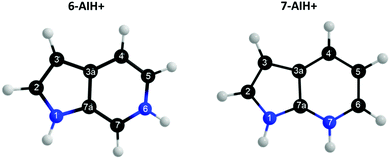
Azaindoles are hetero-bicyclic aromatic organic compounds consisting of a pyrrole ring fused to a pyridine ring. Being structurally different from indoles only by one additional nitrogen in the 6-membered pyridine ring, the azaindole moiety exhibits interesting biochemical and pharmacological activities.1,2 Scientists identified that methylated azaindole chromophores could serve as blue or even green fluorescence protein markers.3 Among various structural isomers of n-azaindole, 7-azaindole derivatives (see Fig. 1 for the atom numbering) are excellent blue emitters for organic light-emitting diodes (OLEDs).4Although one can find a handful of articles on 7-azaindole as an isolated monomer,5–8 in dimeric forms5,9–13 and in water and alcohol clusters,11,14–20 only one recent article21 to date shed light upon the photophysical relaxation mechanism of n-azaindole molecules by studying gas-phase excited-state dynamics. Experiments and theoretical calculations have also been devoted16,18,22–24 to understanding the excited-state proton transfer and tautomerization mechanism of 7-azaindole with solvent molecules. On the other hand, very recently, Noble et al. performed25 photo-fragmentation spectroscopy on the protonated n-azaindole isomers (n-AIH+, n = 5, 6, 7) to explore the role of the n-nitrogen atom position in photodynamics. From the spectral line widths, they estimated the excited-state lifetimes (τ = ℏ/δE) tabulated in Table 2 and proposed different decay mechanisms for the isomers. Surprisingly, the lifetime of the S3 state in 7-AIH+ is almost ten times larger than that of 6-AIH+.
| 5-AIH+ | 6-AIH+ | 7-AIH+ | ||
|---|---|---|---|---|
| S1 | δE (cm−1) | <10 | <10 | <10 |
| τ (fs) | >∼530 | >∼530 | >∼530 | |
| S2 | δE (cm−1) | 280 | 115 | Not visible |
| τ (fs) | ∼20 | ∼50 | ||
| S3 | δE (cm−1) | Not probed | 230 | 23 |
| τ (fs) | ∼25 | ∼230 |
| 6-AIH+ | 7-AIH+ | |||||||
|---|---|---|---|---|---|---|---|---|
| Geom. | ΔE0/eV | ΔE1/eV [f10] | ΔE2/eV [f20] | ΔE3/eV [f30] | ΔE0/eV | ΔE1/eV [f10] | ΔE2/eV [f20] | ΔE3/eV [f30] |
| S0 min | 0.00 | 3.95 [0.12] | 5.01 [0.05] | 5.77 [0.48] | 0.00 | 3.97 [0.03] | 4.55 [0.17] | 5.87 [0.54] |
| S1 min | 0.34 | 3.66 [0.11] (3.61) | 5.17 [0.02] | 5.83 [0.52] | 0.70 | 3.45 [0.03] (3.50) | 4.91 [0.12] | 5.97 [0.46] |
| S2 min | 0.86 | 4.48 [0.11] | 4.84 [0.11] (4.67) | 6.30 [0.15] | 0.41 | 4.06 [0.03] | 4.30 [0.20] (4.41) | 6.14 [0.24] |
| S3 min | 0.21 | 3.92 [0.1] | 4.97 [0.02] | 5.55 [0.44] (5.43) | 0.52 | 3.97 [0.02] | 4.76 [0.04] | 5.47 [0.53] (5.47) |
| S3/S2 X | 2.59 | 5.99 [0.03] | 6.83 [0.04] | 6.85 [0.27] | 2.34 | 4.99 [0.01] | 5.99 [0.02] | 6.01 [0.20] |
| S2/S1 X | 1.22 | 4.84 [0.04] | 4.86 [0.24] | 6.56 [0.02] | 0.53 | 4.31 [0.03] | 4.32 [0.21] | 6.28 [0.15] |
This paper aims to elucidate the disparity of excited-state lifetimes between 6- and 7-protonated azaindoles (6/7-AIH+) using trajectory surface hopping (TSH) simulations.26 TSH is a well-known and efficient way of simulating excited-state dynamics, where the nuclear wavepacket on an electronic state is represented by a swarm of independent trajectories classically propagating the nuclear degrees of freedom, and the negative energy gradient of the corresponding electronic state serves as the force acting on the nuclei. A stochastic process dictates whether the trajectory will propagate on the current electronic state or hop to another one at each time step. Such a state switch mainly occurs in regions of strong nonadiabatic coupling. Among various strategies to compute hopping probabilities, we adopted the decoherence-corrected27 fewest switches surface hopping28 (DC-FSSH) algorithm, probably the most common and extensively reviewed in literature.29 Despite a few shortcomings, an ensemble of independent DC-FSSH trajectories is expected to provide a reasonable semi-quantitative description of a photodynamic process in the sub-picosecond timescale.
Computational methods
The ground state geometry optimization followed by normal-mode analysis for both protonated species, 6- and 7-AIH+, was performed with Møller–Plesset perturbation theory to the second-order (MP2) with the aug-cc-pVDZ basis set.30,31 The excited states were calculated with the resolution-of-identity algebraic diagrammatic construction to the second-order (RI-ADC(2))32,33 with the same basis set. The electronic structure calculations were carried out with Turbomole (version 7.3).34,35 The geometries of the intersections between the excited states S3/S2 and S2/S1 were located using the penalty function method implemented in the Conical Intersection Optimizer (CIOpt) program36,37 and adapted by us to work with Turbomole.Five hundred initial conditions were sampled from a harmonic oscillator Wigner distribution38,39 using the ground-state geometry and normal modes. The absorption spectra into eight excited states for both species were simulated40 for these initial conditions (see Fig. S1 in the ESI†). For 6-AIH+, we have chosen 60 initial conditions in the energy window 5.5 ± 0.2 eV to start trajectories in the S3 state (ESI,† SI-1). For 7-AIH+, we selected 84 initial conditions in the same energy window, to start trajectories also in S3.
The DC-FSSH dynamics were employed to simulate the nonadiabatic relaxation process for both molecules. We have included four singlet electronic states (including the ground state, S0) calculated at ADC(2)/aug-cc-pVDZ level of theory in the direct dynamics simulation. The trajectories were launched from the bright S3 state and propagated up to 1000 fs for both molecules. The classical equations of motion were integrated with a 0.5 fs time step using the velocity Verlet algorithm, whereas the locally-approximated time-dependent Schrödinger equations were integrated with 0.025 fs using interpolated electronic quantities between classical steps. Energy-based decoherence corrections were applied with the simplified decay of mixing approach with the parameter α set to 0.1 a.u. Time-derivative couplings between excited states were calculated with the Hammes–Schiffer and Tully approach41 using the determinant derivative approach.42 After a successful hop, the energy was balanced by rescaling the nuclear velocity in the direction of the momentum vector. In the case of frustrated hopping, the momentum direction was not changed. DC-FSSH was employed to evaluate hoppings between excited states only. Due to the limitation of ADC(2) to describe the multireference character of the S1/S0 crossing, whenever the energy gap between these states dropped to below 0.15 eV, the trajectory propagation was ended, and we assumed the molecule returned to the ground state.
The initial conditions sampling, absorption spectra calculations, and DC-FSSH simulations were carried out with Newton-X (version 2.2 build 12)43 interfaced with Turbomole. The dataset of all the trajectories44 and processed data45 for each azaindole isomer are available to download.
Results
Excited-state topography
We optimized the geometries of the ground- (S0) and excited-state (S1 to S3) minima and the S3/S2 and S2/S1 intersections of 6- and 7-AIH+. The results are shown in Table 2 and Fig. 2. The excitation character of the electronic states and molecular orbitals associated with the corresponding excitation are presented in the SI-2 and SI-3 (ESI†). Cartesian coordinates of all structures are also given in the ESI.†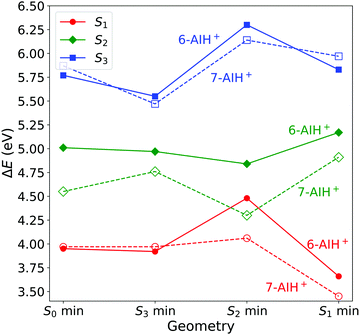 | ||
| Fig. 2 Excitation energies at the minima of the S0 to S3 states computed with ADC(2)/aug-cc-pVDZ. All values are relative to the ground state minimum. | ||
At the ground state minimum of both the molecules, S3 is a bright state with ππ* character. At the S3 minimum, the energy gap to S2 is 0.58 eV for 6-AIH+ and 0.71 eV for 7-AIH+. After populating S2, both molecules should relax toward the S2 minimum. There, the energy gap to S1 is 0.36 eV for 6-AIH+ and 0.24 eV for 7-AIH+. At the S1 minimum, the energy gaps to S0 are 3.32 and 2.75 eV for 6- and 7-AIH+, respectively. The S3/S2 intersection is 1.28 eV higher than the S3 minimum in 6-AIH+ but only 0.5 eV higher in 7-AIH+. In S2, the S2/S1 intersections lie very close to their corresponding S2 minimum for both isomers.
These topographic features do not deliver any indication of why the S3 lifetime is much shorter in 6-AIH+ than in 7-AIH+.
Dynamics
Next, we will describe the outcomes from the DC-FSSH dynamics. Fig. 3 depicts the evolution of the adiabatic population for both species. We fitted the S3 population of 6-AIH+ with the exponential decay function| f(t) = e−t/τ | (1) |
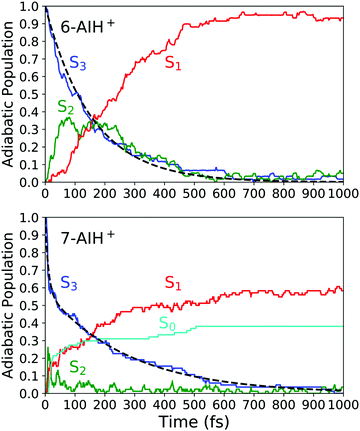 | ||
| Fig. 3 Adiabatic population evolution calculated with ADC(2)/aug-cc-pVDZ for 6-AIH+ (top) and 7-AIH+ (bottom). The dashed line indicates the S3 population fitting. | ||
For 7-AIH+, eqn (1) did not fit the population well, and we needed a second exponential component,
 | (2) |
Later we discuss that this component is due to dissociative trajectories occurring only for 7-AIH+. The results of the fitting are summarized in Table 3. The margins of error were computed for a 95% confidence interval.
| A | τ′ (fs) | τ (fs) | |
|---|---|---|---|
| 6-AIH+ | — | — | 156 ± 40 (∼25) |
| 7-AIH+ | 0.58 | 11 | 278 ± 36 (∼230) |
After excitation into the S3 state, both molecules undergo internal conversion to S2 and, then, to S1 in the sub-ps time scale. In 6-AIH+, the S3 state deactivates within 156 ± 40 fs, while this process takes longer in 7-AIH+, 278 ± 36 fs. 7-AIH+ also shows partial internal conversion to S0 within this time (Fig. 3).
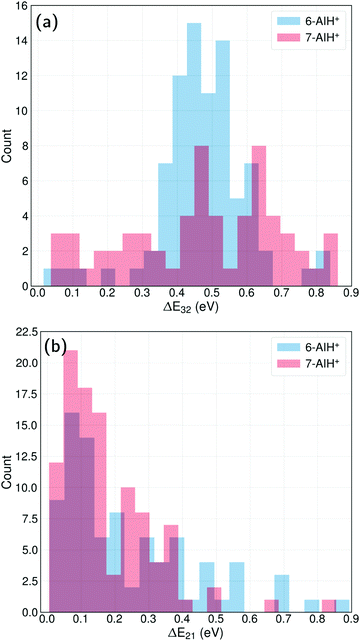
The energy-gap distributions at the hopping time are shown in Fig. 4 for S3 → S2 and S2 → S1 transitions. The hoppings from S3 to S2 (top) are distributed around a relatively large energy gap for both molecules. The distribution follows approximately a Gaussian shape centered around a mean value of 0.47 eV for both 6- and 7-AIH+, respectively, while the standard deviation is 0.13 eV for 6-AIH+ and 0.22 eV for 7-isomer. These gap distributions are due to the large energies of the S3/S2 intersections compared to the S3 minimum (see Table 2). On the other hand, the energy gap histogram for S2 → S1 hoppings resembles an exponential distribution (Fig. 4-bottom). For 6-AIH+, the mean value and standard deviations are 0.23 and 0.20 eV, while for 7-AIH+, they are 0.17 and 0.14 eV.
In the case of the S3 → S2 hoppings, the large energy gap distribution may seem incompatible with the short S3 state lifetimes. Nevertheless, although the S3/S2 intersection is not reached during dynamics, the S3/S2 energy gap remains relatively small. While 6-AIH+ is on S3, the mean S3/S2 gap is 0.60 eV with a 0.13 eV standard deviation. For 7-AIH+, the mean value is 0.76 eV, and the standard deviation is 0.19 eV. This energetic proximity between the S3 and S2 states during dynamics in S3 increases the number of timesteps where potentially a hopping can occur, compensating for the small probabilities. We discuss this aspect in detail in Section Hoppings at large energy gaps.
We also analyzed the state character at the hopping time by checking the density difference between the current and ground states (SI-4, ESI†). The result of this analysis is shown in Table 4.
| 6-AIH+ (%) | 7-AIH+ (%) | ||
|---|---|---|---|
| S3 → S2 | Only ππ* | 97 | 75 |
| At least one πσ* | 3 | 25 | |
| S2 → S1 | Only ππ* | 98 | 98 |
| At least one πσ* | 2 | 2 |
Discussion
Topography and dynamics
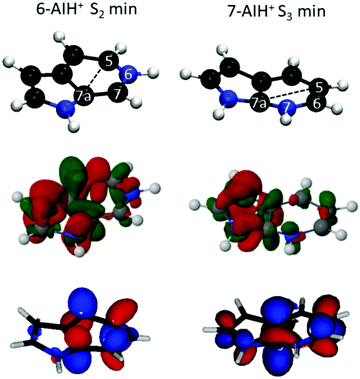
In the ground state, 6-AIH+ is perfectly planar, and it retains the planarity in the S1 and S3 state minima too. Nevertheless, its S2 state minimum is puckered with a boat distortion of the 6-membered ring, involving atoms C5 and C7a. Its Cremer–Pople Q parameter47 is 0.24 Å. (The Q parameter indicates the puckering intensity, with Q = 0 being a planar ring.) In turn, 7-AIH+ is planar in the ground state and puckered in the S3 excited state, also with a C5–C7a boat conformation (Q = 0.18 Å). This out-of-plane minimum is in good agreement with the experiment, which exhibits a low-frequency vibrational progression in S3 assigned to out-of-plane modes.25 The rings in the S1 and S2 minima are planar with the H atom attached with the 6-membered ring N atom is marginally out of the plane.The 6-AIH+ S2 minimum and 7-AIH+ S3 minimum have a boat conformation involving atoms C5 and C7a. Fig. 5 shows that these two atoms receive π-density and that the π* molecular orbital has an in-phase alignment across the ring. These features indicate that a pre-Dewar structure forms between C5 and C7a across the ring. Nevertheless, the puckering degree is too small to characterize it as a Dewar bond. The density differences in Fig. 5 reveal that these two atoms have more π density in 6- than in 7-AIH+, explaining why the puckered ππ* minimum is more stable in the former. This figure also shows that while the nitrogen atom in position 6 is an electron donor, it is an electron acceptor in position 7.
These potential energy surface (PES) topographies give rise to the following dynamics. After 6-AIH+ is vertically lifted to the S3 state, it relaxes to the planar S3 minimum within only 20 fs (Fig. 6, left). This fast relaxation is due to the geometric proximity between the S3 and S0 minima, which are only 0.03 Å apart, as measured by the root-mean-square deviation (RMSD) between them. Then, it undergoes S3 → S2 hopping within 156 fs. In S2, it relaxes to the puckered S2 minimum. The population accumulates there, growing up to 30% before it transfers to the S1 state within 300 fs. In the case of 7-AIH+, it relaxes to the S3 minimum within about 40 fs (Fig. 6, right). This minimum is located 0.19 Å from the S0 minimum. After that, the molecule takes longer to hop to S2, yielding an S3 lifetime of 268 fs. The population does not accumulate in S2, and it is immediately transferred to S1.
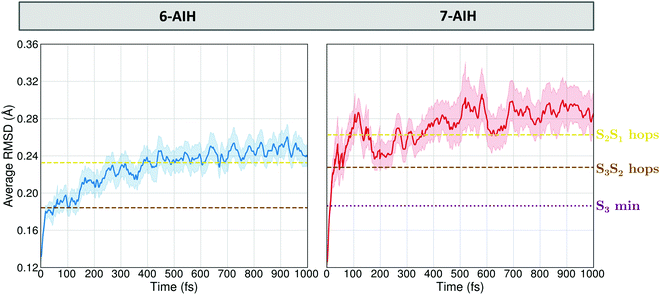 | ||
| Fig. 6 Time evolution of the average RMSD between the molecular geometries obtained during the dynamics simulation and the ground state reference configuration. | ||
In both molecules, the S3 → S2 hopping events take place at significant energy gaps, about ∼0.4 eV (Fig. 4-top) due to the high energy of the S3/S2 intersection. On the other hand, the S2 → S1 hopping energy gap peaks at ∼0.1 eV (Fig. 4-bottom) thanks to the more energetically favourable S2/S1 intersection being isoenergetic with the S2 minimum.
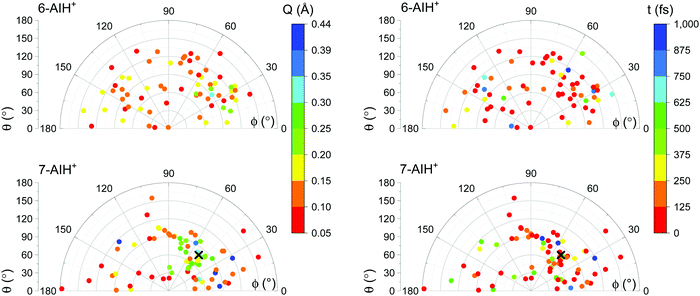
The S3 → S2 hopping geometries are characterized with the Cremer–Pople parameters47Q, θ, and ϕ. The parameters θ and ϕ describe the type of puckering the 6-membered ring undergoes. Q, as mentioned, indicates the puckering intensity. Fig. 7 shows that the S3 → S2 hoppings happen in the entire θ–ϕ space. Later we discuss how this distribution helps understand the S3 lifetimes of 6- and 7-AIH+.
7-AIH+ shows an additional feature not present in the dynamics of 6-AIH+. A fraction of 38% of 7-AIH+ trajectories quickly dissociates (11 fs), losing the hydrogen attached to the 5-membered ring. During this dissociation, the molecule returns to the ground state, forming the S0 population we can see in the bottom panel of Fig. 3.
S3 lifetimes
Before comparing the S3 lifetimes of the two molecules, we should consider the short time constant (11 fs; Table 3) we observed in 7-AIH+ simulations. As explained, this time constant is associated with dissociative trajectories, which must correspond to excitation to an unbound state. However, the experiments were done with a sharp excitation into the bound 0–0 S3 band origin.25 On the contrary, the initial conditions for dynamics were created with energy exceeding the 0–0 band due to software limitations (see SI-1, ESI†). Thus, when comparing theory to the experiments, we should only consider the long S3 lifetime predicted for 7-AIH+.If we bear these considerations in mind, the dynamics simulations predict a shorter S3 lifetime for 6-AIH+ (156 fs) than for 7-AIH+ (278 fs). The value for 7-AIH+ agrees well with the experimental measurement (∼230 fs). The one for 6-AIH+, however, is considerably longer than the experimental S3 lifetime, ∼25 fs. While comparing the simulated lifetimes with the experimental ones, the following points are need to be considered. The accuracy of such small lifetimes is limited by the accuracy of the quantum-chemical level, and small errors in the PESs cause disproportionally large relative errors in the lifetime description. Moreover, the experimental lifetimes are indirectly obtained from linewidths through the time-energy uncertainty relation. Thus, they are themselves subject to uncertainties in the linewidth definition, estimation and even which uncertainty-relation to adopt.48
The different S3 lifetimes of the two isomers mainly reflect the time for moving from the S3 minimum to the region of S3 → S2 hopping. As shown in Fig. 8, the S3 → S2 hopping geometries are farther away from the S3 minimum for 7-AIH+ than for 6-AIH+. This happens because the planar S3 minimum of 6-AIH+ provides easy access to the entire puckering conformational space, while the puckered pre-Dewar S3 minimum of 7-AIH+ does not. The Cremer–Pople puckering analysis of all points in S3 during the dynamics shows that the trajectories span the entire puckering space uniformly and with a small puckering degree in 6-AIH+, while they tend to cluster around the C5–C7a boat conformation with a more significant puckering degree in 7-AIH+ (ESI,† SI-7). These distributions are what we would expect for a motion around the S3 minimum of these two molecules, which is planar for 6-AIH+ and puckered (C5–C7a boat with Q = 0.18 Å, θ = 78°, and ϕ = 50°) for 7-AIH+.
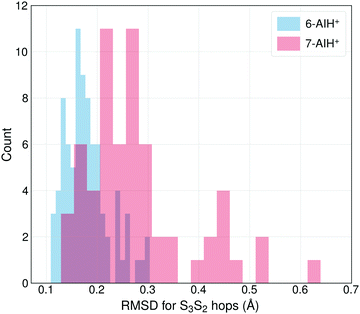 | ||
| Fig. 8 The distribution of the RMSDs for S3 → S2 hopping geometries, taking the S3 minimum geometry as the reference. | ||
As we have discussed, no specific coordinate causes the S3 → S2 hopping. They occur during the motion around the S3 minimum due to small but sizable probabilities resulting from the S2–S3 energetic proximity (as mentioned in Section Dynamics, the mean S3/S2 energy gap during S3 dynamics is 0.6 eV for 6-AIH+ and 0.8 eV for 7-AIH+). Nevertheless, we observed an insightful correlation between the S3 → S2 hopping and the puckering in the 7-AIH+ case. To reach the hopping region, 7-AIH+ (bottom-left graph in Fig. 7), which is clustered at low-puckered C5–C7a boat structures during the S3 dynamics, either needs to increase its puckering degree in this boat region or change the puckering conformation. Either way, these processes take time, delaying the internal conversion. For 6-AIH+ (top-left graph in Fig. 7), the hoppings tend to happen with slightly puckered geometries. (Note the dominance of red and orange points.) On the other hand, for 7-AIH+ (bottom-left graph in Fig. 7), there are many hoppings at strongly puckered geometries (green and blue points).
The internal conversion delaying effect of the pre-Dewar character is also present in the S2 → S1 transition, although less pronounced. In 6-AIH+, where the S2 minimum has the boat conformation, the population accumulates in S2 before transferring to S1 (Fig. 3-top). The hopping to S1 happens, on average, 140 fs after the hopping to S2. On the other hand, in 7-AIH+, which has a planar S2 minimum, the population is immediately transferred to S1, without accumulating in S2 (Fig. 3-bottom). The hopping to S1 happens on average only 38 fs after the hopping to S2. This very fast S2 deactivation should give rise to wide experimental bands when exciting the molecule in this state, helping to explain why the experiments are unable to clearly distinguish S2, as it was hidden in the higher energy part of S1.
The hypothesis that Dewar structures play a role in the S3 lifetime of 6- and 7-AIH+ had already been raised in ref. 25. However, in that paper, the discussion focused on Dewar bonds between atoms 4 and 7, while here, we see them between atoms 5 and 7a.
State character
As experimentally predicted, the dynamics of 6-AIH+ is entirely dominated by ππ* states. Both crossing states have ππ* character in 97% of the S3 → S2 hopping events (Table 4). Nevertheless, in the case of 7-AIH+, πσ* states play a minor but relevant role. During the S3 → S2 internal conversion, the trajectories contributing to the long time constant (278 fs) are split into 75% with ππ*/ππ* crossings and 25% with hoppings involving at least one πσ* state. The occurrence of πσ* states was always associated with elongation to the NH bond distance in the 5-membered ring.For both molecules (and considering only the non-dissociative trajectories of 7-AIH+), the S2 → S1 hopping is dominated by ππ*/ππ* crossings (98%). Naturally, the 7-AIH+ dissociative trajectories deactivate through hoppings involving πσ* states.
Hoppings at large energy gaps
The usual interpretation of surface hopping is that the hopping event happens at the state crossing. However, actual hoppings happen at small, non-null energy gaps, usually following (but not always) an exponential probability distribution. For example, in the case of ethylene's surface hopping dynamics reported in ref. 49, the S1 → S0 energy gap at the hopping time is exponentially distributed with a 0.5 eV mean value. In fulvene,50 the S1 → S0 energy gap at the hopping time is exponentially distributed with a 0.3 eV mean value.In AIH+, the energy gaps at the S2 → S1 hoppings also follow an exponential distribution, with a mean value of 0.23 eV for the 6-isomer and 0.14 eV for the 7-isomer. Nevertheless, the S3 → S2 hoppings do not follow an exponential distribution because the S3/S2 state intersection is not energetically accessible. The distribution peaks at a non-zero value for both molecules, implying that it should tend to a Gaussian probability function if the statistics are improved. As reported in Section Dynamics, the mean value is 0.47 eV in both cases.
At first sight, such a large mean energy gap may seem incompatible with the short S3-state lifetimes for 6- and 7-AIH+: 156 and 278 fs, respectively. However, the hopping probability values are not unexpectedly large. For 6-AIH+ in the S3 state, the hopping probabilities to S2 (considering only non-null values) are exponentially distributed with a mean value of 3 × 10⁻⁴ per sub-timestep (0.025 fs). For 7-AIH+, this value is 2 × 10⁻⁴ per sub-timestep.
The lifetime is short for such small probabilities because of the energetic proximity between S3 and S2. (Recall the mean energy gap during S3 dynamics is 0.6 and 0.8 eV for 6- and 7-AIH+, respectively.) These relatively small gaps increase the number of time steps where potentially a hopping can occur. For instance, 12% of the sub-timesteps of 7-AIH+ have a hopping probability bigger than 10−5. This situation contrasts with the typical S0/S1 transition through state intersections (like in ethylene49 or fulvene50), where internal conversion can occur only after the gap reduces enough to yield appreciable hopping probabilities.
Basis set effects
All results we reported in the previous sections were computed with the aug-cc-pVDZ basis set. Nevertheless, we have also used the cc-pVDZ basis set for fast, exploratory calculations. It may interest the readers to know the differences between these two sets of results. The main results are summarized in SI-5 (ESI†).The static excited-state topography obtained by using the cc-pVDZ basis set (SI-5, ESI† and Table 1) remains approximately the same as that obtained by using the augmented one. The results of dynamics are also qualitatively the same. However, the population profiles differ quantitatively when comparing the results of aug-cc-pVDZ (Fig. 3) and cc-pVDZ (SI-5, ESI†). With the smaller basis set, the S3 lifetime of 6-AIH+ decreases to 136 fs, whereas for 7-isomer it increases to 361 fs. Also, there are no dissociative trajectories for either isomer with this basis set, highlighting the importance of diffuse basis functions to describe the πσ* state.
In the cc-pVDZ calculation, hoppings between ππ* states are the primary pathways (92% in 6-AIH+ and 87% in 7-AIH+). In the few remaining cases, a πσ* was populated at the time of hopping, always close to a nearly dissociated structure.
Conclusions
We investigated the excited-state dynamics of 6- and 7-AIH+ starting from an S3 excitation, using potential energy surface characterization and surface hopping dynamics with the ADC(2) method. Our goal was to understand why the S3 lifetime of 6-AIH+ is significantly shorter than that of 7-AIH+.Our results show that the relevant difference between the excited states of the two molecules is the geometry of the S3 minimum. While in 6-AIH+, it is planar, and near the Franck-Condon region, in 7-AIH+, the 6-membered ring is puckered with a boat conformation. This boat conformation results from a pre-Dewar structure being formed between atoms C5 and C7a. This bond also occurs in 6-AIH+ (and is even stronger there) but in the S2 state.
The different lifetimes of the two molecules are due to the dynamic evolution between the time the molecules reach the S3 minimum and the time they convert to the S2 state. The S3 → S2 hopping can happen at the entire puckering space of the 6-membered ring, and the planar minimum of 6-AIH+ allows easy access to such conformations. In the case of 7-AIH+, with a pre-Dewar S3 minimum, access to S3 → S2 hopping region depends on either increasing the puckering degree of the boat conformation or moving away to some other puckering region. Both processes take time and elongate the S3 lifetime.
The internal conversion delay caused by the pre-Dewar minimum is also observed in the S2 → S1 transition but to a smaller extent. In this case, 6-AIH+ S2 minimum has a pre-Dewar character, and the hopping to S1 takes longer than in 7-AIH+ with a planar S2 minimum.
Conflicts of interest
There are no conflicts to declare.Acknowledgements
RM, SM, MP, and MB were financially supported by the European Union's Horizon 2020 research and innovation programme ERC Advanced Grant under grant agreement no. 832237 (project SubNano). They also acknowledge the Centre de Calcul Intensif d’Aix-Marseille for granting access to its high-performance computing resources. MB and CJ acknowledge funding from the Agence Nationale de la Recherche (ANR) under the WSPLIT project (ANR-17-CE05-0005-01). The authors thank Isaure Carvin for the discussions.References
- J. Merour and B. Joseph, Curr. Org. Chem., 2001, 5, 471–506 CrossRef CAS.
- D. R. Motati, R. Amaradhi and T. Ganesh, Org. Chem. Front., 2021, 8, 466–513 RSC.
- L. Merkel, M. G. Hoesl, M. Albrecht, A. Schmidt and N. Budisa, ChemBioChem, 2010, 11, 305–314 CrossRef CAS PubMed.
- S.-B. Zhao and S. Wang, Chem. Soc. Rev., 2010, 39, 3142–3156 RSC.
- L. Serrano-Andrés, M. Merchán, A. C. Borin and J. Stålring, Int. J. Quantum Chem., 2001, 84, 181–191 CrossRef.
- R. Brause, M. Schmitt, D. Spangenberg and K. Kleinermanns, Mol. Phys., 2004, 102, 1615–1623 CrossRef CAS.
- M. Schmitt, C. Ratzer, K. Kleinermanns and W. Meerts, Mol. Phys., 2004, 102, 1605 CrossRef CAS.
- S. Arulmozhiraja, M. L. Coote and J.-y Hasegawa, J. Chem. Phys., 2015, 143, 204304 CrossRef PubMed.
- K. Fuke and K. Kaya, J. Phys. Chem., 1989, 93, 614–621 CrossRef CAS.
- A. Douhal, S. K. Kim and A. H. Zewail, Nature, 1995, 378, 260–263 CrossRef CAS PubMed.
- A. Nakajima, M. Hirano, R. Hasumi, K. Kaya, H. Watanabe, C. C. Carter, J. M. Williamson and T. A. Miller, J. Phys. Chem. A, 1997, 101, 392–398 CrossRef CAS.
- J. Catalán and J. Paz, J. Chem. Phys., 2005, 122, 244320 CrossRef PubMed.
- R. Crespo-Otero, N. Kungwan and M. Barbatti, Chem. Sci., 2015, 6, 5762–5767 RSC.
- Y. N. Svartsov and M. Schmitt, J. Chem. Phys., 2008, 128, 214310 CrossRef PubMed.
- D. Kina, A. Nakayama, T. Noro, T. Taketsugu and M. S. Gordon, J. Phys. Chem. A, 2008, 112, 9675–9683 CrossRef CAS PubMed.
- R. Daengngern, N. Kungwan, P. Wolschann, A. J.-A. Aquino, H. Lischka and M. Barbatti, J. Phys. Chem. A, 2011, 115, 14129–14136 CrossRef CAS PubMed.
- G. A. Pino, I. Alata, C. Dedonder, C. Jouvet, K. Sakota and H. Sekiya, Phys. Chem. Chem. Phys., 2011, 13, 6325–6331 RSC.
- N. Kungwan, K. Kerdpol, R. Daengngern, S. Hannongbua and M. Barbatti, Theor. Chem. Acc., 2014, 133, 1–11 Search PubMed.
- H. Fang, B. K. Mai and Y. Kim, Photochem. Photobiol., 2015, 91, 306–314 CrossRef CAS PubMed.
- K. Kerdpol, R. Daengngern and N. Kungwan, Mol. Simul., 2015, 41, 1177–1186 CrossRef CAS.
- I. Lamas, R. Montero, V. Martínez-Martínez, A. Longarte and L. Blancafort, Phys. Chem. Chem. Phys., 2020, 22, 18639–18645 RSC.
- J. Catalán, J. C. del Valle and M. Kasha, Proc. Natl. Acad. Sci. U. S. A., 1999, 96, 8338–8343 CrossRef PubMed.
- O.-H. Kwon and A. H. Zewail, Proc. Natl. Acad. Sci. U. S. A., 2007, 104, 8703–8708 CrossRef CAS PubMed.
- R. Daengngern, K. Kerdpol, N. Kungwan, S. Hannongbua and M. Barbatti, J. Photochem. Photobiol., A, 2013, 266, 28–36 CrossRef CAS.
- J. A. Noble, E. Marceca, C. Dedonder, W. Phasayavan, G. Féraud, B. Inceesungvorn and C. Jouvet, Phys. Chem. Chem. Phys., 2020, 22, 27280–27289 RSC.
- R. Crespo-Otero and M. Barbatti, Chem. Rev., 2018, 118, 7026–7068 CrossRef CAS PubMed.
- G. Granucci and M. Persico, J. Chem. Phys., 2007, 126, 134114 CrossRef PubMed.
- J. C. Tully, J. Chem. Phys., 1990, 93, 1061–1071 CrossRef CAS.
- T. Nelson, S. Fernandez-Alberti, A. E. Roitberg and S. Tretiak, Acc. Chem. Res., 2014, 47, 1155–1164 CrossRef CAS PubMed.
- C. Møller and M. S. Plesset, Phys. Rev., 1934, 46, 618–622 CrossRef.
- T. H. Dunning Jr., J. Chem. Phys., 1989, 90, 1007–1023 CrossRef.
- A. B. Trofimov, I. L. Krivdina, J. Weller and J. Schirmer, Chem. Phys., 2006, 329, 1–10 CrossRef CAS.
- A. Dreuw and M. Wormit, Comput. Mol. Biosci., 2015, 5, 82–95 CrossRef CAS.
- R. Ahlrichs, M. Bär, M. Häser, H. Horn and C. Kölmel, Chem. Phys. Lett., 1989, 162, 165–169 CrossRef CAS.
- S. G. Balasubramani, G. P. Chen, S. Coriani, M. Diedenhofen, M. S. Frank, Y. J. Franzke, F. Furche, R. Grotjahn, M. E. Harding, C. Hättig, A. Hellweg, B. Helmich-Paris, C. Holzer, U. Huniar, M. Kaupp, A. M. Khah, S. K. Khani, T. Müller, F. Mack, B. D. Nguyen, S. M. Parker, E. Perlt, D. Rappoport, K. Reiter, S. Roy, M. Rückert, G. Schmitz, M. Sierka, E. Tapavicza, D. P. Tew, C.-v Wüllen, V. K. Voora, F. Weigend, A. Wodyński and J. M. Yu, J. Chem. Phys., 2020, 152, 184107 CrossRef CAS.
- B. G. Levine, C. Ko, J. Quenneville and T. J. Martínez, Mol. Phys., 2006, 104, 1039–1051 CrossRef CAS.
- B. G. Levine, J. D. Coe and T. J. Martínez, J. Phys. Chem. B, 2008, 112, 405–413 CrossRef CAS PubMed.
- M. Hillery, R. F. O'Connell, M. O. Scully and E. P. Wigner, Phys. Rep., 1984, 106, 121–167 CrossRef.
- M. Barbatti and K. Sen, Int. J. Quantum Chem., 2016, 116, 762–771 CrossRef CAS.
- S. Bai, R. Mansour, L. Stojanović, J. M. Toldo and M. Barbatti, J. Mol. Model., 2020, 26, 107 CrossRef CAS PubMed.
- S. Hammes-Schiffer and J. C. Tully, J. Chem. Phys., 1994, 101, 4657–4667 CrossRef CAS.
- J. Pittner, H. Lischka and M. Barbatti, Chem. Phys., 2009, 356, 147–152 CrossRef CAS.
- M. Barbatti, M. Ruckenbauer, F. Plasser, J. Pittner, G. Granucci, M. Persico and H. Lischka, Comput. Mol. Biosci., 2014, 4, 26–33 CrossRef CAS.
- R. Mansour, S. Mukherjee, M. Pinheiro Jr and M. Barbatti, Dataset, 2022 DOI:10.6084/m9.figshare.19448165.v3.
- M. Pinheiro Jr, S. Mukherjee and M. Barbatti, Dataset, 2021 DOI:10.6084/m9.figshare.c.5478270.
- X. Huang, J.-P. Aranguren, J. Ehrmaier, J. A. Noble, W. Xie, A. L. Sobolewski, C. Dedonder-Lardeux, C. Jouvet and W. Domcke, Phys. Chem. Chem. Phys., 2020, 22, 12502–12514 RSC.
- D. Cremer and J. A. Pople, J. Am. Chem. Soc., 1975, 97, 1354–1358 CrossRef CAS.
- P. Busch, in Time in Quantum Mechanics, ed. J. G. Muga, R. S. Mayato and I. L. Egusquiza, Springer Berlin Heidelberg, Berlin, Heidelberg, 2002, pp. 69–98 DOI:10.1007/3-540-45846-8_3.
- M. Barbatti, M. Ruckenbauer and H. Lischka, J. Chem. Phys., 2005, 122, 174307 CrossRef CAS PubMed.
- M. T. do Casal, J. M. Toldo, M. Pinheiro Jr and M. Barbatti, Open Res. Europe, 2021, 1, 49 Search PubMed.
Footnote |
| † Electronic supplementary information (ESI) available. See DOI: https://doi.org/10.1039/d2cp01056a |
| This journal is © the Owner Societies 2022 |

