Collectivity in ionic liquids: a temperature dependent, polarizable molecular dynamics study†
Received
23rd February 2022
, Accepted 14th June 2022
First published on 22nd June 2022
Abstract
We use polarizable molecular dynamics simulations to study the thermal dependence of both structural and dynamic properties of two ionic liquids sharing the same cation (1-ethyl-3-methylimidazolium). The linear temperature trend in the structure is accompanied by an exponential Arrhenius-like behavior of the dynamics. Our parameter-free Voronoi tessellation analysis directly casts doubt on common concepts such as the alternating shells of cations and anions and the ionicity. The latter tries to explain the physico-chemical properties of the ionic liquids based on the association and dissociation of an ion pair. However, cations are in the majority of both ion cages, around cations and around anions. There is no preference of a cation for a single anion. Collectivity is a key factor in the dynamic properties of ionic liquids. Consequently, collective rotation relaxes faster than single-particle rotations, and the activation energies for collective translation and rotation are lower than those of the single molecules.
1 Introduction
In recent years, both static and dynamic properties of ionic liquids (ILs) have received considerable attention. Being liquid salts below 100 °C,1 typically also at room temperature,2 ILs exhibit properties that distinguish them from more common molecular liquids. Some of these properties (such as negligible vapor pressure and a broad liquid range) make ILs suitable candidates for use in industry, e.g., as green solvents3 or extraction media.4 Due to their large electrochemical window, ILs have multiple fields of application in electrochemistry.5–17 They are considered non-volatile and water-free alternatives for electrolytes in batteries.
In this context, predicting the conductivity of a particular mixture of ILs is often of crucial importance. For example, as shown by Cabeza et al., the conductivity of certain 1-ethyl-3-methyl-imidazolium based ionic liquids can increase twenty-fold in the range of 258.15 to 298.15 K, and up to a factor of 400 when increasing the temperature to 393.15 K.18 Molten salts are known to form layers of oppositely charged ions around both cations and anions. These cages play a vital role in the evolution of the viscosity and diffusivity of ILs,19–21 slowing down dynamics and reducing conductivity.18,22,23 Rattling motions within said cages can be assumed to occur at a fast timescale without significant interaction with neighboring like-charged ions. Other, slower means of relaxation (rotational reorientation and diffusion), however, require either a change in the shape and size of the cage or a “jump” to an adjacent position, disrupting the network of oppositely charged ions.
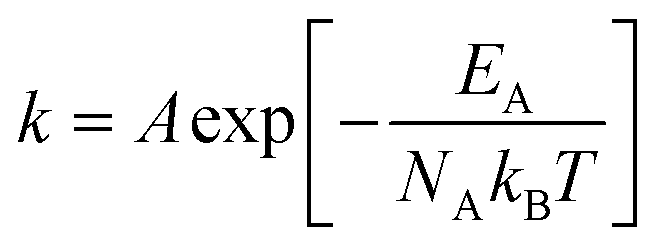
One of the most well-known relationships between temperature and experimentally measured dynamic properties is Arrhenius' equation, which, in its original form,24 states that the rate constant k of a reaction can be expressed as
| |  | (1) |
where
EA is the activation energy required to overcome a kinetic or potential energy barrier at the absolute temperature
T.
kB and
NA are the Boltzmann constant and Avogadro number, respectively. The pre-exponential factor
A is not a function of temperature in the original Arrhenius equation. However, applying this equation to the temperature dependent diffusion coefficients and conductivity, the prefactor may also be considered to change with temperature. For example, Frech and co-workers reported on a compensated Arrhenius approach for ion transport and self-diffusion using a temperature-dependent prefactor.
25–27 A more complex equation,
| |  | (2) |
named after Vogel,
28 Fulcher
29 and Tammann
30 was first used to describe the behavior of the viscosity
η of liquids in the supercooled regime and near the glass transition temperature
Tg. However,
TVF is an empirical, adjustable Vogel–Fulcher–Tammann temperature to best fit experimental data which may differ significantly from
Tg. The empirical prefactor
η0 is a function of the material but not temperature. Small
B-values indicate fragile glass formers showing larger discrepancies with the simple Arrhenius law.
31
Recently, many Arrhenius-type relationships of ionic liquids and other soft matter have been investigated, including the viscosity η, molar conductivity Λ and self-diffusion coefficients.31–36 Also results from molecular dynamics (MD) simulations follow eqn (1) for various transport properties.37–39 Arrhenius-type behavior is also often assumed for the evaluation of the viscosity in mixtures40 according to the Grunberg–Nissan model.41 Other studies have found more complex, non-Arrhenian behavior for classical ionic liquids over a very broad temperature range,36,42,43 for functionalized ionic liquids,34 fragile glass formers,31,44 for solid electrolytes,45 and ionic liquids mixed with Li salts.46 Experimental studies have found both temperature-dependent and temperature-independent relaxation processes in ethylammonium nitrate as well as 1-ethyl-3-methylimidazolium ethylsulfate.47,48
As we performed polarizable MD simulations for five different temperatures for the ILs 1-ethyl-3-methylimidazolium dicyanamide [C2mim]N(CN)2 and 1-ethyl-3-methylimidazolium triflate [C2mim]OTf, we stick to the Arrhenius equation for describing the temperature behavior of various structural and dynamical properties as this equation has only two fit parameters. It is not our intention to argue in favor of pure Arrhenian dynamics in IL systems but to show which structural and dynamical properties in these heterogeneous systems are affected by this Arrhenius-like behavior. As argued by Funke and co-workers43 and visible from the data of Loidl and co-workers31 and Weeks and co-workers49 the simple Arrhenius equation describes the temperature behavior sufficiently in our restricted temperature range from 260 K to 340 K. Significant deviations from the Arrhenius equation are expected at lower temperatures closer to the glass transition. However, our temperature range covers most applications of ionic liquids.
Quite naturally, experimental studies focus on the collective properties such as conductivity, viscosity, or the dielectric spectrum. In contrast, MD simulations of the temperature-dependent behavior typically deal with single-particle properties like diffusion coefficients and molecular dipole rotations but neither collective properties nor temperature-dependent structural effects. This may be due to the fact that most non-polarizable MD simulations of ionic liquids overestimate viscosity by almost an order of magnitude.50,51
In the present study, we would like to combine investigations on the structure with single-particle and collective dynamics as a function of temperature. Our ionic liquids share a relatively low viscosity to increase the statistical quality of our computational results. Nevertheless, the ionic liquids differ in many properties: the glass transition temperature Tg of [C2mim]N(CN)2 is 169 K,52 but could not be detected for [C2mim]OTf. Instead, [C2mim]OTf melts at 259 K.53 As we will later see, both ionic liquids differ in their diffusion coefficients, molecular and collective rotations, their activation energies, and their dielectric behavior. Consequently, our results are not restricted to a particular ionic liquid but are valid for ionic liquids in general.
2 Methods
Non-polarizable simulations using fixed partial charges usually yield too slow dynamics and are thus better suited to study structural behavior only.50,51,54,55 Consequently, we performed polarizable MD simulations using Drude oscillators as we are interested in the temperature dependence of dynamic properties. For the current study, we reused trajectories of [C2mim]N(CN)2 featured and detailed in our group's previously published works, which modeled the temperature behavior of experimental fast-field cycling NMR data quite well.56,57 Gruebele et al. pointed out how calculating different observables from the same trajectory is beneficial as it allows for greater comparability of results.58 Furthermore, we conducted new simulations of [C2mim]OTf which were parametrized and produced in a similar fashion as for the [C2mim]N(CN)2 system.
2.1 Equilibrium simulation
A thousand ion pairs of 1-ethyl-3-methylimidazolium dicyanamide [C2mim]N(CN)2 and 1-ethyl-3-methyl-imidazolium trifluoromethanesulfonate [C2mim]OTf were modelled fully atomistically. The parameters were acquired via the automated force field parametrization tool GAAMP59 using CGenFF output60,61 further refined based on quantum-mechanical data. Polarizable interactions of non-hydrogen atoms were modeled by Drude particles with a mass of 0.2 u and a harmonic bond constant of 500 kcal mol−1 Å−2. The Lennard-Jones attraction of the polarizable atoms was reduced since this part of the Lennard-Jones interaction is already accounted for by the interaction of the atomic induced dipoles brought about by the attached Drude particle. The Lennard-Jones potential depth was scaled down according to the correction by Vlugt et al.62 with a scaling factor λ = 0.4.
All MD simulations were carried out with CHARMM.63 The initial intermolecular geometries of the simulation boxes were taken from previous, unscaled simulations and equilibrated as NpT ensembles for 1 ns at p = 1 atm. The actual trajectories were then produced as NVT ensembles of 40 ns total length, a time step of 0.5 fs, and a write frequency of 25 fs with periodic boundary conditions. Intramolecular hydrogen vibrations were constrained with the SHAKE algorithm.64 Constant temperatures were ensured using the extended Lagrange formalism65 with a dual Nose–Hoover thermostat66,67 keeping the temperature of the atoms at the specified temperature and the temperature of the Drude particles at T = 1 K. Thermostat response time was set to 0.005 ps for Drude particles and to 0.1 ps for all other atoms. Electrostatic interactions were calculated with the particle-mesh Ewald method68,69 with κ = 0.41 Å−1 (tinfoil boundary conditions).
2.2 Non-equilibrium simulations
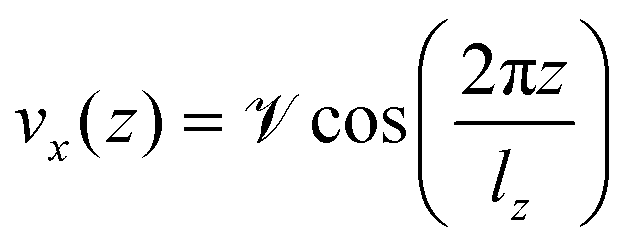
In order to compute the viscosity at different temperatures, the method of choice in equilibrium MD simulations is the Green–Kubo integration,70 . This approach utilizes the off-diagonal elements Pαβ of the pressure tensor. However, since the autocorrelation function is usually very noisy, the cutoff of the integral has a non-negligible impact on the resulting values. A numerically more stable method is to apply periodic perturbations in form of a cosine-shaped acceleration to the system.71
| |  | (3) |
| |  | (4) |
Here,  and
and  are the amplitude of the applied acceleration and the velocity profile, and lz is the length of the simulation box along the z-axis. The resulting viscosity can then be calculated as
| |  | (5) |
with the density ρ. For the systems described above, accelerations of 0.005, 0.01, 0.02, 0.03, 0.04 and 0.05 nm ps−2 have been set up in OpenMM72 utilizing the Viscosity-Reporter of Pádua and co-workers.73 All simulations were carried out using a Monte-Carlo barostat, the velocity-Verlet integrator and an Ewald error tolerance of 0.0005. Three replicas of 7 ns each with an integration time step of 0.5 fs were averaged to calculate η at different accelerations. The resulting values were then extrapolated to zero acceleration to arrive at equilibrium viscosities.
2.3 Post-production analysis
Coordinates were extracted from the CHARMM trajectory with a Python3 script using utilities provided by the MDAnalysis module.74,75 For structural analysis, the minimum distance of each particle pair was calculated by applying periodic boundary conditions. These distances may be shorter than the respective distance between these molecules in the primary cell. In the translational dynamics analyses, the toroidal coordinates were unfolded, i.e. coordinate jumps resulting from periodic boundary conditions were mathematically removed to allow for a more natural, diffusive motion of the ions.
Usually, the structural analysis and corresponding information on neighboring molecules are based on classical radial distribution functions. However, the coordination numbers based on these radial distribution functions are gained by spherical integration and thus assume spherically isotropic molecule, which is not the case for the ionic liquid cations and anions. Consequently, we apply Voronoi tessellations in conjunction with the radial distribution functions to determine real neighbors.76 Voronoi tessellation was performed using the Voro++ library77 constructing polyhedra that contain all points in space closer to its central molecule than to any other molecule. If two molecules share a Voronoi surface area, they are considered direct neighbors.78–80 All neighbors of a central molecule build the first solvation shell s = 1. The neighbors of these neighbors are members of the second solvation shell s = 2 and so on. These shell assignments can also be used to decompose the radial distribution functions in parameter-free solvation shells, avoiding ambiguities from threshold-based approaches.76
2.3.1 Voronoi-decomposed radial distribution functions.
The intermolecular structure of the ionic liquids was studied using radial pair distribution functions (RDF) gκλ(r). They represent the ratio of the local density of a molecule type λ to its global density and are thus indicative of particle abundance or scarcity at a pair distance r to a molecule of species κ. The RDFs are computed with respect to the center-of-mass ![[r with combining right harpoon above (vector)]](https://www.rsc.org/images/entities/i_char_0072_20d1.gif) i of the molecules i and not on an atomic level. Please note that the center-of-mass is also our reference point for the diffusion and rotation of the molecules described in the subsequent sections.
i of the molecules i and not on an atomic level. Please note that the center-of-mass is also our reference point for the diffusion and rotation of the molecules described in the subsequent sections.
As a single point, i.e. the center-of-mass, represents the molecules, the RDF by itself may not accurately describe the particle neighborhood for anisotropic molecules.76 The distance between the center-of-mass of an ellipsoidal solute and its surrounding solvent molecules will vary widely depending on whether a given solvent molecule is situated directly above or below the center of the ellipsoid or whether it interacts with one of the peripheral atoms. Yet, both of these solvent molecules belong to the solvent contact shell s = 1. Hence, we employed Voronoi tessellation,81 to further resolve the RDF into solvation shells s such that
| |  | (6) |
Based on the shell-resolved RDF, we calculated coordination numbers Nκλvia integration:
| |  | (7) |
This integral diverges for classic RDFs
gκλ(
r), and has to be cut off at some arbitrary distance
R. However, the integral in
eqn (7) does not diverge due to shell finiteness for shell-resolved RDFs
gκλ(
s,
r) as these functions level off at zero instead of unity.
2.3.2 Potential of mean force.
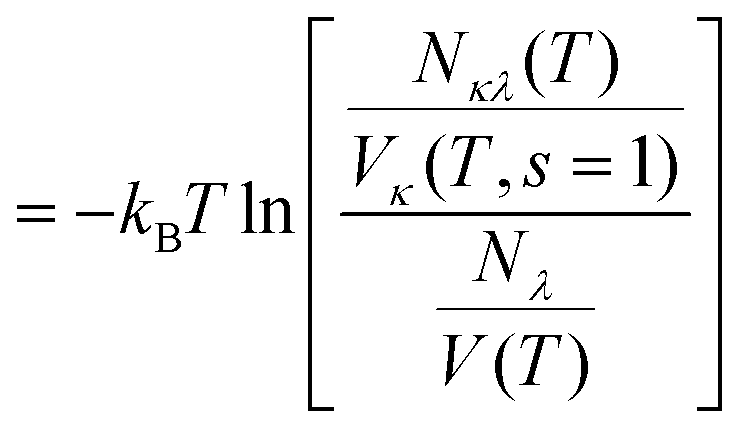
As the molecular volumes of C2mim+, N(CN)2− and OTf− differ significantly, and consequently, the size of their solvation shells as well, the potential of mean force (PMF) is a better measure of like-ion affinity than the coordination number (irrespective of the molecular volume):76,82| | PMFκλ(T,r) = −kBT![[thin space (1/6-em)]](https://www.rsc.org/images/entities/char_2009.gif) lngκλ(T,r) lngκλ(T,r) | (8) |
Thus, the relative abundance of a particle at a distance r is assumed to indicate the energetic situation at this distance. Since radial structural measures are inappropriate for strongly anisotropic solutes, we employ the more general shell-based PMF formalism introduced by Zeindlhofer et al.:76| |  | (9) |
| |  | (10) |
as the radial distribution function is basically the ratio of the local and global density. This way, the contact PMF for cation to other cations is described by the logarithm of the ratio of local shell concentration cλ(T,s = 1) = Nκλ(T)/Vκ(T,s = 1) and average sample concentration cλ(T) = Nλ/V(T). The volume Vκ(T,s = 1) of the first solvation shell around a molecule of species κ is obtained by the sum of molecular Voronoi polyhedra in the first solvation shell. Nλ and V(T) are the total number of molecules of type λ (= 1000) and volume of the simulation box at temperature T, respectively.
2.3.3 Diffusion coefficients.
Translational diffusion coefficients D measure the particle mobility and represent matter transport irrespective of charge. Computationally, the temperature-dependent D was calculated for cations and anions separately using the Einstein–Helfand relation| |  | (11) |
where 〈Δr2(t)〉 is the mean-square displacement| | | 〈Δr2(t)〉 = 〈|i(0) − i(t)|2〉|T,κ | (12) |
for a molecular species κ at a given temperature T, a correlation function sensitive to the average increasing distance of a molecular center-of-mass i with respect to its starting point.
Long-range interactions lead to significant dependencies of the diffusion coefficients on the box length L(T) of the simulation box.83,84 Yen and Hummer83 proposed a correction to infinite box size
| |  | (13) |
with the constant
ξ = 2.837297. This correction is also applied in this work and stress that long-range interactions do have an impact on the single-particle diffusion of the molecules.
The Nernst–Einstein equation
| |  | (14) |
| | | σ(T) = σNE(T)·(1 − Δ(T)) | (15) |
estimates the conductivity
σNE(
T) on the basis of the molecular charges
qκ, the number density
ρκ(
T) and the diffusion coefficients
Dκ(
T). Usually,
σNE(
T) is larger than the actual conductivity
σ(
T) and is therefore corrected by a factor (1 −
Δ) which is called Haven ratio.
2.3.4 Conductivity.
The conductivity is an experimentally accessible measure of particle mobility similar to the diffusion coefficient, but conductivity describes the net transport of charges; hence, molecular charges do matter. Computationally, static conductivity can be calculated in a similar way to diffusion but based on the collective translational dipole moment rather than the the center-of-masses| |  | (16) |
with  and
and  at a given temperature T. The total number of charged particles N = N+ + N− is the sum of the number of the molecular cations and anions, qi is the charge of the ith molecule and i(t) is the center-of-mass of molecule i at time t in a simulation box thermostated at a temperature of T. Recently, we showed that the conductivity can be decomposed by contributing species:85
 where σκ(T) iterates over the cationic and anionic contributions. These contributions, in turn, consist of the ionic self-correlation as well as the cross-correlations, i.e.
| |  | (17) |
The partial contributions σκλ(T) can be obtained by taking partial collective translational dipoles of the species κ and λ and forming both self- (κ = λ) and cross- (κ ≠ λ) correlations:| |  | (18) |
| |  | (19) |
using| |  | (21) |
Table S5 of the ESI† collects both the total and the partial conductivities of the system in question, along with a comparison of experimentally determined total conductivities. The molar conductivity Λκ(T) reads σκ(T)/cκ(T).
2.3.5 Single-particle rotation.
The correlation functions used to investigate single-particle rotation describe molecular dipole rotation, i.e. the rate of orientational randomization. The rotational autocorrelation function of each molecule 〈![[small mu, Greek, vector]](https://www.rsc.org/images/entities/i_char_e0e9.gif) i(0)·i(t)〉|T is averaged
i(0)·i(t)〉|T is averaged  to obtain rotational information on species κ. Summing up the charged particles would yield a numerical dipole moment depending on the arbitrary center-of-origin. Thus, we have to account for molecular position explicitly. We do so by subtracting the molecular center-of-mass i(t) of each molecular contribution
| |  | (22) |
with  where i enumerates all N molecules and β enumerates all atoms in a given molecule i. Relaxation times were obtained upon integration of the normalized time correlation function:
| |  | (23) |
The inverse of this relaxation time τκ(T) is a rate describing the number of dipole relaxations per time unit.25 Please note that although the rotation is called a “single-particle” property, the corresponding rotations do not happen in a non-interacting medium but in a solution. However, this property does not contain direct correlations between the molecules i and j.
2.3.6 Collective rotation.
In addition to the rotation of the molecular dipole, the rotational dynamics of the sample total dipole 〈![[M with combining right harpoon above (vector)]](https://www.rsc.org/images/entities/i_char_004d_20d1.gif) D(T,t = 0)·D(T,t)〉 with D(T,t) as the sum of all molecular dipoles
D(T,t = 0)·D(T,t)〉 with D(T,t) as the sum of all molecular dipoles| |  | (24) |
| |  | (25) |
was also investigated. In contrast to the single molecular observables, collective ones also capture cross-correlations of different molecules, e.g. of the ith and jth dipole. These collective dynamics correspond to dielectric relaxation spectra86 and can be measured experimentally. Computationally, we can decompose the collective rotation into contributions from different species,87 in this case into cation (κD) and anion (λD) collective dipoles:| |  | (26) |
forming two self-correlations and one cross-correlation between the molecular species. The numerical correlation functions are typically noisy since only one sample dipole is recorded instead of Nκ molecular ones. Consequently, we cannot apply eqn (23) and use triexponential functions| | | Φ(t) = A1exp[−t/τ1] + A2exp[−t/τ2] + A3exp[−t/τ3] | (27) |
to fit the correlation functions instead. This is in accordance with a recent dielectric study on these systems.56 Table S7 of the ESI† collects the fitted relaxation times.
Alternatively, 〈D(0)·D(t)〉|T can be decomposed into single-particle correlation functions of the species plus a term that collects all cross-correlations:
| |  | (28) |
The first two terms on the right hand side correspond to the single-particle rotation of molecules of species
κ and
λ, respectively. The single-particle rotations are accompanied by all cross-correlations between all molecular dipoles regardless if they belong to the same or to a different species,
i.e. N =
N+ +
N− whereas
Nκ refers to the cationic (
N+) or the anionic (
N−) species individually.
2.3.7 Dielectric relaxation spectra.
Dielectric relaxation spectroscopy describes the response of the total dipole moment to a frequency-dependent external field ![[E with combining right harpoon above (vector)]](https://www.rsc.org/images/entities/i_char_0045_20d1.gif) (ω). Both the collective rotational dipole moment D(T,t) and collective translational dipole moment J(T,t) contribute to the total dipole moment. The latter component exists only if charged species are present. Although cross-terms between D(T,t) and J(T,t) can theoretically contribute to the generalized dielectric constant Σ(ω), these contributions are relatively small and can hence be neglected.88 As a result, rotational and translational contributions can be evaluated separately:
(ω). Both the collective rotational dipole moment D(T,t) and collective translational dipole moment J(T,t) contribute to the total dipole moment. The latter component exists only if charged species are present. Although cross-terms between D(T,t) and J(T,t) can theoretically contribute to the generalized dielectric constant Σ(ω), these contributions are relatively small and can hence be neglected.88 As a result, rotational and translational contributions can be evaluated separately:| |  | (29) |
| |  | (30) |
using the Laplace transform  . Please note that the translational part is obtained from the second derivative of the mean-squared displacement instead of the first derivative of the auto-correlation function of the collective, translational dipole moment due to practical reasons.88
Both in computation and experiment, the contribution of the static conductivity σ(T) is removed from the frequency-dependent generalized dielectric constant
| | 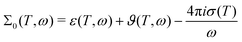 | (31) |
as indicated by the subindex 0. The generalized dielectric constant is a complex function. However, since real and imaginary part are correlated by the Kramers–Kronig relation, usually only the imaginary part

is printed as shown in
Fig. 5.
3 Results and discussion
In the following, we report the structure and dynamics of [C2mim]N(CN)2 and [C2mim]OTf as a function of temperature. We find a linear temperature dependence of structural properties but an exponential behavior of dynamical observables. We note that polarizable MD simulations are necessary to obtain dynamic properties close to experiment.50,51 Non-polarizable MD simulations yield dynamic properties that are an order of magnitude slower than experiment, albeit still leading to correct structures. We, therefore, deem our results concerning structure to also hold for non-polarizable force fields but expect our findings concerning dynamics to change quantitatively but not qualitatively if a non-polarizable force field was employed.
3.1 The ionic liquid structure shows a linear trend with increasing temperature
The parameter-free Voronoi analysis decomposes the space into polyhedra around each molecule. The averaged molecular volumes Vκ(T,s = 0) increase linearly with temperature. However, in our investigated temperature range from 260 K to 340 K this increase is about 5% (see ESI†).
3.1.1 Voronoi-decomposed radial distribution functions.
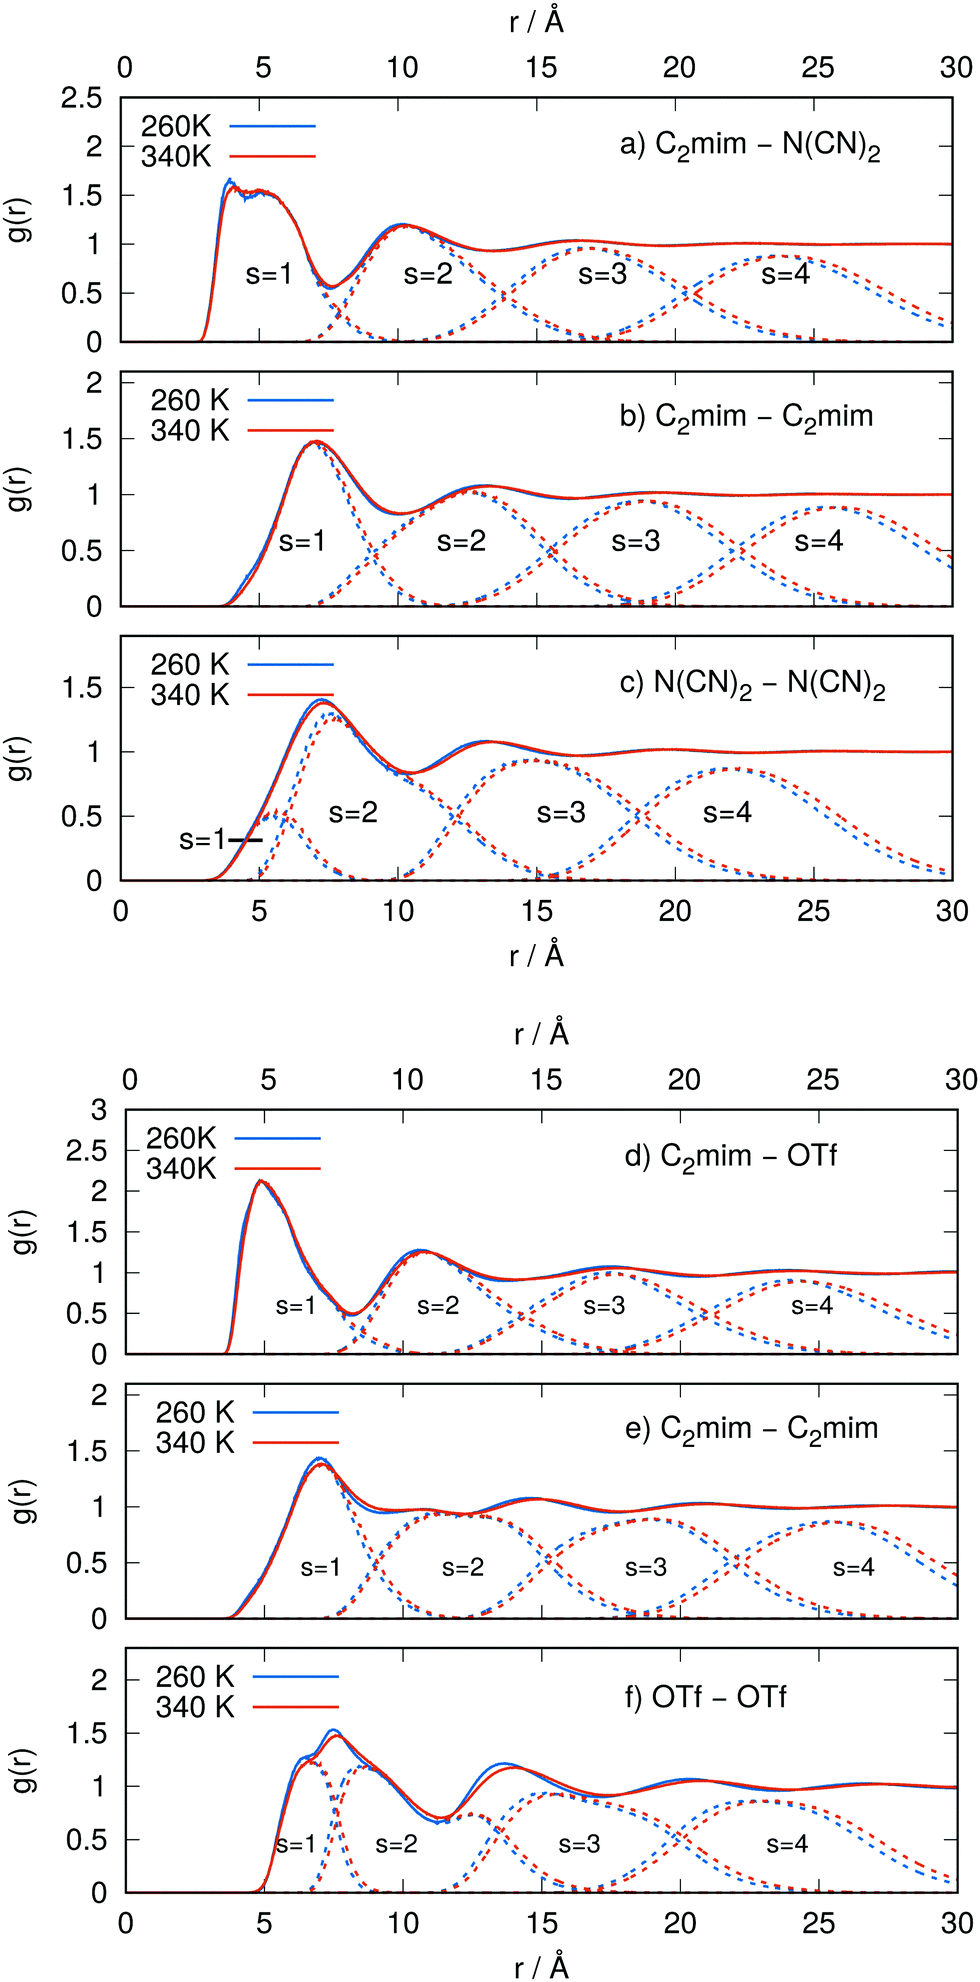
If two molecular Voronoi polyhedra share a surface, the corresponding molecules are direct neighbors. This new type of analysis is particularly suited for anisotropic molecules, like the imidazolium cations and our inorganic anions, and can be combined with standard radial distribution function analysis. The results of the Voronoi shell-resolved RDF calculations are summarized in Fig. 1. Here, the lowest and the highest temperatures (blue = 260 K and red = 340 K) are plotted with solid lines for the total RDF and with dotted lines for the Voronoi-resolved shells. The temperature marginally affects the shell structure; the higher the temperature, the broader and less distinct the shells become, accompanied by a smoothing of the overall RDF.
 |
| | Fig. 1 Radial distribution functions (solid lines) and their decomposition into Voronoi shells (dashed lines) for the [C2mim]N(CN)2 system (upper panels) and the [C2mim]OTf system (lower panels) using both the highest temperature (340 K, red color) and the lowest one (260 K, blue color) simulated to demonstrate the extent of thermal influences on the structure. | |
The first coordination shell (contact shell s = 1) is the most interesting one chemically speaking since it comprises the solvent cage of the studied molecule. The resulting coordination numbers in Table S2 of the ESI† reveal a slight but consistent trend: the higher the temperature, the more ions are present in the solvent cage of a molecule. This is not only true for all ion combinations, but we also find a linear relationship for Nκλ depicted in the left panel of Fig. 2. The positive trend is hardly discernible but was also reported for other ILs.89
 |
| | Fig. 2 (a) Coordination numbers Nκλ of cations and anions in the first Voronoi shell. The first ion denotes the central molecule, the second ion is the neighbor species. (b) Potential of mean force based on eqn (10). The gray area indicates overall preferred contacts. (c) Sketch of the ionic network consisting of cationic (orange) and anionic (blue) cages. The ratio of first neighbors corresponds to our computational results (N++/N+− ≃ 12:8 = 6:4, N−+/N−− ≃ 8:2 = 4:1). Nevertheless, the charge neutrality is still fulfilled. The arrows indicate net attractive forces (= negative PMF) leading to an accumulation of that surrounding species. As a result, these cages do not follow the classical interpretation of alternating charges. | |
Based on chemical intuition and the RDFs shown in Fig. 1, many studies report on alternating cation–anion layers and hence count only the counter-ions as members of the ion cage around the central ion. For example, Fayer and co-workers used the number of counter-ions to compute the ion cage potential.89 In our simulations, eight anions are direct neighbors of a central imidazolium in both IL systems (see triangles in Fig. 2a). However, in order to exist in such close proximity, the first shell cannot consist of anions only. In fact, the number of imidazoliums even exceeds that of the anions as the charge density is quite low for IL cations and dispersion interactions are significant. This is not an effect of the polarizable force field since similar coordination numbers were reported in a coarse-grained study.90
However, the distance between the center-of-masses between cation–cation is larger than cation–anion due to the bigger size. Consequently, the corresponding peak in g(r) is shifted to higher distances as visible in Fig. 1 giving the impression of subsequent layers. Nevertheless, both first peaks in Fig. 1a, b, d and e correspond to direct neighbors of the central imidazolium. In the case of the anions, the charge density is higher and the dispersion lower. Hence, the resulting coordination numbers are lower (see open spheres in Fig. 2a) and the first peak of g(r) emerges from the first two Voronoi shells s = 1 and s = 2 for both IL systems. Thus, traditional spherical integration to the first minimum would result in a wrong coordination number in this case.76
3.1.2 Potential of mean force of the ion cages.
In addition to the precise coordination number Nκλ, the Voronoi tessellation also yields the volume Vκ(T,s = 1) of the first solvation shell by summing up all molecular Voronoi polyhedra of neighboring molecules. Consequently, local concentrations in the first shell cλ(T,s = 1) = Nκλ/Vκ(s = 1) can be determined and compared to the bulk concentrations. If the local concentration is higher than the bulk concentration, the shell-resolved potential of mean force PMFκλ (s = 1) becomes negative (see eqn (10)) and indicates attraction. Interestingly, the PMFκλ(s = 1) for the C2mim–C2mim is slightly negative and becomes even more negative at higher temperatures (see Fig. 2b). The kinetic energy of the ions seems to help overcome the coulombic repulsion between the cations at elevated temperatures. As mentioned before, the number of anions is lower than the cations in the first solvation shell around a central cation. Consequently, the potential of mean force for anions around the central cation is positive in Fig. 2b. As a result, the large ion cage depicted in Fig. 2c around the imidazolium (orange area) is relatively weak.
As visible in Fig. 2b, the PMF (s = 1) of the cations around a central anion is significantly negative, indicating a substantial overrepresentation of cations around anions and arguing for a strong ion cage around the anions (blue area). As the repulsion between the cations is not as strong as between anions, they need fewer anions in the first solvation shell for stabilization. Quite intuitively, anions are underrepresented in the first solvation shell around anions and have a positive potential of mean force consequently.
The negative PMF in Fig. 2b and hence the arrows in Fig. 2c clearly indicate that only cations are favorable members of the cationic and anionic ion cage. The depletion of anions in the first shell of the cations argues against the classical picture of alternating charges in ionic liquids. The different trends of the PMF for the cation → anion and anion → cation in Fig. 2b result in a complex behavior of the ion cages as a function of temperature. Hence, Fig. 2c should also advert to the fact that all properties are determined by a collective network and not the peculiarities of a single molecule. Correspondingly, group-based predictions of dynamics properties91–93 are in principle incorrect and have to rely on error compensation as correlations between cations and anions are intrinsically neglected.
3.2 Ion dynamics shows an Arrhenian-like temperature dependence
In his studies on the Newtonian flow, Doolittle reported as early as 1951 that the linear temperature trend of the free volume is accompanied by the exponential temperature dependence of the viscosity (see ESI†).94
The free volume is often used for the interpretation of the diffusion mechanism.95–97 The fundamental idea of these models is that the rate of translational motion is affected by the contraction of the liquid as volume is needed for the molecular rearrangements. The diffusing molecules can use the free volume in excess of the crystal volume to jump into.98 The Adam–Gibbs entropy model98,99 predicts that the activation energy decreases with increasing configurational entropy, which depends on cooperative relaxation properties and the size of this dynamically coupled system. In contrast, Alder and Hildebrand100 pointed out that, in fact, no activation barrier EA is involved in the dynamical processes, but the Arrhenius equation describes the exponential behavior of these processes quite well. As we use the activation energy to compare rotational and translational degrees of freedom in both ionic liquids, we do not argue in favor of one or the other theory to interpret the physical meaning of these activation energies.
3.2.1 Single-particle diffusion.
The diffusion coefficients Dκ(T) are visualized in Fig. 3a and b. Table S4 of the ESI† collects the diffusion coefficients Dκ(T) for all ions of the two systems. The diffusion coefficients in both systems for all ions obey an Arrhenius-type equation102| |  | (32) |
with Dκ as a limiting pre-exponential factor and EA(Dκ) as the activation energy of diffusion of species κ.
 |
| | Fig. 3 Arrhenius plots of the single-particle dynamics: (a) diffusion in [C2mim]N(CN)2, (b) diffusion in [C2mim]OTf, (c) molecular rotations in [C2mim]N(CN)2, (d) molecular rotations in [C2mim]OTf, (e) molecular rotation axes of the cation, (f) correlation between diffusion and molecular rotation. All linear fits were significant (R2 > 0.99). Experimental values (ref. 57 for [C2mim]N(CN)2, ref. 101 for [C2mim]OTf) are given for comparison. | |
The diffusion coefficients of [C2mim]OTf in Fig. 3b are underestimated [(both for the cation and the anion) compared to experiment,101 which results in slower dynamics which is also true for our viscosities (see ESI†). The slope of the data (i.e. the activation energy EA(Dκ)), however, agrees reasonably well. No diffusion coefficient data for the anion is available in the case of [C2mim]N(CN)2. The cation, on the other hand, shows a remarkable agreement with reported literature values57 both regarding the exponential prefactor and the activation energy.
From the linear fits in Fig. 3, we derive molecular diffusion activation energies EA(Dκ) of 30.3 and 30.9 kJ mol−1 for [C2mim]N(CN)2 cation and anion, respectively. In addition to the comparable activation energy, the overall diffusion coefficients are very similar for C2mim+ and N(CN)2− as visible in Fig. 3a. This finding argues against the theory of jumping ions into void cages as the cation C2mim+ has more than three times the volume of N[CN]2− (see ESI†) and should consequently be less mobile than the anions which is obviously not the case.
For the slower triflate system [C2mim]OTf, the activation energies are higher with 35.7 kJ mol−1 for the cation and 37.4 kJ mol−1 for the anion. All activation energies are collected in Table 1. The higher activation barrier results in slower diffusion coefficients for the triflate anions. This finding correlates with the PMF in Fig. 2b. The PMFs between cations and anions as well as between the anions are lower for the [C2mim]OTf system meaning stronger interactions compared to the [C2mim]N(CN)2 system. The diffusional activation barrier EA(Dκ) for C2mim+ in the two systems differ significantly, indicating a strong impact of the counter-ions. Although chemists tend to explain all the properties of a compound on the topology and properties of single molecules, i.e. “…the anion has a large impact on…”, one always has to keep in mind the collective network of the cations and anions in Fig. 2c. Each cation and each anion is surrounded by a multitude of other ions, not just one counter-ion. The single-particle diffusion coefficients are influenced by long-range interactions resulting in a dependence on the simulation box size, as shown in eqn (10). These long-range interactions last longer than the first solvation shell as the correction term is still significant in our simulation boxes with box sizes larger than 60 Å.
Table 1 Activation energies for single-particle dynamics (diffusion and single-particle rotation) and collective dynamics (conductivity and collective rotation) for [C2mim]N(CN)2 and [C2mim]OTf
|
|
|
[C2mim]N(CN)2 |
[C2mim]OTf |
|
E
A/kJ mol−1 |
E
A/kJ mol−1 |
| Single-particle |
D+ |
30.3 |
35.7 |
| D− |
30.9 |
37.4 |
|
τ
μμ
−
|
31.2 |
35.2 |
|
τ
μμ
+
|
28.8 |
33.3 |
|
τ
u1
|
28.9 |
32.8 |
|
τ
u2
|
28.5 |
33.5 |
|
τ
u3
|
28.6 |
32.9 |
| Collective |
σ
|
23.2 |
32.7 |
|
σ
+
|
23.3 |
32.6 |
|
σ
−
|
23.2 |
32.9 |
|
σ
++
|
23.3 |
30.4 |
|
σ
+−
|
23.3 |
29.5 |
|
σ
−−
|
23.1 |
36.9 |
|
τ
MM++
|
25.3 |
20.0 |
|
τ
MM+−
|
22.7 |
|
|
τ
MM−−
|
24.8 |
24.4 |
|
η
|
27.5 |
30.1 |
A similar misconception of locality concerns the ionicity103 of ionic liquids. Using the diffusion coefficients one may compute the Nernst–Einstein conductivity σNE (see eqn (14)). However, it turns out that σNE–values overestimate the actual conductivity of ionic liquids by a factor 1/(1 − Δ) of roughly two, which is also the case for our results (see ESI†). A common intuitive explanation is the association and dissociation of ion pairs. If one cation and one anion form an ion pair, the aggregate will not contribute to the conductivity. Consequently, the ionic liquid was decomposed into “free” ions and ions in ion pairs. In this context, the ionicity characterized by (1 − Δ) is the ability of the ion pair to dissociate.103–105 However, MD simulations reveal that several anions and cations surround each cation with varying numbers. Consequently, it would be difficult to define ion pairs. For example, in Fig. 2c the cation is surrounded by several anions. Which of these anions should one pick for an ion pair? Also, one anion may be closer to two different cations than any other anion. Which cation forms the ion pair with that anion? Hollóczki and co-workers also pointed out that the concept of “free” ions is invalid.106 If a cation and an anion move apart, they will immediately find new partners. Kirchner et al. also remarked that larger (non-)neutral clusters would also reduce the number of charge carriers.107 Hence, ionicity is not the association and dissociation of one ion pair. In fact, the reduction of the conductivity is a collective effect. The movement of all the ions in Fig. 2c interferes with the movement of every single ion.
3.2.2 Single-particle rotation.
C2mim+ is an asymmetric rotor. Thus, three orthogonal body-fixed axes ![[u with combining right harpoon above (vector)]](https://www.rsc.org/images/entities/i_char_0075_20d1.gif) were defined as shown in Fig. 3e to track how C2mim+ rotation time varies with direction: Table S6 of the ESI† collects the average single-particle rotational relaxation times calculated for the ion dipole axes and the three C2mim+ body-fixed axes. Overall, [C2mim]N(CN)2 exhibits faster dynamics than [C2mim]OTf. The dipole orientations of the anions relax faster than those of the cations. Regarding the C2mim+ body-fixed axes, 1 describing the longest molecular dimension relaxes significantly slower than the other two axes, which relax roughly equally.
were defined as shown in Fig. 3e to track how C2mim+ rotation time varies with direction: Table S6 of the ESI† collects the average single-particle rotational relaxation times calculated for the ion dipole axes and the three C2mim+ body-fixed axes. Overall, [C2mim]N(CN)2 exhibits faster dynamics than [C2mim]OTf. The dipole orientations of the anions relax faster than those of the cations. Regarding the C2mim+ body-fixed axes, 1 describing the longest molecular dimension relaxes significantly slower than the other two axes, which relax roughly equally.
All molecular rotations behave according to Arrhenius:
| |  | (33) |
with 1/
τμμκ(
T) as the relaxation rate and 1/
τμμκ as the pre-exponential limiting relaxation rate.
25 The Arrhenius plot resulting from data in Table S6 of the ESI
† is shown in
Fig. 3c and d.
Similar to translational diffusion, the rotational activation energy is lower for the [C2mim]N(CN)2 system than for the [C2mim]OTf one. In this case, the energetic difference of the two systems is about 4 kJ mol−1. While the cationic rotational relaxation times depend strongly on the axis in question, the activation energies of all of them are very similar, differing only by 0.4 k J mol−1 for [C2mim]N(CN)2 and 0.7 kJ mol−1 for [C2mim]OTf. These close activation energies within each ionic liquid (as visible by the almost parallel lines in Fig. 3c and d) argue for a general underlying origin of the single-particle rotation. In fact, the activation energy of the collective viscosity of these systems is only slightly lower in Table 1. It seems that all ions share a similar medium in which they rotate. However, the anions have a higher rotational activation energy of 2.4 kJ mol−1 (N(CN)2− system) and 1.9 kJ mol−1 (OTf− system) in both systems than the cations (see Table 1) which may be due to additional minor local cage effects.
Single-particle translation and rotation are coupled, as demonstrated by the linear trends for all ions in Fig. 3f. As the activation energies in Table 1 are similar, the temperature dependence of the product of the diffusion coefficients and rotational relaxation constants cancels out
| |  | (34) |
and results in lines through the origin in
Fig. 3f for each species
κ. This coupling between single-particle rotation and diffusion was also reported for supercooled colloidal fluids sharing similar viscosities as our systems.
49 At higher viscosities the translational diffusion coefficients were faster compared to the rotational diffusion coefficients. The linear relationship between
Dκ and (
τμμκ)
−1 can also be deduced from the combination of the Stokes–Einstein and Stokes–Einstein–Debye equation in hydrodynamic theory.
108,109 However, the corresponding hydrodynamics radii for our ionic liquids are unphysically low and question the validity of these equations for ionic liquids.
109 Nevertheless, the observed linear trend is independent of these doubts.
3.2.3 Collective dynamics.
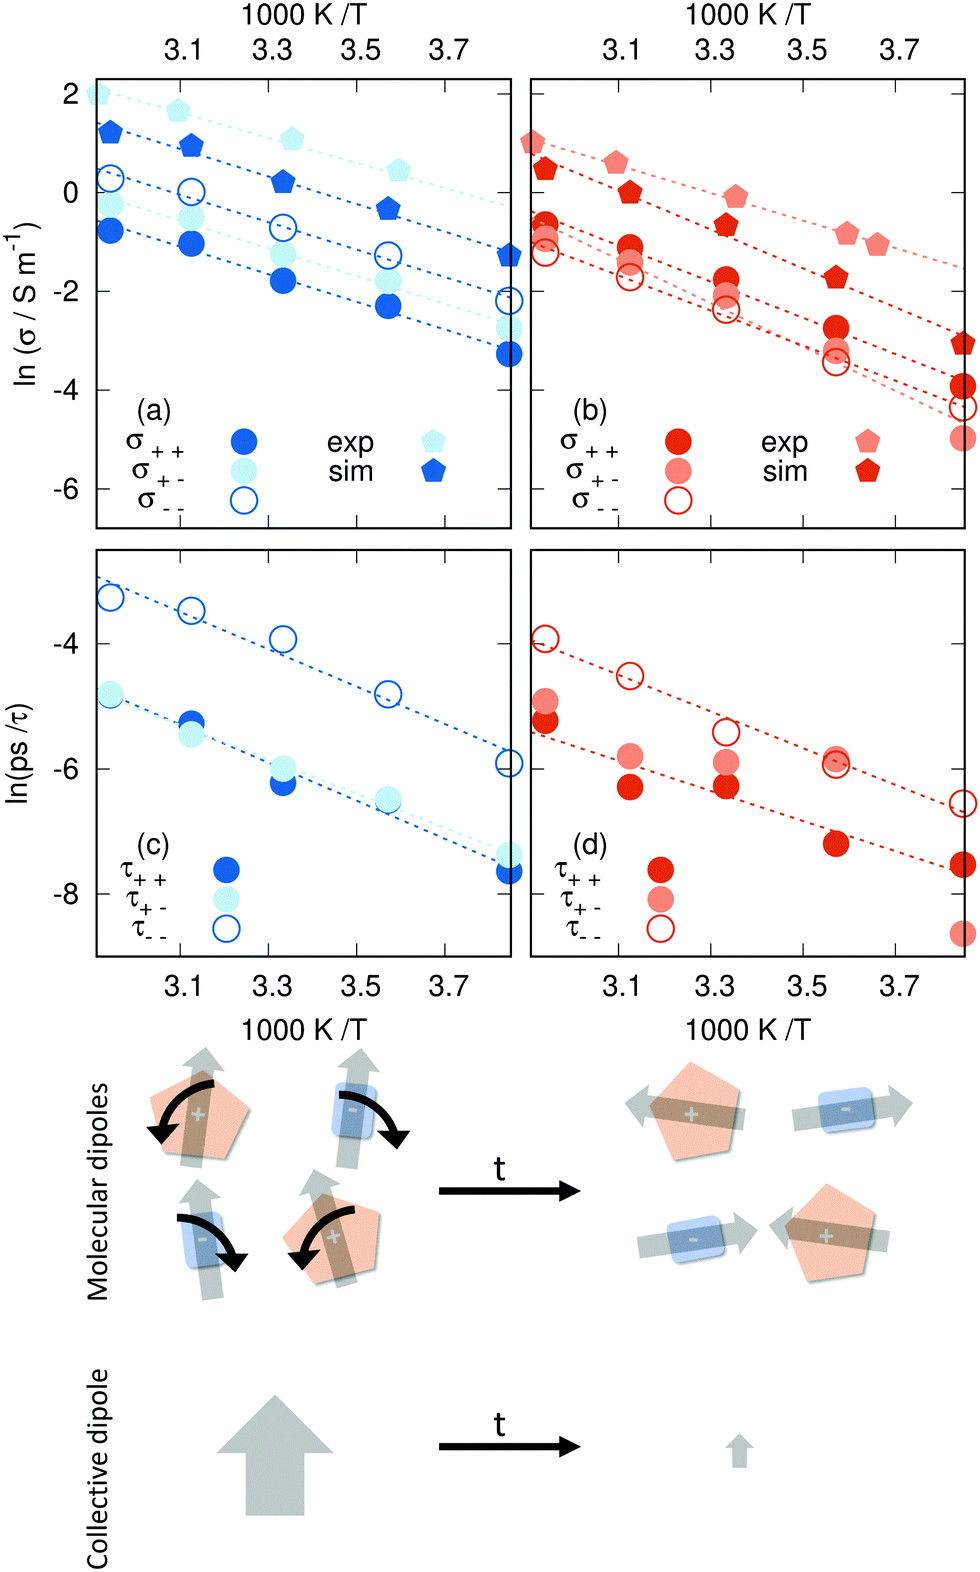
As shown in Fig. 4 [C2mim]N(CN)2 exhibits a greater conductivity than the [C2mim]OTf system, which goes hand in hand with the greater translational mobility shown in the previous section. The contribution σκ(T) of each species κ consists of an auto-correlation and a cross-term (see eqn (17)). As this cross-term shows up for the cationic and anionic contribution, we compare the relative importance of the ions for the conductivity based on the auto-correlation contributions σκκ(T). In the N(CN)2-based IL, the anion contributes more strongly than the cation as detected by σ−−vs. σ++. The same was found true in a comprehensive conductivity study for a coarse-grained model of [C2mim]N(CN)2 and [C2mim]BF4.85 However, for [C2mim]OTf, we report for the first time that the cation contributes more to the total conductivity than the anion. This, coupled with the observation that both the diffusion coefficient and the conductivity of the shared cation is reduced in [C2mim]OTf, reinforces the importance of carefully considering the effect of the counter-ion in ILs.
 |
| | Fig. 4 Arrhenius plots of the collective dynamics: (a) conductivity in [C2mim]N(CN)2, (b) conductivity in [C2mim]OTf, (c) collective rotation in [C2mim]N(CN)2, and (d) collective rotation in [C2mim]OTf. The experimental data from ref. 101 and 110 agree reasonably well with other results. The bottom panel sketches the different relaxation of single-particle and collective dipolar rotations. | |
Like diffusion, our ionic liquids conform to Arrhenius' law:111
| |  | (36) |
where
σ stands for the pre-exponential coefficient, not to be confused with the static conductivity at temperature
T (here
σ(
T)). Other experimental studies argue that the thermal behavior of ionic matter,
31,45 including the ionic liquid [C
2mim]OTf,
112 follows the more complex Vogel–Fulcher–Tammann activation behavior, which proposes a curve rather than a linear context including saturation effects limiting the ionic conductivity at high temperatures. Petrowsky
et al. used a compensated Arrhenius formalism taking into account the temperature-dependence of the static dielectric constant.
113 In this study, Arrhenius' law already fits the data points well, though this may be due to the limited temperature range.
Fig. 4a and b display the Arrhenius plots both for the total and the partial conductivities, along with experimental data. The activation energies for charge transport listed in
Table 1 are 23.2 kJ mol
−1 for the [C
2mim]N(CN)
2 system and 32.7 kJ mol
−1 for the [C
2mim]OTf system. Overall, activation energies for the conductivity are significantly lower than for the diffusion, in particular in the case of [C
2mim]N(CN)
2. It seems that swimming against the stream is harder for a single ion than following it. The lower activation energy
EA(
σ) compared to
EA(
Dκ) has additional consequences: increasing the temperature results in decreasing values of (1 −
Δ). However, this finding casts further doubt on the concept of ionicity as the dissociation of the ion pair should increase with increasing temperature.
The faster system is less sensitive to temperature, following what we found for translational motion. For the N(CN)2-system, the partial conductivity activation energies do not deviate far from the total activation energy (0.2 kJ mol−1 at most) while the OTf-system exhibits greater diversity (maximum deviation 4.2 kJ mol−1). In the case of [C2mim]OTf, the deviating partial conductivity is that of the cation–anion cross-correlation (σ+−), which is also the least linear of all examined data sets. This indicates stronger interaction with a complex temperature behavior between C2mim+ and OTf− anions than N(CN)2−. Note by the different offset of the partial conductivity Arrhenius plots that the value of the theoretical maximum conductivity σ does vary for the different contributions. As in the case of the diffusion coefficients, the conductivity is underestimated as well when compared to experimental data.101,110 While the activation energies agree well for [C2mim]N(CN)2, there is a considerable deviation in the case of [C2mim]OTf, where experimental values hint at a significantly lower energy barrier, similar to that of [C2mim]N(CN)2. Arguably the bulkier triflate anion hinders the mobility of both cations and anions, an effect that is overestimated in the trajectories. One possible explanation of this phenomenon is the relatively high partial charge density of the SO3 moiety, leading to aggregation that polarizability cannot counteract.
The values reported for the longest relaxation constant τ1 (see eqn (27)) show the expected Arrhenius behavior in Fig. 4c and d, with the possible exception of the cross-correlation between C2mim+ and OTf−. For the other parameters, such linear relationships are found only sporadically (cation–anion cross-correlation for τ2 in the case of [C2mim]N(CN)2 and anion–anion correlation for τ3 in the case of [C2mim]OTf). This suggests that the slower modes of relaxation (e.g. molecular reorientation) are indeed temperature-dependent, whereas the faster molecular motions, such as rattling in a cage where ions do not interact with neighboring clusters, are not (such a cage is depicted in Fig. S2 and S3 of the ESI†). Some of the τ parameters reported here might stem from a combination of both fast and slow processes, hence the occasional linear relationship for the second and third exponential fit. The slower collective rotations (τ1) of both the self- and the cross-correlations appear faster for [C2mim]N(CN)2 than for [C2mim]OTf in accordance with the molecular dipole rotations, although some anomalies do occur, such as in the case of cation–anion correlations in [C2mim]OTf (see Fig. 4d).
Based on our finding, we apply the Arrhenius-fitting only to the longest relaxation time constant τ1(T) = τMM(T):
| |  | (37) |
The index MM denotes the relaxation of the collective dipole moment
D.
τMM is the temperature-independent fit parameter. The corresponding activation energies
EA(
τMM) are given in
Table 1. Overall the activation energies are comparable to those of medium chain alcohol (
n > 3) or ethylene glycol.
114,115 The activation energies of the single-particle dynamics (diffusion and molecular rotation) are higher than the corresponding values for the collective dynamics (conductivity and collective rotation).
As shown in eqn (28) the correlation function of the collective dipole moment contains the correlation functions of the single, molecular dipole moments as well as their cross-correlations which are negative in both ionic liquid systems (see ESI†). Consequently, the average collective time relaxation constants τMM are lower than the corresponding τμμ as shown in Tables S6 and S7 of the ESI.† However, the cross-correlation term in eqn (28) has a much more significant amplitude in case of [C2mim]OTf. Hence, the discrepancy between single-particle and collective behavior is stronger and applies to both the average relaxation times and the activation energies.
Faster collective than single-particle dynamics is only possible via a strong ion network with long-range interactions. This situation is sketched at the bottom panel of Fig. 4. The individual molecular dipoles (illustrated by the gray arrows) may rotate by a small angle. This usually has minor effects on the relaxation of the correlation functions of the single-particle rotations. However, the consequences for the relaxation of the collective dipole moment may be quite dramatic. Since the collective dipole moment vector is the sum of the individual molecular dipole vectors, these small rotations in different directions lead to a vanishing collective dipole. A prerequisite for this process is strong interactions between the cations (orange) and anions (blue).
3.2.4 Dielectric relaxation spectra.
Fig. 5 depicts the dielectric relaxation spectra obtained from both systems at different temperatures. Note that permittivity ε(ω) and dielectric conductivity ϑ0(ω) sum up to the complete spectrum of the generalized dielectric constant, Σ0(ω) as shown in eqn (31). The static values Σ0(0) are 13 ± 4 and 15 ± 3 for [C2mim]N(CN)2 and [C2mim]OTf, respectively.
 |
| | Fig. 5 Absorptive (imaginary) part of the dielectric relaxation spectra of [C2mim]N(CN)2 (left panels) and [C2mim]OTf (right panels) with a logarithmic frequency axis. | |
Frech and co-workers developed the model of the compensated Arrhenius behavior for the temperature dependence of various properties.25,27 In addition to the temperature-dependent exponential exp(−EA/(NAkBT)), they assumed that the prefactor is a function of the temperature-dependent dielectric constant, i.e. A = f(Σ0(T,ω = 0)). However, our simulations do not show a temperature trend for the static generalized dielectric constant, and both static values are very similar. Consequently, our results are not suited to discuss this model.
The high standard deviations of Σ0(0) are due to the tricky evaluation of the dielectric conductivity contribution. Interestingly, although the overall static dielectric constant is similar, the importance of the permittivity ε(0) and dielectric conductivity ϑ0(0) is completely different in the two IL systems. As already visible by the peak areas, the dielectric conductivity (ϑ0(0) = 10.7 ± 3.5) in [C2mim]N(CN)2 overwhelms the contribution of the permittivity (ε(0) =2.3 ± 0.3). In the case of [C2mim]OTf, both contributions are more evenly distributed, as shown in the right part of Fig. 5. The permittivity is ε(0) = 8.4 ± 0.2 and the dielectric conductivity ϑ0(0) = 6.9 ± 2.6.
In the case of [C2mim]N(CN)2 the small permittivity ε(ω) broadens with increasing temperature. Only at the lowest temperature is it responsible for the peak at the lowest frequency. At all other temperatures, the dielectric conductivity determines the lowest peak position. As the rotational peak at the lowest temperature is determined by τ1 = τMM of the cations and anions, an Arrhenius behavior indicated by the dashed line is observed even though the overall static permittivity does not show a temperature trend. It seems that the τ2 and τ3 contributions counteract to some extent the Arrhenius temperature dependence of τ1. This finding is also following experimental dielectric loss spectra of ionic liquids reported in ref. 47 and 48. Three relaxation processes contributing to the dielectric loss spectra have been reported in the former reference. Only the slowest one shows actual temperature-dependent behavior, which is identical to the observations of the collective rotations of both ILs. The situation for [C2mim]OTf is less clear, and the orange dashed line in Fig. 5 is only tentative. This can be easily explained by the irregular behavior of τMM for cation–cation and cation–anion relaxation in Fig. 4d. In particular, the cross-correlation between cations and anions does not show an Arrhenius temperature dependence.
The position of the high-frequency peak between 1 and 10 THz is not affected by temperature for either ε(ω) or ϑ0(ω) (grey dashed lines), confirming the findings of Table S7 of the ESI† regarding τ2 and τ3. This frequency regime is usually not reported in experimental measurements due to difficult experimental setup. An explanation of both kinds of behaviors (temperature-dependent at low frequencies and temperature-independent at high frequencies) is given by considering the effect of the different modes of relaxation. At longer time scales, the dynamics of both systems are influenced by the viscosity and hence by the Arrhenius relationship. At very short time scales, the dynamics are dominated by the libration of ions in their cages, leading to the peak at 3 THz. Since the structure of these cages exhibits only a marginal, linear change with temperature, as shown by the various radial distribution functions in Section 3.1, the corresponding librational motion is not expected to show Arrhenius behavior.
Both ionic liquid systems show an Arrhenius-like behavior for the low-frequency part and an almost temperature-independent high-frequency part, although the proportion of the permittivity ε(ω) and dielectric conductivity ϑ0(ω) is very different. In particular, the different strength of the frequency-dependent ϑ0(ω) does not change the temperature independence of the cage librations arguing for a general feature of ionic liquids.
4 Conclusions
In this study, various properties and their thermal activation were investigated for two ionic liquids sharing the same cation species: [C2mim]N(CN)2 and [C2mim]OTf. Both anion species are weakly coordinating and much smaller than the cations: C2mim+ is roughly 50 Å3 larger than OTf− which is roughly 50 Å3 larger than N(CN)2−. Applying Voronoi tessellation does yield not only temperature-dependent molecular volumes but also volumes for the first solvation shell around each molecule.
The different size of the ions explains that the position of the first maximum of the cation/anion radial distribution function is smaller than for the cation/cation radial distribution function. Nevertheless, the concentration of the cations in the first solvation shell around the cations is larger than that of the anions. Consequently, the common picture of alternating cation and anion shells seems not to be true. The radial distribution functions do not show a significant temperature trend. However, the Voronoi volume of the ionic species increases linearly but very moderately with temperature. As a result, the size of the ion cages does not change very much.
In contrast to the linear temperature dependence of the structure, the dynamics increase exponentially with temperature. As a result, our simulations show that diffusion, conductivity, single-particle, and collective rotation of the ionic species strictly adhere to an Arrhenius-like behavior. Although the activation energies differ in the two ionic liquid systems, they are similar for cations and anions within an ionic liquid. This holds true for the diffusion coefficients, single-particle rotations, and the contributions to the conductivity and argues for the temperature control of the viscosity. The dielectric spectra show both temperature trends: viscosity-controlled dynamics show Arrhenian-like temperature dependence in the low-frequency regime. At high frequency, the structure of the ion cages is not significantly changed by the temperature, and thus the relaxation shows no temperature trend at all.
Our findings indicate that ionic liquids are more than just associated or dissociated ion pairs. Collectivity is a key factor in understanding their properties. This interpretation is confirmed by the faster collective rotations and the lower activation barriers for collective observables. Consequently, the interpretation of experimental results should not be restricted to the chemical formula of one cation and one anion but also keep in mind that interactions in ionic liquids are long-ranged. This way, cations may interact with a multitude of other anions as well as other cations.
Conflicts of interest
There are no conflicts to declare.
References
- P. Wasserscheid and W. Keim, Angew. Chem., Int. Ed., 2000, 39, 3772–3789 CrossRef CAS PubMed.
- H. Weingärtner, Angew. Chem., 2008, 120, 664–682 CrossRef.
- Z. Yang and W. Pan, Enzyme Microb. Technol., 2005, 37, 19–28 CrossRef CAS.
- A. F. M. Cláudio, A. M. Ferreira, M. G. Freire and J. A. P. Coutinho, Green Chem., 2013, 15, 2002–2010 RSC.
- M. Galiński, A. Lewandowski and I. Stepniak, Electrochim. Acta, 2006, 51, 5567 CrossRef.
- A. Lewandowski and A. Świderska-Mocek, J. Power Sources, 2009, 194, 601 CrossRef CAS.
- A. Lewandowski and M. Galiński, J. Phys. Chem. Solids, 2004, 65, 281 CrossRef CAS.
- A. Noda, M. A. B. H. Susan, K. Kudo, S. Mitsushima, K. Hayamizu and M. Watanabe, J. Phys. Chem. B, 2003, 107, 4024–4033 CrossRef CAS.
- H. Nakamoto and M. Watanabe, Chem. Commun., 2007, 2539 RSC.
- G. B. Appetecchi, M. Montanino and S. Passerini, ACS Symp. Ser., 2012, 1117, 67–128 CrossRef CAS.
-
H. Ohno, Electrochemical aspects of ionic liquids, John Wiley & Sons Inc., 2005 Search PubMed.
- A. I. Bhatt, I. May, V. A. Volkovich, M. E. Hetherington, B. Lewin, R. C. Thiedb and N. Ertok, J. Chem. Soc., Dalton Trans., 2002, 4532–4534 RSC.
- S. Panozzo, M. Armand and O. Stephan, Appl. Phys. Lett., 2002, 80, 679 CrossRef CAS.
- P. Wang, S. M. Zakeeruddin, I. Exnar and M. Grätzel, Chem. Commun., 2002, 2972–2973 RSC.
- J. Fuller, A. C. Breda and R. T. Carlin, J. Electroanal. Chem., 1998, 459, 29–34 CrossRef CAS.
- H. Nakagawa, S. Izuchi, K. Kuwana, T. Nukuda and Y. Aihara, J. Electrochem. Soc., 2003, 150, A695–A700 CrossRef CAS.
- A. Balducci, W. A. Henderson, M. Mastragostino, S. Passerini, P. Simon and F. Soavi, Electrochim. Acta, 2005, 50, 2233–2237 CrossRef CAS.
- J. Vila, P. Ginés, J. Pico, C. Franjo, E. Jiménez, L. Varela and O. Cabeza, Fluid Phase Equilib., 2006, 242, 141–146 CrossRef CAS.
- R. Clark, M. A. Nawawi, A. Dobre, D. Pugh, Q. Liu, A. P. Ivanov, A. J. P. White, J. B. Edel, M. K. Kuimova, A. J. S. McIntosh and T. Welton, Chem. Sci., 2020, 11, 6121–6133 RSC.
- K. R. Harris, J. Chem. Eng. Data, 2020, 65, 804–813 CrossRef CAS.
- K. R. Harris and M. Kanakubo, Faraday Discuss., 2012, 154, 425–438 RSC.
- G. Feng, M. Chen, S. Bi, Z. A. H. Goodwin, E. B. Postnikov, N. Brilliantov, M. Urbakh and A. A. Kornyshev, Phys. Rev. X, 2019, 9, 021024 CAS.
- J. Leys, M. Wübbenhorst, C. Preethy Menon, R. Rajesh, J. Thoen, C. Glorieux, P. Nockemann, B. Thijs, K. Binnemans and S. Longuemart, J. Chem. Phys., 2008, 128, 064509 CrossRef PubMed.
- S. Arrhenius, Z. Phys. Chem., 1889, 4U, 96–116 CrossRef.
- M. Petrowsky and R. Frech, J. Phys. Chem. B, 2009, 113, 16118–16123 CrossRef CAS PubMed.
- D. N. Bopege, M. Petroswky, A. M. Felshman, R. Frech and M. B. Johnson, J. Phys. Chem. B, 2011, 116, 71–76 CrossRef PubMed.
- M. Petrowsky, A. M. Fleshman and R. Frech, J. Phys. Chem. B, 2013, 117, 2971–2978 CrossRef CAS PubMed.
- H. Vogel, Phys. Z., 1921, 22, 645 CAS.
- G. S. Fulcher, J. Am. Ceram. Soc., 1925, 8, 339–355 CrossRef CAS.
- G. Tammann and W. Hesse, Z. Anorg. Allg. Chem., 1926, 156, 245–257 CrossRef CAS.
- P. Sippel, P. Lunkenheimer, S. Krohns, E. Thoms and A. Loidl, Sci. Rep., 2015, 5, 13922 CrossRef CAS PubMed.
- M. Qi, G. Wu, Q. Li and Y. Luo, Radiat. Phys. Chem., 2008, 77, 877–883 CrossRef CAS.
- K. Nakamura, T. Saiwaki and K. Fukao, Macromolecules, 2010, 6092–6098 CrossRef CAS.
- M. H. Ghatee, M. Bahrami, N. Khanjari, H. Firouzabadi and Y. Ahmadi, J. Chem. Eng. Data, 2012, 57, 2095–2101 CrossRef CAS.
- H. Watanabe, T. Umecky, N. Arai, A. Nazet, T. Takamuku, K. R. Harris, Y. Kameda, R. Buchner and Y. Umebayashi, J. Phys. Chem. B, 2019, 123, 6244–6252 CrossRef CAS PubMed.
- A. F. Bouarab, J.-P. Harvey and C. Robelin, Phys. Chem. Chem. Phys., 2021, 23, 733–752 RSC.
- M. Kähn, A. Seduraman and P. Wu, J. Phys. Chem. B, 2008, 112, 13849–13861 CrossRef PubMed.
- O. Borodin and G. D. Smith, J. Phys. Chem. B, 2006, 110, 11481–11490 CrossRef CAS PubMed.
- C. Rey-Castro and L. F. Vega, J. Phys. Chem. B, 2006, 110, 14426–14435 CrossRef CAS PubMed.
- J. J. Fillion and J. F. Brennecke, J. Chem. Eng. Data, 2017, 62, 1884–1901 CrossRef CAS.
- L. Grunberg and A. H. Nissan, Nature, 1949, 164, 799–800 CrossRef CAS PubMed.
- J. Sangoro, C. Iacob, A. Seghei, S. Naumov, P. Galvosas, J. Kärger, C. Wespe, F. Bordusa, A. Stoppa, J. Hunger, R. Buchner and F. Kremer, J. Chem. Phys., 2008, 128, 214509 CrossRef CAS PubMed.
- A. Šantić, W. Wrobel, M. Mutke, R. D. Banhatti and K. Funke, Phys. Chem. Chem. Phys., 2009, 11, 5930–5934 RSC.
- W. Xu, E. I. Cooper and C. A. Angell, J. Phys. Chem. B, 2003, 107, 6170–6178 CrossRef CAS.
- M. Aniya and M. Ikeda, Nanomaterials, 2019, 9, 911 CrossRef CAS PubMed.
- S. Seki, Y. Ohno, Y. Kobayashi, H. Miyashiro, A. Usami, Y. Mita, H. Tokuda, M. Watanabe, K. Hayamizu, S. Tsuzuki, M. Hattori and N. Terada, J. Electrochem. Soc., 2007, 154, A173 CrossRef CAS.
- J. Hunger, A. Stoppa, R. Buchner and G. Hefter, J. Phys. Chem. B, 2009, 113, 9527–9537 CrossRef CAS PubMed.
- J. Hunger, T. Sonnleitner, L. Liu, R. Buchner, M. Bonn and H. J. Bakker, J. Phys. Chem. Lett., 2012, 3, 3034–3038 CrossRef CAS PubMed.
- K. V. Edmond, M. T. Elsesser, G. L. Hunter, D. J. Pine and E. R. Weeks, Proc. Natl. Acad. Sci. U. S. A., 2012, 109, 17891–17896 CrossRef CAS PubMed.
- M. Salanne, Phys. Chem. Chem. Phys., 2015, 17, 14270–14279 RSC.
- D. Bedrov, J.-P. Piquemal, O. Borodin, A. D. MacKerell, B. Roux and C. Schröder, Chem. Rev., 2019, 119, 7940–7995 CrossRef CAS PubMed.
- D. R. MacFarlane, J. Golding, S. Forsyth, M. Forsyth and G. B. Deacon, Chem. Commun., 2001, 1430–1431 RSC.
- L. E. Ficke, H. Rodríguez and J. F. Brennecke, J. Chem. Eng. Data, 2008, 53, 2112–2119 CrossRef CAS.
- T. Taylor, M. Schmollngruber, C. Schröder and O. Steinhauser, J. Chem. Phys., 2013, 138, 204119 CrossRef PubMed.
- M. Schmollngruber, V. Lesch, C. Schröder, A. Heuer and O. Steinhauser, Phys. Chem. Chem. Phys., 2014, 17, 14297–14306 RSC.
- E. Heid, B. Docampo-Alvarez, L. M. Varela, K. Prosenz, O. Steinhauser and C. Schröder, Phys. Chem. Chem. Phys., 2018, 20, 15106 RSC.
- P. Honegger, V. Overbeck, A. Strate, A. Appelhagen, M. Sappl, E. Heid, C. Schröder, R. Ludwig and O. Steinhauser, J. Phys. Chem. Lett., 2020, 11, 2165–2170 CrossRef CAS PubMed.
- D. M. Leitner, M. Havenith and M. Gruebele, Int. Rev. Phys. Chem., 2010, 25, 553–582 Search PubMed.
- L. Huang and B. Roux, J. Chem. Theory Comput., 2013, 9, 3543–3556 CrossRef CAS PubMed.
- K. Vanommeslaeghe and A. D. MacKerell Jr., J. Chem. Inf. Model., 2012, 52, 3144–3154 CrossRef CAS PubMed.
- K. Vanommeslaeghe and A. D. MacKerell Jr., J. Chem. Inf. Model., 2012, 52, 3155–3168 CrossRef CAS PubMed.
- T. M. Becker, D. Dubbeldam, L.-C. Lin and T. J. H. Vlugt, J. Comput. Sci., 2016, 15, 86–94 CrossRef.
- B. R. Brooks, C. L. Brooks III., A. D. MacKerell Jr., L. Nilsson, R. J. Petrella, B. Roux, Y. Won, G. Archontis, C. Bartels, S. Boresch, A. Caflisch, L. Caves, Q. Cui, A. R. Dinner, M. Feig, S. Fischer, J. Gao, M. Hodoscek, W. Im, K. Kuczera, T. Lazaridis, J. Ma, V. Ovchinnikov, E. Paci, R. W. Pastor, C. B. Post, J. Z. Pu, M. Schaefer, B. Tidor, R. M. Venable, H. L. Woodcock, X. Wu, W. Yang, D. M. York and M. Karplus, J. Comput. Chem., 2009, 30, 1545 CrossRef CAS PubMed.
- J.-P. Ryckaert, G. Ciccotti and H. J. C. Berendsen, J. Comput. Phys., 1977, 23, 327 CrossRef CAS.
- G. Lamoureux and B. Roux, J. Chem. Phys., 2003, 119, 3025 CrossRef CAS.
- S. Nose, J. Chem. Phys., 1984, 81, 511 CrossRef CAS.
- W. G. Hoover, Phys. Rev., 1985, A31, 1695 Search PubMed.
- T. Darden, D. York and L. Pedersen, J. Chem. Phys., 1993, 98, 10089 CrossRef CAS.
- U. Essmann, L. Perera, M. L. Berkowitz, T. Darden, H. Lee and L. Pedersen, J. Chem. Phys., 1995, 103, 8577 CrossRef CAS.
- M. S. Green, J. Chem. Phys., 1954, 22, 398–413 CrossRef CAS.
- B. Hess, J. Chem. Phys., 2002, 116, 209–217 CrossRef CAS.
- P. Eastman, J. Swails, J. D. Chodera, R. T. McGibbon, Y. Zhao, K. A. Beauchamp, L.-P. Wang, A. C. Simmonett, M. P. Harrigan, C. D. Stern, R. P. Wiewiora, B. R. Brooks and V. S. Pande, PLoS Comput. Biol., 2017, 13, 1–17 CrossRef PubMed.
- Z. Gong and A. A. H. Padua, J. Chem. Phys., 2021, 154, 084504 CrossRef CAS PubMed.
- N. Michaud-Agrawal, E. J. Denning, T. B. Woolf and O. Beckstein, J. Comput. Chem., 2011, 32, 2319–2327 CrossRef CAS PubMed.
-
R. J. Gowers, M. Linke, J. Barnoud, T. J. E. Reddy, M. N. Melo, S. L. Seyler, D. L. Dotson, J. Domanski, S. Buchoux, I. M. Kenney and O. Beckstein, Proceedings of the 15th Python in Science Conference, 2016, pp. 102-109.
- V. Zeindlhofer, M. Berger, O. Steinhauser and C. Schröder, J. Chem. Phys., 2018, 148, 193819 CrossRef PubMed.
- C. H. Rycroft, Chaos, 2009, 19, 041111 CrossRef PubMed.
- W. Brostow and V. M. Castano, J. Mater. Educ., 1999, 21, 297–304 Search PubMed.
-
A. Okabe, B. Boots, K. Sugihara and S. N. Chiu, Spatial tessellations: concepts and applications of Voronoi diagrams, 1992 Search PubMed.
- J. A. van Meel, L. Filion, C. Valeriani and D. Frenkel, J. Chem. Phys., 2012, 136, 234107 CrossRef PubMed.
- G. Voronoi, J. Reine Angew. Math., 1908, 134, 198 Search PubMed.
- Y. Zhang, L. Xue, F. Khabaz, R. Doerfler, E. L. Quitevis, R. Khare and E. J. Maginn, J. Phys. Chem. B, 2015, 119, 14934–14944 CrossRef CAS PubMed.
- I.-C. Yeh and G. Hummer, J. Phys. Chem. B, 2004, 108, 15873–15879 CrossRef CAS.
- S. Gabl, C. Schröder and O. Steinhauser, J. Chem. Phys., 2012, 137, 094501 CrossRef PubMed.
- V. Zeindlhofer, L. Zehetner, W. Paschinger, A. Bismarck and C. Schröder, J. Mol. Liq., 2019, 288, 110993 CrossRef CAS.
- P. Honegger, M. Schmollngruber and O. Steinhauser, Phys. Chem. Chem. Phys., 2018, 20, 11454–11469 RSC.
- P. Honegger, M. Schmollngruber and O. Steinhauser, Phys. Chem. Chem. Phys., 2018, 20, 19581–19594 RSC.
- C. Schröder, J. Chem. Phys., 2011, 135, 024502 CrossRef PubMed.
- M. Sha, X. Ma, N. Li, F. Luo, G. Zhu and M. D. Fayer, J. Chem. Phys., 2019, 151, 154502 CrossRef PubMed.
- C. Schröder and O. Steinhauser, J. Phys.: Condens. Matter, 2016, 28, 344008 CrossRef PubMed.
- H. Matsuda, H. Yamamoto, K. Kurihara and K. Tochigi, J. Comput. Aided Chem., 2007, 8, 114–127 CrossRef.
- Y. Huo, S. X. Y. Zhang and P. Ma, Ind. Eng. Chem. Res., 2009, 48, 2212–2217 CrossRef CAS.
- Y. Chen, Y. Cai, K. Thomsen, G. M. Kontogeorgis and J. M. Woodley, Fluid Phase Equilib., 2020, 509, 112462 CrossRef CAS.
- A. K. Doolittle, J. Appl. Phys., 1951, 22, 1471–1475 CrossRef CAS.
- W. E. Roseveare, R. E. Powell and H. Eyring, J. Appl. Phys., 1941, 12, 669–679 CrossRef CAS.
- M. H. Cohen and D. Turnbull, J. Chem. Phys., 1959, 31, 1164–1169 CrossRef CAS.
- A. P. Abbott, ChemPhysChem, 2004, 5, 1242–1246 CrossRef CAS PubMed.
- J. C. Dyre, T. Christensen and N. B. Olsen, J. Non-Cryst. Solids, 2006, 352, 4635–4642 CrossRef CAS.
- G. Adam and J. H. Gibbs, J. Chem. Phys., 1965, 43, 139–146 CrossRef CAS.
- B. J. Alder and J. H. Hildebrand, Ind. Eng. Chem. Fundam., 1973, 12, 388–389 CrossRef.
- K. R. Harris and M. Kanakubo, J. Chem. Eng. Data, 2016, 61, 2399–2411 CrossRef CAS.
- G. Korablev, Eur. Chem. Bull., 2018, 7, 23 CrossRef CAS.
- O. Nordness and J. F. Brennecke, Chem. Rev., 2020, 120, 12873–12902 CrossRef CAS PubMed.
- H. Tokuda, S. Tsuzuki, M. Abu Bin Hasan Susan, K. Hayamizu and M. Watanabe, J. Phys. Chem. B, 2006, 110, 19593–19600 CrossRef CAS PubMed.
- D. R. macFarlane, M. Forsyth, E. I. Izgorodina, A. P. Abbott, G. Annat and K. Fraser, Phys. Chem. Chem. Phys., 2009, 11, 4962–4967 RSC.
- B. Kirchner, F. Malberg, D. S. Firaha and O. Hollóczki, J. Phys.: Condens. Matter, 2015, 27, 463002 CrossRef PubMed.
- O. Hollóczki, F. Malberg, T. Welton and B. Kirchner, Phys. Chem. Chem. Phys., 2014, 16, 16880–16890 RSC.
- M. G. Maaza, N. Giovambattista, H. E. Stanley and F. W. Starr, Phys. Rev. E: Stat., Nonlinear, Soft Matter Phys., 2007, 76, 031203 CrossRef PubMed.
- T. Köddermann, R. Ludwig and D. Paschek, ChemPhysChem, 2008, 9, 1851–1858 CrossRef PubMed.
- C. Schreiner, S. Zugmann, R. Hartl and H. J. Gores, J. Chem. Eng. Data, 2010, 55, 1784–1788 CrossRef CAS.
- H. Bloom and E. Heymann, Proc. R. Soc. London, Ser. A, 1947, 188, 392 CAS.
- H. Every, A. G. Bishop, M. Forsyth and D. R. MacFarlane, Electrochim. Acta, 2000, 45, 1279–1284 CrossRef CAS.
- M. Petrowsky, C. M. Burba and R. Frech, J. Chem. Phys., 2013, 139, 204502 CrossRef PubMed.
- S. K. Garg and C. P. Smyth, J. Phys. Chem., 1965, 69, 1294–1301 CrossRef CAS.
- R. B. Haj-Kacem, N. Ouerfelli, J. V. Herráez, M. Guettari, H. Hamda and M. Dallel, Fluid Phase Equilib., 2014, 383, 11–20 CrossRef CAS.
|
| This journal is © the Owner Societies 2022 |
Click here to see how this site uses Cookies. View our privacy policy here. 
 Open Access Article
 This Open Access Article is licensed under a Creative Commons Attribution-Non Commercial 3.0 Unported Licence
 a,
Philipp
Honegger
a,
Philipp
Honegger

 . This approach utilizes the off-diagonal elements Pαβ of the pressure tensor. However, since the autocorrelation function is usually very noisy, the cutoff of the integral has a non-negligible impact on the resulting values. A numerically more stable method is to apply periodic perturbations in form of a cosine-shaped acceleration to the system.71
 and
and  are the amplitude of the applied acceleration and the velocity profile, and lz is the length of the simulation box along the z-axis. The resulting viscosity can then be calculated as
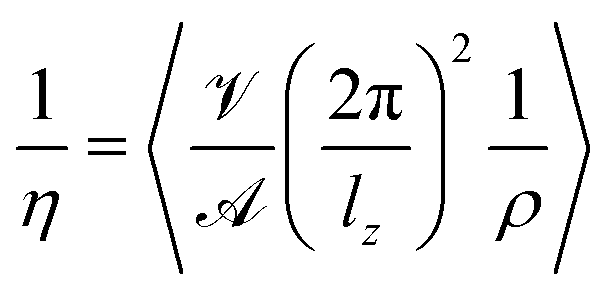


 and
and  at a given temperature T. The total number of charged particles N = N+ + N− is the sum of the number of the molecular cations and anions, qi is the charge of the ith molecule and
  where σκ(T) iterates over the cationic and anionic contributions. These contributions, in turn, consist of the ionic self-correlation as well as the cross-correlations, i.e.


 to obtain rotational information on species κ. Summing up the charged particles would yield a numerical dipole moment depending on the arbitrary center-of-origin. Thus, we have to account for molecular position explicitly. We do so by subtracting the molecular center-of-mass
 where i enumerates all N molecules and β enumerates all atoms in a given molecule i. Relaxation times were obtained upon integration of the normalized time correlation function:


 . Please note that the translational part is obtained from the second derivative of the mean-squared displacement instead of the first derivative of the auto-correlation function of the collective, translational dipole moment due to practical reasons.88

 is printed as shown in Fig. 5.