
 Open Access Article
 This Open Access Article is licensed under a
 Creative Commons Attribution 3.0 Unported Licence
Emulating proton transfer reactions in the pseudo-protic ionic liquid 1-methylimidazolium acetate
Richard
Jacobi
 ab,
Florian
Joerg
bc,
Othmar
Steinhauser
c and
Christian
Schröder
*c
ab,
Florian
Joerg
bc,
Othmar
Steinhauser
c and
Christian
Schröder
*c
aInstitute of Theoretical Chemistry, Faculty of Chemistry, University of Vienna, Währinger Straße 17, 1090 Vienna, Austria
bVienna Doctoral School in Chemistry (DoSChem), University of Vienna, Währinger Straße 42, 1090 Vienna, Austria
cDepartment of Computational Biological Chemistry, Faculty of Chemistry, University of Vienna, Währinger Straße 17, 1090 Vienna, Austria. E-mail: christian.schroeder@univie.ac.at; Tel: +43 1 4277 52711
First published on 7th April 2022
Abstract
Proton transfer reactions can enhance conductivity in protic ionic liquids. However, several proton reactions are possible in a multicomponent system of charged and neutral species, resulting in a complex reaction network. Probabilities and equilibrium concentrations of the involved species are modeled by the combination of reducible Markov chains and quantum-mechanical calculations.
1 Introduction
Ionic liquids play a promising role in future battery and fuel cell generations and can contribute positively to the current challenges of alternative and sustainable energy usage.1–3 Of particular interest are protic ionic liquids (PILs), a subclass of ionic liquids composed of a Brønsted acid and Brønsted base. These liquids can transfer a proton and form hydrogen-bonded networks resulting in high conductivities.4,5Ab initio molecular dynamics simulations are a good tool for examining proton transfer reactions, as bond breaking and formation occur naturally. In a combined NMR, IR, and ab initio study MD study on the proton transfer between carboxylates and pyridines, the proton transfer pathway was studied.6 In a recent AIMD study, Kirchner and co-workers7 found evidence for a Grotthuss diffusion mechanism in the 1-methylimidazolium acetate [Im1H]OAc system depicted in Fig. 1, which may explain the high experimental conductivity of this PIL.8,9
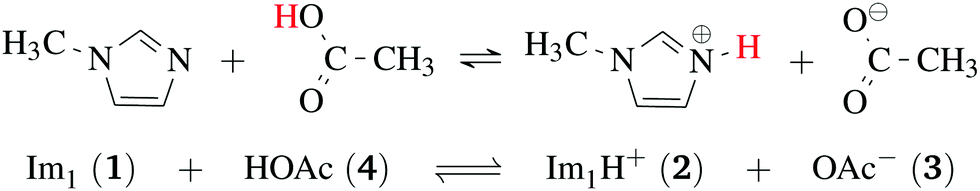 | ||
| Fig. 1 Formation of 1-methylimidazolium acetate [Im1H]OAc. Several experiments indicate that the equilibrium is on the left side.7,8,10 Strictly speaking, this fact disqualifies the mixture to be classified as an ionic liquid. However, this pseudo-PIL shows a significant conductivity arguing for significant concentration of molecules on the right hand side. | ||
As shown in Fig. 2a, Grotthuss-like proton transfer can be realized via rotating 1-methylimidazolium cations or acetic acid molecules.9 Strictly speaking, a Grotthuss mechanism requires the transfer of one proton to the molecule and the release of another proton at the same molecule. This can only be achieved via protonated acetic acid molecules H2OAc+ which were also found in the study of Kirchner and co-workers.7 In addition, proton transport via a vehicle mechanism is also possible (Fig. 2c and d). Intuitively, 1-methylimidazolium is the proton carrier in this scenario but was excluded by Umebayashi and co-workers.9 However, as neutral molecules diffuse much faster than their charged counterparts, neutral vehicle transport may also be relevant. In this case, a proton is transferred from 1-methylimidazolium to an acetate molecule. This reaction is favored compared to the back reaction (see Fig. 1). The neutral molecule diffuses through the liquid. At some point, the back reaction may take place. As a result, from step 1 to step 3, an acetate molecule moved with less electrostatic friction.
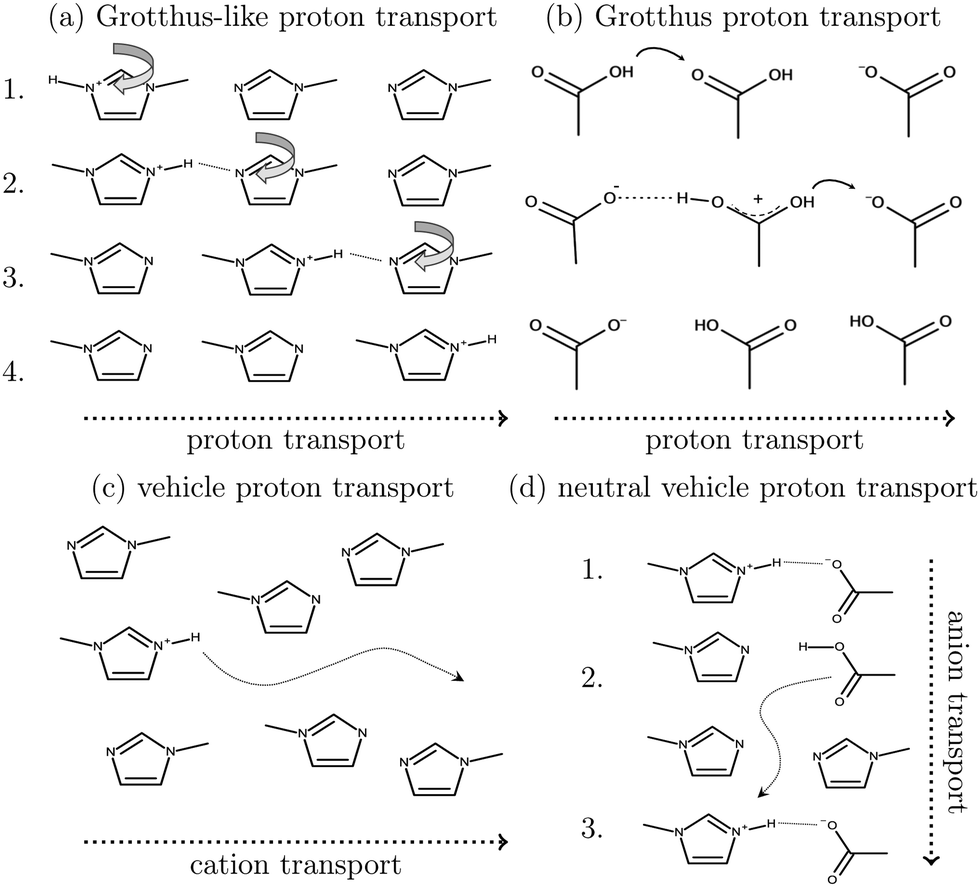 | ||
| Fig. 2 Various charge transport mechanisms for the conductivity in protic ionic liquids. Grotthuss-like proton transport (a) is also possible using a rotating acetic acid molecule. A direct Grotthuss-mechanism can be realized via protonated acetic acid molecules (b). Vehicle transport can be realized via cations (c) or neutral acetic acid (d). | ||
We would like to evaluate which of these proposed mechanisms is relevant for the conductivity in the PIL [Im1H]OAc. However, ab initio simulations are restricted to system sizes of a few ion pairs and simulation times of dozens of picoseconds, making it impossible to evaluate essential properties such as conductivity. In contrast, molecular dynamics simulations easily handle hundreds of ion pairs and simulation periods of several dozens of nanoseconds. While classical molecular dynamics simulations fail to predict dynamic properties accurately,11–13 polarizable force fields, implemented usually via point inducible dipoles,14–16 fluctuating charges17,18 or Drude oscillators,19 were established to improve accuracy, especially for dynamical properties.
As a first step for the polarizable molecular dynamics simulations involving proton transfer reactions, we have to determine the probabilities for protonation of 1-methylimidazole, acetate, and acetic acid as well as for the deprotonation of 1-methylimidazolium and (protonated) acetic acid. Consequently, we performed quantum-mechanical scans of the (de-)protonations using a polarizable continuum model to model the dielectric background of the liquid phase. However, we also want to make sure, that the ratio of components in Fig. 1 follows the experimental density data,10i.e. roughly 30% ionic and 70% neutral molecules.7,10 For that reason, we apply reducible Markov chain models to scan the complete “phase space” of possible reaction probability combinations and the resulting equilibrium concentrations.
2 Theory and methods
2.1 The network of reactions
In contrast to the rudimentary protonation scheme reported in ref. 9, we distinguish between a simple and an advanced protonation scheme (see Fig. 3) in this work: The simple protonation scheme involves proton transfer reactions between the species 1-methylimidazole (Im1, 1), 1-methylimidazolium (Im1H+, 2), acetate (OAc−, 3), and acetic acid (HOAc, 4). The advanced protonation scheme additionally includes the protonated acetic acid (H2OAc+, 5), which Kirchner and co-workers detected in AIMD simulations.7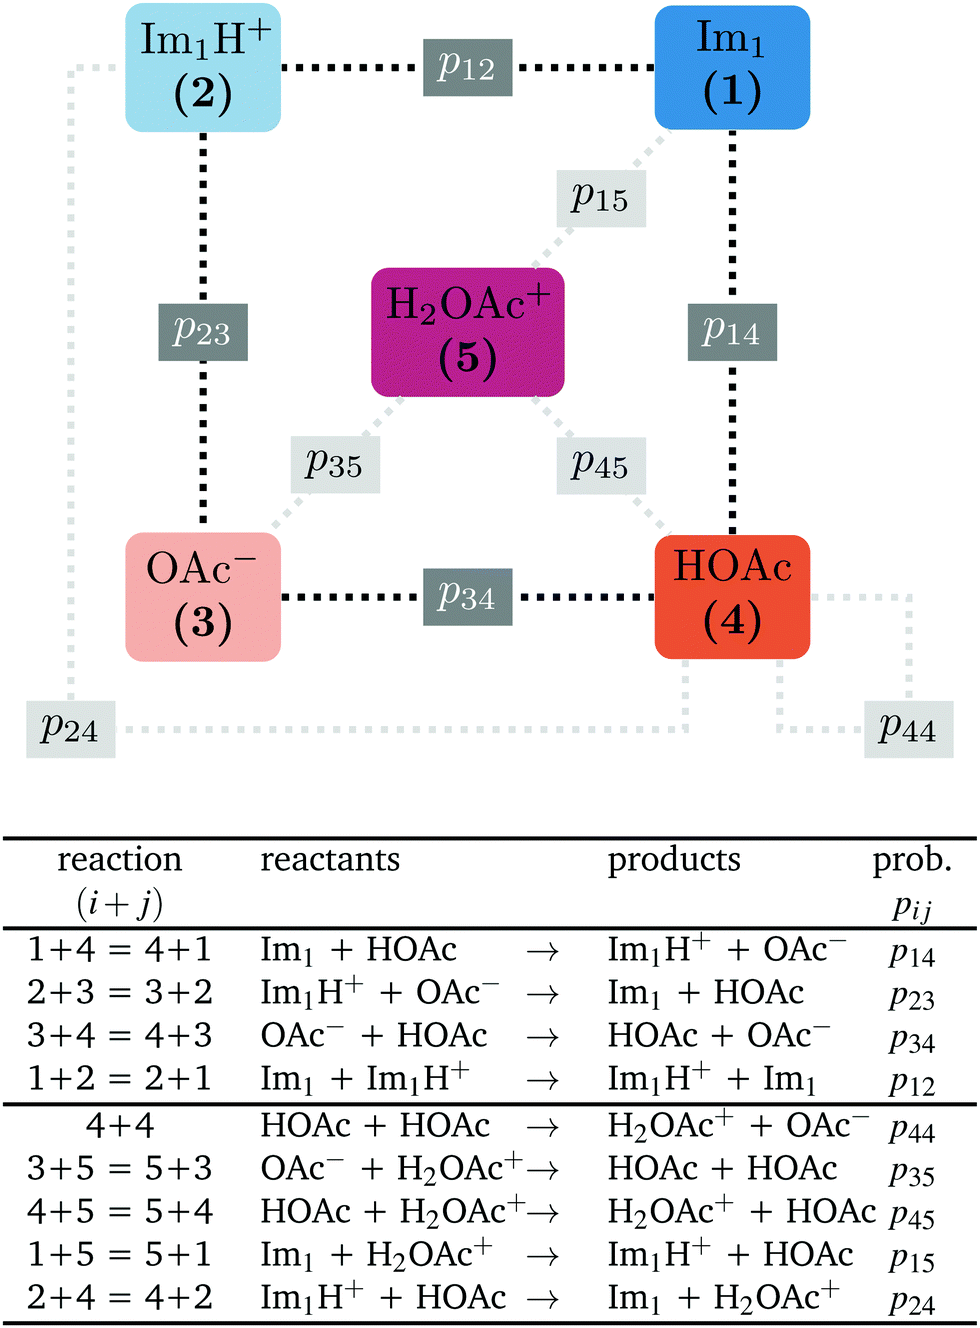 | ||
| Fig. 3 The following proton transfer reactions (i + j) are considered in this work. The first four reactions apply to the simple protonation scheme (dark gray boxes). In the advanced protonation scheme, five additional reactions are considered (light gray boxes). Please note that the numbers for the reaction (i + j) denote the reacting species. Consequently, the sequence does not play a role and (4 + 1) is not the back reaction of (1 + 4). | ||
The simple protonation scheme contains the equilibrium displayed in Fig. 1 modeled by the forward reaction (1+4) and backward reaction (2+3) in Fig. 3. Additionally, the proton exchange between acetic acid and acetate (reaction (3+4)) as well as between 1-methylimidazole and 1-methylimidazolium (reaction (1+2)) may occur. However, the last two reactions do not change the concentration of the species but may be necessary for the proton transfer mechanism (see Fig. 2). The inclusion of the protonated acetic acid H2OAc+ in the advanced protonation scheme adds five additional reactions for possible proton transfers. In particular, the reactions (4+4), (3+5), and (4+5) are essential for the Grotthuss mechanism in Fig. 2b. The reactions (1+5) and (2+4) involve the proton transfer between a carboxylic and an imidazole-based compound. Each of these reactions (i+j) has a probability pij to take place, assuming that the reacting pair already exists. However, these reactions occur simultaneously with different probabilities and mole fractions xi of the reacting partners. The complex network emerging from these reactions will result in an equilibrium distribution of the participating species.
All combinations of species 1 to 5 not mentioned in Fig. 3 (and not connect via a dashed line) do not react with each other. Consequently, their reaction probabilities pij are zero:
| p11 = p13 = p31 = p22 = p25 = p52 = p33 = p55= 0 | (1) |
2.2 Markov chain models of the simple and advanced protonation scheme
Markov chains are stochastic models predicting equilibrium distributions of the reacting species. Each molecular species i is a Markov state in the present case. Its population changes due to the (de-)protonation reactions in Fig. 3. For example, the protonation of Im1 during the reaction (1+4) yields Im1H+. At the same time HOAc is deprotonated and turned into OAc−. Consequently, the mole fractions of x1 and x4 decrease and x2 and x3 increase.Quite generally, the transition rate  emerges from the sum of products of the probability to find a suitable reacting partner xj and the probability pij that the reaction (i+j) actually takes places:
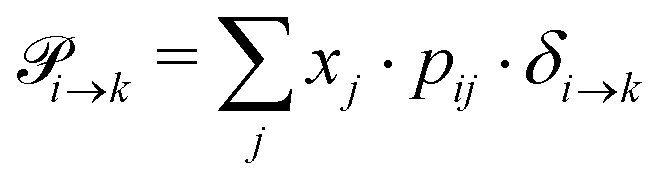 | (2) |
The transition rates  are not directly visible in Fig. 3 as only the reacting partners i and j are connected via dashed lines. Consequently, Fig. 3 is not a classical picture of a Markov chain which is given instead in Fig. 4. In the simple protonation scheme, all four species have exactly two channels to react (labeled by the dark gray boxes in Fig. 3). Therefore, the sum in eqn (2) consists of two contributions of each
  . This changes for the advanced protonation scheme. All species except for HOAc now have three reaction pathways (see Fig. 3). However, HOAc now has five reaction pathways {(1+4),(3+4),(4+4),(4+5),(2+4)} and seems to be the most important molecule at first sight. This leads to a little bit more complex transition rates in the advanced model compared to
  of the simple model due to the additional contributions (light gray boxes in Fig. 3).
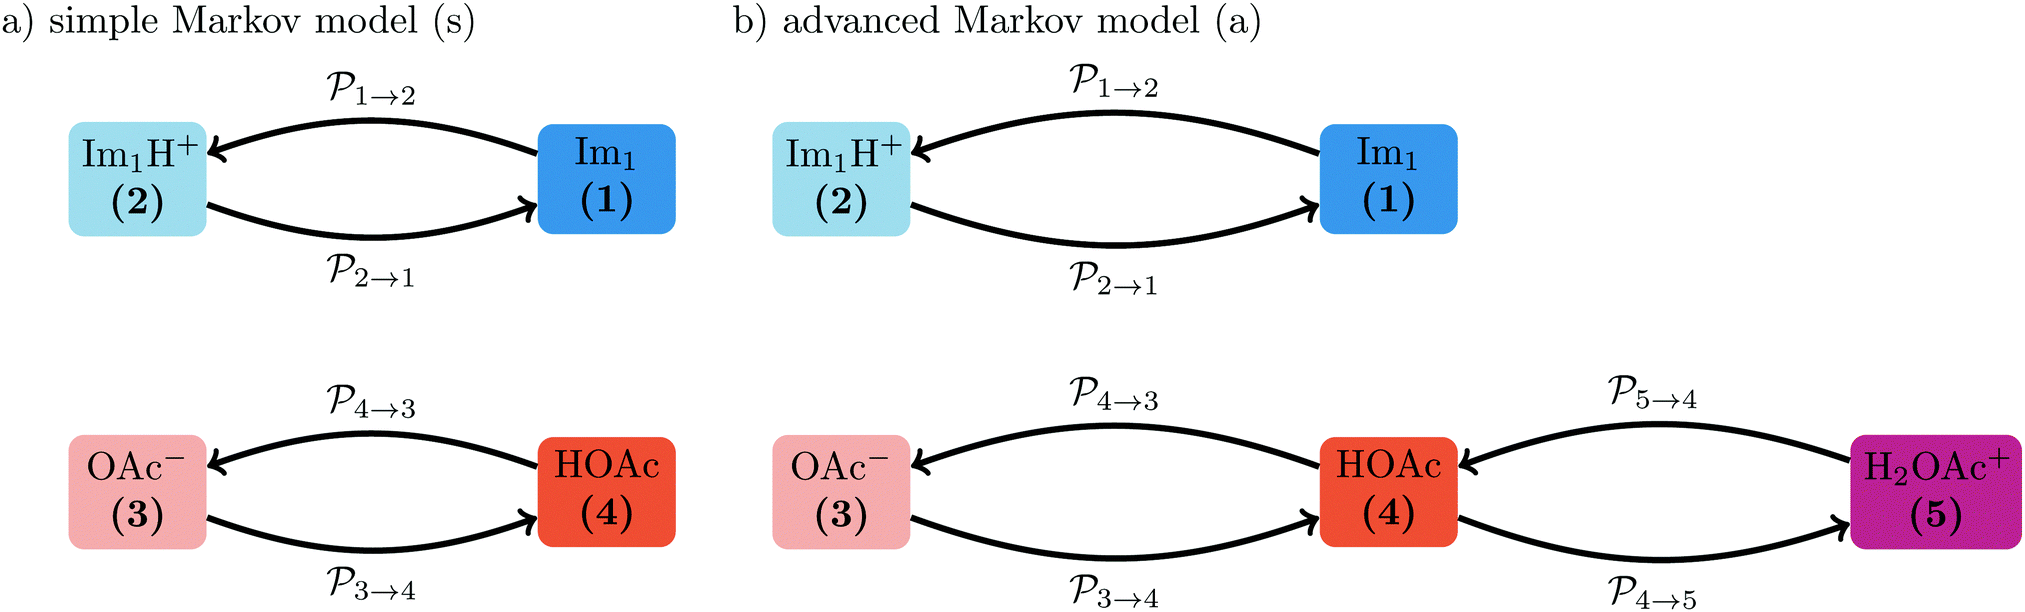 | ||
Fig. 4 The simple (s) and advanced (a) Markov chain model are both reducible as not every state can be reached from a starting state in a multistep process. The transition rate 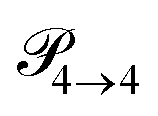 is not displayed as it does not change the mole fraction x4. is not displayed as it does not change the mole fraction x4. | ||
The probabilities  to get from one state i to another one k are gathered in a transition matrix
 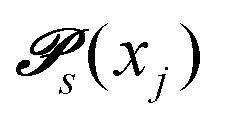 (simple protonation)
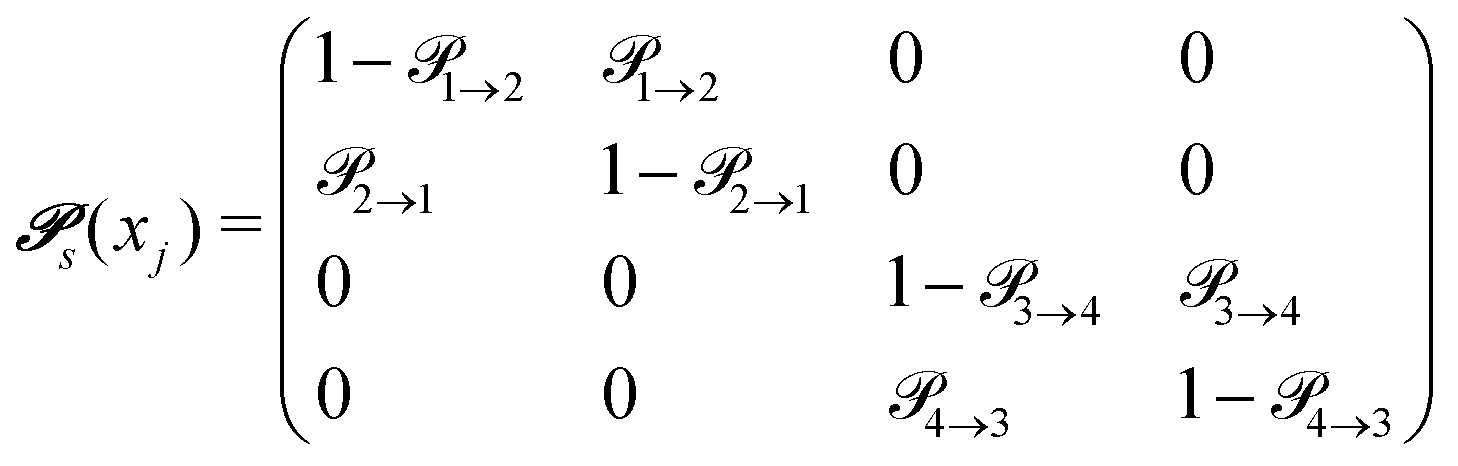 | (3) |
 (advanced protonation)
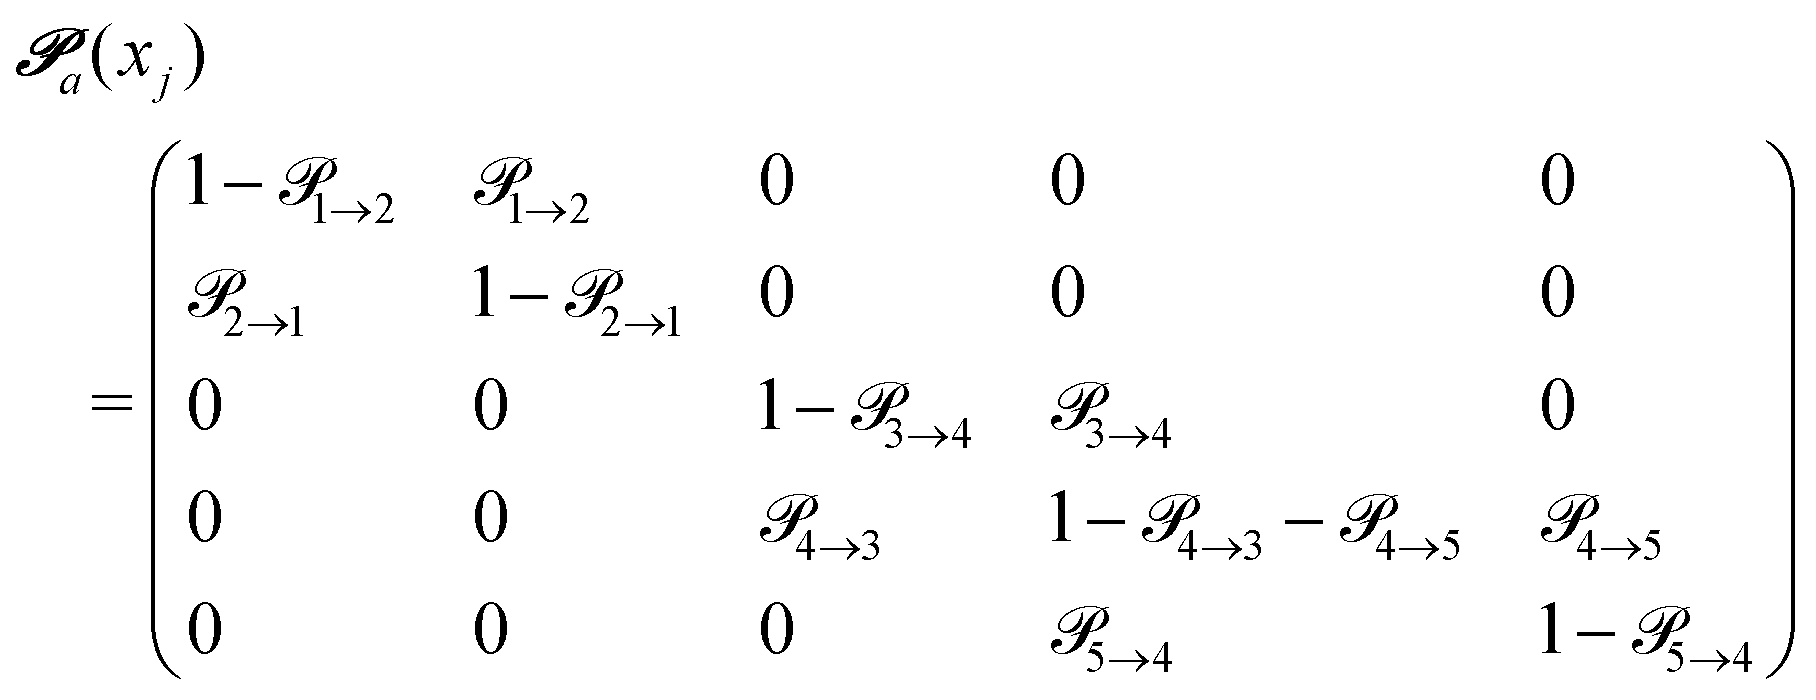 | (4) |
 increased to 5 × 5. Both transition matrices are stochastic, i.e. the sum of each row yields unity. That does not apply to each column. Furthermore, the mole fractions xj of the species enter the transition matrix to find the corresponding partners (see eqn (2)).
Given an initial distribution of states ![[x with combining right harpoon above (vector)]](https://www.rsc.org/images/entities/i_char_0078_20d1.gif) (0) = (x1(0),…,x5(0)) at time t = 0, the population after t time steps can be obtained by applying the following equation t times:
(0) = (x1(0),…,x5(0)) at time t = 0, the population after t time steps can be obtained by applying the following equation t times:
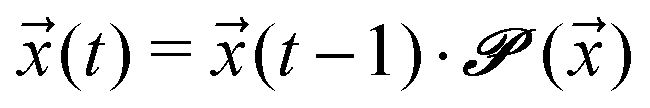 | (5) |
The sum of all mole fractions is normalized to unity at all times, i.e.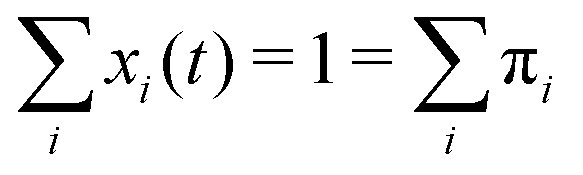 . For t → ∞, the state populations reach a steady state:
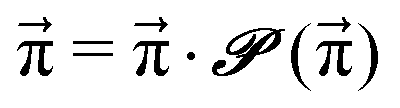
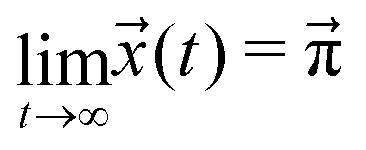 | (6) |
 | (7) |
These Markov models serve as a test system for determining meaningful reaction probabilities pij resulting in the correct (=experimental) equilibrium mole fractions  . Knowing the final state distribution is our significant advantage over the studies of Gillespie using a Monte Carlo approach for the stochastic formulation of chemical kinetics.20
We scan all probabilities pij from 0% to 100% in steps of 5% and determine the steady-state concentrations π by computing x(t = 1000) iteratively from eqn (5) as this number corresponds to the number of protonation events planned during the polarizable, proton transfer MD simulations. In order to further increase computational efficiency, we start at the experimental mole fractions  for the simple protonation scheme corresponding to 30% ionic and 70% neutral molecules. Our initial guess for the advanced protonation scheme is
  . Here, we overestimated the initial concentration of the protonated acetic acid 5 on purpose to allow for corresponding reaction involving this species. Starting with a more realistic concentration near zero would immediately prohibit the reactions {(3+5),(4+5),(1+5)} to take place.
Since we are more or less close to the expected equilibrium, the number of iterations t to reach the final computational state distribution  may be lower. Therefore, we check the norm |(t) − (t − 1)| of the change of the mole fraction at each iteration and stop the loop if this norm is less than 10−5 to safe computational time. This procedure is computationally at least one order of magnitude faster than the standard eigenvalue method. Usually, the steady-state population
  is determined via the eigenvector of the highest eigenvalue 1.21
However, not all sets of pij necessarily stay close to (0). For example, if p14 is significantly larger than p23, the computational equilibrium characterized by  will shift to the right hand side of Fig. 1 and hence will be quite different to
  . A set of pij is accepted, if it fulfills the following conditions:
• Charge neutrality.
• Balanced species.
• Ratio of ionic![[thin space (1/6-em)]](https://www.rsc.org/images/entities/char_2009.gif) :neutral molecules should be close to 30%:70%.
:neutral molecules should be close to 30%:70%.
Charge neutrality reads in the simple and advanced protonation scheme π2 − π3 ≃ 0 and π2 − π3 + π5 ≃ 0, respectively. We accept a difference of 0.001 for numerical reasons. As both Markov chain models are reducible, the number of imidazolium-based and carboxylate-based species should be the same. Im1 and Im1H+ cannot react to OAc−, HOAc or H2OAc+, and vice versa. Consequently, the balance is checked via π1 + π2 − π3 − π4 − π5 ≃ 0. In the case of the simple protonation scheme, the protonated acetic acid is missing, i.e., π5 = 0. Again, we accept a difference of 0.001 for numerical reasons. The last condition requires π1 − 0.35 = 0 to yield 30% ionic: 70% neutral molecules. Here, we allow for a deviation of 0.05 for both protonation schemes as this experimental ratio cannot be determined with high precision.
2.3 Quantum-mechanical scans
Each of the final valid sets of {p14,p23,p34,p12,p44,p35, p45,p15,p24} may be considered as a point in the “probability space” of meaningful mathematical reaction probabilities. However, almost a billion of these combinations exist for the advanced protonation scheme. In order to restrict this huge phase space to chemical meaningful probabilities, we apply additional quantum-mechanical scans.All quantum mechanical calculations were performed using the program package Gaussian 1622 on the B3LYP/6-311++G(d,p) level of theory. Dispersive effects were corrected empirically using Grimmes model of version D3 with Becke–Johnson damping (D3BJ).23 Solvent effects were included using the polarizable continuum model (PCM). The static dielectric constant of the ionic liquid was set to the experimental value of 33.3,24 which is also similar to the value reported in the study of Umebayashi and co-workers.9
Optimization of all five individual molecules, as well as pairs of them, was done. Binding energies were computed as the energy difference between the pair of molecules and the sum of the individual energies. Single-point calculations were performed on the frozen molecules to explore the topology of the potential energy surface with respect to the position of the proton. These scans of the proton's position were performed with all atomic coordinates fixed to the optimized values, and only the position of the proton was manipulated. Thus, these scans are labeled as “rigid” (see Section 3.1). The acidic proton (HO1 and HNA1, respectively, see Fig. 5) was scanned along with two grids with a mesh size of 0.05 Å. One of the grid planes was aligned with the molecular plane, thus including axes u1 and u2 as seen in Fig. 5. The second plane was imposed perpendicular to the first one in such a way that the joint straight of the two planes coincides with the direct line between the hetero atoms of acid and base, hence including axes u1 and u3 = u2 × u1. As these twodimensional scans revealed that the most likely proton transfer happens more or less along a straight line connecting the hydrogen bond donor and acceptor, additional scans using this reaction coordinate were performed.
 | ||
| Fig. 5 Rigid 2D proton position scans on the optimized structures. Axes u1, u2 and u3 denote the scan directions as visualized also in the molecules. White crosses denote the local minima. The pictures on the right contain the atom names used in the text. Top panel (1+4),(2+3): scans of the acetic acid (HOAc, 4)/1-methylimidazole (Im1, 1) pair with the protic hydrogen HO1. Middle panel (3+4): scans of the acetic acid (HOAc, 4)/acetate (OAc−, 3) pair with the protic hydrogen HO1. Bottom panel (1+2): scans of the 1-methylimidazole (Im1, 1) pair/1-methylimidazolium (Im1H+, 2) pair with the protic hydrogen HNA1. | ||
Starting from the optimized pair structures, relaxed onedimensional scans were performed by increasing the distance between the proton and its parent atom (see Section 3.2). In each step, the geometries were optimized, and the ground state energy was computed. Aside from the freezing of the respective H–X distance (X = N, O) at each step, no further restraints were imposed on the systems. As a result, the geometries can freely adapt to each given H–X distance. An exception is the system HOAc–HOAc, where the second H–O distance was frozen concerning the equilibrium optimized ground state geometry. This assured that OAc− and H2OAc+ were formed while a proton exchange reaction was prohibited. The step size for the H–X distance was set to 0.025 Å.
3 Results and discussion
3.1 Rigid twodimensional scans of the reaction partners
The most important reactions of Fig. 3 concern proton transfers between Im1, Im1H+, HOAc and OAc−. This generates the need for a decent understanding of these reaction profiles.The optimal configuration of Im1 and HOAc in the top panel of Fig. 5 is about 14.2 kcal mol−1 lower in energy (left white x of the top heatmap) compared to the sum of both isolated molecules. This energy difference can be regarded as an approximation for the intermolecular binding energy of the two structures. Upon binding, the O1–HO1 distance gets slightly elongated from 0.97 Å in the isolated acetic acid to 1.03 Å, indicating a hydrogen bond interaction. Both molecules align in the same molecular plane, caused by the hydrogen bonding interactions HO1–NA4 and O2–HCR. In the minimum structure, the protic hydrogen is bonded to HOAc. The rigid-geometry scans in the top panel of Fig. 5 exhibit an energy difference of around 5.4 kcal mol−1 between the two local minima, which corresponds to hydrogen binding to either HOAc or Im1H+ (right white x in the top heatmap). These two minima of the rigid twodimensional scan are separated by an energy barrier of around 6.0 kcal mol−1 (referenced to the global minimum). The scan within the molecular plane, which encompasses u1 and u2, exhibits quite a significant asymmetry comparing positive and negative values of u2. This is most probably caused by a repulsive interaction between the protic hydrogen and the second hydrogen bonding interaction between O2 and HCR. Resulting from this, the local minimum corresponding to Im1H+ is not on the line directly connecting O1 and NA4, but shifted slightly within the plane, matching a bond angle relaxation at NA4.
In contrast, the perpendicular energy surface, encompassing u1 and u3, is notably more symmetric, as there are no significant structural differences above and below the molecular plane. At the same time, this potential energy surface is shallower compared to the in-plane heatmap, indicating less constraint on the proton along this plane. Nevertheless, both scans in the top panel of Fig. 5 indicate that the optimal transition pathway is directly between O1 and NA4, as deviations from the optimal path result in unfavorable energy levels. Consequently, more detailed quantum-mechanical scans may be performed with a onedimensional reaction coordinate along the OH-bond (see Section 3.2).
In addition to the equilibrium displayed in Fig. 1 protonation and deprotonation can also occur between HOAc/OAc− (reaction 3+4) and Im1/Im1H+ (reaction 1+2). The binding energy of 16.7 kcal mol−1 between HOAc and OAc− is slightly higher than between HOAc and Im1. Accordingly, the HO1–O1 distance of 1.05 Å is more elongated in the HOAc/OAc− pair compared to HOAC/Im1. This represents a more intense hydrogen bond, as expected when exchanging nitrogen for the more electronegative oxygen. The second hydrogen bond in the HOAC/OAc− arises between the second O of acetate and one of the HCT atoms of acetic acid (see middle panel of Fig. 5). As a result, both acetate frameworks are not aligned in the same molecular plane but rotated; the dihedral 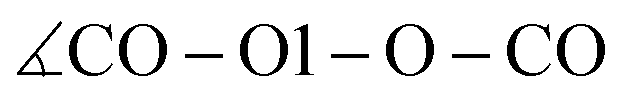 is 65°.
Generally, for a proton transfer between OAc− and HOAc to take place, no energy difference between the two minimum structures is to be expected. However, the frozen geometry scans in the middle panel of Fig. 5 display an energy difference between the two protonated states of 2.7 kcal mol−1, with no energy barrier in between. This energy difference is partly due to the rigidity of the structures, which prohibits any structural relaxation caused by the different intermolecular arrangements of the molecule. Additionally, in the global minimum, the second O atom in OAc− develops a hydrogen bonding interaction to the methyl group of HOAc, as previously mentioned. After the proton transfer, this hydrogen bond still persists, but the reduction in partial charge on the free O in OAc− upon protonation weakens this interaction. This results in a somewhat artificial rise in total energy connected to the proton transfer, which in reality can be overcome by rearrangement of the molecules or coordination to additional molecules in the direct vicinity.
Additionally, both scans are highly asymmetric, which is due to the acetate and acetic acid molecules not aligning within the same plane. In consequence, the scans correspond to the molecular plane or the plane perpendicular to that, respectively, of the acetic acid molecule only but are in turn widely off-plane for the acetate. Although the proton transfer corridor is wider than Im1/HOAc, a onedimensional scan along the two active oxygen is still the pathway with the least energy barrier.
Looking at the bottom panel of Fig. 5 the binding energy between Im1 and Im1H+ is 12.7 kcal mol−1, signifying that this pair is the least favored one. In contrast, the HNA1–NA1 distance is elongated from 1.01 Å for the isolated Im1 to 1.08 Å for the coordinated structures, which is a more pronounced elongation compared to the other two pairs. This might be attributed to the fact that Im1 and Im1H+ only form one hydrogen bond, while the other two pairs were linked via two hydrogen bonds. As a result, the doubly-coordinated pairs are more stable, but the hydrogen bond in the Im1/Im1H+ pair appears to be most pronounced. Since there is no rotational barrier along with a hydrogen bonding interaction, the two Im1 fragments align perpendicular to one another, minimizing sterical repulsions (see Fig. 5).
The proton scans for Im1/Im1H+ are the most symmetrical of the three cases presented in this section. This is true when comparing positive and negative u2 and u3 values, but also concerning the proton transfer path, i.e., when mirroring along an imaginary line at around u1 = 1.375 Å. This is reflected in the comparatively small local minima energy difference of 2.1 kcal mol−1, which can almost entirely be contributed to conformational relaxations, as both initial and final states are almost identical for intermolecular interactions. The two minima are separated by a barrier of 4.6 kcal mol−1 concerning the global minimum.
3.2 Onedimensional scans along the reaction coordinate
Relaxed scans along the proton transfer coordinate provide additional insights into the transfer energetics, as nonphysical geometry restraints can be lifted when focusing on only one dimension. All relaxed, onedimensional scans along with an O–H or N–H axis are displayed in Fig. 6. The colored numbers denote the reaction barriers for the reactions in Fig. 3.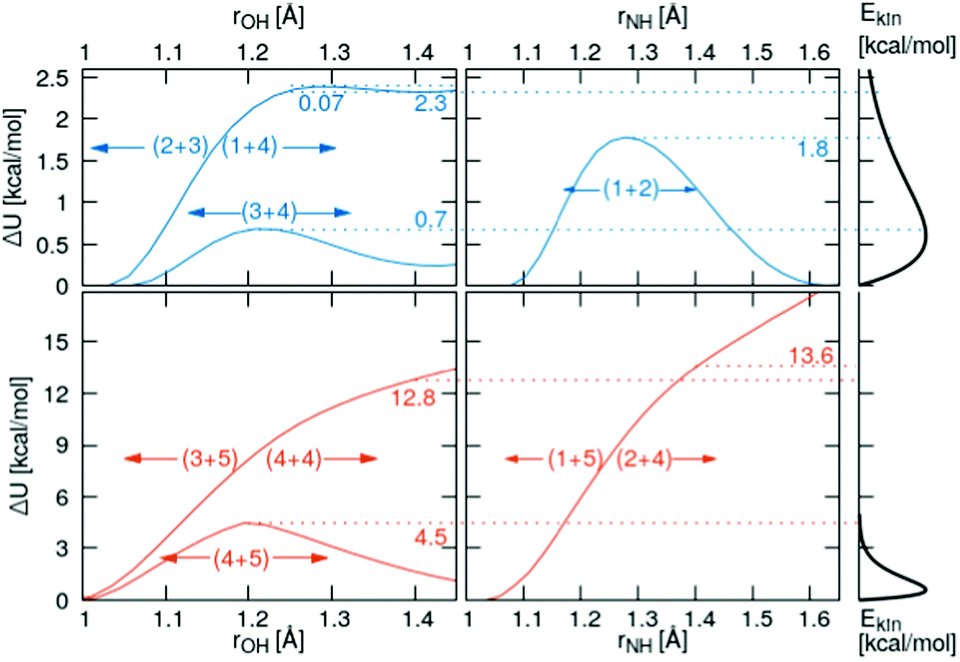 | ||
| Fig. 6 Top row: Quantum-mechanical scans of the reacting pairs in the simple protonation scheme. Bottom row: Additional reactions in the advanced protonation scheme. The right panel concerns the Maxwell–Boltzmann distribution of the kinetic energy. | ||
The proton transfer between HOAc and Im1 is associated with only a minuscule barrier (reactions (1+4) and (2+3)). However, a larger barrier is reported from DFT scans in the study by Kirchner and co-workers7 without using a polarizable continuum model. The coordinated structures, where the proton is bound to the Im1H+, are around 2.3 kcal mol−1 less stable than the HOAc/Im1 pair. A similar value of 6.9 kJ mol−1 = 1.7 kcal mol−1 is reported in ref. 8. This energy difference is significantly reduced compared to the 5.4 kcal mol−1 in the rigid scans, which is attributed to the added structural flexibility. In this local minimum at rOH = 1.41 Å, the NA4–HO1 distance is 1.13 Å, which is >0.1 Å larger than the equilibrium distance in the isolated Im1H+ ion (1.01 Å), indicating still quite a considerable interaction with the O1 of the acetate.
In comparison, the proton transfer from HOAc to OAc− is significantly more favorable (reaction (3+4)). Here, forward and backward reactions are identical, but the products and educts still are just below 0.2 kcal mol−1 different in total energies. This again has to be attributed to the hydrogen bonding interaction between the second O in OAc and the methyl group in HOAc, resulting in different product and educt arrangements as discussed above. With this, the reaction energy is around 2.5 kcal mol−1 smaller than that estimated from the rigid scans, which can effectively entirely be attributed to structural relaxations. The reaction barrier between the two local minima is around 0.7 kcal mol−1 compared to the global minimum.
Regarding the proton transfer between Im1H+ and Im1 (reaction (1+2)), products and educts are virtually identical in total energies in the relaxed scans. This verifies that the energy difference between the two local minima of 2.1 kcal mol−1 in the rigid scans is exclusively attributed to conformational relaxations. Furthermore, the energy barrier is reduced from 4.6 kcal mol−1 in the rigid scans to 1.8 kcal mol−1 in the relaxed scans.
Three additional pairs were investigated to evaluate the influence of protonated acetic acid (H2OAc+, 5) in the advanced protonation scheme: H2OAc+/HOAc, HOAc/Im1H+, and HOAc/HOAc. From the last two pairs, H2OAc+ is generated upon proton transfer. Of all pairs investigated in this work, H2OAc+/HOAc exhibits the largest binding energy at around 20.6 kcal mol−1, with HOAc/HOAc and Im1H+/HOAc binding the weakest, at 10.5 and 9.9 kcal mol−1, respectively. Between these three, H2OAc+/HOAc is the only one with an almost symmetric proton transfer reaction profile (reaction 4+5), as products and reactants are identical in connectivity. The reaction barrier is also moderate compared to the other reaction, including H2OAc+ at around 4.5 kcal mol−1. Still, it is already at least twice that of all proton transfers, which did not include H2OAc+.
For the two other proton transfers, the formation of H2OAc+ is very unfavorable. As no meta-stable H2OAc+ exists according to these scans, the energy at a distance of r = 1.4 Å is given. The products H2OAc+/Im1 are 13.6 kcal mol−1 less stable than reactants HOAc/Im1H+ (reactions (1+5) and (2+4)), and H2OAc+/OAc− is 12.8 kcal mol−1 higher in energy compared to the non-charged HOAc/HOAc (reactions (3+5) and (4+4)). Please note that these computations were performed using a polarizable continuum with an experimental dielectric constant of 33.3, which should damp Coulomb interactions between charged molecules by that factor. Additionally, these proton transfers do not traverse any barrier, and the corresponding H2OAc+ structures do not represent a local minimum. As a result, the reverse transfers (reactions (1+5) and (3+5)) will occur energetically downhill with no activation energy necessary whatsoever.
3.3 Reaction probabilities
The onedimensional scans result in reaction barriers depicted in Fig. 6 for the various reactions (i + j). The transformation of these barriers ΔU into reaction probabilities pij can be realized via various models:The first model is based on the kinetic energy Ekin of the protonated molecule. Its normalized Maxwell–Boltzmann distribution
 | (8) |
 | (9) |
| Reaction | ΔUij | E kin | TST | Collision |
|---|---|---|---|---|
| (i + j) | p ij | k ij | k ij | |
| [kcal mol−1] | [%] | [ps−1] | [ps−1] | |
| (1 + 4) | 2.3 | 9.8 | 0.125 | 0.080 |
| (2 + 3) | 0.07 | 99.4 | 5.56 | 3.51 |
| (3 + 4) | 0.7 | 68.4 | 1.93 | 1.07 |
| (1 + 2) | 1.8 | 20.1 | 0.305 | 0.214 |
| (4 + 4) | >12.8 | ≪0.1 | 10−9 | 10−9 |
| (3 + 5) | 100 | |||
| (4 + 5) | 4.5 | 0.5 | 0.0033 | 0.0019 |
| (1 + 5) | 100 | |||
| (2 + 4) | >13.6 | ≪0.1 | 10−9 | 10−10 |
The second model is based on transition state theory (TST). The corresponding rate constant kij is governed by an Arrhenian factor
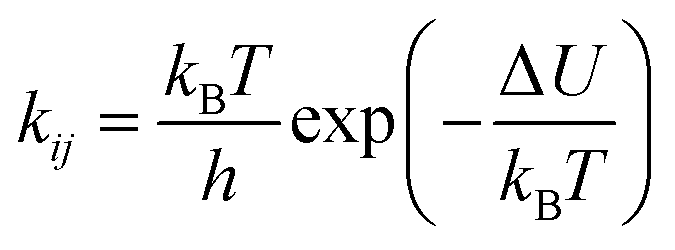 | (10) |
| pij = xi·xj·kij·δt | (11) |
The third model is based on collision theory.20 The reaction rate kij is a function of the radius ri and rj of the reacting molecules assuming that the reacting molecules are spheres.
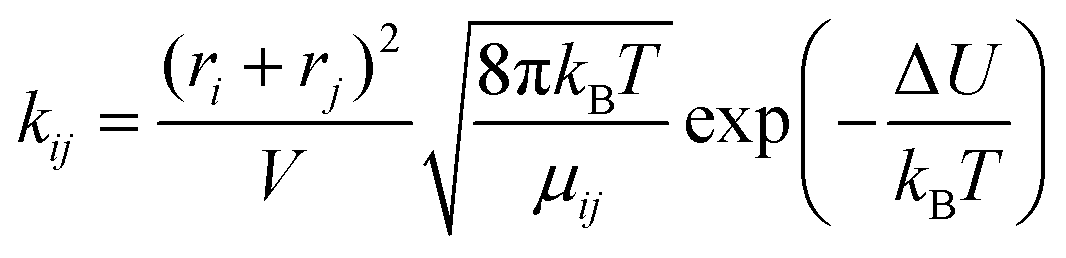 | (12) |
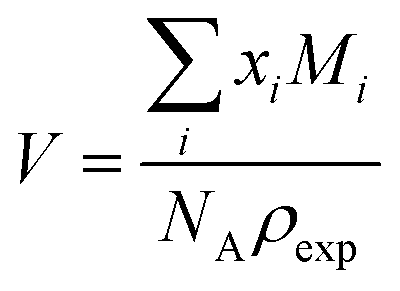 | (13) |
The probabilities for the simple reaction scheme for the three models are shown in Fig. 7. A time window of δt = 7 ps in eqn (11) yields probabilities pij from the rate constants kij which are close to the probability value pij from the kinetic energy model. This time interval δt = 7 ps poses an upper limit to some extent as p23 for TST theory is then already close to unity. However, proton transfer may occur on a much faster time scale. In an AIMD study of Sebastiani et al.6 protons jumped frequently between carboxylate oxygens and pyridine nitrogens on a sub-picosecond time scale. This may be due to lower potential barriers in their study.
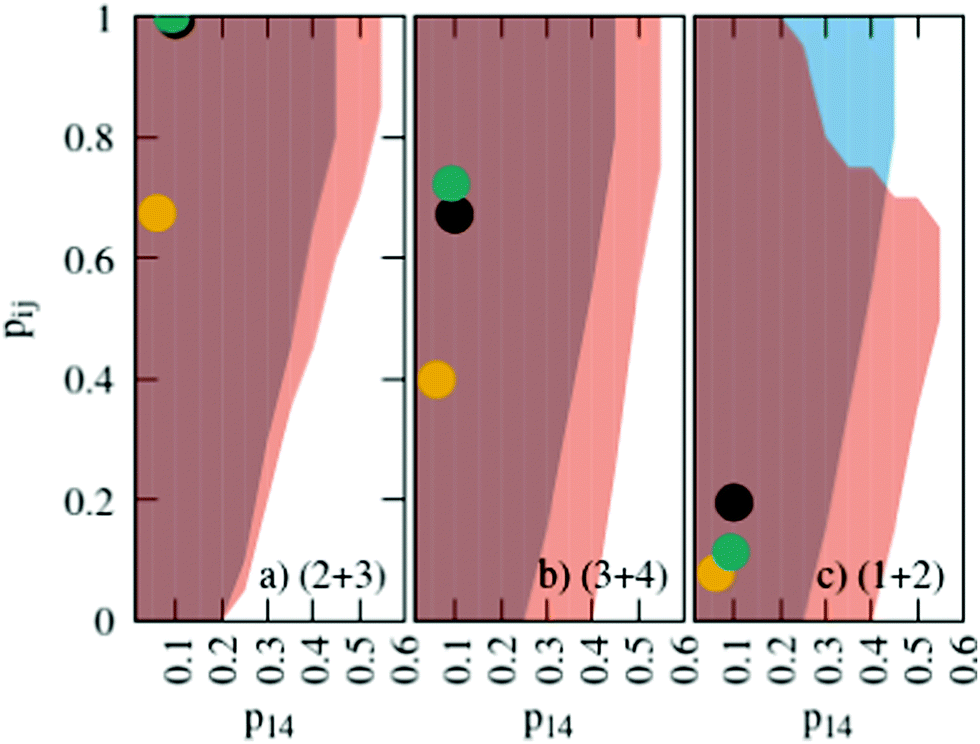 | ||
| Fig. 7 Probabilities for the various reactions in the simple (blue area) and advanced (orange area) protonation scheme as a function of the fundamental reaction (1 + 4) in Fig. 1. The black, green and yellow circles correspond to the kinetic, transition state theory and collision model, respectively. For the latter two, a reaction window of δt = 7 ps is assumed. | ||
As easily visible from Table 1 all reactions of the advanced protonation scheme with an activation barrier have very low rate constants and consequently negligible probabilities. As a result, there should be no H2OAc+ present at all. As still some protonated acetic acid were found in AIMD trajectories,7 quantum effects like tunneling or many-body effects catalyzing the respective reactions may help to overcome these unfavorable energy pathways. In particular, solvent dipoles may create local electric fields that significantly change the energy surface and, consequently, the proton transfer pathway.6 These many-body effects cannot be mapped by the previous section's one- or two-dimensional scans.
3.4 Markov chain analysis
Another issue concerns the position of the equilibrium based on the set of distinct probabilities. The values in Table 1 are independent of each other. Hence, these distinct probabilities do not necessarily lead to the mole fractions found in the experiment.We performed a systematic scan of all reaction probabilities pij in Fig. 4 using the Markov chain model in steps of 0.05 and checked for the final concentrations  as well as the charge neutrality. In order to save computational time, the probabilities of reaction (4+4) and (2+4) were restricted to an upper limit of 20%. The lower limit of the probabilities for reaction (3+5) and (1+5) was set to 80%. These values are well beyond those expected by the reaction barriers of 12.8 kcal mol−1 and 13.6 kcal mol−1. Nevertheless, more than 800 million sets of probabilities were scanned in the advanced protonation scheme based on these limits.
The systematic scans for the simple and advanced protonation scheme were performed separately, and the results are visualized in Fig. 7 as blue (simple) and orange (advanced) areas. Given a particular probability of p14 all pij within the shaded areas yield the correct experimental mole fractions. The shaded areas of both protonation schemes overlap to a vast extent. However, the advanced protonation scheme allows for slightly higher p14 probabilities. Fortunately, all probabilities calculated in the previous section for the kinetic, collision, and transition state models are covered by the simple and advanced Markov chains in Fig. 4. The unlikely reactions (4+4) and (2+4) as well as the automatic reactions (3+5) and (1+5) of the advanced protonation scheme (see Fig. 3) do not restrict the findings in Fig. 7 as for each p14 all tested probabilities pij of these reactions lead to valid mole fractions  using eqn (6).
In addition to the valid probabilities pij, box plots of the resulting steady state mole fractions  are obtained in Fig. 8 for all scanned probability sets which fulfill charge neutrality, balance of species and the experimental ratio of ionic:neutral molecules. In the simple protonation scheme, the ratio of 0.349:0.151 corresponds to roughly 70% neutral/30% ionic molecules and is in the center of gray shaded areas, which indicates our limits for the imidazolium-based species. The box plots of the mole fractions shift in the advanced protonation scheme as the increased acetate concentration can be compensated by an increased concentration of protonated acetic acid to keep charge neutrality. However, the mole fraction x5 = 0.02 of H2OAc+ is relatively low due to the unfavorable energy state. Applying the probabilities for the kinetic energy model (black circles in Fig. 7) or the TST (green circles) and collision theory (yellow circles) using δt = 7 ps result in x5 < 10−5. The values x5 > 0.01 are only reached for high values of p44 and p24 of the unfavorable reactions in the rigid scan. The increased concentrations of OAc− and H2OAc+ decrease the concentration of HOAc because the sum x3 + x4 + x5 of carboxylate based species should yield x1 + x2 of the imidazolium based species.
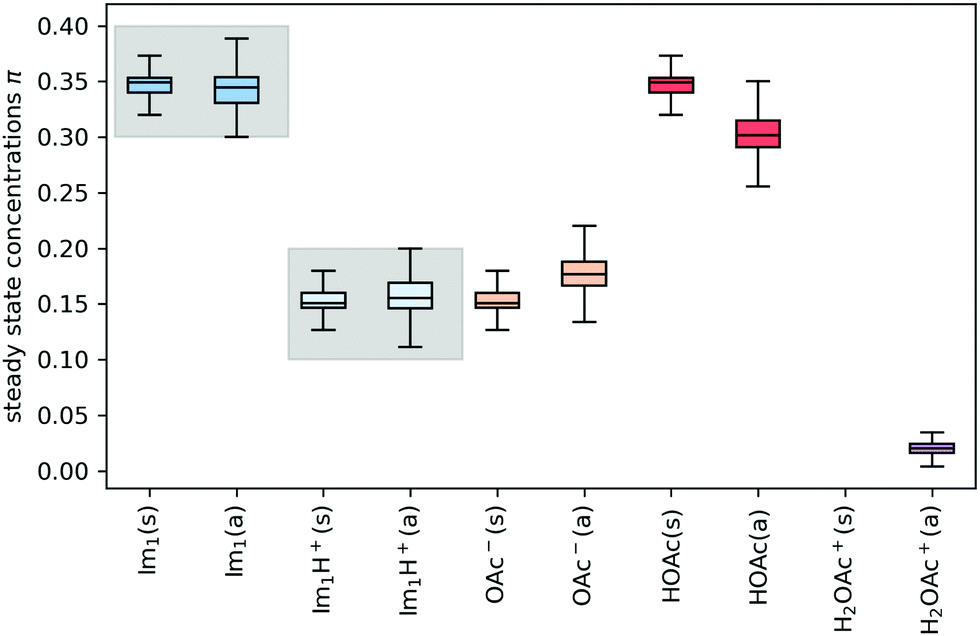 | ||
Fig. 8 Steady state concentrations (= mole fractions) of the compounds in the simple (s) and advanced (a) protonation scheme. The average final concentrations  are {0.349,0.151,0.151,0.349,0.000} for the simple protonation scheme and {0.345,0.155,0.178,0.302,0.020} for the advanced protonation scheme. are {0.349,0.151,0.151,0.349,0.000} for the simple protonation scheme and {0.345,0.155,0.178,0.302,0.020} for the advanced protonation scheme. | ||
4 Concluding discussion
The present work combines quantum-mechanical with statistical mechanics calculations to investigate the equilibrium between 1-methylimidazole + acetic acid and 1-methylimidazolium acetate. This equilibrium is accompanied by several other (de-)protonation reactions. Twodimensional quantum-mechanical scans show that the proton transfer most probably happens via a direct transfer between the active oxygens and/or nitrogens. Thus, this distance may be used as a reaction coordinate for onedimensional scans showing various energy barriers for the investigated reactions.These reactions may be decomposed in a simple and advanced reaction scheme: The simple reaction scheme contains four reactions between 1-methylimidazole, 1-methylimidazolium, acetate, and acetic acid. The advanced reaction scheme augments this set of reactions and includes the formation and deprotonation of the protonated acetic acid. Distinct probabilities can be determined based on a kinetic model, transition state theory, and collision theory using reaction windows of 7 ps for the latter two models. Markov chain models for the simple and advanced protonation scheme demonstrate that these probabilities lead to the experimental composition of the involved species.
As the predicted probabilities for the reactions involving the protonated acetic acid are practically zero, artificial probabilities will be used to investigate the effect of this species for the charge transport in the polarizable molecular dynamics simulations. Please keep in mind that the protonated acetic acid is the only molecule that qualifies for a direct Grotthus mechanism for charge transport. The protonation of 1-methylimidazole only yields an indirect Grotthus mechanism, then molecular rotation and subsequent deprotonation of the 1-methylimidazolium.
Conflicts of interest
There are no conflicts to declare.Acknowledgements
The computational results presented have been achieved in part using the Vienna Scientific Cluster (VSC). This work was funded by Project No. I4383N of the FWF Austrian Science Fund. We also thank Johannes Hunger for experimental values and helpful discussions.Notes and references
- A. Guerfi, M. Dontigny, P. Charest, M. Petitclerc, M. Lagacé, A. Vijh and K. Zaghib, J. Power Sources, 2010, 195, 845 CrossRef CAS.
- S. Menne, J. Pires, M. Anouti and A. Balducci, Electrochem. Commun., 2013, 31, 39 CrossRef CAS.
- S. Menne, R.-S. Kühnel and A. Balducci, Electrochim. Acta, 2013, 90, 641 CrossRef CAS.
- K. Fumino, A. Wulf and R. Ludwig, Angew. Chem., Int. Ed., 2009, 48, 3184 CrossRef CAS PubMed.
- T. L. Greaves and C. J. Drummond, Chem. Rev., 2008, 108, 206 CrossRef CAS PubMed.
- B. Koeppe, S. A. Pylaeva, C. Allolio, S. Sebastiani, E. T. J. Nibbering, G. S. Denisov, H.-H. Limbach and P. M. Tolstoy, Phys. Chem. Chem. Phys., 2017, 19, 1010–1028 RSC.
- J. Ingenmey, S. Gehrke and B. Kirchner, ChemSusChem, 2018, 11, 1900 CrossRef CAS PubMed.
- H. Doi, X. Song, B. Minofar, R. Kanzaki, T. Takamuku and Y. Umebayashi, Chem. – Eur. J., 2013, 19, 11522–11526 CrossRef CAS PubMed.
- H. Watanabe, T. Umecky, N. Arai, A. Nazet, T. Takamuku, K. R. Harris, Y. Kameda, R. Buchner and Y. Umebayashi, J. Phys. Chem. B, 2019, 123, 6244–6252 CrossRef CAS PubMed.
- W. Qian, Y. Xu, H. Zhu and C. Yu, J. Chem. Thermodyn., 2012, 49, 87 CrossRef CAS.
- C. Schröder, Phys. Chem. Chem. Phys., 2012, 14, 3089 RSC.
- M. Salanne, Phys. Chem. Chem. Phys., 2015, 17, 14270–14279 RSC.
- D. Bedrov, J.-P. Piquemal, O. Borodin, A. MacKerell, B. Roux and C. Schröder, Chem. Rev., 2019, 119, 7940–7995 CrossRef CAS PubMed.
- T. Yan, C. J. Burnham, M. G. Del Pópolo and G. A. Voth, J. Phys. Chem. B, 2004, 108, 11877 CrossRef CAS.
- O. Borodin, J. Phys. Chem. B, 2009, 113, 11463 CrossRef CAS PubMed.
- O. Borodin and G. D. Smith, J. Phys. Chem. B, 2006, 110, 11481 CrossRef CAS PubMed.
- A. d. O. Cavalcante, M. C. C. Ribeiro and M. S. Skaf, J. Chem. Phys., 2014, 140, 144108 CrossRef PubMed.
- Y. Wu, Y. Li, N. Hu and M. Hong, Phys. Chem. Chem. Phys., 2014, 16, 2674 RSC.
- C. Schröder and O. Steinhauser, J. Chem. Phys., 2010, 133, 154511 CrossRef PubMed.
- D. T. Gillespie, J. Comput. Phys., 1976, 22, 403–434 CrossRef CAS.
- S. R. Asmussen, Applied Probability and Queues. Stochastic Modelling and Applied Probability, Springer, New York, 2003, vol. 51 Search PubMed.
- M. J. Frisch, G. W. Trucks, H. B. Schlegel, G. E. Scuseria, M. A. Robb, J. R. Cheeseman, G. Scalmani, V. Barone, G. A. Petersson, H. Nakatsuji, X. Li, M. Caricato, A. V. Marenich, J. Bloino, B. G. Janesko, R. Gomperts, B. Mennucci, H. P. Hratchian, J. V. Ortiz, A. F. Izmaylov, J. L. Sonnenberg, D. Williams-Young, F. Ding, F. Lipparini, F. Egidi, J. Goings, B. Peng, A. Petrone, T. Henderson, D. Ranasinghe, V. G. Zakrzewski, J. Gao, N. Rega, G. Zheng, W. Liang, M. Hada, M. Ehara, K. Toyota, R. Fukuda, J. Hasegawa, M. Ishida, T. Nakajima, Y. Honda, O. Kitao, H. Nakai, T. Vreven, K. Throssell, J. A. Montgomery, Jr., J. E. Peralta, F. Ogliaro, M. J. Bearpark, J. J. Heyd, E. N. Brothers, K. N. Kudin, V. N. Staroverov, T. A. Keith, R. Kobayashi, J. Normand, K. Raghavachari, A. P. Rendell, J. C. Burant, S. S. Iyengar, J. Tomasi, M. Cossi, J. M. Millam, M. Klene, C. Adamo, R. Cammi, J. W. Ochterski, R. L. Martin, K. Morokuma, O. Farkas, J. B. Foresman and D. J. Fox, 2016.
- S. Grimme, S. Ehrlich and L. Goerigk, J. Comput. Chem., 2011, 32, 1456–1465 CrossRef CAS PubMed.
- private communication with Johannes Hunger from MPI Mainz (Germany).
| This journal is © the Owner Societies 2022 |