 Open Access Article
Creative Commons Attribution 3.0 Unported Licence
Collision-assisted stripping for determination of microsolvation-dependent protonation sites in hydrated clusters by cryogenic ion trap infrared spectroscopy: the case of benzocaineH+(H2O)n†‡
Keisuke
Hirata
 abc,
Fuad
Haddad
d,
Otto
Dopfer
 *cd,
Shun-ichi
Ishiuchi
 *abc and
Masaaki
Fujii
 *ace
*ace
aLaboratory for Chemistry and Life Science, Institute of Innovative Research, Tokyo Institute of Technology, 4259 Nagatsuta-cho, Midori-ku, Yokohama, 226-8503, Japan. E-mail: mfujii@res.titech.ac.jp; ishiuchi.s.aa@m.titech.ac.jp
bDepartment of Chemistry, School of Science, Tokyo Institute of Technology, 2-12-1 Ookayama, Meguro-ku, Tokyo 152-8550, Japan
cTokyo Tech World Research Hub Initiative (WRHI), Institute of Innovation Research, Tokyo Institute of Technology, Nagatsuta-cho, Midori-ku, 4259, Yokohama, 226-8503, Japan. E-mail: dopfer@physik.tu-berlin.de
dInstitut für Optik und Atomare Physik, Technische Universität Berlin, Hardenbergstrasse 36, Berlin 10623, Germany
eSchool of Life Science and Technology, Tokyo Institute of Technology, 4259 Nagatsuta-cho, Midori-ku, Yokohama, Kanagawa 226-8503, Japan
First published on 18th February 2022
Abstract
The protonation site of molecules can be varied by their surrounding environment. Gas-phase studies, including the popular techniques of infrared spectroscopy and ion mobility spectrometry, are a powerful tool for the determination of protonation sites in solvated clusters but often suffer from inherent limits for larger hydrated clusters. Here, we present collision-assisted stripping infrared (CAS-IR) spectroscopy as a new technique to overcome these problems and apply it in a proof-of-principle experiment to hydrated clusters of protonated benzocaine (H+BC), which shows protonation-site switching depending on the degree of hydration. The most stable protomer of H+BC in the gas phase (O-protonated) is interconverted into its most stable protomer in aqueous solution (N-protonated) upon hydration with three water molecules. CAS-IR spectroscopy enables us to unambiguously assign protonation sites and quantitatively determine the relative abundance of various protomers.
Introduction
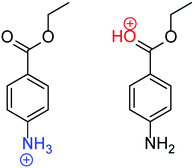
Protonation is a ubiquitous phenomenon in chemistry and biology. The reliable determination of protonation states is highly significant because protonation affects the optical, redox, and catalytic properties of molecules.1–5 For example, pH indicators change their color by protonation. Protonation is also a fundamental process in organic synthesis, and stereoselective synthesis can be achieved by controlling the protonation site of a reaction intermediate.3,4 In general, the protonation site of an organic molecule highly depends on the surrounding solvent.6–22 This solvent-dependent behavior is particularly prominent for molecules with multiple basic sites. For example, benzocaine (BC), which has both carbonyl and amino groups, is most stable in its NH2-protonated form (N-protomer, H+BC(N)) in polar solvents, whereas the CO-protonated form (O-protomer, H+BC(O)) is most stable in the gas phase (Fig. 1).15 The stability of the N-protomer in a polar solvent can readily be rationalized by the higher basicity of the NH2 group. On the other hand, the isolated O-protomer is stabilized by the resonance effect, in which the lone pair of the N-atom is donated to the protonated O-atom via the aromatic phenyl ring.14,15 This solvent-dependent protonation-site switching is not only found in BC but prevails in other (bio-)organic molecules.16–33 Much effort has been devoted to microsolvated clusters, in which an ion is solvated by a few to several hundreds of molecules,14,34–36 because the degree of solvation can be tuned by controlling the type and numbers of solvent molecules.Gas-phase mass spectrometry and laser spectroscopy have the potential to determine the protonation site in microsolvated clusters. In particular, infrared photodissociation spectroscopy (IRPD) and ion mobility mass spectrometry (IMS) have frequently been applied to assign protomers of desolvated ions.8–10,12–21,23–27,30,32–35 For example, the protomers of isolated H+BC could clearly be separated by both IRPD and IMS.15 In principle, IMS can separate isomers based on the collision cross section (CCS) with inert buffer gas, which strongly depends on charge distribution and shape of the molecule. For H+BC, the difference in the structures of the two protomers of BC is too small to be detected by their CCS with He at the currently available resolution. Instead, the protomers were separated by their different dipole moments because the more polar protomer travels slower through a drift cell due to its stronger interaction with the polarizable buffer gas.15 Although this method has successfully been applied to other bare ions, such as protonated p-aminobenzoic acid (H+PABA), it has not been extended to solvated clusters so far. In fact, the protomers of hydrated clusters of H+PABA could not be distinguished by their dipole moment.34 This may be because the difference in dipole moment is “masked” by surrounding water molecules. IRPD spectroscopy is an alternative approach to probe the protonation site. IRPD spectra of H+PABA(H2O)n clusters exhibit intense and broad NH stretch bands in the 2950–3300 cm−1 range at n = 6, which suggests the appearance of a new protomer.14 However, the authors mention that the new protomer may also be already populated for n < 6 because of the minor contribution of unassigned bands in the same spectral range. The ambiguity in the band assignment is ascribed to overlapping vibrational bands arising from the hydration network. In conclusion, both IMS and IRPD are not generally applicable for the reliable determination of the protonation site of organic molecules in a microsolvation environment due to lack of sensitivity, resolution and/or spectral congestion.
To overcome the deficiencies of IMS and IRPD for microsolvated clusters, we developed a new technique denoted collision-assisted stripping (CAS). In this approach, we determine the protonation site of microsolvated clusters by collisionally removing all solvent molecules in a cryogenic ion trap and probing the resulting protomer by IR spectroscopy. We validate herein the new, simple, reliable, and generally applicable method for the prototypical example of H+BC(H2O)n. As mentioned above, H+BC(O) is most stable in the gas phase (n = 0), whereas H+BC(N) is dominant in aqueous solution (Fig. 1),15i.e., H+BC(O) must be converted to H+BC(N) at a critical size of the hydration shell (n ≥ nc). We demonstrate that IRPD spectra measured for bare H+BC generated by CAS of H+BC(H2O)n can reliably determine the protonation sites of hydrated clusters as a function of n. CAS-IRPD spectroscopy is shown to be a new methodology to probe the protonation site in a more quantitative way, with special focus on microhydration-induced intracluster proton transfer.
Experimental
In a proof-of-principle experiment, CAS-IRPD and conventional IRPD spectra of H+BC(H2O)n clusters were measured in a cryogenic ion trap setup (Fig. S1, ESI‡).37–43 Details of the experimental procedures are described in ESI.‡ In brief, H+BC ions generated in an electrospray ionization source were introduced into a linear ion trap (LIT)44,45 kept at 170 K, where they were hydrated by introducing water vapor. The hydrated clusters were mass-selected by a quadrupole and guided into a cryogenic quadrupole ion trap (QIT) held at 4 K. For CAS-IRPD spectroscopy, the injection energy of the ions was set high enough to induce water dissociation (eqn (1)) by collisions with the H2/He buffer gas. | (1) |
Results and discussion
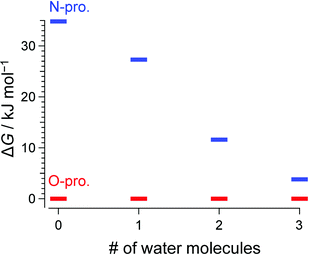
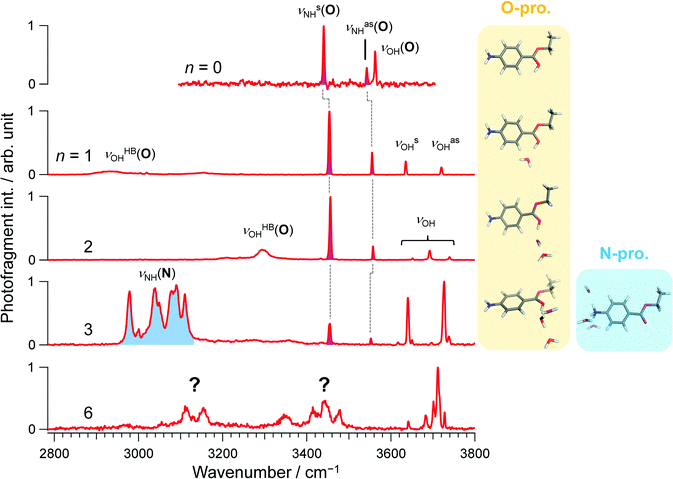
Consistent with previous IRPD and IMS studies,15 all vibrational bands in the conventional IRPD spectrum of bare H+BC shown in Fig. 2 are assigned to H+BC(O). Specifically, the bands at 3441, 3541, and 3561 cm−1 are ascribed to symmetric and antisymmetric NH stretches (νNHs/as(O)) and ionic OH stretch (νOH(O)), respectively, by comparison to computed IR spectra for the most stable H2-tagged H+BC(O) and H+BC(N) conformers (Fig. S2 and S3, ESI‡). Conventional IRPD spectra of H+BC(H2O)n measured for n = 1–6 are shown in Fig. 2 and Fig. S4 (ESI‡). For the vibrational and isomer assignments, density functional theory (DFT) calculations were performed at the ωB97X-D/6-311++G(d,p) level for all possible geometries in which water binds via a hydrogen bond (H-bond) to the acidic NH and OH sites of H+BC. For n = 1 and 2, all observed transitions are again assigned to the most stable clusters of the H+BC(O) protomer (Fig. S5–S8, ESI‡). For example, the bands at 3454 and 3555 cm−1 for n = 1 are attributed to νNHs(O) and νNHas(O), while the bands at 3636 and 3721 cm−1 arise from free symmetric (νOHs) and antisymmetric (νOHas) OH stretches of water. The computed free energy gap (ΔG at 170 K) between the most stable H+BC(O) and H+BC(N) isomers decreases as 34.8 > 27.3 > 11.6 kJ mol−1 for n = 0–2, consistent with the lack of detection of the H+BC(N) isomers in this size range (Fig. 3). In the most stable BCH+(H2O)1 conformer, water is H-bonded to the protonated OH site of H+BC(O) (Fig. 2 and Fig. S5, S6, ESI‡). As a result, the broad band in the 2900–3200 cm−1 range can be ascribed to the strongly red-shifted H-bonded protonated OH stretch (νOHHB(O)). The prominent ionic νNH(N) bands in the 3300–3400 cm−1 range predicted for the most stable monohydrate of H+BC(N) are clearly absent in the IRPD spectra (Fig. S5, ESI‡). The spectral pattern of H+BC(H2O)2 is similar to that of H+BC(H2O)1. The intense bands observed at 3456 and 3558 cm−1 are assigned to νNHs(O) and νNHas(O) (Fig. S7, ESI‡), while the bands above 3600 cm−1 and the broad band at ∼3300 cm−1 arise from νOH of water and ionic νOHHB(O). | ||
| Fig. 3 Calculated Gibbs free energy for the most stable conformers of H+BC(H2O)n at 170 K. Red and blue lines represent O- and N-protomers, respectively (ωB97X-D/6-311++G(d,p)). | ||
In comparison to n ≤ 2, new bands emerge in the lower frequency range (2950–3140 cm−1) of the IRPD spectrum of H+BC(H2O)3, which can clearly be assigned to ionic νNHs(N) modes by comparison to calculations (Fig. S9, ESI‡). Together with the fact that νNHs(O) (3445 cm−1) and νNHas(O) (3552 cm−1) are observed, one can conclude both N- and O-protomers coexist for H+BC(H2O)3. Indeed, the most stable trihydrated H+BC(N) protomer is essentially isoenergetic with the most stable O-protomer (ΔG = +3.8 kJ mol−1, Fig. 3 and Fig. S10, ESI‡). The decrease in ΔG between H+BC(O) and H+BC(N) as a function of n arises from better hydration of the NH3+ group of H+BC(N) offering three proton donor sites to H2O compared to the OH+ group of H+BC(O) offering only one proton donor site for ionic H-bonding to H2O. As a result of progressive hydration, the IRPD spectra become substantially more congested and the vibrational and isomer assignments become more problematic starting from n = 3 (Fig. S4, ESI‡) and virtually impossible for n = 6, concerning both the protonation site and the structure of the hydration shell. This severe problem illustrated here for H+BC(H2O)n is a general phenomenon for hydrated clusters of protonated (bio)organic molecules and prevents the reliable determination of the critical size nc for the hydration-induced switch in the preferred protonation site, in particular for molecules with larger values of nc.
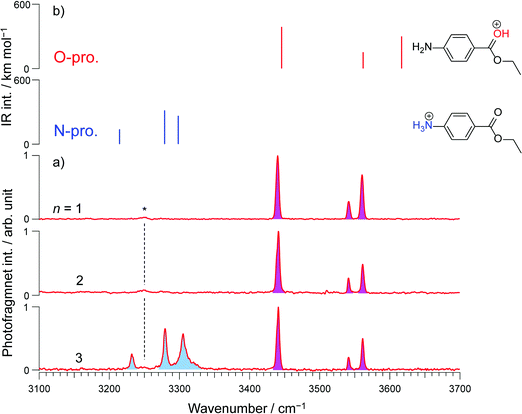
CAS-IRPD spectroscopy offers a simple and general solution to this problem, as shown in Fig. 4 for the case of H+BC(H2O)n. The spectra are simple because the bands in the spectra are only derived from desolvated H+BC (n = 0) and thus lack any congestion. For example, the CAS-IRPD spectra of H+BC(H2O)1,2 are similar to the IRPD spectrum of bare H+BC. The three bands ascribed to H+BC(O) appear also in the CAS-IRPD spectra of H+BC(H2O)1,2, indicating the predominant population of the O-protomer in the mono- and dihydrate. On the contrary, the new bands ascribed to the N-protomer are observed in the CAS-IRPD spectrum of H+BC(H2O)3 at 3232, 3280, and 3306 cm−1 and assigned to ionic NH stretches (νNH(N)). Thus, CAS-IRPD clearly reveals the appearance of the N-protomer in H+BC(H2O)3.
In addition to the reliable protomer assignment, CAS-IRPD allows for the quantitative determination of their population ratio. The latter was obtained by normalizing the band intensities using the calculated IR oscillator strengths of desolvated H+BC (Fig. S11 and Table S1, ESI‡) assuming the same photofragmentation efficiency, and yields 60![[thin space (1/6-em)]](https://www.rsc.org/images/entities/char_2009.gif) :
:![[thin space (1/6-em)]](https://www.rsc.org/images/entities/char_2009.gif) 40 in favor of the N-protomer for n = 3 with an error of the order of 10%. The relative abundance of N- and O-protomers was also deduced from the conventional IRPD spectra (Fig. 2) using the calculated IR oscillator strengths of O- and N-protomers in H+BC(H2O)3 (Fig. S9, ESI‡). This results in a population ratio of ∼3
40 in favor of the N-protomer for n = 3 with an error of the order of 10%. The relative abundance of N- and O-protomers was also deduced from the conventional IRPD spectra (Fig. 2) using the calculated IR oscillator strengths of O- and N-protomers in H+BC(H2O)3 (Fig. S9, ESI‡). This results in a population ratio of ∼3![[thin space (1/6-em)]](https://www.rsc.org/images/entities/char_2009.gif) :
:![[thin space (1/6-em)]](https://www.rsc.org/images/entities/char_2009.gif) 2 in favor of the N-protomer, which is consistent with CAS-IRPD and suggests that intramolecular proton transfer hardly happens during the CID process. It should be noted that the estimation of the populations from conventional IRPD spectra requires the full assignments of the vibrational transitions in terms of the coexisting isomers of clusters. In general, the number of possible isomers of solvated clusters increases dramatically with increasing number of solvent molecules, and furthermore, H-bonding often causes broadening of the vibrational bands. Thus, such analysis becomes very difficult (or often impossible) for the larger solvated clusters. This aspect highlights the superior performance of CAS-IRPD for protomer identification and quantification over conventional IRPD. Theoretical populations were calculated using the Boltzmann equation for thermal equilibrium (eqn (2)):
2 in favor of the N-protomer, which is consistent with CAS-IRPD and suggests that intramolecular proton transfer hardly happens during the CID process. It should be noted that the estimation of the populations from conventional IRPD spectra requires the full assignments of the vibrational transitions in terms of the coexisting isomers of clusters. In general, the number of possible isomers of solvated clusters increases dramatically with increasing number of solvent molecules, and furthermore, H-bonding often causes broadening of the vibrational bands. Thus, such analysis becomes very difficult (or often impossible) for the larger solvated clusters. This aspect highlights the superior performance of CAS-IRPD for protomer identification and quantification over conventional IRPD. Theoretical populations were calculated using the Boltzmann equation for thermal equilibrium (eqn (2)):
 | (2) |
Conclusion
In summary, we demonstrate the superior performance of CAS-IRPD over conventional IRPD and IMS for assigning protomers in hydrated clusters and quantifying their relative abundance for the prototypical example of hydrated H+BC. As for this molecule the switch in preferred protonation site occurs at small degree of hydration (nc = 3), it was feasible to compare IRPD with CAS-IRPD in a benchmark experiment. CAS-IRPD will, however, develop its full potential in particular for substantially larger hydrates, for which IRPD will not work anymore. In fact, we also measured CAS-IRPD spectra for n = 4–6 (Fig. S13, ESI‡), which clearly show the vibrational signatures of the N-protomer, in sharp contrast to the conventional IRPD spectra (Fig. 2). These spectra indicate that the N-protomer becomes more abundant with increasing number of water molecules. Moreover, CAS-IRPD can be applied not only to fully desolvated species (n = 0) but also to partially dissociated ones (n ≥ 1). In this way, one may efficiently produce and probe higher-energy metastable species, which appear only in larger hydrated clusters or in solution (e.g., N-protomer in this case) and are not readily produced directly in the ion source. Although IRPD spectroscopy of fragment ions generated by collision-induced dissociation has been applied to various systems,42,48,49 we extend herein the methodology to hydrated clusters to reliably determine the protonation site. The cooling efficiency in the QIT is high enough to freeze the conformations of a molecule.45 Because intracluster proton transfer involves substantial reaction barriers, rapid cooling in the QIT leads to kinetic trapping of protomers. In principle, CAS-IRPD spectroscopy is applicable to any solvated cluster free from the shortcomings of conventional IMS and IRPD techniques and provides an opportunity to address fundamental questions related to the protonation site and its solvation effect even in large solvated clusters.Conflicts of interest
There are no conflicts of interest to declare.Acknowledgements
This work was supported in part by KAKENHI (JP19K23624, JP20K20446, JP20H00372, JP21H04674, and JP21K14585), the Core-to-Core program (JPJSCCA20210004) from Japan Society for the Promotion of Science, research grant from World Research Hub Initiative (WRHI) of Tokyo Institute of Technology, the Cooperative Research Program of the “Network Joint Research Center for Materials and Devices” from the Ministry of Education, Culture, Sports, Science and Technology (MEXT), Japan, and the RIKEN Pioneering Project, “Fundamental Principles Underlying the Hierarchy of Matter: a Comprehensive Experimental Study”. The computations were performed at the Research Center for Computational Science, Okazaki, Japan. M. F. is grateful for support from the Alexander von Humboldt foundation. O. D. acknowledges support from Deutsche Forschungsgemeinschaft (DFG, DO 729/10) and the World Research Hub Initiative (WRHI) of Tokyo Institute of Technology.References
- N. Gupta and H. Linschitz, J. Am. Chem. Soc., 1997, 119, 6384–6391 CrossRef CAS.
- M. K. Nazeeruddin, S. M. Zakeeruddin, R. Humphry-Baker, P. L. M. Jirousek, N. Vlachopoulos, V. Shklover, C.-H. Fischer and M. Grätzel, Inorg. Chem., 1999, 38, 6298–6305 CrossRef CAS PubMed.
- C. Fehr, Angew. Chem., Int. Ed. Engl., 1996, 35, 2566–2587 CrossRef.
- C. H. Cheon and H. Yamamoto, J. Am. Chem. Soc., 2008, 130, 9246–9247 CrossRef CAS PubMed.
- J. T. Mohr, A. Y. Hong and B. M. Stoltz, Nat. Chem., 2009, 1, 359–369 CrossRef CAS PubMed.
- J. I. Brauman, J. M. Riveros and L. K. Blair, J. Am. Chem. Soc., 1971, 93, 3914–3916 CrossRef CAS.
- D. H. Aue, H. M. Webb and M. T. Bowers, J. Am. Chem. Soc., 1976, 98, 311–317 CrossRef CAS.
- N. Solcà and O. Dopfer, Chem. Phys. Lett., 2001, 342, 191–199 CrossRef.
- N. Solcà and O. Dopfer, Angew. Chem., Int. Ed., 2003, 42, 1537–1540 CrossRef PubMed.
- N. Solcà and O. Dopfer, J. Am. Chem. Soc., 2004, 126, 1716–1725 CrossRef PubMed.
- Z. Tian and S. R. Kass, Angew. Chem., Int. Ed., 2009, 48, 1321–1323 CrossRef CAS PubMed.
- J. Schmidt, M. M. Meyer, I. Spector and S. R. Kass, J. Phys. Chem. A, 2011, 115, 7625–7632 CrossRef CAS PubMed.
- J. L. Campbell, J. C. Le Blanc and B. B. Schneider, Anal. Chem., 2012, 84, 7857–7864 CrossRef CAS PubMed.
- T. M. Chang, J. S. Prell, E. R. Warrick and E. R. Williams, J. Am. Chem. Soc., 2012, 134, 15805–15813 CrossRef CAS PubMed.
- S. Warnke, J. Seo, J. Boschmans, F. Sobott, J. H. Scrivens, C. Bleiholder, M. T. Bowers, S. Gewinner, W. Schollkopf, K. Pagel and G. von Helden, J. Am. Chem. Soc., 2015, 137, 4236–4242 CrossRef CAS PubMed.
- J. L. Campbell, A. M. Yang, L. R. Melo and W. S. Hopkins, J. Am. Soc. Mass Spectrom., 2016, 27, 1277–1284 CrossRef CAS PubMed.
- E. Matthews and C. E. H. Dessent, Phys. Chem. Chem. Phys., 2017, 19, 17434–17440 RSC.
- A. L. Patrick, A. P. Cismesia, L. F. Tesler and N. C. Polfer, Int. J. Mass Spectrom., 2017, 418, 148–155 CrossRef CAS PubMed.
- H. Xia and A. B. Attygalle, J. Am. Soc. Mass Spectrom., 2017, 28, 2580–2587 CrossRef CAS PubMed.
- M. R. Bell, V. W. D. Cruzeiro, A. P. Cismesia, L. F. Tesler, A. E. Roitberg and N. C. Polfer, J. Phys. Chem. A, 2018, 122, 7427–7436 CrossRef CAS PubMed.
- T. Khuu, N. Yang and M. A. Johnson, Int. J. Mass Spectrom., 2020, 457 Search PubMed.
- R. Kumar, R. Yerabolu and H. I. Kenttämaa, J. Am. Soc. Mass Spectrom., 2020, 31, 124–131 CrossRef CAS PubMed.
- J. Seo, S. Warnke, S. Gewinner, W. Schollkopf, M. T. Bowers, K. Pagel and G. von Helden, Phys. Chem. Chem. Phys., 2016, 18, 25474–25482 RSC.
- E. Matthews and C. E. Dessent, J. Phys. Chem. A, 2016, 120, 9209–9216 CrossRef CAS PubMed.
- A. P. Cismesia, G. R. Nicholls and N. C. Polfer, J. Mol. Spectrosc., 2017, 332, 79–85 CrossRef CAS PubMed.
- H. Xia and A. B. Attygalle, J. Mass Spectrom., 2018, 53, 353–360 CrossRef CAS PubMed.
- S. J. P. Marlton, B. I. McKinnon, B. Ucur, A. T. Maccarone, W. A. Donald, S. J. Blanksby and A. J. Trevitt, Faraday Discuss., 2019, 217, 453–475 RSC.
- R. Kumar and H. I. Kenttämaa, J. Am. Soc. Mass Spectrom., 2020, 31, 2210–2217 CrossRef CAS PubMed.
- J. Chandran, Z. Zheng, V. I. Thomas, C. Rajalakshmi and A. B. Attygalle, Analyst, 2020, 145, 5333–5344 RSC.
- Z. Zheng and A. B. Attygalle, J. Am. Soc. Mass Spectrom., 2021, 32, 725–735 CrossRef CAS PubMed.
- M. Demireva and P. B. Armentrout, J. Phys. Chem. A, 2021, 125, 2849–2865 CrossRef CAS PubMed.
- M. McCullagh, S. Goscinny, M. Palmer and J. Ujma, Talanta, 2021, 234, 122604 CrossRef CAS PubMed.
- T. Uhlemann, G. Berden and J. Oomens, Eur. Phys. J. D, 2021, 75, 23 CrossRef CAS.
- M. J. Hebert and D. H. Russell, J. Phys. Chem. B, 2020, 124, 2081–2087 CrossRef CAS PubMed.
- K. Ohshimo, S. Miyazaki, K. Hattori and F. Misaizu, Phys. Chem. Chem. Phys., 2020, 22, 8164–8170 RSC.
- P. R. Batista, T. C. Penna, L. C. Ducati and T. C. Correra, Phys. Chem. Chem. Phys., 2021, 23, 19659–19672 RSC.
- J. A. Stearns, S. Mercier, C. Seaiby, M. Guidi, O. V. Boyarkin and T. R. Rizzo, J. Am. Chem. Soc., 2007, 129, 11814–11820 CrossRef CAS PubMed.
- J. G. Redwine, Z. A. Davis, N. L. Burke, R. A. Oglesbee, S. A. McLuckey and T. S. Zwier, Int. J. Mass Spectrom., 2013, 348, 9–14 CrossRef CAS.
- N. Heine and K. R. Asmis, Int. Rev. Phys. Chem., 2014, 34, 1–34 Search PubMed.
- Y. Inokuchi, K. Soga, K. Hirai, M. Kida, F. Morishima and T. Ebata, J. Phys. Chem. A, 2015, 119, 8512–8518 CrossRef CAS PubMed.
- S. Ishiuchi, H. Wako, D. Kato and M. Fujii, J. Mol. Spectrosc., 2017, 332, 45–51 CrossRef CAS.
- F. S. Menges, E. H. Perez, S. C. Edington, C. H. Duong, N. Yang and M. A. Johnson, J. Am. Soc. Mass Spectrom., 2019, 30, 1551–1557 CrossRef CAS PubMed.
- H. J. Eun, A. Min, C. W. Jeon, I. T. Yoo, J. Heo and N. J. Kim, J. Phys. Chem. Lett., 2020, 11, 4367–4371 CrossRef CAS PubMed.
- B. M. Marsh, J. M. Voss and E. Garand, J. Chem. Phys., 2015, 143, 204201 CrossRef PubMed.
- Y. Suzuki, K. Hirata, J. M. Lisy, S. Ishiuchi and M. Fujii, J. Phys. Chem. A, 2021, 125, 9609–9618 CrossRef CAS PubMed.
- M. Z. Kamrath, R. A. Relph, T. L. Guasco, C. M. Leavitt and M. A. Johnson, Int. J. Mass Spectrom., 2011, 300, 91–98 CrossRef CAS.
- M. Z. Kamrath, E. Garand, P. A. Jordan, C. M. Leavitt, A. B. Wolk, M. J. Van Stipdonk, S. J. Miller and M. A. Johnson, J. Am. Chem. Soc., 2011, 133, 6440–6448 CrossRef CAS PubMed.
- K. J. Menard, J. Martens and T. D. Fridgen, Phys. Chem. Chem. Phys., 2021, 23, 3377–3388 RSC.
- S. Becher, G. Berden, J. Martens, J. Oomens and S. Heiles, J. Am. Soc. Mass Spectrom., 2021, 32, 2874–2884 CrossRef CAS PubMed.
Footnotes |
| † Submitted for publication to PCCP on 17 December 2021. |
| ‡ Electronic supplementary information (ESI) available. See DOI: 10.1039/d1cp05762f |
| This journal is © the Owner Societies 2022 |


