
 Open Access Article
 This Open Access Article is licensed under a
 Creative Commons Attribution 3.0 Unported Licence
Discerning phase-matrices for individual nitride inclusions within ultra-high-strength steel: experiment driven DFT investigation†
Andrey A.
Kistanov
 *ab,
Ekta
Rani
a,
Harishchandra
Singh
*ab,
Timo
Fabritius
bc,
Marko
Huttula
ab and
Wei
Cao
ab
*ab,
Ekta
Rani
a,
Harishchandra
Singh
*ab,
Timo
Fabritius
bc,
Marko
Huttula
ab and
Wei
Cao
ab
aNano and Molecular Systems Research Unit, University of Oulu, 90014 Oulu, Finland. E-mail: Andrey.Kistanov@oulu.fi; Harishchandra.Singh@oulu.fi
bCentre for Advanced Steels Research, University of Oulu, 90014 Oulu, Finland
cProcess Metallurgy Research Unit, University of Oulu, 90014 Oulu, Finland
First published on 20th December 2021
Abstract
Non-metallic inclusions play a decisive role in the steel's performance. Therefore, their determination and control over their formation are crucial to engineer ultra-high-strength steel. Currently, bare experimental approaches are limited in the identification of non-metallic inclusions within microstructural phases of complex steel matrices. Herein, we performed a density functional theory study on the characteristics of different nitride inclusions as observed in spectro-microscopy studies. As per the simulations, TiN inclusions preferentially formed in the austenite matrix, while the ferrite matrix generally hosts BN inclusions. Furthermore, although the presence of both BN and TiN inclusions in the Fe3C matrix is possible, their formation is impeded because of the strong inclusion–carbon interactions. The observed regularity in the formation of nitride inclusions in different phases of steel was also confirmed by the comparison of simulated and experimental K-edge XAS spectrum of nitride inclusions. Our work shed the light on the formation of nitride inclusions in different steel matrices and facilitates their further experimental identification.
Introduction
Owing to a low-cost production along with a wide range of strength and ductility properties, ferrite-martensite dual-phase ultra-high-strength steel is highly desirable for automotive, civil engineering, and automobile manufacturing applications.1–3 However, during steel manufacturing, the formation of non-metallic inclusions (NMIs) within multi-phase steel, typically in low or very low volume fractions, is unavoidable. NMIs are regions of non-metallic chemical compounds, such as oxides, sulfides, and nitrides, which are formed during the different stages of the steel production. An in-depth understanding of NMIs, including their composition, size, shape, and amount, is an imperative step in steel production as they can create serious problems4 such as breakage of steel wires during drawing, hydrogen-induced cracking, fatigue failure, and surface flaws. For example, in Al-killed steels, the AlN inclusion can precipitate and induce an intergranular fracture.5 The Ti-based larger TiN inclusion, on the other hand, can deteriorate material toughness by promoting cleavage crack propagation.6 However, the formation of BN inclusions is not encouraged as it can hinder the role of boron, used as a microalloying element in high-strength steels to improve hardenability.7Spectro-microscopy studies on NMIs embedded in steel8 indicated that additional B atoms result in h-BN along with a strong interaction with a Ca-based inclusion. These Ca-based inclusions also stabilize with TiN. However, no interaction between TiN and BN within the studied steel matrix was found, and the reason behind the same could not be deciphered. Thus, although nitride inclusions in the steel matrix are observed, it is difficult to define their stability and to probe which phase they are in due to the limitations of available experimental methods for such determinations. In such experimental limitations due to the complex microstructure of steel matrix and hidden inclusions within, different computational approaches including the atomic multiplet theory,9,10 delta-self-consistent splitting and the Bethe–Salpeter equation methods11 have been proposed to realize the physical mechanism of inclusion formation in different systems including a few variants of steel. For instance, these approaches can be successfully utilized for the investigation of shape and morphology of inclusions in metallic materials,12 prediction of the effect of inclusions on the hydrogenation of steels,13 and differentiation of elements via their X-ray absorption (XAS) spectral simulations.14 Despite the progress described above, investigating nitride inclusions within multi-phase carbon steel is still posing challenges.
Herein, we conducted a density functional theory (DFT)-based study, supplemented by experimental spectro-microscopic data, on the formation of nitride inclusions in different phases of steel together with simulated spectroscopic evidence, i.e., K-edge XAS spectrum. In this study, the discovered regularity in the formation of specific inclusions depending on the type of matrix can further shed light on the controlled formation of nitride inclusions in a particular phase in commercial steel production.
Methods
The computational part was carried out in the framework of DFT as implemented in the Vienna Ab initio Simulation Package (VASP) code.15 To simulate NMIs in the steel matrix, the supercell method was used. The geometry optimization of iron matrices (created based on the data in ref. 16) and inclusion-containing iron matrices was treated based on the Perdew–Burke–Ernzerhof functional within the generalized-gradient approximation.17 Bulk crystals of bare austenite, ferrite, and Fe3C were fully optimized. The optimization process was stopped when the atomic forces and total energy values were smaller than 0.01 eV Å−1 and 10−6 eV, respectively. A kinetic energy cutoff of 520 eV was adopted. The Brillouin zone was sampled with a 3 × 3 × 3 k-mesh grid for the structure optimization step. The obtained lattice parameters of austenite were a = b = c = 3.646 Å, those of ferrite were a = b = c = 2.839 Å, and those of Fe3C were a = 4.491 Å, b = 5.030 Å, c = 6.739 Å, which agreed well with previous theoretical and experimental results.18,19 For the calculation of the XAS spectrum, the super-cell core-hole method as implemented in the VASP code was used.16 For the XAS spectrum calculations, the inclusion-containing structures were created in several steps (Fig. 1). At the first step, supercells (either austenite, ferrite or Fe3C) were created based on the previously optimized unitcells of crystals. Particularly, a 3 × 3 × 3 supercell (172 iron atoms) of the unitcells of austenite was used. A ferrite supercell model consisting of 122 iron atoms was created of 4 × 4 × 4 unitcells. A Fe3C supercell model consisting of 144 iron atoms and 48 carbon atoms was created of 3 × 2 × 2 unitcells. At the second step, cluster-like inclusions (BN, TiN, and AlN) consisting of 10 atoms were created and preoptimized. At the third step, the atoms located in the middle of steel matrixes were removed, and the cluster-like inclusions were placed instead. The final structures, which were inclusion-containing steel matrices, were optimized. Periodic boundary conditions were applied in all three transverse directions. To avoid the core-hole effect from the neighboring cells, the considerably large supercells with a size not smaller than 11 × 11 × 11 Å were considered. The structures were fully optimized until the atomic forces and total energy values were smaller than 0.01 eV Å−1 and 10−6 eV, respectively. A kinetic energy cutoff of 520 eV was adopted. A 9 × 9 × 9 k-mesh grid in the Brillouin zone was used. The supercell core-hole based on the representation of a solid as a supercell using periodic boundary conditions and a core hole was created by removing a core electron and placing it into the conduction bands. | ||
| Fig. 1 Schematic representation of the inclusion-containing steel matrix model preparation. | ||
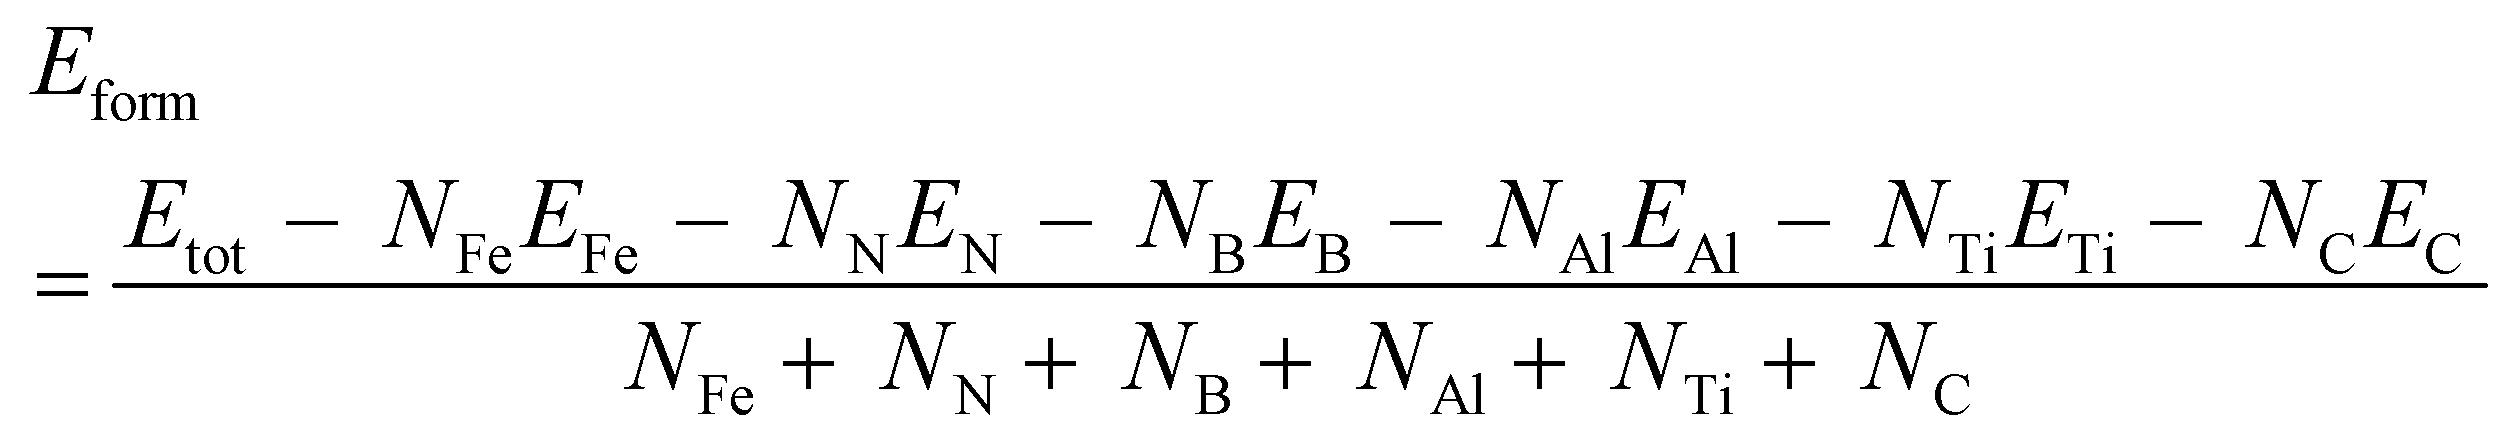
Formation energy Eform of bare and inclusion-containing steel matrices was defined as
 | (1) |
The sample of interest for this investigation was a commercial low-alloyed carbon steel with a nominal composition of 0.15C, 0.3Si, 1.0Mn, 0.4Cr in wt%. Its structural phase, micrograph, and spectro-microscopic measurements were recorded and analyzed via high energy synchrotron X-ray diffraction, FE-SEM and X-PEEM, respectively. Incident beam of a 2 × 10⁻⁴ bandwidth and photon flux of 1–5 × 10¹² ph s−1 were set. A SX-700 monochromator with Au/Si 1200-line per mm grating was used to probe the B K-edge, N K-edge, and Ti L 2,3-edge XAS. The incident photon energy was scanned at a 0.2 eV step for B K-edge and N K-edge, and a step of 0.1 eV was set for L 2,3-edge. More details of the experimental setup were presented in our previous report.8
Results and discussion
Fig. 2 presents the SEM image of the steel matrix (Fig. 2a) hosting BN and TiN inclusions, computational model of inclusions in steel matrix (Fig. 2b) and enlarged BN and TiN inclusions (Fig. 2b and c). According to the HE-SXRD data (Fig. 2e), ferrite was the major phase in the studied sample, a small amount of retained austenite and cementite phases can also be in place.8 It is known that NMIs of the ppm-level concentration are hardly detectable through HE-SXRD,20 and the SEM–EDS mapping analysis only provides the elemental information. However, based on the SEM–EDS mapping analysis, we found that the selected inclusions in the steel sample were nitrides with mostly Ti and B compounds, and the possible presence of Al-based compounds.8 | ||
| Fig. 2 Steel matrix with several inclusions (a), schematic of computational model representing steel matrix containing an inclusion (b), zoomed BN and TiN inclusions (c and d), and the HEXRD showing three-phase content of the steel matrix (e). | ||
To get insights into the stability of different nitride inclusions in common steel matrices, DFT-based calculations were conducted. Three nitride inclusions experimentally observed in the studied sample, BN, TiN, and AlN, were considered in three experimentally observed matrices, which are austenite, ferrite, and Fe3C. Based on the formation energy, Eform calculations (Table 1), the formation of BN inclusions was more energetically favourable in the ferrite matrix, while TiN inclusions were more stable in the austenite matrix. Both BN and TiN inclusions may exist in the Fe3C matrix, but their formation energy was considerably high. In all studied matrices the formation of AlN inclusions was found to be less energetically favourable compared to the formation of BN and TiN inclusions. Further, the comparison of calculated and experimental XAS spectra was performed to elucidate the similarities and origins of nitride inclusions in common steel matrices based on spectroscopic features.
| Steel matrix | Bare | BN-containing | TiN-containing | AlN-containing |
|---|---|---|---|---|
| Austenite | 0.15 | −0.45 | −0.62 | −0.45 |
| Ferrite | 0.14 | −0.41 | −0.26 | −0.19 |
| Fe3C | 0.01 | −0.13 | −0.12 | −0.06 |
Proceeding from the formation energy calculations, XAS analysis was only performed for the TiN-containing austenite, BN-containing ferrite, and BN-containing Fe3C matrices. Previously, it has been confirmed that characteristics of XAS spectra for the B K-edge and N K-edge in h-BN/metal interfaces can be reasonably reproduced by DFT calculations.14 Here, experimentally measured XAS spectra for h-BN and TiN inclusions in the steel sample, DFT-calculated XAS spectra for BN and TiN inclusions in different steel matrices (computational models) and DFT-calculated XAS spectra for bulk h-BN and TiN were compared. Such a comparison aimed to validate our calculations and targeted to facilitate the identification of nitrogen-based inclusions within common steel matrixes.
The comparison of experimental and calculated XAS spectra for the N K-edge and Ti K-edge together with the computational model of the TiN inclusion in the austenite matrix is shown in Fig. 3. According to Fig. 3a, the XAS spectrum for the N K-edge can be divided into two regions. The first region was represented by the doublet at threshold (marked as n1 and n2), and was formed by unoccupied N 2p states, which are hybridized with Ti 3d states. The presented peaks are sharp with the width of each sub-band of ∼2.5 eV (experiment, red line) and ∼1.5 eV (DFT, green and black lines). The second region corresponds to more broadened bands (marked as n3 and n4), which are unoccupied N 2p states hybridized with Ti 4sp states. In this region, a larger dispersion of bands with a width of ∼5 eV was observed in experiment (red line), while DFT calculations (green and black lines) depicted a smaller width of ∼2.5–3 eV.
 | ||
| Fig. 3 Experimental and calculated XAS spectra of the N K-edge (a) and Ti K-edge (b) of the TiN inclusion in the austenite matrix. Computational model of the TiN inclusion in the austenite matrix (c). | ||
A typical K-edge XAS spectrum for Ti involves the main absorption edge corresponding to transitions from the 1s to 4p states and the pre-edge, which covers transitions from the 1s to 3d states. The pre-edge feature of the Ti K edge was mostly altered by the symmetry effect of the coordination of Ti with its surrounding atoms.21 According to Fig. 3b, the XAS spectrum of the Ti K-edge consists of weak intensity pre-edge peaks and edge peaks that are labeled as t1, t2, t3, and t4. Despite the simplicity of the computational model, the calculated XAS spectra of the N K-edge and Ti K-edge for the TiN inclusion in the austenite matrix well repeated the experimentally obtained one for the TiN inclusion in the steel matrix. Therefore, it can be proposed that austenite was the most probable host matrix for the TiN inclusion in our steel sample. It should be noted that Ti L-edges were not discussed as DFT approaches may be unable to adequately describe the L-edges of metals as these edges are dominated by multi-electron-excitation effects.22 More detailed discussion is presented in Fig. S1 (ESI†).
Fig. 4 shows the comparison of experimental and calculated XAS spectra of B K-edge and N K-edge together with the model of the BN inclusion in the ferrite matrix. The broadened π* states of boron, visible at the b1 region (Fig. 4a), may not be related to the nature of B atoms but to the anisotropy of their bonds, which can lead to the incomplete screening of the core-hole in this structure.23
 | ||
| Fig. 4 Experimental and calculated XAS spectra of B K-edge (a) and N K-edge (b) of the BN inclusion in the ferrite matrix. Computational model of the BN inclusion in the ferrite matrix (c). | ||
Bond anisotropy is clearly depicted in Fig. 5 from the asymmetry of XAS spectra of individual B and N atoms of the BN inclusion in the ferrite matrix. Moreover, at the b2 and b3 regions, the localized σ* (2px, 2py) antibonding states between B and N atoms were observed on both DFT (DFT, green and black lines) and experimental XAS spectrum plots (red line) in Fig. 4a. Considering that DFT-calculated N K-edge of the BN inclusion in the ferrite matrix has similar characteristic features as those of experimentally measured ones (Fig. 4b), it can be proposed that ferrite is the host matrix for the TiN inclusion in our sample.
 | ||
| Fig. 5 Calculated XAS spectra of N K-edge (a) and B K-edge (b) for individual atoms of the BN inclusion in the ferrite matrix. Inset figures show the BN inclusion with the numeration of atoms. | ||
According to Table 1, Eform of inclusions in the Fe3C matrix is higher than that of inclusions in the austenite and ferrite matrixes. This was also confirmed by XAS analysis; for instance, the spectral shape of the B K-edge (Fig. 6a) and N K-edge (Fig. 6b) of the BN inclusion in the Fe3C matrix significantly broadened compared to those in other considered matrices. Particularly, the b1 region of the B K-edge was constructed of the π-bonded states of individual B atoms of the BN inclusion. Indeed, the XAS spectra of individual B and N atoms of the BN inclusion (Fig. 7) in the Fe3C matrix are significantly asymmetric, and the center of their peaks shifted towards each other, which suggests that the atomic orbitals of the inclusion's atoms were mixed with those of the matrix's atoms. The density of states (DOS) analysis (Fig. S2, ESI†) of the BN inclusion's atoms in the Fe3C matrix reinforced this presumption as a strong hybridization of C-p states with B-p and N-p states was found. A similar behaviour was expected for the TiN inclusion in the Fe3C matrix, as shown in the DOS plot in Fig. S3 (ESI†). Therefore, the inclusions are less stable and significantly disordered in the Fe3C matrix compared to the austenite and ferrite matrices.
 | ||
| Fig. 6 Experimental and calculated XAS spectra of B K-edge (a) and N K-edge (b) of the BN inclusion in the Fe3C matrix. Computational model of the BN inclusion in the Fe3C matrix (c). | ||
 | ||
| Fig. 7 Calculated XAS spectra of the N K-edge (a) and B K-edge (b) for individual atoms of the BN inclusion in the Fe3C matrix. Inset figures show the BN inclusion with the numeration of atoms. | ||
As mentioned in the introduction, the formation of different nitride inclusions, such as Al, BN, and TiN, is highly possible in steels. These nitride inclusions play different roles in steel performance. Therefore, the proper characterization of nitride inclusions in steels is required to control their unwanted formation. Based on the stability of the individual nitrides in individual phases of the steel matrix, one can control the formation of NMIs indirectly. This means that during the metallurgy process, just like one can control the phases in the steel matrix and so possibly the associated formation of individual nitride inclusions.
A previous experimental work coupled with DFT-based calculations8 investigated the structure, local bonding structure, and electronic properties of several NMIs, and their interaction mechanism within and the steel matrix. SEM–EDS mapping analysis revealed that most inclusions in the steel sample were nitrides with mostly titanium and boron compounds and possible presence of aluminum-based compounds. Although nitride inclusions in the steel matrix were observed, it is difficult to define their stability and to probe which phase they are in due to the complex microstructure of steel and limitations of available experimental methods for such determinations.
In this study, an in-depth investigation of the formation of nitride-based NMIs in common steel matrices was performed via experiment-supported DFT-based calculations. Particularly, experimental spectromicroscopic data were implemented in a theoretical model describing nitride-based NMIs in common steel matrices. Further, based on this model, DFT-based simulations were utilized to discover the formation of specific nitride-based NMIs depending on the type of the steel matrix based on their formation energies and XAS spectra. Although the occurrence of TiN inclusions in single-phase ferrite24 and BN inclusions in single-phase austenite25 is possible and has been noted beforehand, our results suggested a certain preference of each inclusion in the mixed-phase steel. It was found that TiN inclusions preferentially formed in the austenite matrix, while the ferrite matrix generally hosted BN inclusions. Furthermore, although the presence of both TiN and BN inclusions in the Fe3C matrix is possible, their formation was hampered due to a strong interaction of the inclusions’ atoms with the carbon atoms in the matrix.
Conclusions
Our recent spectro-microscopic investigations demonstrated the formation of BN and TiN inclusion stabilized with a Ca-based inclusion.8 However, BN and TiN inclusions did not co-exist within the same inclusion. In order to decipher the reason behind their hatred nature for each other, we have carried out detailed DFT studies to calculate formation energies and XAS along with DOS, which showed that TiN inclusion preferentially formed in the austenite matrix, while the ferrite matrix generally hosted BN inclusions. Furthermore, although the presence of both BN and TiN inclusions in the Fe3C matrix is possible, their formation was hampered due to a strong interaction of the inclusions’ atoms with the carbon atoms in the matrix. Our experiment driven DFT investigation uncovers the regularity in the formation of specific nitride-based NMIs depending on the type of matrix and provides important information on the possibility of the controlled formation of nitride inclusions in a particular phase during commercial steel production.Author contributions
A. A. K.: DFT calculations, XAS analysis and writing; E. R.: contributed to the manuscript writing; H. S.: problem planning, conceptualization and writing; T. F. and M. H.: commenting on the manuscript; W. C.: calculations discussions.Conflicts of interest
On behalf of all authors, the corresponding author states that there is no conflict of interest.Acknowledgements
Authors acknowledge Academy of Finland grant #311934 for the financial support. The authors acknowledge CSC – IT Center for Science, Finland for computational resources and the Centre for Material Analysis, University of Oulu for in-house characterizations. We also thank the crew of the MAX IV laboratory and Dr Ulrich Lienert, P21.2 beamline, PETRA III, Germany for their support during the beamtime operation. HS also thanks Dr Tuomas Alatarvas for providing the sample for spectro-microscopic and HEXRD measurements and Dr Frank de Groot for the discussion on the XPS data analysis.References
- M. Tisza and I. Czinege, Int. J. Lightweight Mater. Manuf., 2018, 1, 229–238 Search PubMed.
- A. M. G. Coelho and F. Bijlaard, Adv. Struct. Eng., 2010, 13, 413–429 CrossRef.
- F. Javidan, A. Heidarpour, X. L. Zhao and J. Minkkinen, Thin-Walled Struct., 2016, 102, 273–285 CrossRef.
- A. L. Vasconcellos da Costa e Silva, J. Mater. Res. Technol., 2018, 7, 283–299 CrossRef CAS.
- P. Ghosh and R. K. Ray, Automotive Steels, Design, Metallurgy, Processing and Applications, Elsevier, 2017, pp. 113–143 Search PubMed.
- M. J. Balart, C. L. Davis and M. Strangwood, Scr. Mater., 2004, 50, 371–375 CrossRef CAS.
- J. Burja, M. Kolenik, S. Zuperl and G. Klannik, Mater. Technol., 2019, 53, 919–928 CAS.
- H. Singh, T. Alatarvas, A. A. Kistanov, S. A. Aravindh, S. Wang, L. Zhu, B. Sarpi, Y. Niu, A. Zakharov, F. M. F. de Groot, M. Huttula, W. Cao and T. Fabritius, Scr. Mater., 2021, 197, 113791 CrossRef CAS.
- F. M. F. de Groot, M. O. Figueiredo, M. J. Basto, M. Abbate, H. Petersen and J. C. Fuggle, 2p, Phys. Chem. Miner., 1992, 19, 140–147 CrossRef CAS.
- F. M. F. de Groot, J. C. Fuggle, B. T. Thole and G. A. Sawatzky, Phys. Rev. B: Condens. Matter Mater. Phys., 1990, 41, 928 CrossRef CAS PubMed.
- Y. Liang, J. Vinson, S. Pemmaraju, W. S. Drisdell, E. L. Shirley and D. Prendergast, Phys. Rev. Lett., 2017, 118, 096402 CrossRef PubMed.
- J. Engel, S. Francis and A. Roldan, Phys. Chem. Chem. Phys., 2019, 21, 19011–19025 RSC.
- Z. Peng, J. Liu, F. Huang, Q. Hu, Z. Cheng, S. Liu and Y. Cheng, Steel Res. Int., 2018, 89, 1700566 CrossRef.
- R. Laskowski, Th Gallauner, P. Blaha and K. Schwarz, J. Phys.: Condens. Matter, 2009, 21, 104210 CrossRef CAS PubMed.
- G. Kresse and J. Furthmüller, Phys. Rev. B: Condens. Matter Mater. Phys., 1996, 54, 11169–11186 CrossRef CAS PubMed.
- A. Jain, S. P. Ong, G. Hautier, W. Chen, W. D. Richards, S. Dacek, S. Cholia, D. Gunter, D. Skinner, G. Ceder and K. A. Persson, APL Mater., 2013, 1, 011002 CrossRef.
- J. P. Perdew, K. Burke and M. Ernzerhof, Phys. Rev. Lett., 1996, 77, 3865–3868 CrossRef CAS PubMed.
- J. K. Kesavan, D. F. Mosca, S. Sanna, F. Borgatti, G. Schuck, P. M. Tran, P. M. Woodward, V. F. Mitrović, C. Franchini and F. Boscherini, J. Phys. Chem. C, 2020, 124, 16577–16585 CrossRef CAS PubMed.
- S. Wang, A. A. Kistanov, G. King, S. Ghosh, H. Singh, S. Pallaspuro, A. Rahemtulla, M. Somani, J. Kömi, W. Cao and M. Huttula, Acta Mater., 2021, 221, 117361 CrossRef CAS.
- F. Gyakwaa, M. Aula, T. Alatarvas, T. Vuolio, Q. Shu, M. Huttula and T. Fabritius, ISIJ Int., 2020, 60, 988–997 CrossRef CAS.
- C. H. M. van Oversteeg, H. Q. Doan, F. M. F. de Groot and T. Cuk, Chem. Soc. Rev., 2017, 46, 102–125 RSC.
- R. P. Wang, B. Liu, R. J. Green, M. U. Delgado-Jaime, M. Ghiasi, T. Schmitt, M. M. van Schooneveld and F. M. F. de Groot, J. Phys. Chem. C, 2017, 121, 24919–24928 CrossRef CAS PubMed.
- K. Lawniczak-Jablonska, T. Suski, I. Gorczyca, N. E. Christensen, K. E. Attenkofer, R. C. C. Perera, E. M. Gullikson, J. H. Underwood, D. L. Ederer and Z. L. Weber, Phys. Rev. B: Condens. Matter Mater. Phys., 2000, 61, 16623 CrossRef CAS.
- H. J. Duan, Y. Zhang, Y. Ren and L. F. Zhang, J. Iron Steel Res. Int., 2019, 26, 962–972 CrossRef CAS.
- N. Shinya, J. Kyono and K. Laha, J. Intell. Mater. Syst. Struct., 2006, 17, 1127–1133 CrossRef CAS.
Footnote |
| † Electronic supplementary information (ESI) available. See DOI: 10.1039/d1cp05068k |
| This journal is © the Owner Societies 2022 |