Thermally induced dehydration reactions of monosodium L-glutamate monohydrate: dehydration of solids accompanied by liquefaction†
Takahiro
Okazaki
a,
Masami
Hara
a,
Nikita V.
Muravyev
b and
Nobuyoshi
Koga
 *a
*a
aDepartment of Science Education, Division of Educational Sciences, Graduate School of Education, Hiroshima University, 1-1-1 Kagamiyama, Higashi-Hiroshima 739-8524, Japan. E-mail: nkoga@hiroshima-u.ac.jp; Fax: +81-82-424-7092; Tel: +81-82-424-7092
bSemenov Federal Research Center for Chemical Physics, Russian Academy of Sciences, 4 Kosygin Str., 119991, Moscow, Russia
First published on 6th December 2021
Abstract
In this study, we investigated the mechanistic features and kinetics of the thermal decomposition of solids accompanied by liquefaction as exemplified by the thermal dehydration reactions of monosodium L-glutamate monohydrate (MSG-MH). The thermal dehydration of MSG-MH occurs via two mass-loss processes comprising the elimination of crystalline water and intramolecular dehydration. Multistep kinetic behaviors and the liquefaction during both thermal dehydration processes were evidenced by systematic thermoanalytical measurements and in situ microscopic observations. During the thermal dehydration of crystalline water, the liquefaction of the surface product layer occurred midway through the reaction, and the subsequent reaction proceeded with a geometrical constraint, where the solid reactant was covered by a liquid surface layer, affording a solid anhydride. The intramolecular dehydration of the solid anhydride yielded a liquid product on the surface of the reacting particles, and the internal solid reactant dissolved in the liquid product. Subsequently, the intramolecular dehydration proceeded in the liquid phase to afford liquid sodium pyroglutamate. The net kinetic behavior of the physico-geometrical reaction steps in each thermal dehydration process was revealed using kinetic approaches based on cumulative and conjunct kinetic equations. The advanced kinetic approaches employed to reveal the specific kinetic features of the heterogeneous reaction processes in solid–liquid–gas systems are described in this article.
1. Introduction
The thermal decomposition of solids in solid–gas systems is a complex heterogeneous process.1–4 The overall kinetics is governed by geometrical constraints and interactions of many physical and chemical processes, including nucleation and growth, interfacial reaction, and gaseous diffusion. Thus, the apparent kinetics of many reactions significantly depends on the sample and reaction conditions.5 Additionally, further complications are developed, if a liquid phase is formed during the decomposition reaction.6–15 The contributions of the liquid phase to the thermal dehydration/decomposition of solids dramatically alter the apparent reaction kinetics, as well as the reaction pathway and morphology of the solid product. During the thermal decomposition of solids, the formation of liquid phases can occur via different physical processes involving the reactant or solid products, including melting,16–21 glass transition of the amorphous phase,13 eutectic melting of the solid reactant and product,14 condensation of the gaseous product,10,22–25 and gelation/deliquescence via the interaction of the solid and gaseous products.6–8,11,12,15,26 Additionally, the dissolution of the solid phase to the liquid phase can occur as the secondary step of the liquefaction process.14 Therefore, the various liquefaction phenomena that occur midway through the reaction and their influence on the overall reaction kinetics due to the significant variations in physico-geometrical constraints should be clarified to gain further insights into the specific pathways of thermal dehydration/decomposition of solids and to develop more sophisticated methods for producing functional materials through thermal decomposition.In this study, the thermal dehydration reactions of monosodium L-glutamate monohydrate (MSG-MH) were selected to investigate the specific pathways of the thermal decomposition of solids accompanied by liquefaction. MSG-MH is a widely used “umami” seasoning in Japanese and Asian dishes. Previous studies have shown that the thermal dehydration of MSG-MH occurs via two mass-loss processes in separated temperature regions, with heating under linearly increasing temperature conditions.27,28 The first mass-loss process corresponds to the thermal dehydration of crystalline water to form anhydride (MSG-AH).
| HOOC(CH2)2CH(NH2)COONa·H2O → HOOC(CH2)2CH(NH2)COONa + H2O | (1) |
 | (2) |
In this study, the contributions of liquefaction to the thermal dehydration reactions of MSG-MH to SPyrG via MSG-AH and its influences on the physico-geometrical reaction pathway, kinetics, and the morphology of the product were investigated through systematic thermoanalytical measurements under different heating conditions and in situ microscopic observations. After identifying the cause of the liquid-phase formation midway through each dehydration process, the net kinetic behavior of the component reaction step in the physico-geometrical multistep process was investigated by kinetic deconvolution analysis (KDA).4,30–32 Based on the kinetic results, the specific pathways of the thermal decomposition of solids accompanied by liquefaction and the possible procedures of kinetic modeling were explored.
2. Experimental
2.1 Sample and characterization
The monosodium L-glutamate monohydrate reagent (MSG-MH, special grade) was purchased from Sigma Aldrich Japan and used without further purification. The MSG-MH crystalline powders were sieved to obtain different particle-size fractions, and the 300–500 μm fraction was used as the sample. The sample powder was observed using a stereomicroscope (SZX7, Olympus) and characterized by powder X-ray diffractometry (XRD) and Fourier transform infrared spectroscopy (FT-IR). The sample was characterized as crystalline MSG-MH (orthorhombic, S.G.: P212121(19), a = 17.9560, b = 15.2460, c = 5.5682, α = β = γ = 90.000, ICDD PDF 00-029-1787)33 with a columnar shape. Details are provided in Section S1 in the ESI† (Fig. S1–S3).2.2 Study of thermally induced reaction behaviors
Approximately 5.0 mg of the MSG-MH sample powders was weighed into an aluminum open cell (diameter: 6 mm; height: 2 mm) and subjected to TG-differential thermal analysis (DTA) using a DTG60 instrument (Shimadzu). The sample was heated from room temperature to 573 K at a heating rate (β) of 5 K min−1, in a dry N2 gas flow (water vapor pressure: <0.5 kPa) at a flow rate (qv) of 100 cm3 min−1. Thereafter, it was naturally cooled to room temperature in the DTG60 instrument and reheated to 573 K under the same conditions used in the first TG-DTA run. Similarly, in another case, the first TG-DTA run was interrupted at 473 K, and the cooled sample was subjected to a second TG-DTA run.Additionally, the samples were heated in an instrument of a differential scanning calorimetry (DSC, DSC60, Shimadzu), equipped with a digital microscope (moticam2000, Shimadzu) and a zoom lens (SKL-Z300C, Saitoh Kogaku) under the same sample and measurement conditions as those used for the TG-DTA measurements. During the DSC measurements under nonisothermal conditions at a β of 5 K min−1 and isothermal conditions at 418 K in a dry N2 gas flow (qv = 100 cm3 min−1), the changes in the appearance of the sample particles in the aluminum open cell were recorded at 12 s intervals. To support the DSC-microscopy results, optical microscopic observations of the sample particles, which were once heated at β = 5 K min−1 to different temperatures (430–447 K) in a dry N2 gas flow, in a DTG60 instrument, were performed using the SZX7 stereomicroscope after the heat-treated samples were recovered at room temperature. The same process was performed for the sample particles heated preliminary at constant temperatures of 422 K and 461 K for different durations to complete the first and second mass-loss processes, respectively.
The sample particles were press-fitted on a platinum plate sample holder and subjected to high-temperature XRD (HTXRD) measurements using a RINT2200V instrument (Rigaku), equipped with a programable heating chamber (PTC-20A, Rigaku). The sample was heated from room temperature to 473 K at a β of 2 K min−1, in a dry N2 gas flow (qv = 100 cm3 min−1), during which isothermal holding sections for each 15 min interval were incorporated every 10 K from 373 K to 473 K. The XRD patterns of the sample were recorded for each isothermal holding section by applying the conditions used in the XRD measurement for the original sample characterization (Section S1, ESI†). In the other series of HTXRD measurements, the sample was heated to 428 K at a β of 10 K min−1, and the sample temperature was maintained at 428 K for 5 h in a dry N2 gas flow (qv = 100 cm3 min−1). The changes in the XRD pattern during isothermal heating at 428 K were continuously recorded.
2.3 Kinetic data measurement
Approximately 0.5 mg of glass wool was lined on the inner-bottom surface of the aluminum open cell (diameter: 6.0 mm; height: 2.0 mm). Approximately 5.0 mg of the MSG-MH sample (sieved fraction: 300–500 μm) was weight on the glass wool liner to prevent contact between the sample particles and the inner surfaces of the pan. The sample was subjected to TG-DTA measurements in a dry N2 gas flow (qv = 100 cm3 min−1), under linear nonisothermal and isothermal conditions. For the linear nonisothermal measurements, the sample was heated from room temperature to 573 K at different β values of 0.3–5 K min−1. Since the two mass-loss processes were observed during the measurements under the linear nonisothermal conditions, they were separately subjected to the measurements under isothermal conditions. To examine the first mass-loss process, the sample was heated at β = 10 K min−1 to the programmed temperature (414 ≤ T/K ≤ 422), and this temperature was maintained until the mass-loss process was terminated. To examine the second mass-loss process, the first mass-loss process was preliminarily completed by isothermal heating at 422 K for 90 min, subsequently, the sample temperature was increased at β = 10 K min−1 to the programmed temperature (453 ≤ T/K ≤ 461) and maintained to record the mass-loss curves derived from the second mass-loss process.3. Results and discussion
3.1 Thermal behavior
On heating the MSG-MH sample from room temperature to 573 K in a dry N2 gas flow, two distinct mass-loss processes, accompanied by endothermic effects, were manifested in the TG-DTA curves (Fig. 1). Although a slight overlap between the first and second mass-loss curves was observed, the mass-loss value due to the first process occurring between 425 K and 475 K was determined to be approximately 10%, which corresponds to the calculated value (9.63%) for the thermal dehydration of MSG-MH to MSG-AH (eqn (1)). The second mass-loss process, which occurred between 475 K and 550 K, also exhibited a mass-loss value of approximately 10%. The mass-loss behaviors attributed to the thermally induced two-step dehydration agree with those reported previously,27,28 and the second mass-loss process can be interpreted to be the thermally induced intramolecular dehydration of MSG-AH to form SPyrG.28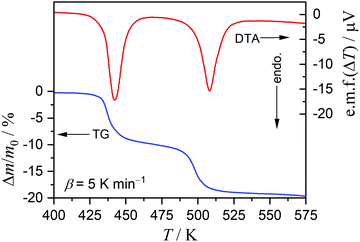 | ||
| Fig. 1 TG-DTA curves recorded during the heating of the MSG-MH sample (m0 = 5.01 mg) from room temperature to 573 K at a β of 5 K min−1, in a dry N2 gas flow (qv = 100 cm3 min−1). | ||
Dramatic changes in the sample morphologies during the two dehydration reactions were revealed by in situ microscopic observations during a DSC measurement, under the same conditions employed for the TG-DTA measurement (Fig. 1), as shown in Fig. 2. Although the particle shape was maintained during the first thermal dehydration process (Fig. 2(a)–(e)), there were evident changes in the surface textures and properties. During the acceleration stage of the first thermal dehydration process, the formation of a liquid phase layer on the particle surfaces was ascertained by diffuse reflection (Fig. 2(b) and (c)). The solidification of the liquid surface layer was observed during the deceleration stage of the first thermal dehydration process (Fig. 2(d) and (e)), resulting in the adhesion of adjacent particles. The formation of a liquid phase from the as-produced solidified MSG-AH was also observed during the second thermal dehydration process (Fig. 2(e)–(i)). The liquid phase started to appear on the particle surface of MSG-AH from the initial stage of the second thermal dehydration process (Fig. 2(f) and (g)) and expanded as the reaction progressed. The entire sample was liquefied midway through the reaction immediately after the top of second endothermic peak appeared in the DSC curve (Fig. 2(h)). Finally, liquid SPyrG was formed as the product of the second thermal dehydration.
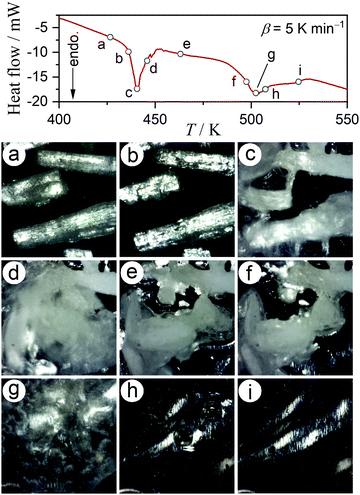 | ||
| Fig. 2 Snapshots of the MSG-MH sample taken during DSC measurements at a β of 5 K min−1, in a dry N2 gas flow (qv = 100 cm3 min−1). | ||
The formation of the liquid phase and subsequent solidification during the first thermal dehydration process were more clearly evidenced by optical microscopic observations of the sample particles recovered after heating to different temperatures (facilitating different fractional reactions (α1)) and cooling to room temperature (Fig. S4, ESI†). In the first half of the first thermal dehydration process, the particles lost clarity and the particle edges became rounded (Fig. S4(a) and (b), ESI†). The sample particles, once heated to the midway point of the first thermal dehydration process, exhibited significant adhesion between adjacent particles (Fig. S4(c), ESI†). The observed changes in the particle morphologies and the adhesion of the particles support the formation of a liquid phase on the particle surfaces during the initial stages of the first thermal dehydration process. On further heating and completion of the first thermal dehydration process, no distinguishable changes in the appearance were observed (Fig. S4(d), ESI†), indicating that the liquid phase did not form during the second half of the first thermal dehydration process. The formation of a solid product at the end of the first thermal dehydration process was confirmed by HTXRD (Fig. S5, ESI†). For the sample heated to reach completion of the first mass-loss process (473 K) and cooled naturally to room temperature in the instrument in a dry N2 gas flow, the second TG-DTA run did not exhibit any change in the TG and DTA curves during reheating to 473 K. In the temperature range of the first thermal dehydration process, diffraction peaks attributed to MSG-MH are observed until the end of the reaction (Fig. S5(a), ESI†). It is, thus, interpreted that, for each particle, the first thermal dehydration process proceeds with a self-generated core–shell structure comprising MSG-MH core and a surface liquid layer. The samples heated to the end of the first thermal dehydration process exhibited diffraction peaks attributed to MSG-AH (Fig. S5(b), ESI†), which evidence the formation of a crystalline phase as the product of the first thermal dehydration process. Therefore, under linear nonisothermal conditions, in a dry N2 gas flow, the first thermal dehydration process is accompanied by the formation of a liquid phase on the particle surfaces in the initial stage of the reaction; subsequently, the reacting particles solidify to form crystalline anhydride. In contrast, the thermal dehydration of MSG-AH is characterized by the formation of a liquid phase in the first half of the reaction and the subsequent reaction in the liquid phase, resulting in the formation of a liquid SPyrG.
The same phase-change behaviors under linear nonisothermal and isothermal conditions were expected in both the first and second thermal dehydration processes. The appearances of the products of the respective thermal dehydration processes under isothermal conditions coincide with those of the products obtained under linear nonisothermal conditions (Fig. S6, ESI†). Superficially, the products of the first and second thermal dehydration processes exhibited the morphologies of adhered particles (Fig. S6(a), ESI†) and an expanded transparent layer at the bottom of the sample pan (Fig. S6(b), ESI†), respectively. The formation of crystalline MSG-AH by the first thermal dehydration process is also confirmed by monitoring the changes in the XRD patterns during heating under isothermal conditions at 428 K (Fig. S7, ESI†).
3.2 Thermal dehydration reactions under different heating conditions
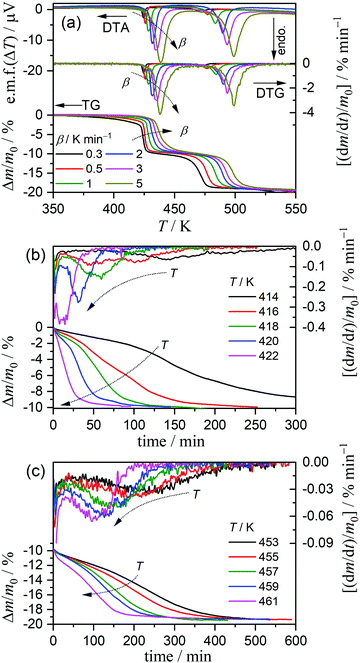
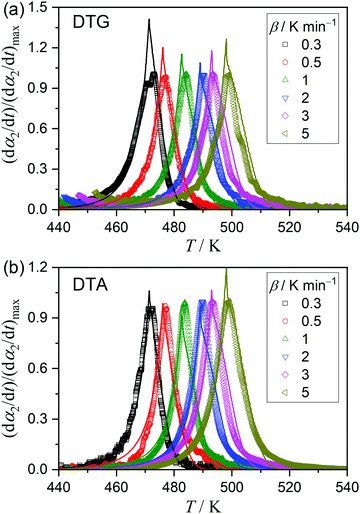
The kinetics of the thermal dehydration reactions of MSG-MH was investigated by simultaneously analyzing the mass-loss curves recorded under linear nonisothermal and isothermal conditions, in a dry N2 gas flow (Fig. 3). Under linear nonisothermal conditions, two dehydration processes occurred in separated temperature regions irrespective of the β values applied (0.3 ≤ β/K min−1 ≤ 5) (Fig. 3(a)), from which the relative mass-loss values of 9.70 ± 0.19% and 9.56 ± 0.16% were determined for the thermal dehydration of crystalline water and intramolecular dehydration, respectively. These mass-loss values agree with the calculated values according to eqn (1) and (2). Both mass-loss processes shifted systematically toward high-temperature regions as the β value increased. Therefore, a series of nonisothermal kinetic curves at different β values for the individual reaction processes was obtained by normalizing the mass-loss curves with reference to the total mass-loss value of each reaction process. For the calculation, the fractional reactions of the elimination of crystalline water (the first mass-loss process) and intramolecular dehydration (the second mass-loss process) were defined as α1 and α2, respectively. Under isothermal conditions, the mass-loss curves for the thermal dehydration of crystalline water exhibited a distinguishable inflection point midway through the reaction (Fig. 3(b)). This might be correlated with the changes in the reaction behaviors, characterized by the surface reaction in the solid state and the subsequent formation of a liquid phase in the surface product layer as observed microscopically. The intramolecular dehydration, characterized by the complete liquification midway through the reaction, was reflected by sigmoidal mass-loss curves under isothermal conditions (Fig. 3(c)), where the initial rapid mass-loss part was observed before achieving the constant temperature. Despite the complex shape of the mass-loss curves for both reaction steps, the overall reaction rate systematically increased with an increase in the temperature for each reaction process under isothermal conditions. Thus, the overall mass-loss curves for each reaction process were converted to the kinetic curves with reference to the total mass-loss value for each reaction process.3.3 Kinetics of the thermal dehydration of crystalline water
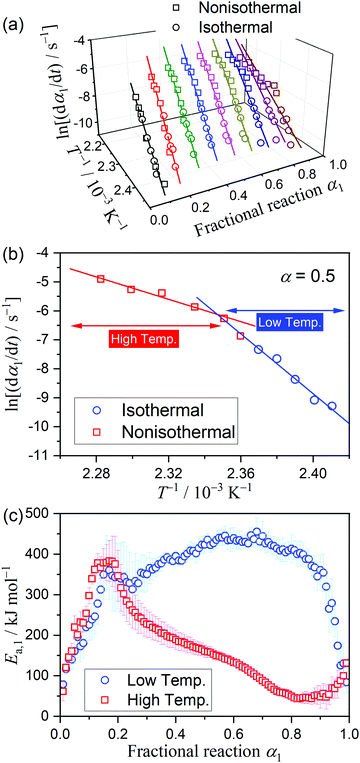
The kinetic curves for the thermal dehydration of crystalline water, corresponding to the first mass-loss process under linear nonisothermal and isothermal conditions (Fig. S8, ESI†) were simultaneously subjected to kinetic calculations. Despite the multistep reaction behavior, the conventional kinetic analysis of the single-step reaction was initially attempted based on the fundamental kinetic equation:22,34–36 | (3) |
 | (4) |
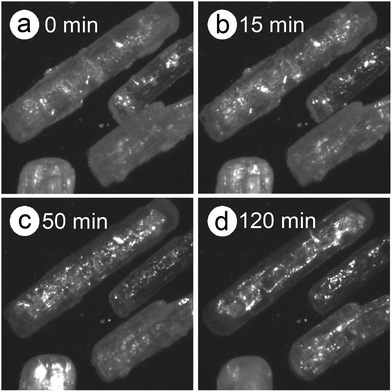
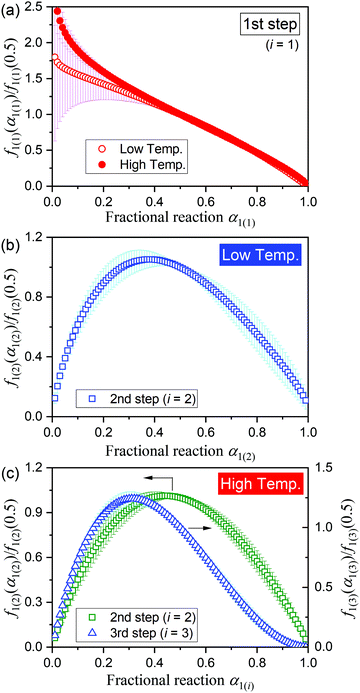
The differences in the Ea variation trend in the high- and low-temperature regions with the border at the data point recorded at β = 0.5 K min−1 evidence the need to analyze the multistep process in the respective high- and low-temperature regions with reference to the data point of β = 0.5 K min−1. In the high-temperature region, the overall reaction can be reasonably described by a three-step process based on the shape of the nonisothermal kinetic curves (Fig. S8(a), ESI†) and the Ea,1 variation trend (Fig. 4(c)), which is characterized by an initial increase (α1 < 0.15), a subsequent decrease (0.15 < α1 < 0.6), and further decrease to attain a plateau (0.6 < α1 < 0.9). From the microscopic observations of the formation of the liquid surface layer midway through the reaction and the subsequent solidification to complete the thermal dehydration of crystalline water (Fig. 2(a)–(e) and Fig. S4, ESI†), the three reaction steps can be interpreted to comprise the followings: (1) thermal dehydration on the surface of the crystalline MSG-MH to form the liquid surface layer, (2) interfacial reaction and elimination of water vapor through the liquid surface layer, and (3) solidification of the liquid surface layer. In the low-temperature region, the Ea,1 variation trend is characterized by an initial increase and a subsequent constant value in the major reaction process (Fig. 4(c)). Fig. 5 shows snapshots of the sample particles during isothermal heating at 418 K in a dry N2 gas flow, using DSC-microscope setup. The formation of the surface liquid layer during the reaction is evidenced by the gradual rounding of the sample particle edges and smoothing of the surfaces as the reaction progresses (Fig. 5(a)–(d)). However, in contrast to the morphological changes in the high-temperature region, the original shape of the sample particles is maintained even at the end of the thermal dehydration of crystalline water (Fig. 5(d)), and the attachment to neighboring particles is less significant. Thus, the reaction is observed to proceed steadily after the liquid surface layer is formed in the initial stage of the reaction, indicating the viability of a two-step kinetic modeling.
By adopting a simplified model, which assumes the independent multistep process, the overall reaction rate is expressed by the cumulative kinetic equation:4,30–32
 | (5) |
| SB(m,n,p): f(α) = αm(1 − α)n[−ln(1 − α)]p | (6) |
 | (7) |
Using the kinetic parameters determined through MDA and a subsequent isoconversional kinetic analysis (Table S1, ESI†) as the initial values, all the kinetic parameters were optimized via KDA to minimize the residue of square sum (F) to fit the calculated kinetic curve to the experimental kinetic curve, according to eqn (5) and (6):
 | (8) |
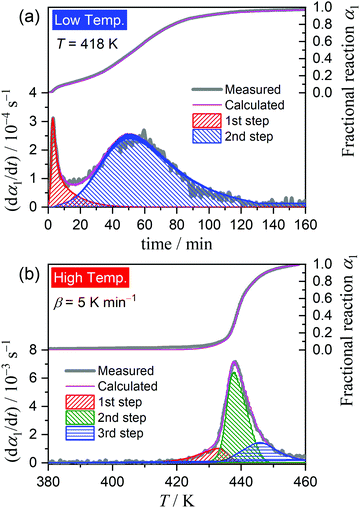
Fig. 6 shows the typical KDA results for the thermal dehydration of crystalline water in low- and high-temperature regions. The overall kinetic curves in low- and high-temperature regions were satisfactorily fitted with two- and three-component reaction steps, respectively. No distinguishable variation in the fitting performance and the optimized values of the kinetic parameters was observed at different temperatures in the low-temperature region and at different β values in the high-temperature region. Table 1 lists the optimized kinetic parameters for each step of the thermal dehydration of crystalline water; the values obtained at different temperatures in the low-temperature region and those at different β values in the high-temperature region were averaged. The contribution of the first reaction step (c1(1)) was slightly small for the low-temperature region, indicating the earlier switching from the surface reaction mode to the phase-boundary reaction mode. The apparent activation energy of the first reaction step in the low-temperature region, Ea,1(1), is also relatively small. The Ea,1(2) value in the low-temperature region and Ea,1(2) and Ea,1(3) values in the high-temperature region follow the values and variation trend of the Ea,1 value as the reaction advances, which were revealed by the formal kinetic analysis (Fig. 4(c)).
| Temp. region | i | c 1(i) | E a,1(i)/kJ mol−1 | A 1(i)/s−1 | ||||
|---|---|---|---|---|---|---|---|---|
| m 1(i) | n 1(i) | p 1(i) |
R
2![[thin space (1/6-em)]](https://www.rsc.org/images/entities/char_2009.gif)
|
|||||
| a Determination coefficient of the nonlinear least-squares analysis of KDA. | ||||||||
| Low | 1 | 0.14 ± 0.01 | 237.4 ± 1.8 | (4.19 ± 0.01) × 1026 | −1.46 ± 0.07 | 1.46 ± 0.01 | 1.51 ± 0.08 | 0.9735 ± 0.0149 |
| 2 | 0.86 ± 0.01 | 383.2 ± 4.9 | (1.12 ± 0.60) × 1045 | 4.10 ± 1.06 | −0.29 ± 0.16 | −3.33 ± 0.99 | ||
| High | 1 | 0.17 ± 0.01 | 329.0 ± 1.5 | (8.44 ± 4.30) × 1037 | −0.22 ± 0.04 | 0.81 ± 0.03 | 0.10 ± 0.01 | 0.9964 ± 0.0003 |
| 2 | 0.58 ± 0.01 | 170.1 ± 1.6 | (1.12 ± 0.44) × 1019 | 2.67 ± 0.22 | 0.39 ± 0.02 | −1.74 ± 0.27 | ||
| 3 | 0.24 ± 0.01 | 92.1 ± 1.3 | (2.22 ± 1.03) × 109 | 0.78 ± 0.06 | 2.17 ± 0.24 | 0.18 ± 0.01 | ||
To evaluate the physico-geometrical nature of each reaction step, the experimental master plots of (dα1(i)/dθ1(i))/A1(i)versus α1(i) for each reaction step were drawn using the optimized kinetic exponents in SB(m,n,p), based on the kinetic relationship of the single-step reaction:34,35,43–46
 | (9) |
The thermal dehydration of MSG-MH to form MSG-AH is constrained by the liquified surface layer formed in the initial reaction stage, defined as the first reaction step. Since MSG-AH exists as the solid phase at a high temperature, where the complete dehydration of crystalline water occurs, the gelation/deliquescence induced by the interaction between the MSG-AH and liberated water molecules can be a possible cause of the liquefaction of the surface layer. The subsequent dehydration proceeds via the liquified surface layer, accompanied by the supply of water molecules produced at the internal reaction interface to the surface layer and the evaporation of the water molecules from the surface of the liquified layer. Although the thickness of the liquified layer increases as the reaction advances, at a moderate overall dehydration rate in the low-temperature region, a certain high viscosity of the liquified layer is maintained to preserve the original particle shape. The rate behavior of the second reaction step in the low-temperature region, where the maximum reaction rate was achieved midway through the reaction step, can be correlated to the variation in the water content in the liquified surface layer, i.e., a gradual increase and subsequent decrease till the end of the dehydration. The large Ea,1(2) value (383.2 kJ mol−1) determined for the reaction in the low-temperature region is interpreted to be the apparent result that describes the temperature dependence of the overall phenomena occurring via the liquified layer. In the high-temperature region, the viscosity of the liquified layer decreases, owing to the increased formation rate of water molecules at the internal reaction interface and the increased temperature, which induces particle deformation and flowing out of the liquified phase. The liquified phase that flows out cuts off the supply of water molecules and is solidified by the evaporation of water to form MSG-AH. In each particle, the thickness of the liquified layer surrounding the unreacted MSG-MH varies depending on the part of the liquified layer. Dehydration from the thick part of the liquified layer is expected to be difficult. The changes in the geometrical configuration of the reacting particles in terms of the liquified layer and the unreacted MSG-MH cause the apparent multistep dehydration behavior in the second and third steps of the reaction in the high-temperature region.
3.4 Kinetics of the intramolecular dehydration of MSG-AH
Fig. S15 (ESI†) shows the kinetic curves for the intramolecular dehydration of MSG-AH, recorded under linear nonisothermal (Fig. S15(a), ESI†) and isothermal (Fig. S15(b), ESI†) conditions. The results of the Friedman plots for all the kinetic curves are shown in Fig. 8. Although the linearity of the Friedman plots, which included all data points under linear nonisothermal and isothermal conditions, were acceptable with a correlation coefficient better than −0.99 in a wide α2 range (0.14 ≤ α2 ≤ 0.95), a decrease in the slope was evident in the second half of the reaction (Fig. 8(a)). The Ea,2 value was approximated to be constant in the first half of the reaction with an average value of 194.7 ± 6.2 kJ mol−1 (0.1 ≤ α2 ≤ 0.65; Fig. 8(b)) and gradually decreased as the reaction advanced to completion. The change in the Ea,2 variation trend midway through the reaction is indicative of the acceleration stage due to liquefaction of the reactant and the subsequent reaction in the liquid state, as observed microscopically (Fig. 2(f)–(h)).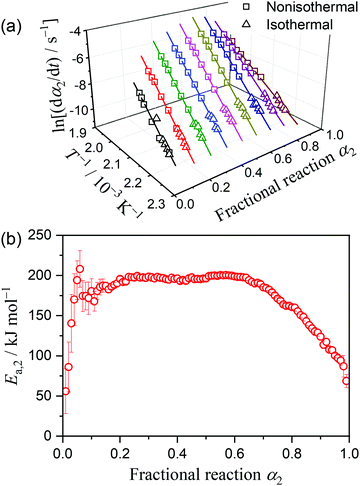 | ||
| Fig. 8 Results of the Friedman plots for the intramolecular dehydration of MSG-AH to form SPyrG: (a) Friedman plots at various α2 values, and (b) Ea,2 values at various α2 values. | ||
Considering the change in the reactant state and the reaction conditions, we attempted to empirically separate the overall thermally-induced intramolecular dehydration process into two reaction steps by MDA and KDA. The MDA results for the reaction under linear nonisothermal conditions are described in Section S4, ESI† (Fig. S16–S19 and Table S2). The results of the KDA performed using the preview values of kinetic parameters determined by MDA (Table S2, ESI†) are shown in Fig. 9. Under linear nonisothermal conditions (Fig. 9(a)), the kinetic parameters optimized by KDA did not change with β. The average values of the kinetic parameters over different β values are listed in Table 2. The contributions of the first and second reaction steps (c2(1), c2(2)), which were determined to be (0.73, 0.27), explain the change in the Ea,2 variation trend at approximately α2 = 0.65 (Fig. 8(b)) because the partial overlapping of the two reaction steps is expected. The Ea values optimized for the first and second reaction steps, i.e., (Ea,2(1), Ea,2(2)) = (203.5, 154.6) kJ mol−1, follow the Ea,2 variation trend evaluated by the Friedman plots for the overall intramolecular dehydration reaction. The A2 values for the first and second reaction steps (A2(1), A2(2)) exhibit the same magnitude relation with the isoconversional Ea,2 values, i.e., Ea,2(1) > Ea,2(2) and A2(1) > A2(2), which follows a general trend based on the kinetic compensation effect.47–54 KDA was also performed for the reactions under isothermal conditions by adopting the optimized kinetic parameters for the reactions under linear nonisothermal conditions as the initial values (Fig. 9(b)). The KDA results for the reactions under isothermal conditions did not exhibit significant deviations from those for the reactions under nonisothermal conditions (Table 2).
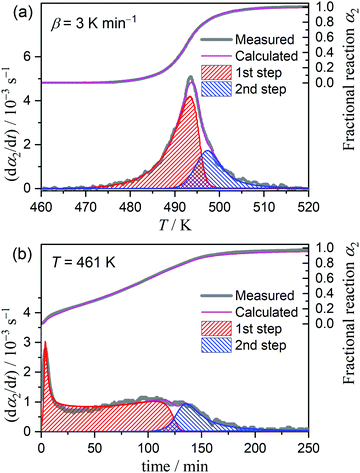 | ||
| Fig. 9 Typical KDA results for the intramolecular dehydration of MSG-AH under (a) linear nonisothermal conditions at a β of 3 K min−1 and (b) isothermal conditions at 461 K. | ||
| Heating condition | i | c 2(i) | E a,2(i)/kJ mol−1 | A 2(i)/s−1 | ||||
|---|---|---|---|---|---|---|---|---|
| m 2(i) | n 2(i) | p 2(i) |
R
2![[thin space (1/6-em)]](https://www.rsc.org/images/entities/char_2009.gif)
|
|||||
| a Determination coefficient of the nonlinear least-squares analysis of KDA. | ||||||||
| Nonisothermal | 1 | 0.73 ± 0.01 | 203.5 ± 0.2 | (2.35 ± 0.10) × 1019 | −5.36 ± 0.05 | 2.59 ± 0.03 | 5.77 ± 0.06 | 0.9979 ± 0.0012 |
| 2 | 0.27 ± 0.01 | 154.6 ± 0.6 | (7.78 ± 0.26) × 1014 | 1.39 ± 0.02 | 1.86 ± 0.10 | −0.39 ± 0.02 | ||
| Isothermal | 1 | 0.73 ± 0.01 | 205.2 ± 1.3 | (1.43 ± 0.01) × 1019 | −5.88 ± 0.26 | 2.08 ± 0.11 | 5.75 ± 0.04 | 0.9701 ± 0.0153 |
| 2 | 0.27 ± 0.01 | 151.0 ± 0.7 | (3.91 ± 0.01) × 1014 | 1.50 ± 0.02 | 2.90 ± 0.01 | −0.41 ± 0.01 | ||
Although the SB(m,n,p) function accommodates various types of physico-geometrical models with specific values of kinetic exponents, the mathematically optimized kinetic exponents SB(m2,n2,p2) in both the reaction steps exhibit significant deviations from those for the ideal reaction model. Therefore, it should be interpreted that the empirical values reproduce the best fitting during the KDA. Therefore, using the optimized A2 and SB(m2,n2,p2) values, the experimental master plots for the first and second reaction steps were drawn to evaluate the physico-geometrical features of each reaction step, as shown in Fig. 10. The first reaction step is mainly composed of the acceleration stage and exhibits the maximum rate at α2(1) = 0.66. Conversely, the second reaction step is mainly composed of the deceleration stage with the maximum rate at α2(2) = 0.33. Therefore, the first and second reaction steps are characterized by acceleration and deceleration stages, respectively. Notably, the superimposition of the two reaction steps is relatively limited (Fig. 9).
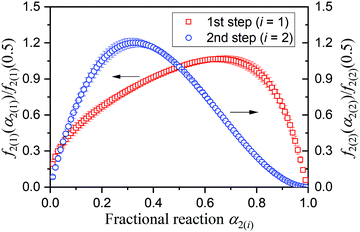 | ||
| Fig. 10 Experimental master plots for each component reaction steps in the intramolecular dehydration of MSG-AH calculated using the KDA results. | ||
When SPyrG, produced by the thermally induced intramolecular dehydration, was naturally cooled to room temperature, a glass was formed. The TG-DTA curve for the SPyrG glass, recorded by heating under linear nonisothermal conditions in a dry N2 gas flow exhibited an endothermic shift in the DTA curve at approximately 380 K without any accompanying mass change (Fig. S20, ESI†). The observed shift in the DTA curve corresponds to the glass transition of the SPyrG glass. Therefore, during the intramolecular dehydration, SPyrG is produced at a significantly higher temperature than the glass transition temperature. The liquid SPyrG layer produced on the surface of the crystalline MSG-AH is to be the diffusion path of the water vapor removal from the system. Thus, the gelation/deliquescence is also the cause of the liquified product layer, and it enhances the dissolution of residual MSG-AH into the liquid product layer. The intramolecular dehydration during the liquefaction process can be accelerated by the partial liberation of the heterogeneous constraints in the solid-state reaction. After the reacting system is completely liquified, a pseudo-homogeneous reaction can be assumed for the subsequent reaction. Thus, the deceleration of the reaction is caused by the consumption of MSG-AH in the liquified reaction system. However, notably, the intramolecular dehydration of MSG-AH in the liquified reaction system is still constrained geometrically, owing to the large viscosity of the system, which is deduced from the formation of bubbles in the reacting system during the deceleration stage of the reaction (Fig. 2(g), (h) and Fig. S6(b), ESI†).
The reaction scheme of the thermally induced intramolecular dehydration of MSG-AH accompanied by liquefaction is consistent with the basic assumption of the Bawn model.55 In the formulation of the Bawn model,55–57 the reaction rate accompanied by the progressive liquefaction of the sample at a given temperature is expressed by assuming the occurrence of first-order reactions in the solid and liquid states, with the rate constants ks and kl, respectively:
 | (10) |
| ePT(n,m,q): f(α) = (1 − α)n[1 − q(1 − α)]m | (11) |
| i | E a,2(i)/kJ mol−1 | ln(A2(i)/s−1) |
|---|---|---|
| 1 | 192.3 ± 0.3 | 42.0 ± 0.1 |
| 2 | 182.9 ± 2.9 | 39.9 ± 0.8 |
4. Conclusions
On heating MSG-MH under a linearly increasing temperature condition, the thermal dehydration of crystalline water and intramolecular dehydration occur via two-step mass-loss processes, with a 10%-mass loss in each reaction process. In both reaction processes, liquid phases are formed, which significantly influence the apparent reaction kinetics. Thus, both mass-loss processes proceed with contributions from three reactant and product phases, i.e., solid, liquid, and gaseous phases. The liquefied phase contributes to the thermal decomposition by inducing dramatic changes in the reaction geometry and the physico-geometrical reaction steps that determine the overall reaction kinetics.The first mass-loss process, corresponding to the thermal dehydration of crystalline water, is characterized by the liquefaction of the surface product layer, possibly due to the interaction (gelation/deliquescence) of the dehydration products, i.e., MSG-AH and water molecules. The process of producing the liquified surface layer occurs in the initial stage (α1 < 0.15) of the reaction, with a gradual increase in the Ea,1 value to approximately 380 kJ mol−1. Thereafter, the reaction is geometrically constrained by the transitional core–shell structure of the internal solid reactant and external liquified layer. In the reaction geometry, the overall reaction rate is determined by several factors: (i) the supply rate of water molecules to the liquified layer by the reaction at the liquefied layer–solid reactant interface, (ii) diffusion rate of water molecules in the liquified layer, and (iii) evaporation rate of water molecules from the outer surface of the liquefied layer. Therefore, the subsequent reaction behavior varies with the reaction conditions, including the temperature, as typically observed in this study. In the low-temperature region, the thermal dehydration of the crystalline water of MSG-MH proceeds while maintaining the original shape of the MSG-MH crystalline particles and an approximately constant Ea,1 value with the average value of 422.6 ± 17.2 kJ mol−1 (0.4 ≤ α1 ≤ 0.8). As the reaction proceeds, the evolution rate of water molecules at the reaction interface decreases due to the shrinkage of the interface in the scheme of contracting geometry, and the evaporation of water molecules from the liquefied layer forms the crystalline anhydride (MSG-AH). The transition in the reaction mode occurs relatively smoothly. Therefore, the overall reaction is empirically described by partially overlapping two-step processes, comprising the formation process of the liquified layer and the subsequent reaction via the liquefied layer. The first reaction step is characterized as a first-order kinetic process of linear deceleration with Ea,1(1) value of 237.4 ± 1.8 kJ mol−1, whereas the second reaction step is characterized as an autocatalytic process with the maximum rate reached midway through the second reaction step and an Ea,1(2) value of 383.2 ± 4.4 kJ mol−1 achieved. In the high-temperature region, the evolution rate of water molecules at the reaction interface is significantly high, which induces an increase in the content of water molecules in the liquefied layer and a decrease in its viscosity. The liquified layer deforms the shape of the reactant particle and alters the geometrical configuration of the reactant and product, causing a drastic change in the physico-geometrical reaction scheme. The expansion of the liquefied phase and the subsequent solidification to form crystalline MSG-AH exhibit different kinetic behavior. Therefore, the overall reaction is empirically described by a partially overlapping three-step reaction: the surface dehydrations accompanied by the formation of the liquified layer, expansion of the liquified layer, and the solidification to form the anhydride. Following the first-order like process of the formation of the liquefied surface layer in the first step with an Ea,2(1) value of 329.0 ± 1.5 kJ mol−1, the second reaction step proceeds with an autocatalytic rate behavior characterized by an Ea,1(2) value of 170.1 ± 1.6 kJ mol−1. The third reaction step contributes more significantly to the deceleration rate behavior with an Ea,1(3) value of 92.1 ± 1.3 kJ mol−1. Considering the complex reaction scheme, the physico-geometrical reaction behavior and overall kinetics are expected to vary with the applied reaction conditions, including the heating conditions and possibly atmospheric water vapor pressure and sample particle size.
The second mass-loss process, corresponding to the intramolecular dehydration of MSG-AH to form the SPyrG liquid, is characterized by the direct formation of a liquid product and the dissolution of the solid reactant in the liquid product. The overall reaction is empirically described by a two-step reaction process, comprising the acceleration toward the complete dissolution of the solid reactant in the liquid product (Ea,2(1) = ∼205 kJ mol−1) and the subsequent deceleration of intramolecular dehydration to produce the liquid product (Ea,2(2) = ∼155 kJ mol−1). The basic scheme of the thermally induced dehydration of MSG-AH is described by the classical Bawn model for the reaction accompanied by the liquefaction and, as an extended approach, the fitting using a conjunct ePT–ePT model is applicable for describing the overall kinetics.
Conflicts of interest
There are no conflicts of interest to declare.Acknowledgements
The present work was supported by JSPS KAKENHI Grant Numbers 17H00820, 19K03144, and 19K02708.References
- A. K. Galwey and M. E. Brown, Thermal Decomposition of Ionic Solids, Elsevier, Amsterdam, 1999 Search PubMed.
- A. K. Galwey, Thermochim. Acta, 2000, 355, 181–238 CrossRef CAS.
- N. Koga and H. Tanaka, Thermochim. Acta, 2002, 388, 41–61 CrossRef CAS.
- N. Koga, in Handbook of Thermal Analysis and Calorimetry, ed. S. Vyazovkin, N. Koga and C. Schick, Elsevier, Amsterdam, 2nd edn, 2018, ch. 6, vol. 6, pp. 213–251 Search PubMed.
- S. Vyazovkin, K. Chrissafis, M. L. Di Lorenzo, N. Koga, M. Pijolat, B. Roduit, N. Sbirrazzuoli and J. J. Suñol, Thermochim. Acta, 2014, 590, 1–23 CrossRef CAS.
- N. Koga and J. Šesták, J. Am. Ceram. Soc., 2000, 83, 1753–1760 CrossRef CAS.
- N. Koga, J. M. Criado and H. Tanaka, J. Therm. Anal. Calorim., 2002, 67, 153–161 CrossRef CAS.
- N. Koga, T. Utsuoka and H. Tanaka, J. Therm. Anal. Calorim., 2005, 80, 71–75 CrossRef CAS.
- N. Koga and T. Utsuoka, Thermochim. Acta, 2006, 443, 197–205 CrossRef CAS.
- T. Kimura and N. Koga, J. Phys. Chem. A, 2011, 115, 10491–10501 CrossRef CAS PubMed.
- N. Koga, Y. Suzuki and T. Tatsuoka, J. Phys. Chem. B, 2012, 116, 14477–14486 CrossRef CAS PubMed.
- N. Kameno and N. Koga, J. Phys. Chem. C, 2018, 122, 8480–8490 CrossRef CAS.
- T. Okazaki and N. Koga, Ind. Eng. Chem. Res., 2020, 59, 17828–17836 CrossRef CAS.
- N. V. Muravyev, K. A. Monogarov, I. L. Dalinger, N. Koga and A. N. Pivkina, Phys. Chem. Chem. Phys., 2021, 23, 11797–11806 RSC.
- N. Koga, N. Kameno, Y. Tsuboi, T. Fujiwara, M. Nakano, K. Nishikawa and A. Iwasaki Murata, Phys. Chem. Chem. Phys., 2018, 20, 12557–12573 RSC.
- N. J. Carr and A. K. Galwey, Proc. R. Soc. London, Ser. A, 1986, 404, 101–126 CAS.
- A. K. Galwey, L. Pöppl and S. Rajam, J. Chem. Soc., Faraday Trans. 1, 1983, 79, 2143–2151 RSC.
- S. D. Bhattamisra, G. M. Laverty, N. A. Baranov, V. B. Okhotnikov and A. K. Galwey, Philos. Trans. R. Soc., A, 1997, 341, 479–498 Search PubMed.
- A. Toda, R. Yamamura, K. Taguchi, T. Fukushima and H. Kaji, Cryst. Growth Des., 2018, 18, 2602–2608 CrossRef CAS.
- V. L. Stanford and S. Vyazovkin, Ind. Eng. Chem. Res., 2017, 56, 7964–7970 CrossRef CAS.
- N. V. Muravyev, N. Koga, D. B. Meerov and A. N. Pivkina, Phys. Chem. Chem. Phys., 2017, 19, 3254–3264 RSC.
- N. Koga, S. Maruta, T. Kimura and S. Yamada, J. Phys. Chem. A, 2011, 115, 14417–14429 CrossRef CAS PubMed.
- T. Wada and N. Koga, J. Phys. Chem. A, 2013, 117, 1880–1889 CrossRef CAS PubMed.
- Y. Noda and N. Koga, J. Phys. Chem. C, 2014, 118, 5424–5436 CrossRef CAS.
- N. Koga and S. Kodani, Phys. Chem. Chem. Phys., 2018, 20, 26173–26189 RSC.
- N. Koga, K. Yamaguchi and J. Šesták, J. Therm. Anal. Calorim., 1999, 56, 755–761 CrossRef CAS.
- T. Vlase, G. Vlase and N. Doca, J. Therm. Anal. Calorim., 2005, 80, 425–428 CrossRef CAS.
- R. S. Nunes and É. T. G. Cavalheiro, J. Therm. Anal. Calorim., 2007, 87, 627–630 CrossRef CAS.
- I. M. Weiss, C. Muth, R. Drumm and H. O. K. Kirchner, BMC Biophys., 2018, 11, 2 CrossRef PubMed.
- P. E. Sánchez-Jiménez, A. Perejón, J. M. Criado, M. J. Diánez and L. A. Pérez-Maqueda, Polymer, 2010, 51, 3998–4007 CrossRef.
- N. Koga, Y. Goshi, S. Yamada and L. A. Pérez-Maqueda, J. Therm. Anal. Calorim., 2013, 111, 1463–1474 CrossRef CAS.
- S. Vyazovkin, A. K. Burnham, L. Favergeon, N. Koga, E. Moukhina, L. A. Perez-Maqueda and N. Sbirrazzuoli, Thermochim. Acta, 2020, 689, 178597 CrossRef CAS.
- C. Sano, N. Nagashima, T. Kawakita and Y. Iitaka, Anal. Sci., 1989, 5, 121–122 CrossRef CAS.
- N. Koga, Thermochim. Acta, 1995, 258, 145–159 CrossRef CAS.
- F. J. Gotor, J. M. Criado, J. Málek and N. Koga, J. Phys. Chem. A, 2000, 104, 10777–10782 CrossRef CAS.
- N. Koga, J. Šesták and P. Simon, in Thermal analysis of Micro, Nano- and Non-Crystalline Materials, ed. J. Šesták and P. Simon, Springer, Dordrecht, 2013, ch. 1, pp. 1–28 Search PubMed.
- H. L. Friedman, J. Polym. Sci., Part C: Polym. Symp., 1964, 6, 183–195 CrossRef.
- J. Šesták and G. Berggren, Thermochim. Acta, 1971, 3, 1–12 CrossRef.
- J. Šesták, J. Therm. Anal., 1990, 36, 1997–2007 CrossRef.
- J. Šesták, J. Therm. Anal. Calorim., 2011, 110, 5–16 CrossRef.
- A. Perejón, P. E. Sánchez-Jiménez, J. M. Criado and L. A. Pérez-Maqueda, J. Phys. Chem. B, 2011, 115, 1780–1791 CrossRef PubMed.
- R. Svoboda and J. Málek, J. Therm. Anal. Calorim., 2013, 111, 1045–1056 CrossRef CAS.
- T. Ozawa, Bull. Chem. Soc. Jpn., 1965, 38, 1881–1886 CrossRef CAS.
- T. Ozawa, J. Therm. Anal., 1986, 31, 547–551 CrossRef CAS.
- T. Ozawa, Thermochim. Acta, 1986, 100, 109–118 CrossRef CAS.
- J. M. Criado, L. A. Perez-Maqueda, F. J. Gotor, J. Malek and N. Koga, J. Therm. Anal. Calorim., 2003, 72, 901–906 CrossRef CAS.
- N. Koga and H. Tanaka, J. Therm. Anal., 1991, 37, 347–363 CrossRef CAS.
- N. Koga and J. Šesták, Thermochim. Acta, 1991, 182, 201–208 CrossRef CAS.
- N. Koga and J. Šesták, J. Therm. Anal., 1991, 37, 1103–1108 CrossRef.
- N. Koga, Thermochim. Acta, 1994, 244, 1–20 CrossRef CAS.
- A. K. Galwey and M. Mortimer, Int. J. Chem. Kinet., 2006, 38, 464–473 CrossRef CAS.
- P. J. Barrie, Phys. Chem. Chem. Phys., 2012, 14, 318–326 RSC.
- P. J. Barrie, Phys. Chem. Chem. Phys., 2012, 14, 327–336 RSC.
- D. Xu, M. Chai, Z. Dong, M. M. Rahman, X. Yu and J. Cai, Bioresour. Technol., 2018, 265, 139–145 CrossRef CAS PubMed.
- C. E. H. Bawn, in Chemistry of the Solid State, ed. W. E. Garner, Butterworths, London, 1955, ch. 10, pp. 254–267 Search PubMed.
- J. T. Carstensen, J. Pharm. Sci., 1974, 63, 1–14 CrossRef CAS PubMed.
- M. E. Brown and B. D. Glass, Int. J. Pharm., 2003, 254, 255–261 CrossRef CAS PubMed.
- R. Rotival, Y. Corvis, Y. Cartigny, P. Négrier, M. Marchivie, S. Massip, I. Gana, P. Lemoine and P. Espeau, CrystEngComm, 2013, 15, 7970–7980 RSC.
- E. G. Prout and F. C. Tompkins, Trans. Faraday Soc., 1944, 40, 488–498 RSC.
- A. K. Burnham, X. Zhou and L. J. Broadbelt, Energy Fuels, 2015, 29, 2906–2918 CrossRef CAS.
- N. V. Muravyev, THINKS – Free Open Source Thermokinetic Software, 2016, http://Thinks.Chemphys.Ru/.
Footnote |
| † Electronic supplementary information (ESI) available: S1. Sample characterization (Fig. S1–S3); S2. Thermal behavior (Fig. S4–S7); S3. Kinetics of the thermal dehydration of crystalline water (Fig. S8–S14 and Table S1); and S4. Kinetics of the thermally induced intramolecular dehydration (Fig. S15–S20 and Table S2). See DOI: 10.1039/d1cp04734e |
| This journal is © the Owner Societies 2022 |

