 Open Access Article
Molecule-like and lattice vibrations in metal clusters†‡
Krishnadas Kumaranchira
Ramankutty
*a,
Huayan
Yang
a,
Ani
Baghdasaryan
 a,
Jeremie
Teyssier
b,
Valentin Paul
Nicu
*cd and
Thomas
Buergi
 *a
*a
aDépartement de Chimie Physique, Université de Genève, 30 Quai Ernest-Ansermet, 1211 Geneva 4, Switzerland. E-mail: krdasnandipulam@gmail.com; thomas.buergi@unige.ch
bDepartment of Quantum Matter Physics, University of Geneva, 24 Quai Ernest-Ansermet, 1211 Geneva 4, Switzerland
cDepartment of Environmental Science, Physics, Physical Education, and Sport, Lucian Blaga University of Sibiu, loan Ratiu Street, Nr. 7-9, 550012 Sibiu, Romania. E-mail: vp.nicu@gmail.com
dPro Vitam Ltd, Muncitorilor Street, Nr. 16, Sfantu Gheorghe, Romania
First published on 10th May 2022
Abstract
We report distinct molecule-like and lattice (breathing) vibrational signatures of atomically precise, ligand-protected metal clusters using low-temperature Raman spectroscopy. Our measurements provide fingerprint Raman spectra of a series of noble metal clusters, namely, Au25(SR)18, Ag25(SR)18, Ag24Au1(SR)18, Ag29(S2R)12 and Ag44(SR)30 (–SR = alkyl/arylthiolate, –S2R = dithiolate). Distinct, well-defined, low-frequency Raman bands of these clusters result from the vibrations of their metal cores whereas the higher-frequency bands reflect the structure of the metal–ligand interface. We observe a distinct breathing vibrational mode for each of these clusters. Detailed analyses of the bands are presented in the light of DFT calculations. These vibrational signatures change systematically when the metal atoms and/or the ligands are changed. Most importantly, our results show that the physical, lattice dynamics model alone cannot completely describe the vibrational properties of ligand-protected metal clusters. We show that low-frequency Raman spectroscopy is a powerful tool to understand the vibrational dynamics of atomically precise, molecule-like particles of other materials such as molecular nanocarbons, quantum dots, and perovskites.
Introduction
Atomically precise, ligand-protected metal clusters exhibit rich structural and compositional diversity.1–3 Structural information on these clusters is mainly derived from X-ray crystallography.4,5 Despite being a powerful tool to probe the structure of these clusters,6–10 vibrational spectroscopy (infrared and Raman) is under-utilized in comparison with other spectroscopic techniques to establish structure–property relationships. Vibrational spectroscopy of metal nanosystems, in general, has been applied mostly to unprotected metal particles in the plasmonic size regime.11–13 Theoretical investigations are available on the vibrational spectra of sub-atomic, non-plasmonic metal clusters in the gaseous phase.14,15 Typically, ligand protected metal clusters, especially in the larger size regime, consist of a distinct metal core bound to a precise number of well-defined metal–ligand oligomeric units, i.e., staples (Au2(SR)3 in Au25(SR)18) and mounts (Ag2(SR)5 in Ag44(SR)30; –SR = alkyl/arylthiolate).4,5,16–20 Among the very few examples of vibrational spectroscopic studies on ligand-protected metal clusters include the Raman spectroscopy of Au38(SR)24 and Au25(SR)18.9 These studies revealed distinct vibrational bands associated with the metal–ligand interface.Recently, Kato et al. and Martinet et al. reported the vibrational features of Au8 clusters and Au25(SR)18 protected with chloride and phosphine ligands, respectively.21,22 They observed vibrational signatures due to the metal core also. However, despite the growing numbers of ligand-protected metal clusters with a vast variety of structures and compositions, vibrational spectroscopy of these clusters remains under-explored.
Vibrational signatures of atomically precise metal clusters are to be understood in greater detail which is essential to establish the utility of vibrational spectroscopy as a fingerprint technique for these clusters. This information is necessary to understand the evolution of lattice dynamics from atomically precise, molecule-like clusters to phonon modes in plasmonic particles and bulk metals. Here we report experimental Raman spectra of a series of ligand-protected, atomically precise metal clusters, namely, Au25(SR)18, Ag25(SR)18, Ag29(S2R)12 and Ag44(SR)30, and their alloys. Distinct vibrational bands due to the metal core as well as the metal–ligand interface of these clusters were observed. Our results highlight the role of the ligands on the vibrational features of these clusters which is essential to test the validity of physical models in interpreting the lattice dynamics of these clusters. Our results also establish the importance of Raman spectroscopy as a tool, just as electronic absorption spectroscopy, for distinguishing ligand-protected metal clusters. Atomic precision has become a major theme in materials science, and we show that low frequency Raman spectroscopy is a powerful tool to understand atomically precise particles of other materials such as molecular nanocarbons, quantum dots,23 and perovskites.24,25
Results and discussion
The right panels in Fig. 1 show the structures of the metal cores and the metal–ligand interfaces of the clusters used in this work. Fig. 1A–D present the Raman spectra of [Ag29(BDT)12][Na]3, [Ag44(2,4-FTP)30][PPh4]4, [Ag25(DMBT)18][PPh4] and [Au25(PET)18], respectively. PET, DMBT, BDT and 2,4-FTP are 2-phenylethanethiolate, 2,4-dimethylbenzenethiolate, 1,3-benzenedithiolate, and 2,4-difluorothiophenolate, respectively. Mass spectra of [Ag25(DMBT)18][PPh4], [Ag24Au1(DMBT)18][PPh4] and [Au25(PET)18] are presented in Fig. S1–S3 (ESI‡). Au25(PET)18 and Ag25(DMBT)18 consist of similar structural components, i.e., an M13 icosahedral core and M2(SR)3 (M = Ag/Au) staple units.4,5,26 Ag29(BDT)12 also consists of an Ag13 icosahedral core, however, the ligand BDT is a dithiolate and the metal–ligand interface in this cluster consists of six Ag3(SR)6 crown units.27 Ag44(2,4-FTP)30 consists of an innermost Ag12 icosahedron, a middle Ag20 dodecahedral shell and the outermost Ag2(SR)5 mount motifs. The metal cores of all of these, except Ag44(2,4-FTP)30, have a central metal atom.17,18Fig. 1A–D show that Raman spectra of these clusters are unique although they consist of similar structural units such as icosahedra and staples. Distinct Raman bands were observed in the low-frequency region (<150 cm−1) and in the higher frequency (150–500 cm−1) region of the spectra for all these clusters. The bands in the higher frequency spectral region are attributed to the vibrations of the metal–ligand oligomeric units in these clusters.9 Furthermore, a set of distinct and strong bands were observed below 150 cm−1 which are associated with the vibrations involving the metal atoms of the cores.10 A detailed discussion of the Raman bands of each of these clusters is presented in the following sections.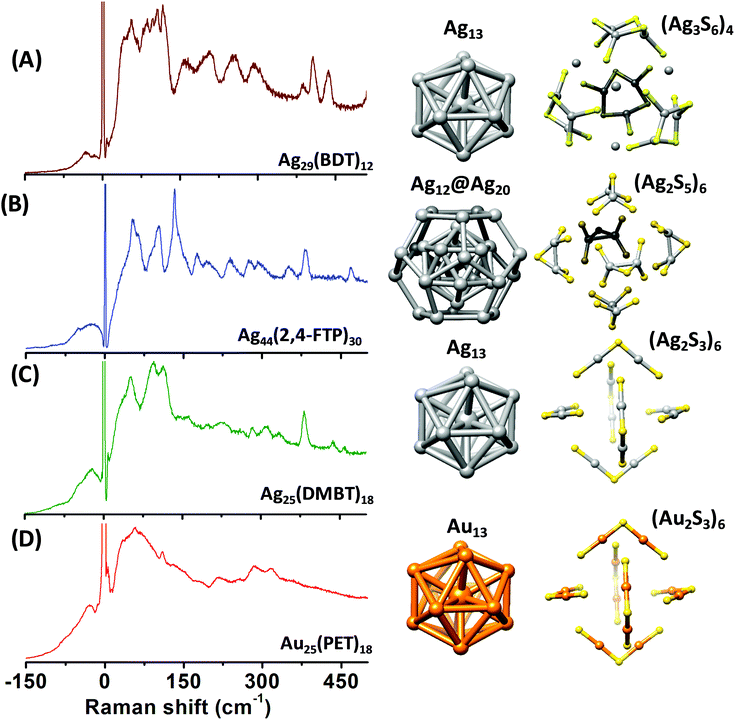 | ||
| Fig. 1 Raman spectra of [Ag29(BDT)12][Na]3 (A), [Ag44(2,4-FTP)30][PPh4]4 (B), [Ag25(DMBT)18][PPh4] (C) and [Au25(PET)18] (D). (DMBT, BDT, 2,4-FTP and PET are 2,4-dimethylbenzenethiolate, 1,3-benzenedithiolate, 2,4-difluorothiophenolate and 2-phnylethanethiolate, respectively.) Schematic diagrams of the structures of the metal cores and metal–ligand binding motifs are shown on the right panels. The structures shown in (A–D) are constructed using the crystal structure coordinates reported in ref. 27, 18, 26 and 5, respectively. Color codes of atoms: yellow (S), gray (Ag), and orange (Au). Carbon and hydrogen atoms are not shown for clarity. | ||
Ag25(DMBT)18 and Ag25−xAux(DMBT)18
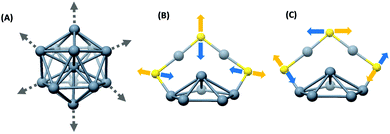
Raman and UV/Vis absorption spectra of Ag25(DMBT)18 and its Au-containing alloys, Ag25−xAux(DMBT)18 (x > 1), are presented in Fig. 2A and B, respectively. Mass spectra of Ag24Au1(DMBT)18 and the other two alloys are presented in Fig. S2, S4 and S5 (ESI‡). The two Ag25−xAux(DMBT)18 clusters with 7 and 14 Au atoms on average are referred to as alloy I and alloy II, respectively, in the following discussion for convenience. A comparison of the Raman bands of Ag25(DMBT)18 and Ag24Au1(DMBT)18 is presented in Fig. S6 (ESI‡) which shows that even a single Au atom doping alters the relative intensity of the low frequency Raman band at around 48 cm−1. There is also a significant shift of the weak band at around 150 cm−1. However, as the number of Au atoms is increased, we notice distinct changes in the band shapes and their relative intensities as shown in Fig. 2A. For example, the band at 95 cm−1 decreased in intensity in comparison with the band at 114 cm−1. Furthermore, the relative intensity of the band at 50 cm−1 decreased w.r.t. the bands at 95 cm−1 and 114 cm−1. As a result, a band at an even lower frequency becomes evident for alloy-II. Furthermore, the band at 50 cm−1 was blue shifted to around 55 cm−1 and 59 cm−1 for alloys I and II, respectively. More interestingly, the bands at 95 cm−1 and 114 cm−1 for Ag25(DMBT)18 were red shifted to 91 cm−1 and 110 cm−1 for alloy I. The band at 114 cm−1 for Ag25(DMBT)18 is attributed to the breathing vibrational motion involving the Ag13 icosahedral core. Previous experiments and theoretical calculations suggest that the breathing vibrational mode of clusters such as Au38(SR)24 and Au25(SR)18 appears in the low frequency spectral region.10,14,21,22,28–31 A further discussion on the breathing modes is presented later. Noticeable changes were observed in the high frequency region of the spectra (>200 cm−1) as shown in Fig. 2A. These bands correspond to various M–S (M = Au/Ag) stretching modes of the M2(SR)3 staples.9 The bands at 311 cm−1 and 335 cm−1 for Ag25(DMBT)18 undergo a blue shift for alloy I (green trace). For alloy II (blue trace), only a single band was observed at 323 cm−1 instead of the two bands in Ag25(DMBT)18 and alloy I. The band at 382 cm−1 for Ag25(DMBT)18 was blue shifted to 385 cm−1 and 387 cm−1 for alloys I and II, respectively. Furthermore, the weak band at 283 cm−1 decreased in intensity for alloys I and II. The weak band at 226 cm−1 also followed a similar trend. A schematic of the breathing modes of the cores and Au–S stretching modes of the metal–ligand interface in M25(SR)18 (M = Ag/Au) is shown in Fig. 3. Note that the UV/Vis spectra of the alloy clusters I and II (Fig. 2B) with significantly different numbers of Au atoms (7 and 14, respectively) are hardly distinguishable whereas their low frequency Raman bands are distinctly different.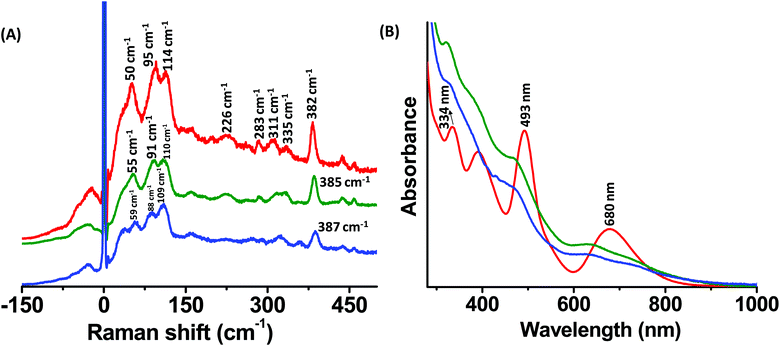 | ||
| Fig. 2 Raman spectra (A) and UV/Vis absorption spectra (B) of Ag25(DMBT)18 (red trace) and Ag25−xAux(DMBT)18 alloy clusters I (green trace) and II (blue trace). | ||
Au25(PET)18 and Au25−xAgx(PET)18
Fig. 4A and B show the Raman and the UV/Vis spectra of Au25(PET)18 and Au25−xAgx(PET)18 alloy clusters, respectively. Mass spectra of these clusters are shown in Fig. S3 and S7 (ESI‡), respectively. Distinct low frequency bands were observed for these two clusters; however, the bands of Au25(PET)18 were less resolved compared to those of its alloy clusters. The bands at 57 cm−1 and 109 cm−1 for Au25(PET)18 were blue shifted to 70 cm−1 and 116 cm−1, respectively, for Au25−xAgx(PET)18 alloy clusters. The band at 109 cm−1 can be assigned as the breathing vibrational mode involving the Au13 icosahedral core (see later for a discussion). The high frequency vibrational bands for these two clusters did not change significantly (except for a blue shift of the band at 317 cm−1) in comparison with Ag25(DMBT)18 and its alloy clusters. The bands at 286 cm−1 and 317 cm−1 are assigned to the Au–S stretching vibrational modes of their M2(SR)3 staples.9 A comparison of the Raman spectra of Ag25(DMBT)18 and Au25(PET)18 (Fig. S8, ESI‡) shows that their high-frequency bands are similar in shape except that the former exhibits a strong band at 382 cm−1. This similarity is due to the fact that both of these clusters are structurally analogous and contain similar, M2(SR)3 (M = Ag/Au) staple motifs.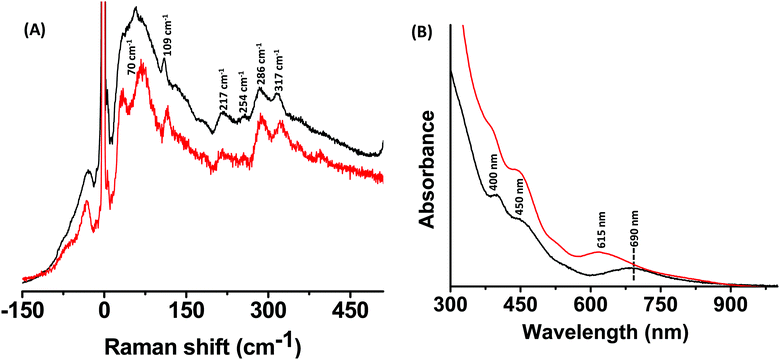 | ||
| Fig. 4 Raman spectra (A) and UV/Vis absorption spectra (B) of Au25(PET)18 (black trace) and Au25−xAgx(PET)18 alloy clusters (red trace). | ||
Ag44(2,4-FTP)30 and Ag44−xAux(2,4-FTP)30
Ag44(2,4-FTP)30 presents an interesting candidate for vibrational spectroscopy because it consists of multiple shells.17,18 Raman spectra of Ag44(2,4-FTP)30 and its alloy Ag44−xAux(2,4-FTP)30 are presented in Fig. 5A. A comparison of the UV/Vis absorption spectra of these clusters presented in Fig. 5B shows that the distinct bands of Ag44(2,4-FTP)30 disappeared and two new bands appeared for Ag44−xAux(2,4-FTP)30 which is in agreement with the previous reports.17,32 The UV/Vis absorption spectra of Ag44−xAux(2,4-FTP)30 clusters (Fig. 5B) indicate that the number of Au atoms in them is 0–12 and that these Au atoms are located in the innermost, hollow icosahedral shell.33 It is also known that when the number of Ag atoms in Ag44−xAux(SR)30 clusters is significantly less than twelve, the UV/Vis absorption spectra of such clusters are similar to those of Ag44(SR)30 and that it is not possible to incorporate more than twelve Au atoms in Ag44(SR)30 by direct synthesis (i.e., co-reduction of a mixture of metal salts).33 The Ag44−xAux(SR)30 clusters used in our experiments were synthesized by the co-reduction method and their UV/Vis spectra resemble those of the previously reported Ag44−xAux(SR)30 clusters which consist of twelve17 or nearly twelve Au atoms.33 Therefore, it is very likely that the number of Au atoms in the Ag44−xAux(SR)30 clusters used in our experiments is also twelve, approximately.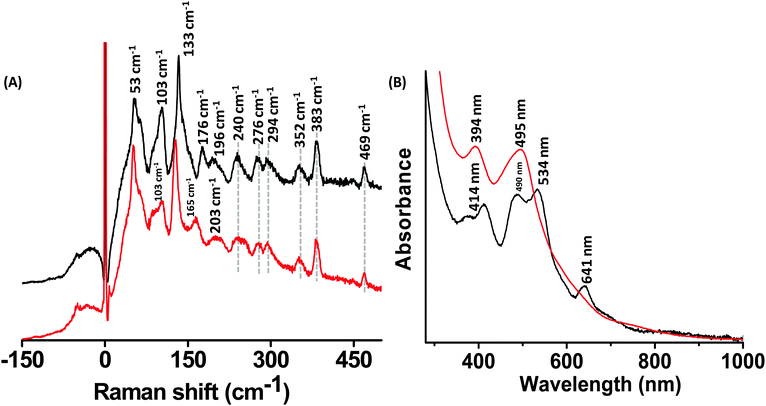 | ||
| Fig. 5 Raman spectra (A) and UV/Vis spectra (B) of Ag44(2,4-FTP)30 (black trace) and Ag44−xAux(2,4-FTP)30 (red trace). | ||
Fig. 5A shows a comparison of the Raman spectra of Ag44(2,4-FTP)30 and Ag44−xAux(2,4-FTP)30. The intense bands at 53 cm−1 and 103 cm−1 decrease in intensity with Au substitution. The band at 133 cm−1 for Ag44(2,4-FTP)30 is red shifted to 126 cm−1 for Ag44−xAux(2,4-FTP)30. This red shift is due to the substitution of the Ag atoms in the innermost shell of Ag44(2,4-FTP)30 by Au atoms. This shift indicates that the band at 133 cm−1 can be assigned as the breathing vibrational mode of Ag44(2,4-FTP)30 clusters (see later for a discussion). The weak band at 176 cm−1 is also red shifted to around 165 cm−1. In contrast to Ag25(SR)18, Au25(SR)18 and their alloys discussed earlier, the high frequency bands of Ag44(2,4-FTP)30 which correspond to the vibrations of their Ag2(SR)5 mounts are weak. The structure of the metal–ligand interface is complex in this case and theoretical calculations are required for a complete assignment. Given their large size, DFT calculations on these clusters are impractical. However, for the smaller clusters (Ag25, Au25 and Ag24Au1), DFT calculations could be performed and the results will be discussed later. The relative intensity and the peak positions of the bands above 200 cm−1 do hardly change by incorporating gold, indicating that gold is in the inner part of the cluster. Also, in contrary to the examples of Ag25(DMBT)18, Au25(PET)18 and their alloys, a comparison of Fig. 5A and B shows that UV/Vis absorption bands are more sensitive to the number of substituent metal atoms in Ag44(2,4-FTP)30.
Dependence of the Raman spectra on the metal atoms and ligand types
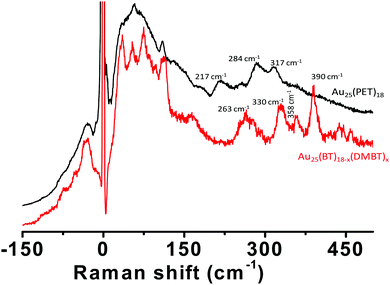
In order to test the effect of the nature of the ligands on the Raman features, we synthesized Au25(BT)18−x(DMBT)x clusters (BT = n-butanethiolate) by ligand exchange of Au25(BT)18 with DMBT ligands (see Fig. S9, ESI‡). A comparison of the Raman spectrum of these clusters with that of Au25(PET)18 is presented in Fig. 6 which shows that the change of the ligand from PET to BT/DMBT drastically altered the number of low frequency bands and their peak positions. The higher frequency bands were similar (except for the presence of the band at 390 cm−1 for Au25(BT)18−x(DMBT)x) in the band shapes but they are blue shifted significantly compared to Au25(PET)18.We further notice that there are distinct changes in the low-frequency and the higher-frequency Raman bands on changing the composition from Ag25(DMBT)18 to Ag25−xAux(DMBT)18 to Au25(BT)18−x(DMBT)x clusters (Fig. S10, ESI‡). As more and more Au atoms are incorporated into Ag25(DMBT)18, four well-defined bands were observed for the latter two clusters while only three distinct bands were observed for Ag25(DMBT)18. The bands at 311 cm−1, 335 cm−1 and 382 cm−1 of Ag25(DMBT)18 were blue shifted w.r.t. those of Au-rich clusters. Therefore, this comparison suggests that the low-frequency vibrations are affected by the nature of the metal atoms as well as the nature of the ligands.
DFT calculations
Computing Raman intensities for large structures like the Au25(PET)18 and Ag25(DMBT)18 nanoclusters using DFT is very time consuming. To make the calculations manageable, the DMBT ligands were substituted with methyl groups. In this section we discuss in detail the nature of the low-frequency vibrational modes of Au25(SCH3)18, Ag25(SCH3)18 and Ag24Au1(SCH3)18 in the light of the performed DFT calculations.A comparison of the experimental and simulated Raman spectra of the Au25, Ag25 and Ag24Au1 nanoclusters is shown in Fig. 7. When comparing the three experimental spectra, one can make four observations. First, the Au25 spectrum is very broad and one can, in principle, identify three bands, which were labelled as A1, A2 and A3. Second, the Ag25 and Ag24Au1 spectra, which are better resolved, are very similar to each other. One can identify three main bands (B1, B2 and B3) and a broad shoulder (B0). Third, the spectra of Ag25 and Ag24Au1 are significantly different from those of Au25. Fourth, assuming there is a one-to-one correlation between the A1, A2 and A3 bands of Au25 and the B1, B2 and B3 bands in Ag25 and Ag24Au1 spectra, there is a clear blue shift in the position of the bands when going from Au25 to Ag25 to Ag24Au1. This blue shift is expected because of the substitution of the Ag atoms by heavier Au atoms.
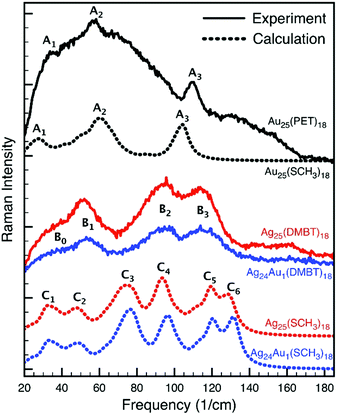 | ||
| Fig. 7 Experimental (solid lines) and simulated (dotted lines) Raman spectra of the Au25, Ag25 and Ag24Au1 nanoclusters. | ||
Next, we compare the experimental and simulated spectra. In the case of Au25, the agreement between experiment and theory is quite good. Not only does the simulated spectrum exhibit the A1, A2 and A3 bands, but it also has the two shoulders around the A2 band. The calculation also predicted correctly the relative intensities of the A1, A2 and A3 bands. Moving to the simulated spectra of Ag25 and Ag24Au1, it is clear that while they do not reproduce the experimental spectra as good as in the case of Au25, they corroborate the experimental observations. That is, they are very similar, they do not resemble the Au25 spectrum, and they exhibit the correct blue shift.
Additionally, the six bands in the Ag25 and Ag24Au1 simulated spectra can be grouped into three pairs (i.e., [C1, C2], [C3, C4] and [C5, C6]), which seem to correspond to the three experimental bands.
Assignment of the low frequency bands
The large size of the three nanoclusters and the complexity of the associated structures and normal modes, make the assigning of the observed bands difficult. Therefore, besides visualising the normal mode motion, we have performed a thorough analysis of the normal modes. First, to assess the similarities/differences between the normal modes computed for the Au25, Ag25 and Ag24Au1 clusters, we have calculated normal mode overlaps (i.e., scalar products between the normalised nuclear displacement vectors). Second, to assign the character of each normal mode, we computed the localisation of the mode motion on the Au13, Ag13 and Ag12Au1 inner-cores (fragment F1), the (Au2S3)6 or (Ag2S3)6 ligand binding motifs (fragment F2) and the remaining C and H atoms (fragment F3). The technical details of this normal mode analysis and the obtained results are given in the electronic ESI‡ (see Normal Mode Section, Tables S1–S3 and Fig. S11 therein). Here we only summarize the obtained results.The analysis of the Ag25 and Ag24Au1 modes (see Tables S2, S3 and Fig. S11, ESI‡) shows that these two structures have very similar normal modes. Most of the modes with intense Raman signals exhibit normal mode overlaps of 0.9 or larger (i.e., a similarity of at least 81% = 0.9 × 0.9). The situation is completely different when comparing the Au25 and Ag25 modes (see Table S1, ESI‡). The highest normal mode overlap value is 0.77 (i.e., 59% similarity). Moreover, only two pairs of Au25/Ag25 modes have exhibited 59% similarity; the rest have significantly smaller values. Among the modes with intense Raman signals, a one-to-one mapping between the Au25 and Ag25 modes could be done only for the breathing modes 84 and 106 (see Fig. 10), which exhibit a 48% similarity (i.e., an overlap of 0.69). We can thus conclude that this analysis explains: (1) the similarity between the Ag25 and Ag24Au1 spectra, and (2) why the Au25 spectrum does not resemble the other two spectra.
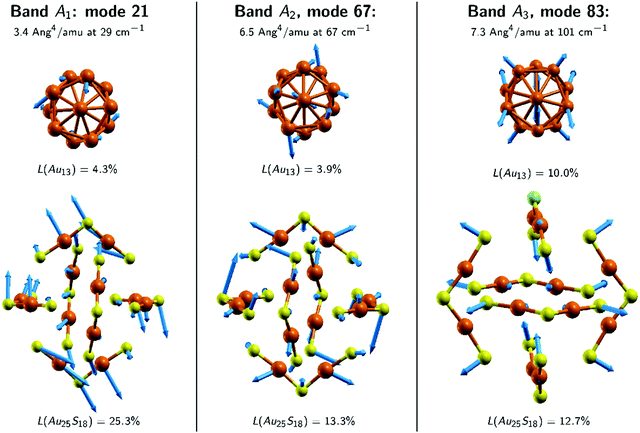
Next, we discuss the assignment of the bands based on the predictions made by the DFT calculations. We start with the spectra of Au25. There are seven normal modes that contribute to band A1 and they all involve movements of the Au2S3 ligand binding motifs as a whole (viz. we have large F2 values in Table S1, ESI‡). The A2 band comprises nine modes, which are localised on both the Au13 core and the Au2S3 ligand binding motifs (see Table S1, ESI‡). The A3 band is determined by modes 83 and 84, the so-called breathing modes.
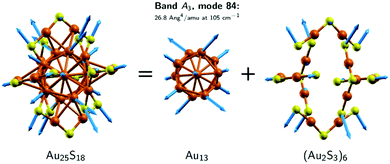
Fig. 8 and 9 show the nuclear displacement vectors of the modes that provide the most important contributions to the bands A1, A2 and A3. To simplify their visualisation in Fig. 8, the nuclear displacement vectors of the Au13 core and of the (Au2S3)6 ligand binding motifs are depicted separately. This decomposition scheme is used also in Fig. 9, which shows the nuclear displacement vectors associated with the modes 21, 67 and 83.
We continue with the assignment of the bands in the Ag25(DMBT)18 and Ag24Au1(DMBT)18 spectra. Since a one-to-one mapping between the Au25 and Ag25 modes could not be made based on the normal mode overlap values, we will look at the localisation of the normal mode motion on the inner-cores versus the ligand binding motifs, i.e., by comparing the F1 vs. F2 columns in Tables S1–S3 (ESI‡). The goal is to find some correlations between the three Au25 bands and the bands in the Ag25 and Ag24Au1 spectra. Fig. S11 (ESI‡) shows the nuclear displacement vectors of the modes that provide the most important contributions to the bands C1–C5.
Firstly, we note that the modes associated with the bands A1, C1 and C2 are all characterised by F1 and F2 values of approximately 5% and 20%, respectively. We can therefore conclude that the experimental A1, B0 and B1 bands (which correspond to the A1, C1 and C2 simulated bands, respectively) belong to the same category and carry information mostly about the ligand binding motifs. Second, we note that many of the modes associated with the A2, C3 and C4 bands exhibit comparable F1 and F2 values that amount to 15–25%. Thus, we conclude that the experimental A2 and B2 bands (which correspond to the A2, C3 and C4 simulated bands, respectively) carry information about both the inner core of the clusters and the ligand binding motifs. Previous reports also suggest that some of the low-frequency Raman bands (other than the breathing modes) in these clusters could be due to the bending vibrations of their staple motifs and stretching of the metal–metal bonds in the cores.10 Lastly, we discuss the modes in the C5 band (see Table S3, ESI‡), which does not seem to have a correspondent in the Au25 spectra. It is important to note that: (1) this band is determined mostly by the modes 96 and 97 which have very high Raman intensities, and (2) more than 90% of the normal mode motion in these two modes is localised on the C and H atoms. Consequently, the band C5 does not seem to be relevant for the interpretation of the experimental spectra. That is, if the calculation would have been performed for the structures having DMBT (instead of methyl) for ligands, its position and magnitude would be very different. Band C6 will be discussed in the next section.
Breathing vibrational modes
Among the distinct, low-frequency (<150 cm−1) Raman bands observed in all clusters measured in our experiments, one band can be assigned to the metal core breathing mode. In this vibrational mode, all atoms (i.e., the core atoms, the atoms in the staples as well as those in the ligand's tail group) move outward and inward in phase. Therefore, the breathing vibrational modes of the cores of these clusters resemble the longitudinal acoustic (LA) phonon modes in bulk metals and plasmonic nanocrystals. LA modes for bulk Au metal appear at around 115–150 cm−1. Such modes have been experimentally observed using Raman spectroscopy for plasmonic Au nanoparticles.34 The breathing mode is particularly sensitive to the presence of heterometal atoms. Therefore, monitoring the effect of the metal atom composition on the low-frequency bands is expected to be useful for identifying the breathing mode. However, in the case of ligand-protected, atomically precise metal clusters, assignment of the breathing mode cannot be done only based on metal atom substitution effects, as we discuss below.In the following, we will discuss the trends observed experimentally upon metal atom substitution from the perspective of the DFT calculations.
The analysis of the DFT modes has shown that there are only two modes that contribute to band A3. The most important is mode 84 which has by far the strongest Raman signal among the Au25 modes. This mode exhibits the characteristics of a breathing mode (see Fig. 8). The central Au atom does not move while the rest of the atoms of the Au13 core are moving in-phase, towards (and away from) the central atom. Therefore, we assign this band to the experimental band at 109 cm−1. The other mode contributing to A3 is mode 83 (see right panel of Fig. 9). It can be dubbed as the out-of-phase breathing mode, with eight of the Au13 atoms moving in phase towards (and away from) the central atom (which is not moving), while the remaining 4 atoms are moving against the rest of the atoms and towards each other. Mode 83 has a significantly smaller Raman intensity than mode 84, i.e., 7.3 vs. 26.8 Ang4 amu−1. Therefore, calculations reveal that the experimental A3 band of Au25 is determined by two breathing modes.
The performed normal mode analysis shows that mode 106 in Ag25 and Ag24Au1 exhibit the strongest similarity with the breathing modes in Au25 (i.e., mode 85). The nuclear displacement vectors associated with mode 85 of Au25 and mode 106 of Ag25 have been superimposed in Fig. 10. As can be seen, the two sets of nuclear displacement vectors exhibit clear differences, both in magnitudes and directions. Indeed, the overlap of the two modes (see Table S1, ESI‡) is 0.69, which means they are only 48% similar (0.48 = 0.692). However, Fig. 10 shows clearly that the two sets of nuclear displacement vectors induce the same type of “breathing” movement in the two nanoclusters. Furthermore, the comparison of the frequencies of the breathing mode in the three clusters, confirms the blue shift observed experimentally when Ag atoms are substituted by Au atoms. Indeed, the calculated frequency of the breathing modes is 105 cm−1 in Au25, 130 cm−1 in Ag25 and 132 cm−1 in Au24Au1. We therefore conclude that the experimental A3 and B3 bands (which are associated with the A3 and C6 simulated bands, respectively) are determined by the breathing mode. As such, these bands carry information mostly about the core of the nanoclusters.
Ag44(2,4-FTP)30: insights into the location of the substituent metal atoms
Fig. 5A shows that the substitution of Ag atoms by Au atoms does not alter much the shapes and peak positions of the bands at 53 cm−1 and 103 cm−1 for Ag44(2,4-FTP)30. However, the band at 133 cm−1 undergoes a clear red-shift when Ag atoms are substituted by Au atoms. Therefore, we assign the band at 133 cm−1 for Ag44(2,4-FTP)30 as the breathing mode of its metal core.It is interesting to note that all of the low frequency bands in Ag25(DMBT)18 and Au25(PET)18 are altered when metal atoms are substituted. This is due to the fact that metal atoms in their cores are bound to the ligands. Therefore, a change in metal composition alters the shapes and positions of the bending modes of the staples. However, in the case of Ag44(2,4-FTP)30 and Ag44−xAux(2,4-FTP)30, only the band at 133 cm−1 is shifted. It was mentioned earlier that the Ag atoms in Ag44−xAux(2,4-FTP)30 are located in the innermost icosahedral core. Note that the M12 (M = Ag/Au) icosahedron in these clusters is not bound with the ligands, and therefore, the bending vibrations of the metal–ligand interface are not sensitive to the composition of the innermost core. If the Ag atoms in Ag44−xAux(2,4-FTP)30 were located in the middle Ag20 shell or in the outermost mount positions, the bands at 53 cm−1 and 103 cm−1 would have been altered significantly. This is not the case, and therefore, Raman spectra of these clusters suggest that Ag atoms in Ag44−xAux(2,4-FTP)30 are more likely to be located in the icosahedral core. A change of the M12 composition alters the frequency of the breathing modes, as observed in the other two cases.
Comparison with metal thiolates
We have also measured the Raman spectra of metal thiolate complexes and compared them with those of the corresponding clusters (see Fig. S12–S15, ESI‡). Interestingly, the Raman spectrum of the Ag-DMBT thiolates shows some resemblance with that of Ag25(DMBT)18 (see Fig. S12, ESI‡). In order to understand the origin of the low frequency bands of Ag-DMBT thiolates, DFT calculations are performed. These calculations suggest that the intense bands at around 100 cm−1 and 380 cm−1 of Ag-DMBT thiolates are due to frustrated rotations of the DMBT rings around an axis perpendicular to the ring and due to DMBT ring deformation vibrations. However, it is obvious from the figure that the Raman spectra of Ag-DMT thiolates and Ag25(DMBT)18 are distinctly different. The comparison of Raman spectra of Au-PET thiolates and Ag-BDT thiolate with Au25(PET)18 and Ag29(BDT)12, respectively (see Fig. S14 and S15, ESI‡), shows that the Raman spectra of clusters are distinctly different from those of metal–thiolate complexes.In summary, our measurements reveal distinct molecule-like vibrations of metal–ligand interface and a phonon-like core breathing mode of atomically precise, ligand-protected noble metal clusters. We demonstrated that Raman spectroscopy in the low-frequency region, can be used as a fingerprint technique to identify atomically precise, ligand-protected metal clusters. The positions and the intensities of the low-frequency bands are dependent on the nature of the metal atoms as well as the ligands. A distinct breathing vibrational mode has been identified for these clusters by monitoring the effect of metal atom substitution and DFT calculations. DFT calculations further indicated that some of the low-frequency Raman bands are due to vibrations involving both the ligands and the core metal atoms.
Conclusions
Our experiments show that Raman spectroscopy provides fingerprints of ligand-protected, metal clusters, just as electronic absorption spectroscopy. Fingerprint Raman bands arise due to distinct vibrational modes of their metal cores. Low-frequency bands of these clusters are dependent on the nature of metal atoms as well as the ligands. We hope that low frequency Raman spectroscopy will become a promising characterization tool not only for metal clusters but also for atomically precise, molecule-like particles of other materials such as perovskites, quantum dots and molecular nanocarbons.Experimental
Materials used
Hydrogen tetrachloroaurate tetrahydrate, HAuCl4·4H2O, and sodium tetrahydroborate, NaBH4, were obtained from ACROS Organics. 2-Phenyelethanethiol (PET), 1-butanethiol (BT), 2,4-dimethylbenzenethiol (DMBT), 2,4-difluorothiophenol (2,4-FTP), 1,3-benzenedithiol (BDT), tetraphenyl phosphonium bromide (PPh4Br) and AgNO3 were purchased from Sigma Aldrich. Tetraoctylammonium bromide, TOABr (98%), was purchased from Fluorochem. Methanol (MeOH) (HPLC grade), toluene (analytical reagent grade) and DMF were purchased from Fisher Scientific. Ultrapure water (resistivity of 18.2 MΩ cm at 25 °C) was used in the synthetic procedure. All the solvents used, dichloromethane (DCM), methanol, toluene, etc., were of analytical grade and used without further purification. The Bio Beads S-X1 (Bio-Rad) for size exclusion chromatography was purchased from Bio-Rad, USA.Synthesis and purification of clusters
The Ag25(DMBT)18 and Ag24Au1(DMBT)18 clusters used in these measurements were synthesized adopting the procedures reported by Bakr et al.26,36 Synthesis of Ag25−xAux(DMBT)18 alloy clusters (with x > 1) was performed by its reaction with (Au-DMBT) thiolate.37 Ag29(BDT)12 clusters used in these measurements were synthesized using a previously reported procedure.38 Ag44(2,4-FTP)30 and Ag44−xAux(2,4-FTP)30 clusters used in these measurements were synthesized adopting the procedure reported by Zheng et al.33 The Au25(PET)18 clusters used in these measurements were synthesized using reported procedures.39 Anionic Au25(PET)24 clusters were oxidized to neutral clusters by running the clusters on a thin layer chromatographic (TLC) plate using DCM as the eluent.40 Synthesis of Au25−xAgx(PET)18 alloy clusters was carried out using a previously reported procedure by Wang et al.37 All clusters were purified by size exclusion chromatography using Bio Beads SX-1 column using toluene as the eluent. The purity of the synthesized clusters was analyzed with MALDI mass spectrometry/ESI mass spectrometry and electronic absorption spectroscopy.Instrumentation
Mass spectrometry and UV/Vis absorption spectroscopy
Ultraviolet-visible spectra were recorded using a Varian Cary 50 spectrophotometer, using a quartz cuvette of 10 mm path length. Mass spectra were obtained using a Bruker Autoflex matrix assisted laser desorption ionization mass spectrometer (MALDI MS) equipped with a nitrogen laser in linear, positive ion mode. [3-(4-tert-Butylphenyl)-2-methyl-2-propenylidene]malononitrile (DCTB) was used as the matrix. A volume of 2 μL of the analyte/matrix mixture was applied to the target and air-dried.Electrospray ionization mass spectra were measured using a QSTAR pulsar i (AB Sciex) using a quadrupole and time-of-flight analyzers. The spectra were measured in the mass range of m/z 500–12![[thin space (1/6-em)]](https://www.rsc.org/images/entities/char_2009.gif) 000 in the negative ion mode. Further details of the instrumental parameters used for the measurements are provided in the ESI.‡
000 in the negative ion mode. Further details of the instrumental parameters used for the measurements are provided in the ESI.‡
DFT calculations
In order to understand the nature of some low frequency Raman bands associated with the Ag-DMBT thiolates, DFT calculations were performed using Gaussian 16.41 For this a cyclic Ag4(DMBT)4 fragment was used. The b3pw91 functional and a 6-31G(d,p) basis set were used (LanL2DZ for Ag). Before calculating the Raman spectrum, the structure was completely relaxed.The optimisation of the structures and the calculation of the Raman intensities were performed using the Amsterdam Density Functional (ADF) program package (developer version r78297, 2019-10-07).42–47 The structural coordinates of the optimized geometries of the clusters are presented in the ESI.‡ To account for the relativistic effects the zeroth order regular approximation (ZORA) to the Dirac equation was applied as a scalar correction.48–50 The BP86 exchange-correlation functional51,52 and the ADF TZP ZORA basis set53 were used in all calculations. Furthermore, Raman intensities were computed only for the modes in the frequency interval between 20 and 135 cm−1. This was done using the ADF “RamanRange” option, which is a two-step procedure. First, analytical frequency calculations54 are performed for the entire structure. Then, Raman intensities are computed by numerical differentiation only for the modes in a specific frequency interval. The simulated Raman spectra were obtained by broadening the computed intensities with a Lorentzian band shape with a half-width at a half-maximum of 8 cm−1. The frequencies were not shifted. The nuclear displacement vectors have been visualized using the XCrysDen program.55
Author contributions
KRK performed Raman measurements, synthesized Ag25, Ag29 and some of the alloy clusters, synthesized and crystallized Ag44 and Ag44−xAux clusters and wrote the manuscript together with HY and TB. AB synthesized Au25 clusters and JT set up the cryostat. VPN performed the DFT calculations and the normal mode analyses. TB supervised the whole project and wrote the manuscript.Conflicts of interest
There are no conflicts to declare.Acknowledgements
Financial support from the University of Geneva and the Swiss National Science Foundation (Grant No. 200020_172511) is kindly acknowledged. We also acknowledge the support from the MZ 2.0 mass spectrometry core facility at the Faculty of Sciences, University of Geneva. This work was supported by the Hasso Plattner Excellence Research Grant (LBUS-HPI-ERG-2020-07), financed by the Knowledge Transfer Center of the Lucian Blaga University of Sibiu.Notes and references
- I. Chakraborty and T. Pradeep, Chem. Rev., 2017, 117, 8208–8271 CrossRef CAS PubMed.
- R. Jin, C. Zeng, M. Zhou and Y. Chen, Chem. Rev., 2016, 116, 10346–10413 CrossRef CAS PubMed.
- P. D. Jadzinsky, G. Calero, C. J. Ackerson, D. A. Bushnell and R. D. Kornberg, Science, 2007, 318, 430–433 CrossRef CAS PubMed.
- J. Akola, M. Walter, R. L. Whetten, H. Häkkinen and H. Grönbeck, J. Am. Chem. Soc., 2008, 130, 3756–3757 CrossRef CAS PubMed.
- M. W. Heaven, A. Dass, P. S. White, K. M. Holt and R. W. Murray, J. Am. Chem. Soc., 2008, 130, 3754–3755 CrossRef CAS PubMed.
- B. Nieto-Ortega and T. Bürgi, Acc. Chem. Res., 2018, 51, 2811–2819 CrossRef CAS PubMed.
- I. Dolamic, B. Varnholt and T. Bürgi, Phys. Chem. Chem. Phys., 2013, 15, 19561–19565 RSC.
- I. Dolamic, B. Varnholt and T. Bürgi, Nat. Commun., 2015, 6, 7117 CrossRef CAS PubMed.
- B. Varnholt, P. Oulevey, S. Luber, C. Kumara, A. Dass and T. Bürgi, J. Phys. Chem. C, 2014, 118, 9604–9611 CrossRef CAS.
- K. R. Krishnadas, A. Baghdasaryan, R. Kazan, E. Banach, J. Teyssier, V. P. Nicu and T. Buergi, Small, 2021, 2101855 CrossRef CAS PubMed.
- H. E. Sauceda and I. L. Garzón, J. Phys. Chem. C, 2015, 119, 10876–10880 CrossRef CAS.
- H. E. Sauceda, D. Mongin, P. Maioli, A. Crut, M. Pellarin, N. Del Fatti, F. Vallée and I. L. Garzón, J. Phys. Chem. C, 2012, 116, 25147–25156 CrossRef CAS.
- H. E. Sauceda, F. Salazar, L. A. Pérez and I. L. Garzón, J. Phys. Chem. C, 2013, 117, 25160–25168 CrossRef CAS.
- A. Tlahuice-Flores, R. L. Whetten and M. Jose-Yacaman, J. Phys. Chem. C, 2013, 117, 12191–12198 CrossRef CAS.
- R. D. Senanayake, E. B. Guidez, A. J. Neukirch, O. V. Prezhdo and C. M. Aikens, J. Phys. Chem. C, 2018, 122, 16380–16388 CrossRef CAS.
- M. Zhu, C. M. Aikens, F. J. Hollander, G. C. Schatz and R. Jin, J. Am. Chem. Soc., 2008, 130, 5883–5885 CrossRef CAS PubMed.
- H. Yang, Y. Wang, H. Huang, L. Gell, L. Lehtovaara, S. Malola, H. Häkkinen and N. Zheng, Nat. Commun., 2013, 4, 2422 CrossRef PubMed.
- A. Desireddy, B. E. Conn, J. Guo, B. Yoon, R. N. Barnett, B. M. Monahan, K. Kirschbaum, W. P. Griffith, R. L. Whetten, U. Landman and T. P. Bigioni, Nature, 2013, 501, 399 CrossRef CAS PubMed.
- H. Häkkinen, M. Walter and H. Grönbeck, J. Phys. Chem. B, 2006, 110, 9927–9931 CrossRef PubMed.
- M. Walter, J. Akola, O. Lopez-Acevedo, P. D. Jadzinsky, G. Calero, C. J. Ackerson, R. L. Whetten, H. Grönbeck and H. Häkkinen, Proc. Natl. Acad. Sci. U. S. A., 2008, 105, 9157–9162 CrossRef CAS PubMed.
- M. Kato, Y. Shichibu, K. Ogura, M. Iwasaki, M. Sugiuchi, K. Konishi and I. Yagi, J. Phys. Chem. Lett., 2020, 11, 7996–8001 CrossRef CAS PubMed.
- Q. Martinet, A. Berthelot, A. Girard, B. Donoeva, C. Comby-Zerbino, E. Romeo, F. Bertorelle, M. van der Linden, N. Tarrat, N. Combe and J. Margueritat, J. Phys. Chem. C, 2020, 124, 19324–19332 CrossRef CAS.
- A. N. Beecher, R. A. Dziatko, M. L. Steigerwald, J. S. Owen and A. C. Crowther, J. Am. Chem. Soc., 2016, 138, 16754–16763 CrossRef CAS PubMed.
- J. Almutlaq, J. Yin, O. F. Mohammed and O. M. Bakr, J. Phys. Chem. Lett., 2018, 9, 4131–4138 CrossRef CAS PubMed.
- J. Yin, P. Maity, M. De Bastiani, I. Dursun, O. M. Bakr, J.-L. Brédas and O. F. Mohammed, Sci. Adv., 2017, 3, e1701793 CrossRef PubMed.
- C. P. Joshi, M. S. Bootharaju, M. J. Alhilaly and O. M. Bakr, J. Am. Chem. Soc., 2015, 137, 11578–11581 CrossRef CAS PubMed.
- L. G. AbdulHalim, M. S. Bootharaju, Q. Tang, S. Del Gobbo, R. G. AbdulHalim, M. Eddaoudi, D.-E. Jiang and O. M. Bakra, J. Am. Chem. Soc., 2015, 137, 11970–11975 CrossRef CAS PubMed.
- O. Varnavski, G. Ramakrishna, J. Kim, D. Lee and T. Goodson, ACS Nano, 2010, 4, 3406–3412 CrossRef CAS PubMed.
- M. Y. Sfeir, H. Qian, K. Nobusada and R. Jin, J. Phys. Chem. C, 2011, 115, 6200–6207 CrossRef CAS.
- S. A. Miller, J. M. Womick, J. F. Parker, R. W. Murray and A. M. Moran, J. Phys. Chem. C, 2009, 113, 9440–9444 CrossRef CAS.
- M. Zhou, S. Tian, C. Zeng, M. Y. Sfeir, Z. Wu and R. Jin, J. Phys. Chem. C, 2017, 121, 10686–10693 CrossRef CAS.
- K. R. Krishnadas, A. Baksi, A. Ghosh, G. Natarajan and T. Pradeep, ACS Nano, 2017, 11, 6015–6023 CrossRef CAS PubMed.
- H. Su, Y. Wang, L. Ren, P. Yuan, B. K. Teo, S. Lin, L. Zheng and N. Zheng, Inorg. Chem., 2019, 58, 259–264 CrossRef CAS PubMed.
- M. Bayle, N. Combe, N. M. Sangeetha, G. Viau and R. Carles, Nanoscale, 2014, 6, 9157 RSC.
- M. Zhou, S. Tian, C. Zeng, M. Y. Sfeir, Z. Wu and R. Jin, J. Phys. Chem. C, 2017, 121, 10686 CrossRef CAS.
- M. S. Bootharaju, C. P. Joshi, M. R. Parida, O. F. Mohammed and O. M. Bakr, Angew. Chem., Int. Ed., 2016, 128, 934–938 CrossRef.
- S. Wang, Y. Song, S. Jin, X. Liu, J. Zhang, Y. Pei, X. Meng, M. Chen, P. Li and M. Zhu, J. Am. Chem. Soc., 2015, 137, 4018–4021 CrossRef CAS PubMed.
- Y. Niihori, N. Takahashi and M. Mitsui, J. Phys. Chem. C, 2020, 124, 5880–5886 CrossRef CAS.
- T. Dainese, S. Antonello, J. A. Gascón, F. Pan, N. V. Perera, M. Ruzzi, A. Venzo, A. Zoleo, K. Rissanen and F. Maran, ACS Nano, 2014, 8, 3904–3912 CrossRef CAS PubMed.
- A. Ghosh, J. Hassinen, P. Pulkkinen, H. Tenhu, R. H.-A. Ras and T. Pradeep, Anal. Chem., 2014, 86, 12185–12190 CrossRef CAS PubMed.
- M. J. Frisch, G. W. Trucks, H. B. Schlegel, G. E. Scuseria, M. A. Robb, J. R. Cheeseman, G. Scalmani, V. Barone, G. A. Petersson, H. Nakatsuji, X. Li, M. Caricato, A. V. Marenich, J. Bloino, B. G. Janesko, R. Gomperts, B. Mennucci, H. P. Hratchian, J. V. Ortiz, A. F. Izmaylov, J. L. Sonnenberg, D. Williams-Young, F. Ding, F. Lipparini, F. Egidi, J. Goings, B. Peng, A. Petrone, T. Henderson, D. Ranasinghe, V. G. Zakrzewski, J. Gao, N. Rega, G. Zheng, W. Liang, M. Hada, M. Ehara, K. Toyota, R. Fukuda, J. Hasegawa, M. Ishida, T. Nakajima, Y. Honda, O. Kitao, H. Nakai, T. Vreven, K. Throssell, J. A. Montgomery, Jr., J. E. Peralta, F. Ogliaro, M. J. Bearpark, J. J. Heyd, E. N. Brothers, K. N. Kudin, V. N. Staroverov, T. A. Keith, R. Kobayashi, J. Normand, K. Raghavachari, A. P. Rendell, J. C. Burant, S. S. Iyengar, J. Tomasi, M. Cossi, J. M. Millam, M. Klene, C. Adamo, R. Cammi, J. W. Ochterski, R. L. Martin, K. Morokuma, O. Farkas, J. B. Foresman and D. J. Fox, Gaussian 16, Revision A.03, Gaussian, Inc., Wallingford, CT, 2016 Search PubMed.
- Amsterdam density functional program, https://www.scm.com.4.
- G. Te Velde, F. M. Bickelhaupt, E. J. Baerends, C. Fonseca Guerra, S. J.-A. Van Gisbergen, J. G. Snijders and T. Ziegler, J. Comput. Chem., 2001, 22, 931–967 CrossRef CAS.
- C. Fonseca Guerra, J. G. Snijders, G. te Velde and E. J. Baerends, Theor. Chem. Acc., 1998, 99, 391–403 Search PubMed.
- M. Swart and F. Matthias Bickelhaupt, J. Comput. Chem., 2007, 29, 724–734 CrossRef PubMed.
- J. G. Snijders, S. J. A. van Gisbergen and E. J. Baerends, Chem. Phys. Lett., 1996, 259, 599–604 CrossRef.
- J. G. Snijders, S. J. A. van Gisbergen and E. J. Baerends, Comput. Phys. Commun., 1999, 118, 119–138 CrossRef.
- E. J. Baerends, E. van Lenthe and J. G. Snijders, J. Chem. Phys., 1993, 99, 4597–4610 CrossRef.
- E. J. Baerends, E. van Lenthe and J. G. Snijders, J. Chem. Phys., 1994, 101, 9783–9792 CrossRef.
- A. E. Ehlers, E. van Lenthe and E. J. Baerends, J. Chem. Phys., 1999, 110, 8943–8954 CrossRef.
- J. P. Perdew, Phys. Rev. B, 1986, 33, 8822–8824 CrossRef PubMed.
- A. D. Becke, Phys. Rev. A, 1988, 38, 3098–3100 CrossRef CAS PubMed.
- E. van Lenthe and E. J. Baerends, J. Comput. Chem., 2003, 24, 1142–1156 CrossRef CAS PubMed.
- S. K. Wolff, Int. J. Quantum Chem., 2005, 104, 645–659 CrossRef CAS.
- A.J. Kokalj, Mol. Graph. Model, 1999, 17, 176–179 CrossRef CAS.
Footnotes |
| † The data that support the findings of this study are openly available at https://doi.org/10.5281/zenodo.6572571 |
| ‡ Electronic supplementary information (ESI) available. See DOI: https://doi.org/10.1039/d1cp04708f |
| This journal is © the Owner Societies 2022 |

