
Multi-resolution simulation of DNA transport through large synthetic nanostructures†
Adnan
Choudhary
a,
Christopher
Maffeo
ab and
Aleksei
Aksimentiev
 *ab
*ab
aDepartment of Physics, University of Illinois at Urbana–Champaign, Urbana, IL 61801, USA. E-mail: aksiment@illinois.edu
bBeckman Institute for Advanced Science and Technology, University of Illinois at Urbana-Champaign, Urbana, IL 61801, USA
First published on 11th January 2022
Abstract
Modeling and simulation has become an invaluable partner in development of nanopore sensing systems. The key advantage of the nanopore sensing method – the ability to rapidly detect individual biomolecules as a transient reduction of the ionic current flowing through the nanopore – is also its key deficiency, as the current signal itself rarely provides direct information about the chemical structure of the biomolecule. Complementing experimental calibration of the nanopore sensor readout, coarse-grained and all-atom molecular dynamics simulations have been used extensively to characterize the nanopore translocation process and to connect the microscopic events taking place inside the nanopore to the experimentally measured ionic current blockades. Traditional coarse-grained simulations, however, lack the precision needed to predict ionic current blockades with atomic resolution whereas traditional all-atom simulations are limited by the length and time scales amenable to the method. Here, we describe a multi-resolution framework for modeling electric field-driven passage of DNA molecules and nanostructures through to-scale models of synthetic nanopore systems. We illustrate the method by simulating translocation of double-stranded DNA through a solid-state nanopore and a micron-scale slit, capture and translocation of single-stranded DNA in a double nanopore system, and modeling ionic current readout from a DNA origami nanostructure passage through a nanocapillary. We expect our multi-resolution simulation framework to aid development of the nanopore field by providing accurate, to-scale modeling capability to research laboratories that do not have access to leadership supercomputer facilities.
1 Introduction
Nanopore sensing1,2 is a biophysical analysis technique with wide-ranging applications from DNA and protein sequencing3,4 to DNA data storage.5,6 Beginning in the 1940s with Wallace Coulter's red blood cell counting device,7 decades of increasing technological capabilities have brought the pore size, and therefore sensing resolution, from large blood cells (∼3 μm) to individual molecules8 (∼20 nm) and to building blocks of biopolymers9 (∼1 nm). In this technique, the analyte to be detected is immersed in an electrolyte solution split between two large reservoirs that are connected by a tiny pore. An electric potential applied across the two reservoirs drives a steady ion current. When analytes pass through the pore, they produce disturbances in the ion current which can be used to infer the shape and concentration of the analyte. The materials used for these experiments may be of biological origin or man-made via a variety of bottom-up or top-down approaches. In the case of biological materials, a lipid membrane divides the electrolyte solution in two and a biological nanopore embedded in the membrane allows the passage of molecules.2 In the typical solid-state experiment, a thin membrane, perhaps made of glass, silicon nitride, or graphene, is etched or ion-beam sculpted to produce the desired nanopore.10While such nanopore measurements are useful, there are fundamental difficulties in interpreting the ionic current signals produced by the translocation of complex molecules. For this reason, molecular dynamics (MD) simulations are often invaluable,11 as they provide a microscopic trajectory that can aid the interpretation of experimental results.12,13 The most detailed all-atom MD simulations typically describe ions and water molecules explicitly, which allows for the direct calculation of the ionic current.14 This simulated current can be compared both quantitatively and qualitatively with experimental results.15 However, because such simulations typically require a high-performance supercomputer to simulate even a 10 nm cube of liquid for a microsecond, using such a detailed and atomistic approach for larger (100 nm to 1 μm) systems is impractical.
An alternative approach involves so-called coarse-graining (CG),16 whereby the same general framework of molecular dynamics is kept but simplifications are made which can result in an enormous decrease in computational cost. For example, the dynamics of individual atoms in a molecule are often uninteresting, and instead, larger scale properties such as the conformation of a biomolecule during a complicated translocation may be of more interest. In such circumstances it is natural to use “effective” simulation particles which can represent several dozens of atoms. Another common simplification is the removal of water from the simulation in favor of artificial stochastic forces that approximate the water's effect on the molecules. The removal of water and also ions in this manner tremendously reduces computational cost, firstly because water is the most abundant molecule and therefore computationally expensive to simulate, and secondly because its high-frequency internal dynamics limit the simulation timestep.
As introduced above, CG simulations have already provided invaluable information about nanopore systems that would have been difficult to obtain otherwise.17–21 Specific examples include CG MD simulation of DNA translocation through both the biological nanopore alpha-hemolysin22 and solid-state nanopores,23 Brownian dynamics simulations of polymer and nanoparticle translocation through passive and gated solid-state nanopores,24–26 and protein translocation through a nanopore containing a receptor protein.27 However, the removal of explicit ions means that ion currents can no longer be calculated directly. Several methods have already been developed to back-calculate the ionic current from a CG MD trajectory,22,25,27,28 which is typically done at the level of the Poisson–Nernst–Planck formalism,29,30 explicit-ion Brownian dynamics simulations31,32 and continuum calculations.33,34
Here, we describe a method for performing coarse-grained simulations of DNA transport through large (100 nm to 1 μm) nanofabricated systems and using finite element modeling to calculate the ionic current signals produced by the DNA transport. We find that the method is sufficiently sensitive to report on sub-nanometer scale features of the translocation process. These results suggest that our multi-resolution method can be used to inexpensively simulate a wide range of DNA translocation processes through experimental-scale systems of diverse geometries.
2 Multi-resolution simulations of nanopore transport
We begin by illustrating our method using a simple model system where a fragment of double-stranded DNA (dsDNA) is moved through a solid-state nanopore under applied electric field. Four translocation studies of practical interest are then described. We first apply our method to the translocation of dsDNA through ultrathin graphene nanoslits35 and show that features in the ionic current relate directly to DNA conformation inside the slit. We next consider a double nanopore system that, potentially, can offer unlimited resolution sequencing of single nucleic acid molecules.36 Our method is able to measure ionic currents through both nanopores separately, even when different electric biases are applied across them. Next, we apply our method to examine the use of nanocapillaries for DNA storage applications,6,37 elucidating the effect of nanostructure design and translocation direction on data readout. Finally, we show how our method can be extended to simulate translocation of large self-assembled nanostructures at both high and low salt conditions.The ESI† provides a detailed description of the simulation methods and protocols, as well as brief hands-on instructions and all the files required to reproduce the simulations described in Section 2.1. For the most up-to-date version of the simulations methods, please check our gitlab repository:
https://gitlab.engr.illinois.edu/tbgl/tutorials/multiresolution-modeling-of-nanopore-transport.
2.1 To-scale simulation of DNA translocation through a solid-state nanopore
To illustrate our methods in a simple context, we discuss the translocation of a 500 base pair (bp) DNA molecule depicted in Fig. 1a. The system consists of two cubic volumes with side lengths of 50 nm connected via a nanopore of 10 nm length and 10 nm diameter. This particular system was designed using a graphical user interface of a multi-physics software COMSOL, but other tools can be used for that purpose as well. Each base pair of the DNA molecule is represented using a backbone bead and an orientation bead, Fig. 1b. Harmonic constraints are enforced on the bond lengths, bending angles and torsion angles of these beads to reflect the contour length, persistence length and torsional persistence length of dsDNA.38 The 3D distribution of the electrostatic potential corresponding to a 200 mV transmembrane bias, Fig. 1c, was obtained by solving the electrostatics problem in COMSOL, in the absence of the DNA. The COMSOL output was also processed in the manner described in the ESI† to produce the steric confinement potential, also shown in Fig. 1c, to define the volume through which the DNA can move.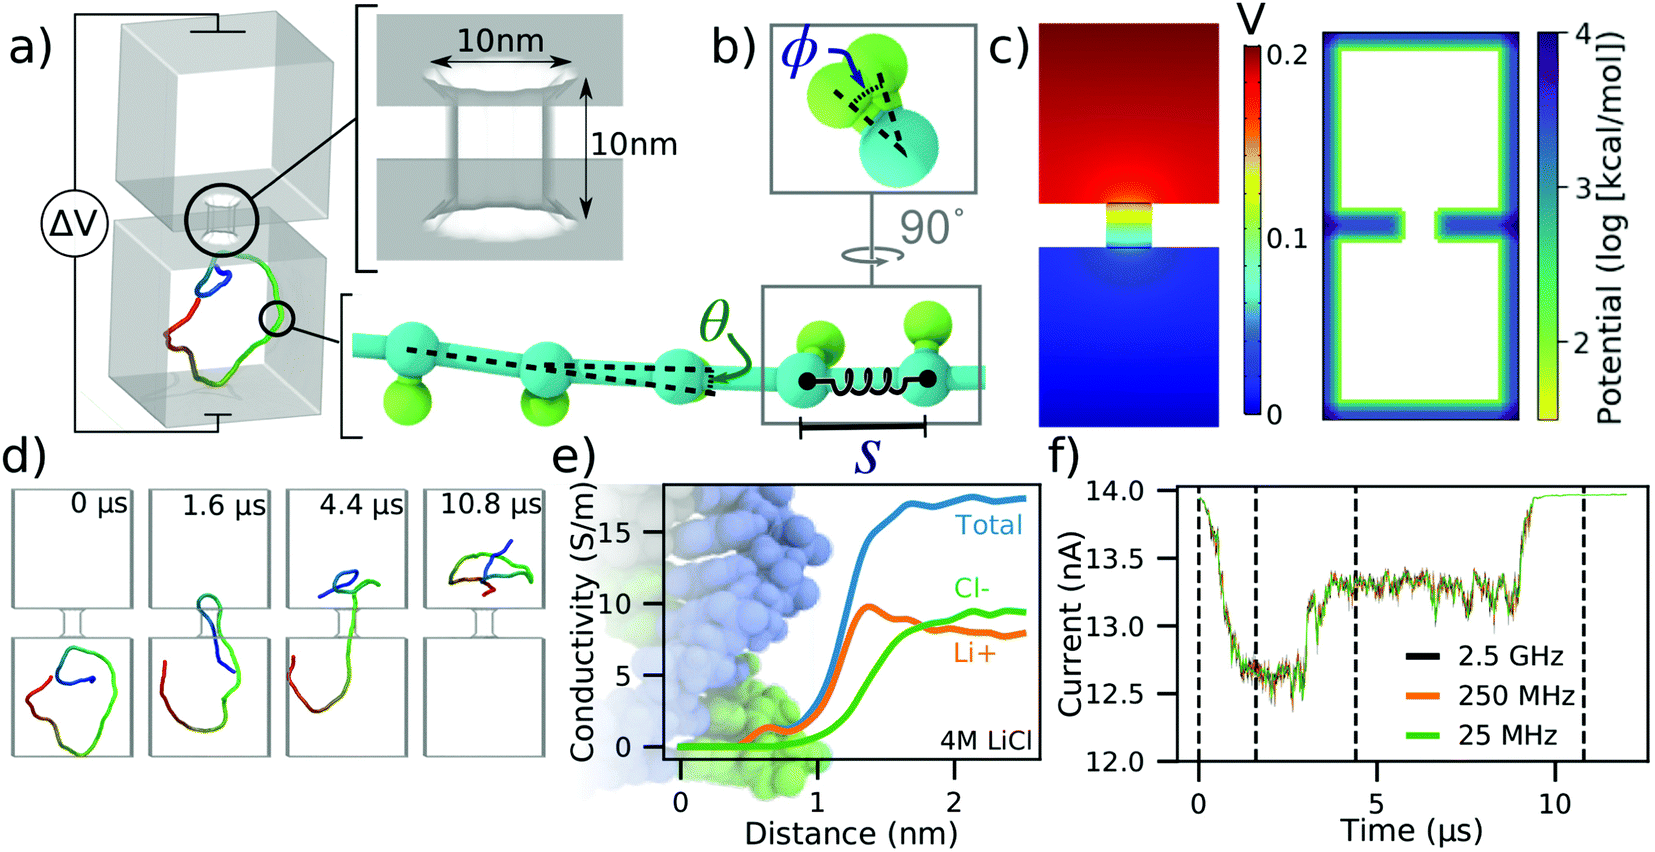 | ||
| Fig. 1 To-scale modeling of ionic current signatures produced by DNA translocation through a solid-state nanopore. (a) Schematic of a simulation system consisting of two cubic volumes of electrolyte, each with 50 nm sides, connected through a 10 nm-diameter nanopore in a 10 nm-thick membrane. A 500 bp dsDNA molecules is placed in one of the two compartments. A transmembrane bias ΔV = 0.2 V is appled across the membrane. (b) Coarse-grained representation of dsDNA where one or more DNA base pairs are represented by a backbone and an orientation bead.38 The bond length (S), the bending angle (θ) and the torsion angle (ϕ) are harmonically constrained to reproduce the contour length, the persistence length and the torsional persistence length of dsDNA. (c) Implicit representation of the nanopore membrane consisting of a 3D electrostatic potential map (left) and a steric potential (right). The electrostatic potential shown was computed using COMSOL. (d) Sequence of snapshots illustrating the capture and translocation of a 500 bp dsDNA strand. The DNA molecule is colored blue-to-red from one of its ends to the other. (e) Local conductivity of 4 M LiCl solution as a function of distance to the center of the DNA helix. The local conductivity profiles were derived from analysis of all-atom MD simulations.39 (f) Ionic current traces corresponding to the DNA translocation trajectory shown in panel (d), computed using SEM33 and the local ion conductivity model shown in panel e. The dashed lines correspond to snapshots shown in panel (d). The ionic current traces differ by their sampling rate. | ||
Prior to translocation simulations, the mrDNA38 package was used to equilibrate the DNA fragment in three steps of increasing resolution, see the system-specific methods section of the ESI† for details. The process of DNA translocation was then simulated by applying the local electrostatic forces to the DNA beads according to the electrostatic potential map derived from COMSOL and a 0.25 coupling factor between the charge of the bead and the effective force,40,41 see ESI† for a detailed description of the simulation procedures. The DNA molecule was seen to translocate from one cubic volume to another, through the nanopore, Fig. 1d. ESI,† Movie S1 illustrates this simulation trajectory. Supposing that this translocation occurs in 4 M LiCl, we incorporated the effect of DNA on the ionic current by applying the local conductivity function shown in Fig. 1e to construct a 3D map of electrolyte conductivity in the simulation volume at 0.5 nm resolution for frames of the trajectory sampled every 40, 4 and 0.4 nanoseconds. The points inside the membrane were assigned zero conductivity. Using the Steric Exclusion Model (SEM),33 we compute the current value for each instantaneous configuration of the DNA from the simulation trajectory, producing the ionic current trace characterizing the translocation process, Fig. 1f.
To verify that a 0.5 nm grid resolution is sufficient to resolve the DNA's effect on local conductivity precisely, we have used a 1, 0.5, and 0.25 nm grid resolution to recalculate the current trace shown in Fig. 1f. The resulting currents traces, ESI† Fig. S1, demonstrate that the features in the current computed using all three resolutions are essentially identical, although the currents differ from one another by small offsets. However, the difference in the currents computed using 0.5 and 0.25 nm grid resolutions is already very small and does not justify the eight-fold increase in time required to perform the current analysis at 0.25 nm.
The ionic current trace shows several features hallmark to experimental studies of dsDNA translocation through solid-state nanopores.42 The translocation begins with a DNA molecule entering the nanopore in the so-called “folded” configuration, where two segments of the same DNA molecule are present simultaneously inside the nanopore Fig. 1d. After some time, one segment leaves the nanopore while the other remains threaded through. Reflecting this translocation scenario, the ionic current first drops by approximately 1.4 nA when the DNA enters in a folded conformation. The current blockade amplitude drops to ∼0.7 nA when one of the segments leaves the nanopore, and then returns to the open pore value after all parts of the molecule exit the nanopore. The absolute value of the blockade current amplitude is very close to the values experimentally recorded at similar conditions.43 The translocation time scale is, however, systematically underestimated, which we attribute to the lack of friction between DNA and the nanopore and to the speedup common to all CG simulations caused by free-energy flattening.44 Note that because the currents are computed using an exact finite element calculation, the noise seen in the simulated current trace reflects the fluctuation in the DNA conformation and not the stochastic displacement of ions. Contrary to the dependence seen in experiment45 or in all-atom MD simulations,46 the noise does not increase with the sampling frequency as the sampling interval becomes smaller than the time scale of the conformational transition in dsDNA.
2.2 DNA translocation through a micron-scale 2D slit
As the first application of our multi-resolution method to a micron-scale device, we describe below simulations of DNA confinement and translocation through 2D nanopore systems.35Fig. 2a shows schematics of the experimental setup where an ultrathin nanoslit in a graphene stack is placed atop a silicon nitride membrane.47 Due to the atomically smooth graphene surfaces, the slit provides a platform to study transport of water, ions47 and polymers35 under tight two-dimensional confinement.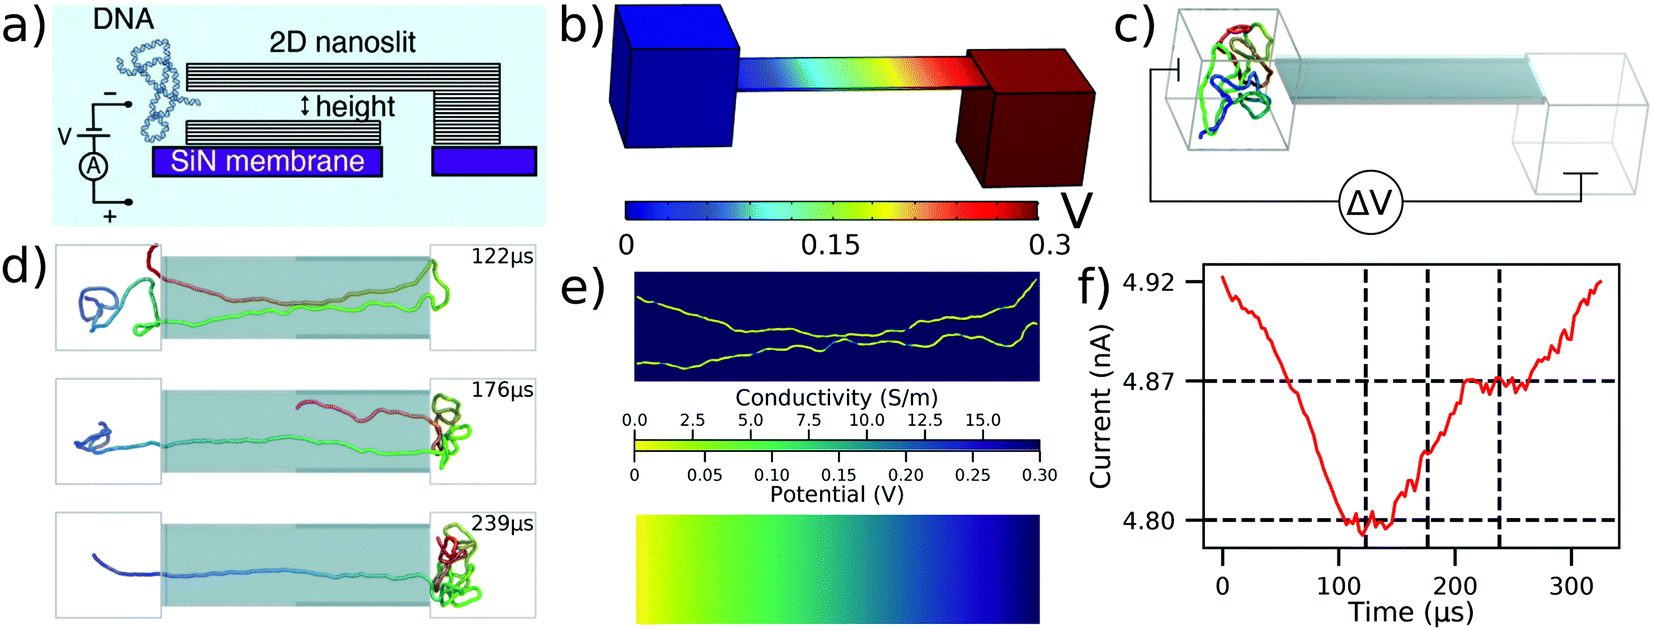 | ||
| Fig. 2 To-scale modeling of the ionic current measured during DNA translocation through a 2D nanoslit. (a) Schematic cross-section of the experimental nanoslit device, reproduced from ref. 35. Graphene stacks are attached atop a silicon nitride membrane to create a slit with approximate dimensions 400 × 110 × 3.5 nm3. (b) Electrostatic potential along the boundaries of the simulation system computed using COMSOL. The slit dimensions are reproduced from experiment while the two 160 nm cubes approximate the experimental entrance and exit reservoirs that DNA translocates between. (c) Initial configuration of the system prior to CG simulations of dsDNA translocation through the 2D nanoslit. Before translocation simulations, each 5000 bp DNA molecule was equilibrated in a 160 nm3 box using a multi-resolution simulation protocol to produce initial conformations. A ΔV = 300 mV bias is applied between the compartments, reproducing the experimental setup.35 (d) Sequence of snapshots illustrating the process of DNA translocation through the nanoslit. (e) The local conductivity (top) and the local electrostatic potential (bottom) within the center cross-section of the slit for the DNA conformation shown in the top snapshot of panel (d). Both quantities were computed using the local conductivity model from Fig. 1e under a 300 mV bias. (f) Ionic current analysis of the DNA translocation trajectory generated using SEM.33 The vertical dashed lines correspond to the snapshots shown in (d), while the horizontal dashed lines indicate the current levels when one or two fragments of the DNA molecule span the entire slit end-to-end. The trajectory was sampled at 367 kHz. | ||
In a typical experiment, a 5 kbp dsDNA fragment was introduced into a 4 M LiCl solution on one side of the slit, Fig. 2a. A 300 mV bias was applied to capture and translocate the DNA fragment through the slit. To simulate DNA translocation experiments, we built a to-scale model of the experimental system, Fig. 2b and c, with the length, width, and height of the slit equaling to 400 nm, 110 nm, and 3.5 nm, respectively, matching the experimental dimensions. A 160 nm cube was placed on either end of the slit to represent the large entry and exit reservoirs of the experimental system. Applying a 300 mV bias across our simulation system resulted in the electrostatic profile shown in Fig. 2b.
The mrDNA package38 was used to perform a multiresolution equilibration of the DNA molecule. After equilibration, the system was simulated under a 300 mV bias. ESI† Movie S2 illustrates a typical translocation trajectory, whereas Fig. 2d highlights some of the common conformations explored by the DNA within the slit. To make ionic current calculations using SEM tractable, the system was truncated to include only the slit. Doing so neglected the access resistance of the system, however the plot of the electrostatic potential, Fig. 2b, demonstrates that this approximation is appropriate. Following that, instantaneous configurations from the simulation were used to compute the local conductivity map of the volume within the slit at a uniform resolution of 0.5 nm in all directions, Fig. 2e (top), accounting for the DNA configuration using the function shown in Fig. 1e. The resulting local conductivity maps were used to find the ionic current through the slit under the appropriate boundary conditions, which also provided a solution for the local distribution of the electrostatic potential, Fig. 2e (bottom). Note that the distribution of the electrostatic potential obtained from the ionic current calculations is very similar to that derived from the COMSOL calculations, which justifies the use of the latter potential (computed in the absence of DNA) for the DNA translocation simulations. By performing the current calculations for a sequence of simulation frames, the ionic current trace resulting from the translocation, Fig. 2f, is obtained.
Having both the ionic current and the translocation trajectory allows us to associate features in the ionic current trace with DNA conformations during the translocation. For example, comparison of the snapshots in Fig. 2d and the current in Fig. 2f reveals that the current plateaus indicate the number of DNA strands present in the slit. In addition to several more examples linking the features in the current trace to DNA conformations, we also observed DNA knots and loops to pass through the 2D slits in a conformation that was effectively frozen during the translocation process. Ref. 35 describes this effect in more detail.
2.3 Capture and directed motion of ssDNA in a double nanopore system
We now consider DNA sequencing using solid-state nanopores. One of the primary obstacles to achieving solid-state nanopore sequencing has been that translocation of single-stranded DNA (ssDNA) through solid-state nanopores is too fast for the sequence to be deciphered from ionic current blockades.49 Nevertheless, solid-state nanopores have some innate advantages over biological nanopores that are practically desirable, such as tolerance for more extreme ionic and electrical conditions and integrability with conventional electronics. One promising solution to this problem is the use of two pores instead of just one.36,43,50,51 By having each end of an ssDNA molecule threaded through its own nanopore, the electric field in the two nanopores results in a tug-of-war, where the translocation speed and direction can be controlled by a slight difference in the forces exerted by the two nanopores.36,43,52 This could potentially solve the high translocation speed problem, and also allow for repeated measurements of the nucleotide sequence so that, in principle, it can be determined to arbitrary precision.Fig. 3a shows a schematic of the double nanopore capture concept. A DNA molecule is introduced in a reservoir above a membrane with two nanopores leading to two separated compartments. Here, both nanopores are 1 nm in radius and length, and are separated by 15 nm, but alternative and much larger systems can be modeled using the same approach.36 The thickness of the wall separating the two bottom compartments is also assumed to be small, just 1 nm, which will suffice to illustrate the application of our computational method. We assume the electric bias across each nanopore to be separately controlled. The 150 nucleotide ssDNA strand is represented by a two-beads-per-base-pair model,48Fig. 3b. The simulation trajectories of the double nanopore capture that we describe below were taken from a previous study43 and reanalyzed to compute the ionic currents signatures produced by ssDNA translocations through individual pores, assuming 4 M LiCl electrolyte conditions.
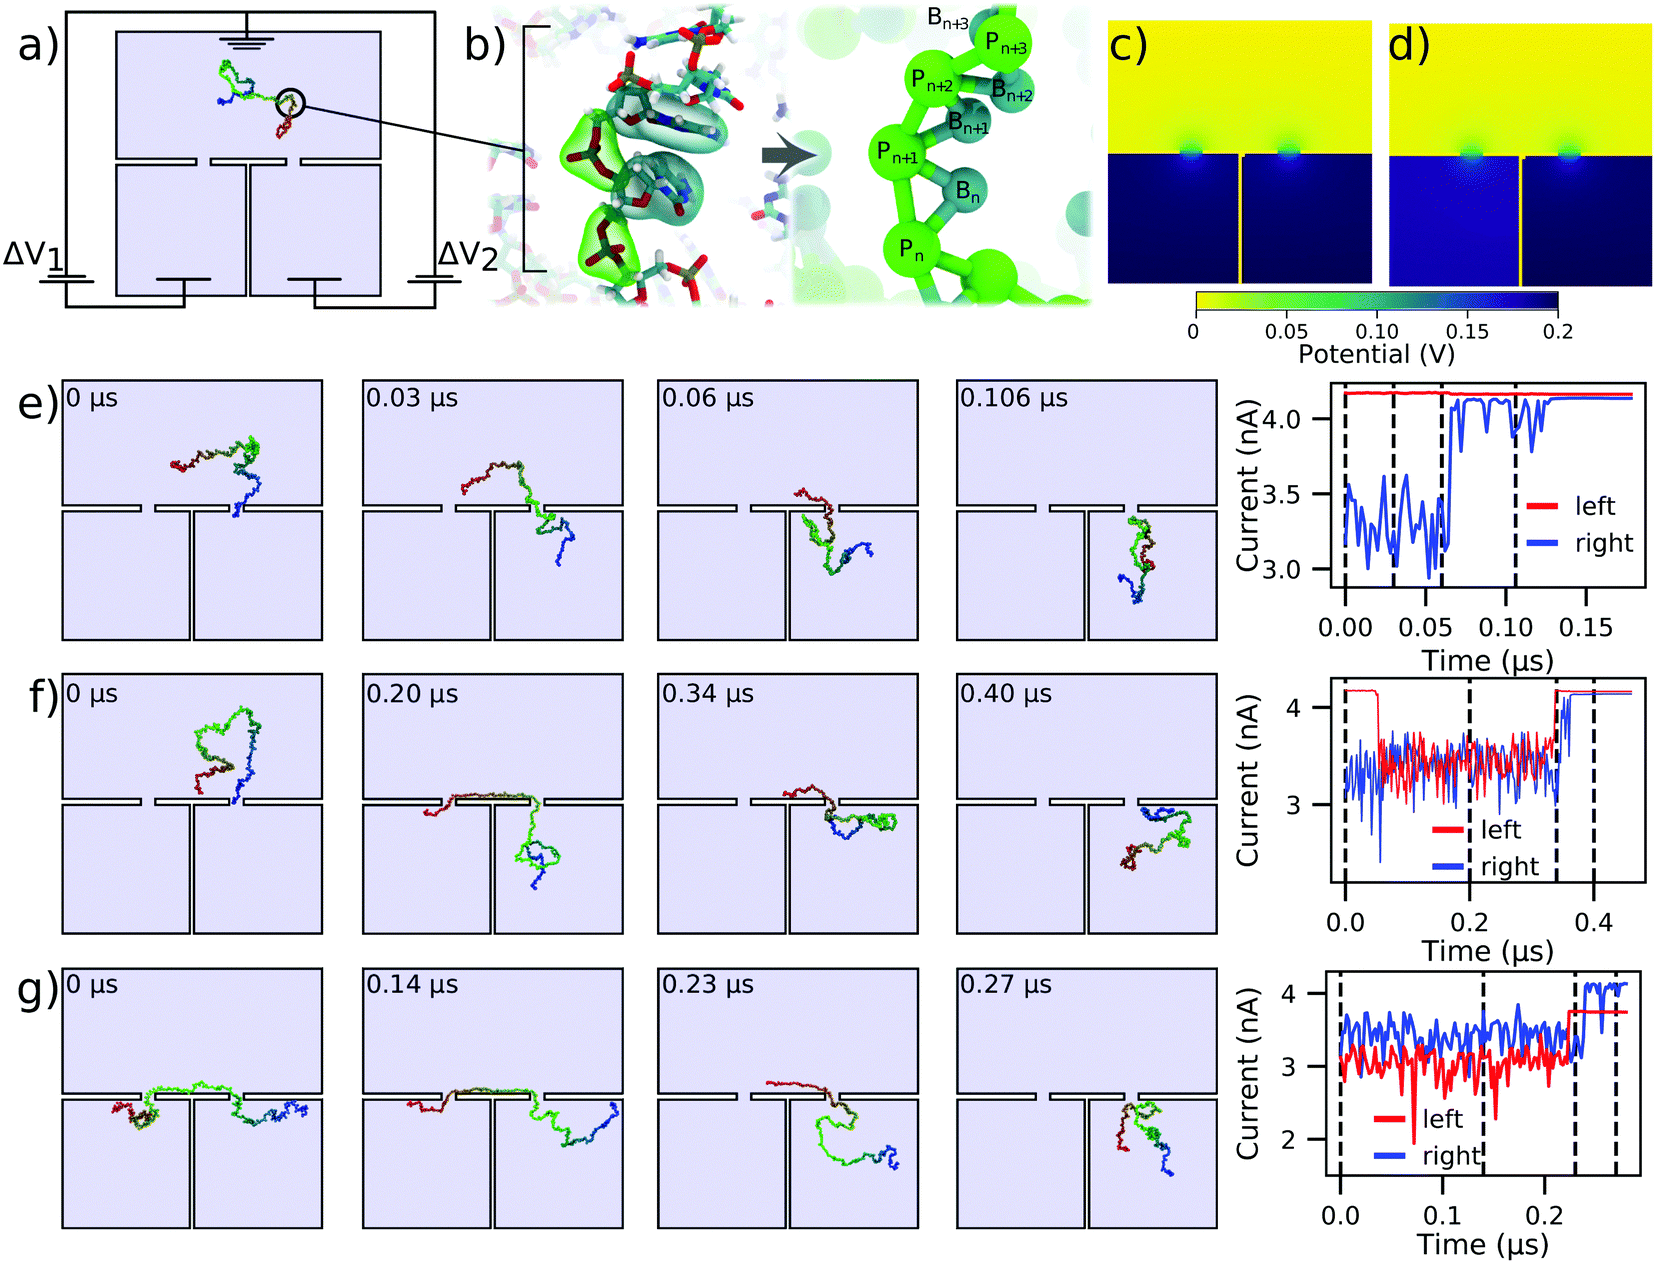 | ||
| Fig. 3 Modeling capture and translocation of ssDNA in a double nanopore system. (a) A previously described double nanopore system,43 consisting of two identical pores of 1 nm radius and length, separated by 15 nm. The nanopores lead to separate volumes which are divided by a 1 nm thick wall. Here, we consider a situation where the voltage bias ΔV1 and ΔV2 in each of the bottom chambers can be independently controlled relative to the top compartment, which is grounded. A 150 nucleotide ssDNA molecule is modeled at two-beads-per-nucleotide resolution. (b) Schematic of the two-beads-per-nucleotide model of ssDNA, adapted from an earlier work.48 Each nucleotide is represented by a backbone bead P and a base bead B. (c and d) Distribution of the electrostatic potential under conditions of translocation arrest, ΔV1 = ΔV2 = 200 mV (panel c), and directed translocation, ΔV1 = 180 mV and ΔV2 = 200 mV (panel d). (e and f) Single (panel e) and double (panel f) nanopore capture of ssDNA. The simulations begin with one end of the DNA strand captured in the right nanopore. The voltage drop across both pores is 200 mV (panel c). The right panel shows the ionic current through the left and right nanopores for the corresponding simulation trajectory. (g) Directional transport of ssDNA through the double nanopore system. The simulation begins having two ends of ssDNA symmetrically threaded into the two pores. The 20 mV bias differential (panel d) transports the ssDNA molecule from the left compartment to the right. The current through both pores is shown in the right panel. All ssDNA trajectories were taken from ref. 43. The current blockades were computed using a custom model of the local electrolyte conductivity (ESI,† Fig. S2) at 4 M LiCl electrolyte. | ||
To determine how the local conductivity is impacted in the vicinity of the P and B beads representing ssDNA, we assumed the functional form to be a simple linear ramp, from zero to bulk 4 M LiCl conductivity. To determine the beginning and end points of the linear ramp, we used as guidance the interaction potentials between same-type beads, shown in ESI† Fig. S2a (see Methods in the ESI†).
Double nanopore capture simulations, which began with having one end of the DNA already captured at the right nanopore, were analyzed under symmetric bias conditions: ΔV1 = ΔV2= 200 mV, Fig. 3c. To calculate the ionic currents in the double nanopore system, three Dirichlet boundary conditions had to be assigned as shown in Fig. 3a, as opposed to the two we have applied in the other simulations discussed here. In particular, the entire top surface in Fig. 3a was given a potential of 0, while the left and the right halves of the bottom surface were assigned individual target potentials, permitting us to describe an asymmetric bias condition, such as the one shown in Fig. 3d. Then, SEM was used to evaluate the ionic currents flowing through each nanopore. Technical details of the calculations are provided in the system-specific methods section of the ESI.†
Fig. 3e shows an example of the simulation trajectory where the ssDNA is captured in the right nanopore but fails to be captured by the left nanopore. Consequently, the ionic currents calculated separately for the left and the right nanopore under the bias conditions of Fig. 3c show no change in the left nanopore current whereas the current in the right nanopore returns to the open pore current after the DNA exits the right nanopore. Under identical bias conditions, double nanopore capture, Fig. 3f, produces a transient reduction of the current in the left nanopore; both currents return to the open pore levels as the molecule leaves the double nanopore system. ESI† Movie S3 illustrates this simulation trajectory. Interestingly, the current returns to the open pore level first through the left nanopore, indicating that the DNA molecules enters the right bottom compartment after escaping from the double nanopore trap.
Starting from a state where the ssDNA is symmetrically captured by the two nanopores, Fig. 3g, we can direct the motion of the molecule from the left nanopore to the right one by reducing the transmembrane bias in the left nanopore by 10%. The corresponding current trace was calculated using the bias conditions shown in Fig. 3d, where ΔV1 = 180 mV and ΔV2 = 200 mV. The 10% reduction in ΔV1 is seen in the current trace as a proportional reduction in the current passing through the left nanopore. The DNA is seen to exit first from the left nanopore and then through the right nanopore, as indicated by the order in which the ionic current through the nanopores returns to the open pore value.
Thus, our simulation method is capable of predicting the simulation outcomes for nanoscale systems of complex geometry and non-trivial applied bias conditions. The simulation method is also amenable to accounting for other effects that can influence DNA translocation, such as thermophoresis53 and fluid flow.36 We would like to stress again that the absolute simulation time scale should not be taken literally and should instead be interpreted relative to other translocation processes simulated using the same model.
2.4 DNA data storage readout using a nanocapillary
Having studied the DNA transport through nanopores and nanoslits, we turn our attention to the application of this process to DNA data storage technology. As we are fast approaching the data density limits of present technologies, alternatives such as DNA data storage are being explored.5,54 One particular approach has been demonstrated by the Keyser lab,6,37 where dsDNA side arms are attached to a much longer DNA helix to encode data. The data is then read by translocating the DNA construct through a nanocapillary and detecting the arms as ionic current blockades. This method is superior to traditional DNA data storage for its ease of encoding and decoding as well as its potential for integrability with miniaturized solid-state devices.6We studied the mechanism behind these measurements and quantitatively characterized how the spacing of arms influences signal quality and detection ability. Fig. 4a shows a 300 nm long capillary joining two large reservoirs of 4 M LiCl electrolyte solution. The capillary tip duplicates the experimental geometry and has a 4 nm inner diameter tip opening, along with cone angles of 4.9 and 1.2 degrees.6,37 As is discussed further in the ESI,† COMSOL was also used to solve for the concentration of ions and the velocity they impart to the fluid. This represents an important improvement to the continuum simulation because, in addition to the 400 mV bias applied across the capillary, the capillary surfaces are also given a constant surface charge of −0.01 C m−2, as in experiment.6,37 The coupled continuum simulation results in the electric potential shown in Fig. 4b. This potential was used to pull the DNA data storage construct, schematically represented in Fig. 4c, through the nanocapillary. The construct consisted of a 1030 bp dsDNA helix decorated with twenty-two 14 bp dsDNA side arms attached every 30 bp. The first and the last 200 bp of the construct were not decorated with the side arms. Note that we did not use the flow profile solution provided by COMSOL in our translocation simulations as the effect of flow is already accounted for by the charge reduction factor41 that couples the electrostatic potential to the force of each bead (see Methods in the ESI†).
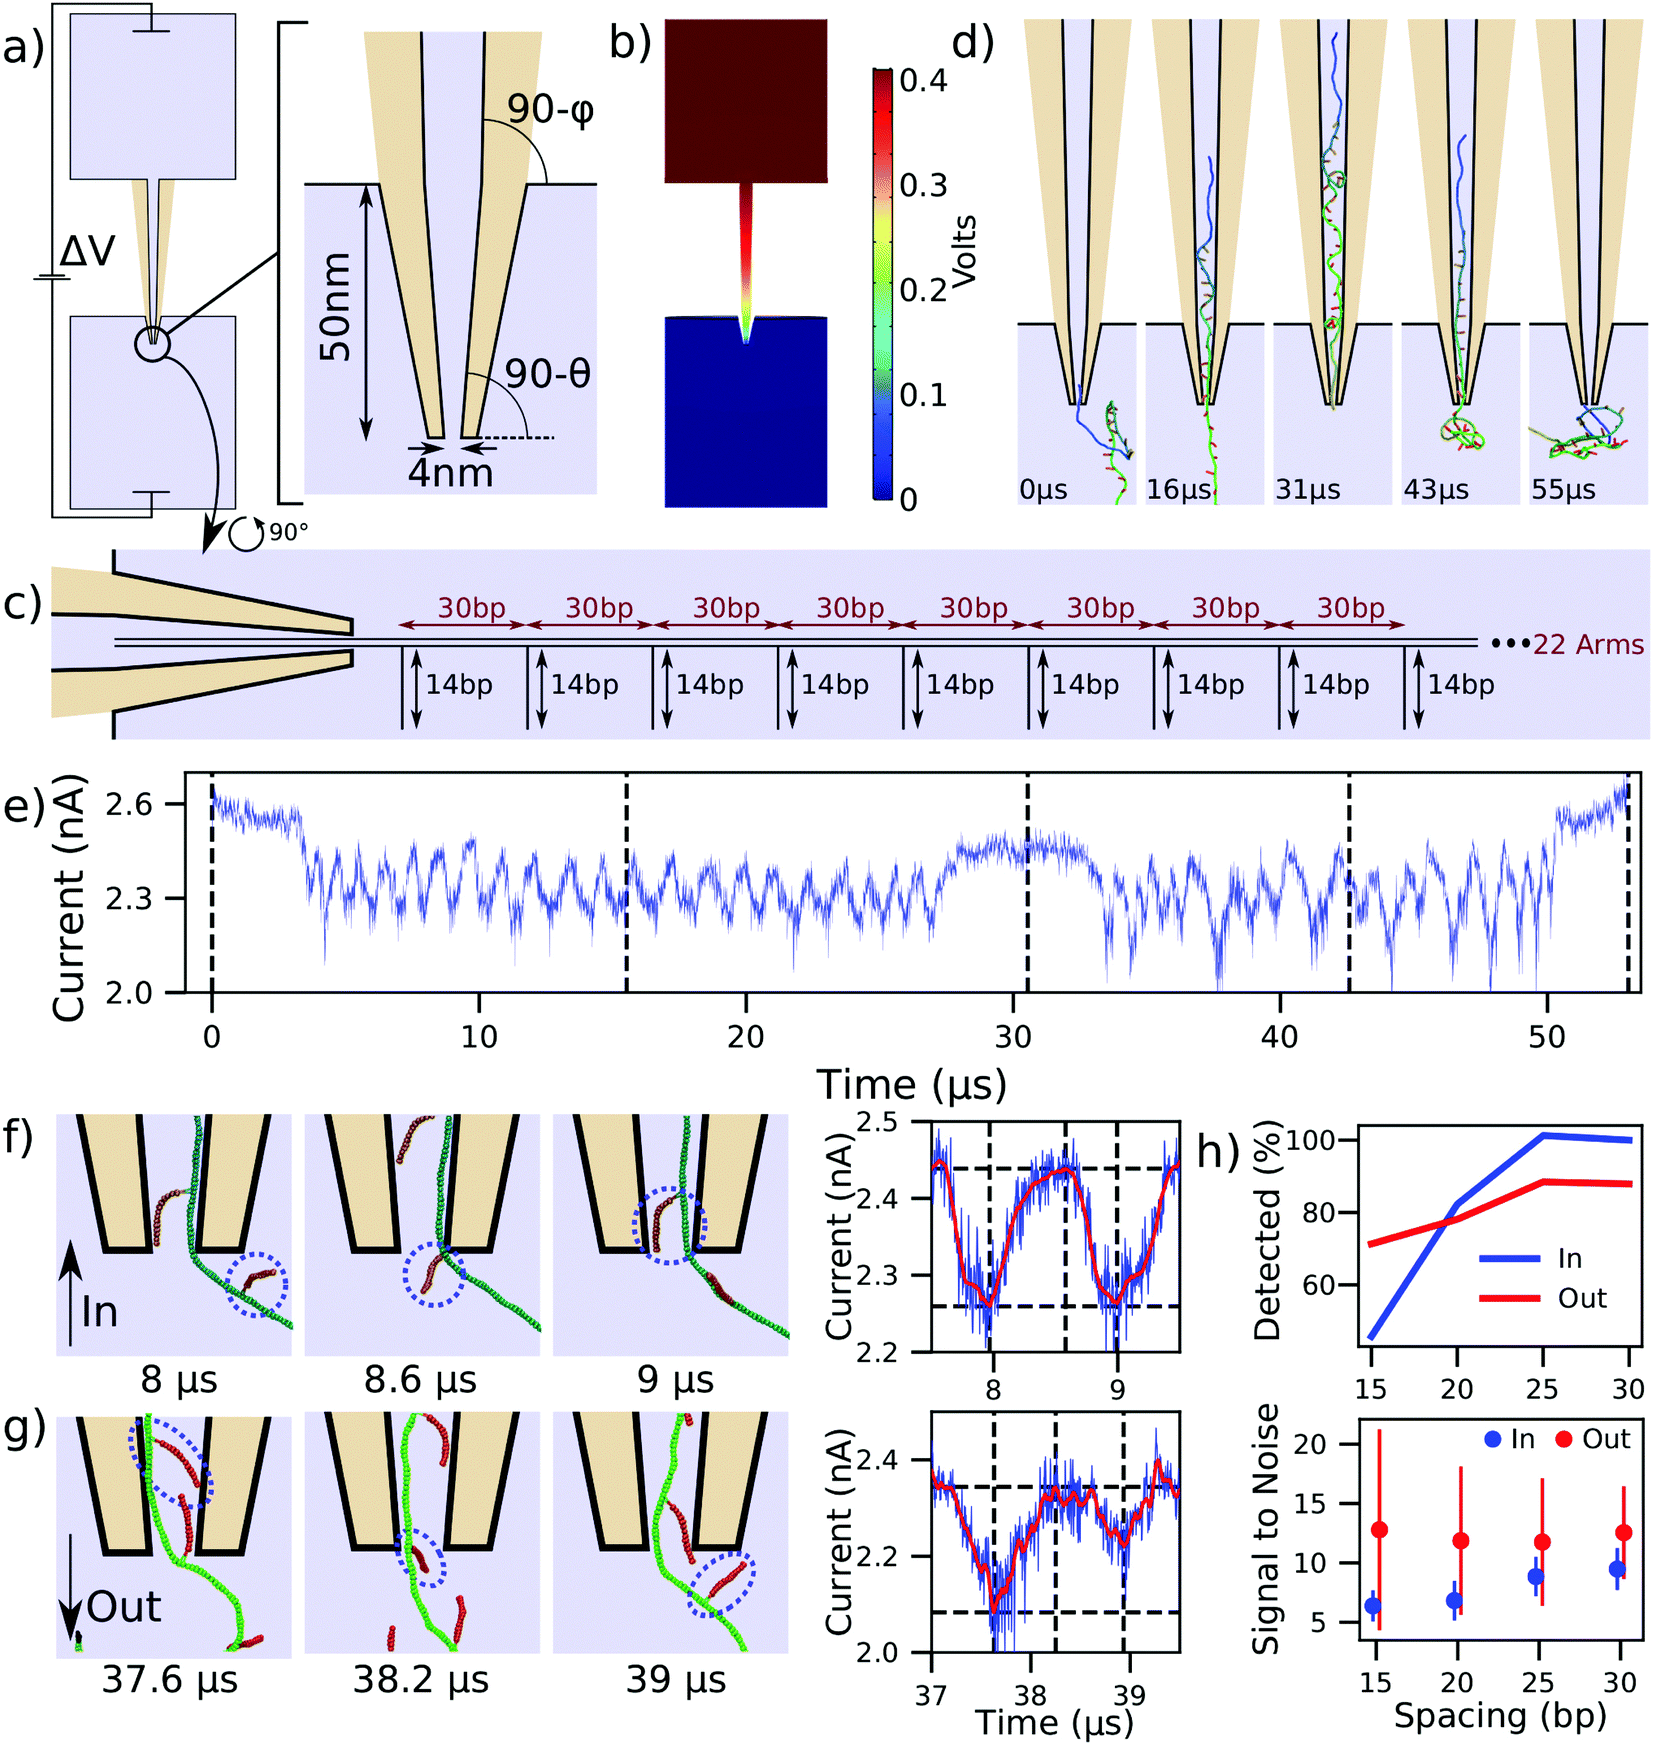 | ||
| Fig. 4 Modeling DNA data storage readout. (a) Schematic of a capillary used in DNA storage experiments6,37 and the zoomed-in view of the tip geometry. The angles θ and ϕ are 4.9 and 1.2 degrees, respectively. Light blue colored areas represent the simulation volume whereas the tan color represents the glass capillary. (b) Distribution of the electrostatic potential corresponding to a 400 mV bias applied to pull a DNA construct into the capillary. (c) Schematic of the DNA data storage construct entering the capillary. (d) Sequence of snapshots illustrating a simulation of the construct's translocation into and out of the capillary. (e) Ionic current traced corresponding to the translocation process depicted in panel (d). Dashed lines correspond to the snapshots shown, and the trajectory was sampled at 312 MHz. (f and g) Sequence of snapshots detailing the process of side arm translocation into (panel f) and out of (panel g) the capillary. The circles are drawn around the same dsDNA arm. The right panel illustrates the raw current trace in blue and a Savitzky–Golay filtered trace in red, along with dashed lines corresponding to the snapshots. Peak-fitting identifies the passage of the arms. (h) Accuracy of detecting side arm translocation (top) and the average signal to noise ratio (bottom) for the four constructs differing by the spacing between the side arms. The error bars in the signal-to-noise plot show the standard deviation among the observed signals. | ||
With only the steric potential applied to the DNA construct, we used mrDNA to equilibrate the construct. To ensure our subsequent translocation simulations completed in a reasonable time, one end of the DNA construct was restrained to remain inside the tip of the capillary during the equilibration simulation. Starting with a randomly chosen equilibrated conformation, we simulated a complete translocation of the construct into the capillary Fig. 4d, at which point the polarity of the applied 400 mV bias was reversed, solved again in COMSOL, and used to create a new electrostatic potential map to push the construct out of the capillary. ESI† Movie S4 illustrates these two back-to-back simulations. The current calculated using SEM for this translocation is shown in Fig. 4e. Zooming into the inward translocation shown in Fig. 4f reveals the mechanism by which side arms are distinguished: the current attains a local minimum just after side arms are pulled into the capillary, whereas just before a new arm is pulled in, the current attains its maximum. The ionic current is shown using both unfiltered and Savitzky–Golay filtered traces. Performing peak-fitting allows us to count the number of detected side arms. The signal strength is defined as the difference between the horizontal dashed lines in Fig. 4f (right column), where the lower line corresponds to the current at the identified peak and the higher line corresponds to the maximum in current occurring before the next identified peak.
The current blockades produced for the translocation of the construct in the opposite (outward) direction, Fig. 4e, appear to be less regular and at times deeper than those observed during the inward translocation. Fig. 4g reveals that this effect is caused by neighboring side arms pointing towards one another (first snapshot). In this scenario, a single deeper current blockade represents the passage of two side arms. This effect is not observed for inward translocation, and is responsible for the lower detection rate for outward translocation of widely-separated side arms shown in Fig. 4h. To further investigate the dependence of the signal quality and detection ability on side arm spacing, we performed analogous simulations with DNA helices of the same overall length but with arms spaced at 25, 20, and 15 base pairs, still leaving the first and last 200 bp of the construct undecorated. To characterize the signal noise in this method, we first computed the difference in the raw current and the Savitzky–Golay filtered current during the first microsecond of the simulation, and defined the noise to be equal to the standard deviation of these values. As is expected, the side arm detection rate and signal-to-noise ratio decrease as the side arm spacing is decreased.
2.5 DNA origami transport in high and low molarity electrolytes
Nanocapillaries represent single-molecule sensing tools that can be used for a wide variety of tasks, from differentiating molecules based on their shape58,59 to developing optical voltage sensing.60 One application of nanocapillaries involves distinguishing between similar DNA origami plates.56 Raveendran et al. demonstrated that the currents measured during translocation of rectangular DNA origami plates were different from currents produced by rectangular plates with rectangular holes in them. Differences in capillary dwell time and ionic current amplitude were observed between these kinds of plates, demonstrating the remarkable sensitivity achieved by nanocapillaries when used as biological sensors.Here, we simulate the translocation of a DNA origami plate through a nanocapillary as described in ref. 56. Experimental translocations of this plate at low salt concentrations result in current enhancements,56 in contrast to the current blockades observed at high salt conditions.61 The capillary used in our simulations was geometrically identical to the one described in Fig. 4a except for the diameter of its inner tip, which was 50 nm. In preparation for the translocation simulations, we read the cadnano design of the plate, Fig. 5a, directly into mrDNA38 and, starting from the ideal initial configuration, Fig. 5b, equilibrated the system for 6 μs in bulk solution using a 4 bp/bead model without explicit representation of the helical twist, producing the representative equilibrated conformation shown in Fig. 5c. The plate was then rotated by a random angle about a random axis and translated along the capillary axis so that only one DNA bead of the plate was inside the capillary, Fig. 5d. The plate translocation simulation was then performed under a 600 mV bias potential. ESI,† Movie S5 illustrates a typical simulation trajectory.
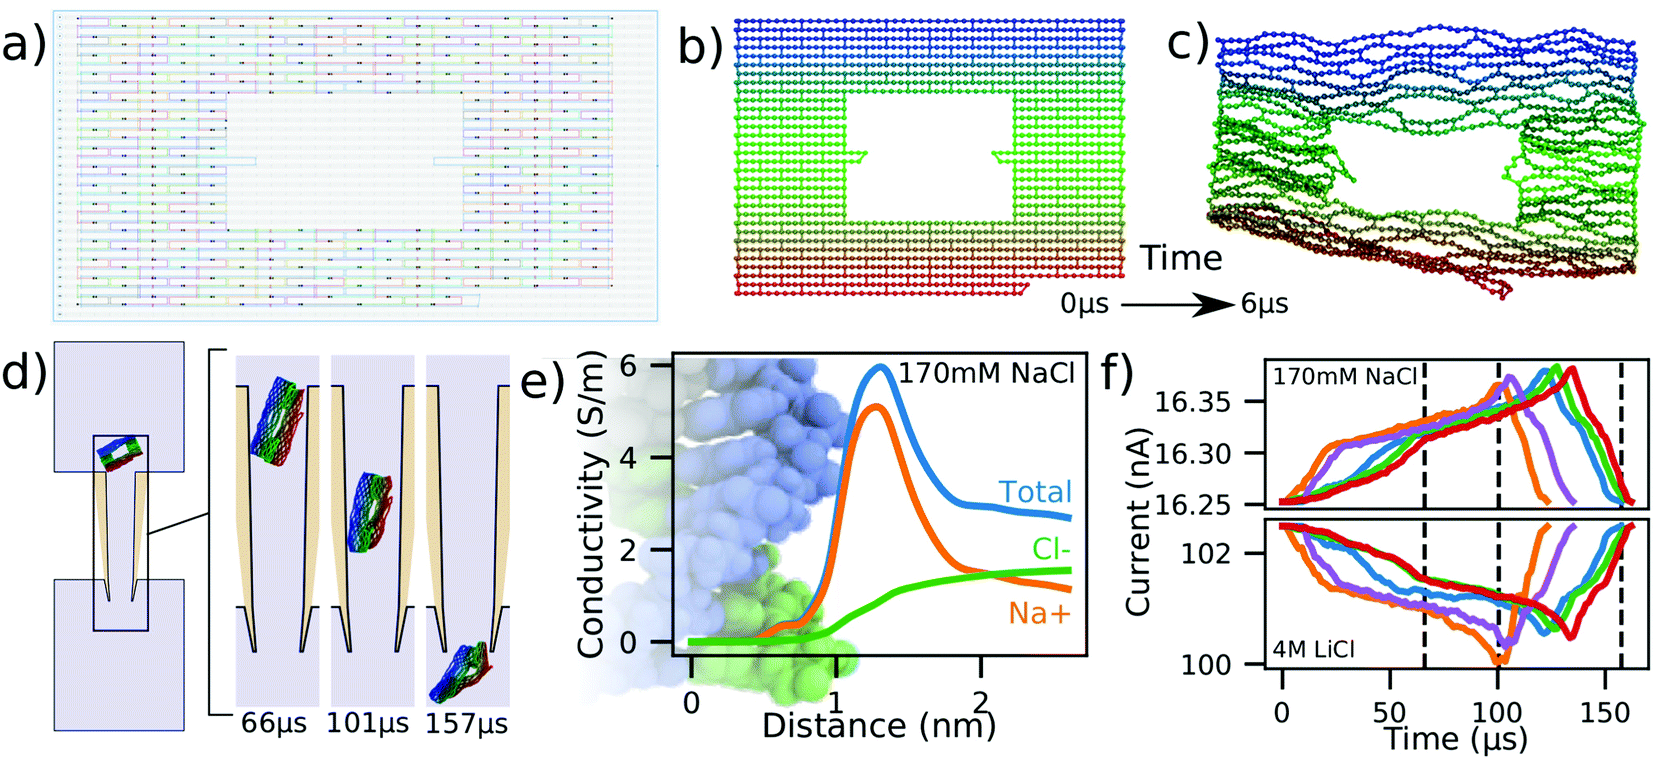 | ||
| Fig. 5 Modeling DNA origami plate translocation through a nanocapillary. (a) Cadnano55 model of a DNA plate used for translocation experiments.56 (b and c) Initial (panel b) and equilibrated (panel c) structure of a DNA origami plate simulated at 2 beads per base pair resolution using mrDNA.38 (d) Simulated translocation of a DNA origami plate through a capillary driven by a 600 mV voltage. The geometry of the capillary differs from that depicted in Fig. 4a by the inner tip diameter, which was changed from 4 nm to 50 nm. (e) Local conductivity of 170 mM NaCl solution as a function of distance to the center of the DNA helix. The local conductivity profiles were derived from analysis of all-atom MD simulations.57 The background image shows an all-atom model of dsDNA aligned to-scale with the horizontal axis. (f) Blockade current signatures computed from five independent simulations of the DNA origami plate translocation through a nanocapillary differing by the conformation of the plate at the beginning of the translocation simulation. For the same permeation trajectory, blockade current were calculated at 170 mM NaCl (top) and 4 M LiCl (bottom). The intersection of the dashed lines with the red curve correspond to the snapshots shown in panel (d). | ||
Five independent simulations were performed in this manner using a 100 fs timestep instead of the 40 fs timestep that we have employed for translocation simulations of dsDNA models until now. The function describing the local conductivity in the vicinity of dsDNA for 170 mM NaCl is shown in Fig. 5e and derives from analysis of all-atom MD simulations.57 Using the two conductivity functions, one for 170 mM NaCl, Fig. 5e and another for 4 M LiCl, Fig. 1e, we analyzed the same simulation trajectories to compute the two sets of current traces shown in Fig. 5f.
Similar to experiment,56,61 we find the simulated ionic currents increase when the DNA origami plate translocates through the nanocapilary at 170 mM NaCl and decrease at 4 M LiCl. This is explained by the difference in the shape of the local conductivity functions associated with the two salt conditions. Whereas the presence of DNA in high salt environments decreases the overall conductivity, Fig. 1e, an increase is observed for the low salt environments, Fig. 5e. These results suggest that our simulation method can be adapted to handle arbitrary electrolyte conditions.
3 Conclusions
We have described a computationally efficient method for to-scale simulations of DNA transport through large synthetic nanostructures. This method provides a comparatively quick and cheap simulation approach that can be used to guide and accelerate experimental investigations by identifying promising experiments and fine tuning design parameters. Additionally, the methods employed here may be adequate substitutes for expensive and time consuming all-atom MD simulations.There are, of course, several ways one can further increase the realism of the method. In all simulations described above, we used the same constant electrostatic potential to drive DNA translocation. However, the presence of the DNA can alter the field, as shown to be the case in “smooth” nanopore translocation experiments reported by the Wanunu lab.62 Our multi-resolution simulation framework can be made self-consistent by solving the electrostatic problem via SEM concurrently with the translocation simulations, and using the electrostatic potential from the SEM calculations to drive the DNA translocation.
The removal of water in our coarse-grained simulations also removes all hydrodynamic effects. In our simulations of nanopore transport, we implicitly accounted for the electro-osmotic effect by introducing a charge reduction factor.41 If the effect of the simulated particles on the fluid velocity field is expected to be minimal, a hydrostatic description of the flow can be adopted, as we have successfully done previously.36 We note that it is possible to account for the hydrodynamic effect directly at the level of a Lattice-Boltzmann model, as was shown by the Holm lab.63 The principle difficulty with that approach is disentangling the effect of ion binding to DNA and finding an appropriate boundary condition for the fluid moving pass the DNA surface. In principle, both can be obtained from all-atom MD simulations.39,64
The simulations described above assumed frictionless surfaces, which contributed to the mismatch between the simulated and experiment time scale. The friction effects can be accounted for by introducing local diffusivity maps31 and by describing the interaction between DNA beads and the surface using a heterogeneous surface potential.65 Another caveat is that, presently, the secondary structure of the DNA model is fixed, i.e., the double strand cannot split into two single strands. Such simulation will become possible when oxDNA66 or 3SPN67 models of DNA will become available in mrDNA. Finally, we note that accuracy of ionic current predictions can be further improved by using mrDNA to replace the CG models of DNA nanostructures with their fully atomic representations and then using the steric exclusion model33 to predict the nanopore current with truly atomic resolution.
Conflicts of interest
There are no conflicts to declare.Acknowledgements
This work was supported by the National Science Foundation grant DMR-1827346 and the National Institutes of Health grants P41-GM104601 and R21-HG011741. The supercomputer time was provided through XSEDE Allocation Grant MCA05S028 and the Leadership Resource Allocation MCB20012 on Frontera of the Texas Advanced Computing Center. The authors thank Paolo Actis and Christoph Wälti for illuminating discussions regarding the DNA origami plate simulations and for sharing the associated cadnano model. The authors also thank Ulrich Keyser and Kaikai Chen for illuminating discussions regarding DNA nanostructure translocation through nanocapillaries and for sharing their COMSOL model of the capillary. Finally, the authors thank Kumar Sarthak for his help with the SEM calculations.References
- S. M. Bezrukov, I. Vodyanoy and V. Adrian Parsegian, Counting polymers moving through a single ion channel, Nature, 1994, 370(6487), 279–281 CrossRef CAS PubMed.
- J. J. Kasianowicz, E. Brandin, D. Branton and D. W. Deamer, Characterization of individual polynucleotide molecules using a membrane channel, Proc. Natl. Acad. Sci. U. S. A., 1996, 93, 13770–13773 CrossRef CAS.
- Meni Wanunu, Nanopores: A journey towards DNA sequencing, Phys. Life Rev., 2012, 9(2), 125–158 CrossRef.
- J. A. Alfaro, P. Bohländer, M. Dai, M. Filius, C. J. Howard, X. F. van Kooten, S. Ohayon, A. Pomorski, S. Schmid, A. Aksimentiev, E. V. Anslyn, G. Bedran, C. Cao, M. Chinappi, E. Coyaud, C. Dekker, G. Dittmar, N. Drachman, R. Eelkema, D. Goodlett, S. Hentz, U. Kalathiya, N. L. Kelleher, R. T. Kelly, Z. Kelman, S. Hyun Kim, B. Kuster, D. Rodriguez-Larrea, S. Lindsay, G. Maglia, E. M. Marcotte, J. P. Marino, C. Masselon, M. Mayer, P. Samaras, K. Sarthak, L. Sepiashvili, D. Stein, M. Wanunu, M. Wilhelm, P. Yin, A. Meller and C. Joo, The emerging landscape of single-molecule protein sequencing technologies, Nat. Methods, 2021, 18(6), 604–617 CrossRef CAS.
- V. Zhirnov, R. M. Zadegan, G. S. Sandhu, G. M. Church and W. L. Hughes, Nucleic acid memory, Nat. Mater., 2016, 15(4), 366–370 CrossRef CAS PubMed.
- K. Chen, J. Kong, J. Zhu, N. Ermann, P. Predki and U. F. Keyser, Digital data storage using dna nanostructures and solid-state nanopores, Nano Lett., 2019, 19(2), 1210–1215 CrossRef CAS.
- E. Simson, Wallace Coulter's life and his impact on the world, Int. J. Lab. Hematol., 2013, 35(3), 230–236 CrossRef CAS PubMed.
- J. Li, D. Stein, C. McMullan, D. Branton, M. J. Aziz and J. A. Golovchenko, Ion-beam sculpting at nanometre length scales, Nature, 2001, 412(6843), 166–169 CrossRef CAS PubMed.
- J. Clarke, H.-C. Wu, L. Jayasinghe, A. Patel, S. Reid and H. Bayley, Continuous base identification for single-molecule nanopore DNA sequencing, Nat. Nanotechnol., 2009, 4(4), 265–270 CrossRef CAS PubMed.
- C. Dekker, Solid-state nanopores, Nat. Nanotechnol., 2007, 2, 209–215 CrossRef CAS PubMed.
- D. Lu, A. Aksimentiev, A. Y. Shih, E. Cruz-Chu, P. L. Freddolino, A. Arkhipov and K. Schulten, The role of molecular modeling in bionanotechnology, Phys. Biol., 2006, 3, S40–S53 CrossRef CAS PubMed.
- A. Aksimentiev, J. B. Heng, G. Timp and K. Schulten, Microscopic kinetics of DNA translocation through synthetic nanopores, Biophys. J., 2004, 87, 2086–2097 CrossRef CAS PubMed.
- I. C. Yeh and G. Hummer, Diffusion and electrophoretic mobility of single-stranded RNA from molecular dynamics simulations, Biophys. J., 2004, 86, 681–689 CrossRef CAS PubMed.
- A. Aksimentiev and K. Schulten, Imaging α-hemolysin with molecular dynamics: Ionic conductance, osmotic permeability and the electrostatic potential map, Biophys. J., 2005, 88, 3745–3761 CrossRef CAS PubMed.
- A. Aksimentiev, Deciphering ionic current signatures of DNA transport through a nanopore, Nanoscale, 2010, 2, 468–483 RSC.
- D. L. Ermak and J. A. McCammon, Brownian dynamics with hydrodynamic interactions, J. Chem. Phys., 1978, 69, 1352 CrossRef CAS.
- M. Muthukumar, Mechanism of DNA transport through pores, Annu. Rev. Biophys. Biomol. Struct., 2007, 36, 435–450 CrossRef CAS.
- K. Luo, T. Ala-Nissila, S.-C. Ying and A. Bhattacharya., Sequence dependence of DNA translocation through a nanopore, Phys. Rev. Lett., 2008, 100, 058101 CrossRef PubMed.
- M. Fyta, S. Melchionna and S. Succi, Translocation of Biomolecules Through Solid-State Nanopores: Theory Meets Experiments, J. Polym. Sci., Part B: Polym. Phys., 2011, 49(14), 985–1011 CrossRef CAS.
- V. V. Palyulin, T. Ala-Nissila and R. Metzler, Polymer translocation: the first two decades and the recent diversification, Soft Matter, 2014, 10(45), 9016–9037 RSC.
- D. Panja, G. T. Barkema and A. B. Kolomeisky, Through the eye of the needle: recent advances in understanding biopolymer translocation, J. Phys.: Condens. Matter, 2013, 25(41), 413101 CrossRef.
- M. Muthukumar and C. Y. Kong, Simulation of polymer translocation through protein channels, Proc. Natl. Acad. Sci. U. S. A., 2006, 103, 5273–5278 CrossRef CAS PubMed.
- C. Forrey and M. Muthukumar, Langevin dynamics simulations of ds-DNA translocation through synthetic nanopores, J. Chem. Phys., 2007, 127, 015102 CrossRef.
- I. A. Jou, D. V. Melnikov and M. E. Gracheva, Protein permeation through an electrically tunable membrane, Nanotechnology, 2016, 27(20), 205201 CrossRef PubMed.
- Z. K. Hulings, D. V. Melnikov and M. E. Gracheva, Brownian dynamics simulations of the ionic current traces for a neutral nanoparticle translocating through a nanopore, Nanotechnology, 2018, 29(44), 4452 CrossRef PubMed.
- C. C. Wells, D. V. Melnikov and M. E. Gracheva, Brownian dynamics of a neutral protein moving through a nanopore in an electrically biased membrane, J. Chem. Phys., 2019, 150(11), 115103 CrossRef PubMed.
- G. Mitscha-Baude, B. Stadlbauer, S. Howorka and C. Heitzinger, Protein transport through nanopores illuminated by long-time-scale simulations, ACS Nano, 2021, 15(6), 9900–9912 CrossRef PubMed.
- F. Weik, S. Kesselheim and C. Holm, A coarse-grained dna model for the prediction of current signals in dna translocation experiments, J. Chem. Phys., 2016, 145(19), 194106 CrossRef PubMed.
- R. D. Coalson and M. G. Kurnikova, Poisson – Nernst – Planck theory approach to the calculation of current through biological ion channels, IEEE Trans. Nanobiosci., 2005, 4(1), 81–93 CrossRef PubMed.
- B. Roux, T. Allen, S. Berneche and W. Im, Theoretical and computational models of biological ion channels, Quart. Rev. Biophys., 2004, 37(1), 15–103 CrossRef CAS PubMed.
- J. Comer and A. Aksimentiev, Predicting the DNA sequence dependence of nanopore ion current using atomic-resolution Brownian dynamics, J. Phys. Chem. C, 2012, 116(5), 3376–3393 CrossRef CAS PubMed.
- C. J. F. Solano, J. D. Prajapati, K. R. Pothula and U. Kleinekathöfer, Brownian dynamics approach including explicit atoms for studying ion permeation and substrate translocation across nanopores, J. Chem. Theory Comput., 2018, 14(12), 6701–6713 CrossRef CAS.
- J. Wilson, K. Sarthak, W. Si, L. Gao and A. Aksimentiev, Rapid and accurate determination of nanopore ionic current using a steric exclusion model, ACS Sens., 2019, 4(3), 634–644 CrossRef CAS PubMed.
- K. Szuttor, F. Weik, J.-N. Grad and C. Holm, Modeling the current modulation of bundled dna structures in nanopores, J. Chem. Phys., 2021, 154(5), 054901 CrossRef CAS.
- W. Yang, B. Radha, A. Choudhary, Y. You, G. Mettela, A. K. Geim, A. Aksimentiev, A. Keerthi and C. Dekker, Translocation of DNA through ultrathin nanoslits, Adv. Mater., 2021, 33(11), 2007682 CrossRef CAS PubMed.
- A. Choudhary, H. Joshi, H.-Y. Chou, K. Sarthak, J. Wilson, C. Maffeo and A. Aksimentiev, High-fidelity capture, threading, and infinite-depth sequencing of single DNA molecules with a double-nanopore system, ACS Nano, 2020, 14(11), 15566–15576 CrossRef PubMed.
- K. Chen, J. Zhu, F. Bošković and U. F. Keyser., Nanopore-based DNA hard drives for rewritable and secure data storage, Nano Lett., 2020, 20(5), 3754–3760 CrossRef CAS PubMed.
- C. Maffeo and A. Aksimentiev., MrDNA: A multi-resolution model for predicting the structure and dynamics of DNA systems, Nucleic Acids Res., 2020, 48(9), 5135–5146 CrossRef CAS PubMed.
- M. Belkin and A. Aksimentiev, Molecular dynamics simulation of DNA capture and transport in heated nanopores, ACS Appl. Mater. Interfaces, 2016, 8(20), 12599–12608 CrossRef CAS PubMed.
- U. F. Keyser, B. N. Koeleman, S. van Dorp, D. Krapf, R. M. M. Smeets, S. G. Lemay, N. H. Dekker and C. Dekker, Direct force measurements on DNA in a solid-state nanopore, Nat. Phys., 2006, 2, 473–477 Search PubMed.
- B. Luan and A. Aksimentiev, Electro-osmotic screening of the DNA charge in a nanopore, Phys. Rev. E: Stat., Nonlinear, Soft Matter Phys., 2008, 78, 021912 CrossRef PubMed.
- A. J. Storm, J. H. Chen, H. W. Zandbergen and C. Dekker, Translocation of double-strand DNA through a silicon oxide nanopore, Phys. Rev. E: Stat., Nonlinear, Soft Matter Phys., 2005, 71, 051903 CrossRef CAS PubMed.
- S. Pud, S.-H. Chao, M. Belkin, D. Verschueren, T. Huijben, C. van Engelenburg, C. Dekker and A. Aksimentiev, Mechanical trapping of DNA in a double-nanopore system, Nano Lett., 2016, 16(12), 8021–8028 CrossRef CAS PubMed.
- R. Zwanzig, Diffusion in a rough potential, Proc. Natl. Acad. Sci. U. S. A., 1988, 85(7), 2029–2030 CrossRef CAS PubMed.
- R. M. M. Smeets, U. F. Keyser, N. H. Dekker and C. Dekker, Noise in solid-state nanopores, Proc. Natl. Acad. Sci. U. S. A., 2008, 105(2), 417–421 CrossRef CAS PubMed.
- S. Bhattacharya, J. Yoo and A. Aksimentiev, Water mediates recognition of DNA sequence via ionic current blockade in a biological nanopore, ACS Nano, 2016, 10(4), 4644–4651 CrossRef CAS PubMed.
- A. Keerthi, A. K. Geim, A. Janardanan, A. P. Rooney, A. Esfandiar, S. Hu, S. A. Dar, I. V. Grigorieva, S. J. Haigh, F. C. Wang and B. Radha, Ballistic molecular transport through two-dimensional channels, Nature, 2018, 558, 420–424 CrossRef CAS PubMed.
- C. Maffeo, T. T. M. Ngo, T. Ha and A. Aksimentiev, A coarse-grained model of unstructured single-stranded DNA derived from atomistic simulation and single-molecule experiment, J. Chem. Theory Comput., 2014, 10, 2891–2896 CrossRef CAS PubMed.
- K. Venta, G. Shemer, M. Puster, J. A. Rodriguez-Manzo, A. Balan, J. K. Rosenstein, K. Shepard and M. Drndic, Differentiation of short, single-stranded DNA homopolymers in solid-state nanopores, ACS Nano, 2013, 7, 4629–4636 CrossRef CAS PubMed.
- P. Cadinu, B. P. Nadappuram, D. J. Lee, J. Y. Y. Sze, G. Campolo, Y. Zhang, A. Shevchuk, S. Ladame, T. Albrecht, Y. Korchev, A. P. Ivanov and J. B. Edel, Single molecule trapping and sensing using dual nanopores separated by a zeptoliter nanobridge, Nano Lett., 2017, 17(10), 6376–6384 CrossRef CAS PubMed.
- Y. N. Zhang, X. Liu, Y. A. Zhao, J. K. Yu, W. Reisner and W. B. Dunbar, Single molecule DNA resensing using a two-pore device, Small, 2018, 14, 1801890 CrossRef PubMed.
- A. Bhattacharya and S. Seth, Tug of war in a double-nanopore system, Phys. Rev. E, 2020, 101, 052407 CrossRef CAS PubMed.
- M. Belkin, C. Maffeo, D. B. Wells and A. Aksimentiev, Stretching and controlled motion of single-stranded DNA in locally heated solid-state nanopores, ACS Nano, 2013, 7(8), 6816–6824 CrossRef CAS PubMed.
- L. Ceze, J. Nivala and K. Strauss, Molecular digital data storage using DNA, Nat. Rev. Genet., 2019, 20(8), 456–466 CrossRef CAS PubMed.
- S. M. Douglas, A. H. Marblestone, S. Teerapittayanon, A. Vazquez, G. M. Church and W. M. Shih, Rapid prototyping of 3D DNA-origami shapes with caDNAno, Nucleic Acids Res., 2009, 37(15), 5001–5006 CrossRef CAS PubMed.
- M. Raveendran, A. J. Lee, C. Wälti and P. Actis, Analysis of 2D DNA origami with nanopipettes, ChemElectroChem, 2018, 5(20), 3014–3020 CrossRef CAS.
- C. Maffeo, R. Schöpflin, H. Brutzer, R. Stehr, A. Aksimentiev, G. Wedemann and R. Seidel, DNA–DNA interactions in tight supercoils are described by a small effective charge density, Phys. Rev. Lett., 2010, 105(15), 158101 CrossRef PubMed.
- L. J. Steinbock, S. Krishnan, R. D. Bulushev, S. Borgeaud, M. Blokesch, L. Feletti and A. Radenovic, Probing the size of proteins with glass nanopores, Nanoscale, 2014, 6(23), 14380–14387 RSC.
- W. Li, N. A. W. Bell, S. Hernández-Ainsa, V. V. Thacker, A. M. Thackray, R. Bujdoso and U. F. Keyser, Single protein molecule detection by glass nanopores, ACS Nano, 2013, 7(5), 4129–4134 CrossRef CAS PubMed.
- E. Hemmig, C. Fitzgerald, C. Maffeo, L. Hecker, S. Ochmann, A. Aksimentiev, P. Tinnefeld and U. Keyser, Optical voltage sensing using DNA origami, Nano Lett., 2018, 18(3), 1962–1971 CrossRef CAS PubMed.
- V. Wang, N. Ermann and U. F. Keyser, Current enhancement in solid-state nanopores depends on three-dimensional dna structure, Nano Lett., 2019, 19(8), 5661–5666 CrossRef CAS PubMed.
- S. Carson, J. Wilson, A. Aksimentiev and M. Wanunu., Smooth DNA transport through a narrowed pore geometry, Biophys. J., 2014, 107, 2381–2393 CrossRef CAS PubMed.
- M. Kuron, G. Rempfer, F. Schornbaum, M. Bauer, C. Godenschwager, C. Holm and J. de Graaf, Moving charged particles in lattice Boltzmann-based electrokinetics, J. Chem. Phys., 2016, 145(21), 214102 CrossRef PubMed.
- S. W. Kowalczyk, D. B. Wells, A. Aksimentiev and C. Dekker, Slowing down DNA translocation through a nanopore in lithium chloride, Nano Lett., 2012, 12(2), 1038–1044 CrossRef CAS PubMed.
- R. Carr, J. Comer, M. D. Ginsberg and A. Aksimentiev, Microscopic perspective on the adsorption isotherm of a heterogeneous surface, J. Phys. Chem. Lett., 2011, 2, 1804–1807 CrossRef CAS PubMed.
- B. E. K. Snodin, F. Randisi, M. Mosayebi, P. Šulc, J. S. Schreck, F. Romano, T. E. Ouldridge, R. Tsukanov, E. Nir, A. A. Louis and J. P. Doye, Introducing improved structural properties and salt dependence into a coarse-grained model of DNA, J. Chem. Phys., 2015, 142(23), 234901 CrossRef PubMed.
- D. M. Hinckley, G. S. Freeman, J. K. Whitmer and J. J. de Pablo, An experimentally-informed coarse-grained 3-site-per-nucleotide model of DNA: Structure, thermodynamics, and dynamics of hybridization, J. Chem. Phys., 2013, 139(14), 144903 CrossRef PubMed.
Footnote |
| † Electronic supplementary information (ESI) available. See DOI: 10.1039/d1cp04589j |
| This journal is © the Owner Societies 2022 |