Nanostructuring and macroscopic behavior of type V deep eutectic solvents based on monoterpenoids†
Received
1st October 2021
, Accepted 8th December 2021
First published on 9th December 2021
Abstract
Type V natural deep eutectic solvents based on monoterpenoids (cineole, carvone, menthol, and thymol) are studied using a combined experimental and molecular modeling approach. The reported physicochemical properties showed low viscous fluids whose properties were characterized as a function of temperature. The theoretical study combining quantum chemistry and classical molecular dynamics simulations provided a nanoscopic characterization of the fluids, particularly for the hydrogen bonding network and its relationship with the macroscopic properties. The considered fluids constitute a suitable type of solvents considering their properties, cost, origin, and sustainability in different technological applications and sow the possibility of developing type V NADES from different types of molecules, especially in the terpenoid family of compounds.
1. Introduction
Deep Eutectic Solvents (DES) are a kind of multicomponent materials produced by the combination of Lewis and Brønsted acids and bases, which through the development of strong intermolecular forces, typically hydrogen bonding, between the mixture components leads to a large decrease of the melting point for the mixture in comparison with the separated, isolated components, thus leading to the materials being liquid at close to ambient temperature conditions.1 Since the initial proposal of DES by Abbot et al.2 as a new kind of solvents for different applications,3 five different categories of DES (types I to V) have been considered according to the type of components involved in the development of the eutectic mixture.4–6 Types I, II, and III DES involve metal components and are of interest in several applications such as metal processing7 or electrochemical4 applications. Type IV DES are formed by the combination of a hydrogen bond acceptor (HBA), typically quaternary ammonium salts, and a hydrogen bond donor (HBD) at a particular HBA:HBD ratio (eutectic composition) that leads to melting point depression due to the development of a strong intermolecular hydrogen bonding interaction between the HBA and HBD8 Type V DES have been recently proposed by the combination of non-ionic HBA and HBD components.9 Likewise, DES may be classified according to their hydrophobic or hydrophilic character,10 considering the pivotal role of water content on the structure and properties of DES11,12 and the different possible applications of DES in terms of water content requirements.13 Additionally, DESs may be classified according to the origin of the DES components, Choi et al.14 proposed the development of DES-based on nature, thus using natural HBA:HBD combinations leading to the so-called Natural DES (NADES),15 which are characterized by their low cost, biodegradability, and non-toxicity, thus providing DES into a sustainable chemistry framework.16 Therefore, a large number of possible DES/NADES, their suitable environmental17 and toxicological properties,18 and their low cost,19 have driven a large attention on this type of materials for a large collection of applications in areas such as fossil fuels technologies,20 gas treatment,21 pharmaceutical,22 polymers,23 nanomaterials,24 electrochemical energy storage,25 lubrication26 or biotechnology,27 to mention some relevant ones.28
The most recent advances on DES have been developed considering type V ones.9 The non-ionic nature and the natural origin (many of them found in plants) of the type V DES components29 leads to fluids being suitable for different applications. Abranches et al.9 initially proposed the thymol + menthol in 1![[thin space (1/6-em)]](https://www.rsc.org/images/entities/char_2009.gif) :
:![[thin space (1/6-em)]](https://www.rsc.org/images/entities/char_2009.gif) 1 mole ratio as an archetypical type V NADES, in which the NADES formation was proposed to be produced by the different acidity of the hydroxyl groups in aromatic and aliphatic rings. Additional components for type V were proposed by Abranches et al.,9 such as coumarin (COU) or butylated hydroxytoluene with melting points slightly above the ambient temperature.9 Additional type V NADES were proposed by van Osch et al.30 considering menthol, thymol, or tetradecanol. The interest in these type V DES, specially menthol-based ones, have recently increased; thus, NADES such as MENTHOL–organic acids or menthol–fatty acids31–33 have been developed and considered for different technological applications such as the recovery of bio-based chemicals,34 liquid–liquid extraction,35 or biomolecules extraction.36 The physicochemical properties, such as non-ideality, as well as nanoscopic characterization using molecular dynamics simulations (MD), have been reported for menthol–thymol type V DES, showing a strong dependency on the DES properties and the temperature dependence of hydrogen bonding.37 Likewise, type V DES show suitable thermophysical properties such as low viscosity,38 which removes the drawbacks of many high viscous DES for heat or mass transfer operations.
1 mole ratio as an archetypical type V NADES, in which the NADES formation was proposed to be produced by the different acidity of the hydroxyl groups in aromatic and aliphatic rings. Additional components for type V were proposed by Abranches et al.,9 such as coumarin (COU) or butylated hydroxytoluene with melting points slightly above the ambient temperature.9 Additional type V NADES were proposed by van Osch et al.30 considering menthol, thymol, or tetradecanol. The interest in these type V DES, specially menthol-based ones, have recently increased; thus, NADES such as MENTHOL–organic acids or menthol–fatty acids31–33 have been developed and considered for different technological applications such as the recovery of bio-based chemicals,34 liquid–liquid extraction,35 or biomolecules extraction.36 The physicochemical properties, such as non-ideality, as well as nanoscopic characterization using molecular dynamics simulations (MD), have been reported for menthol–thymol type V DES, showing a strong dependency on the DES properties and the temperature dependence of hydrogen bonding.37 Likewise, type V DES show suitable thermophysical properties such as low viscosity,38 which removes the drawbacks of many high viscous DES for heat or mass transfer operations.
To continue with the advance on type V NADES, we report in this work a combined experimental and theoretical study on monoterpenoid-based NADES formed by the combination of cineole (as known as Eucalyptol) and carvone as HBAs and menthol or thymol as HBDs, Fig. 1. All of these components can be extracted from natural sources at low cost, and thus leading to sustainable and environmentally friendly DES.16 In this study, selected physicochemical properties were measured for the macroscopic characterization of the NADES, their potential applications as carbon dioxide capture agents, as well as a theoretical study combining quantum chemistry (Density Functional Theory, DFT) and MD methods to provide a nanoscopic characterization of the fluid paying particular attention to the hydrogen bonding structure in the NADES. Likewise, prediction of selected thermophysical properties using machine learning (ML) methods were carried out to develop predictive tools for type V NADES, which would allow in silico development of new fluids. The reported results provide a micro and macroscopic characterization of type V NADES allowing to infer the role of intermolecular forces as well to contribute to the development of rules for designing suitable DES involving non-ionic species. The considered approach for the characterization of the considered NADES is summarized in the flowchart reported in Fig. 2.
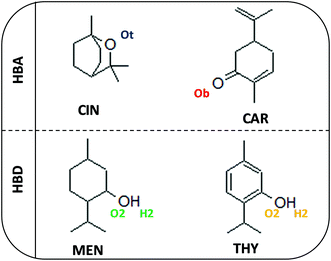 |
| | Fig. 1 Molecular structures of compounds used in this work for the considered DES (HBA:HBD combinations). | |
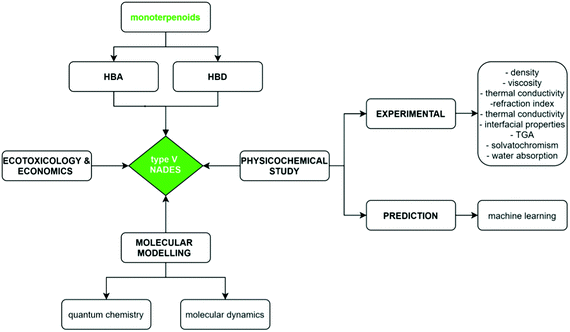 |
| | Fig. 2 Flowchart of the methodology used in this work for the considered type V monoterpenoid – based NADES. | |
2. Materials and methods
2.1 Chemicals
The pure chemicals were obtained from commercial sources with purities as reported in Table S1 (ESI†). The NADES were prepared from pure components at the considered HBA:HBD mole ratios by weighing (Mettler AT261 balance, ±1 × 10⁻⁵ g) and heating under stirring to 60 °C. Upon liquid phase formation, samples were cooled to ambient temperature, where they remained in a liquid state for several weeks without the formation of any solid phase. Six different HBA![[thin space (1/6-em)]](https://www.rsc.org/images/entities/char_2009.gif) :
:![[thin space (1/6-em)]](https://www.rsc.org/images/entities/char_2009.gif) HBD mole ratios were considered (2.5
HBD mole ratios were considered (2.5![[thin space (1/6-em)]](https://www.rsc.org/images/entities/char_2009.gif) :
:![[thin space (1/6-em)]](https://www.rsc.org/images/entities/char_2009.gif) 1, 2
1, 2![[thin space (1/6-em)]](https://www.rsc.org/images/entities/char_2009.gif) :
:![[thin space (1/6-em)]](https://www.rsc.org/images/entities/char_2009.gif) 1, 1.5
1, 1.5![[thin space (1/6-em)]](https://www.rsc.org/images/entities/char_2009.gif) :
:![[thin space (1/6-em)]](https://www.rsc.org/images/entities/char_2009.gif) 1, 1
1, 1![[thin space (1/6-em)]](https://www.rsc.org/images/entities/char_2009.gif) :
:![[thin space (1/6-em)]](https://www.rsc.org/images/entities/char_2009.gif) 1, 1
1, 1![[thin space (1/6-em)]](https://www.rsc.org/images/entities/char_2009.gif) :
:![[thin space (1/6-em)]](https://www.rsc.org/images/entities/char_2009.gif) 1.5, 1
1.5, 1![[thin space (1/6-em)]](https://www.rsc.org/images/entities/char_2009.gif) :
:![[thin space (1/6-em)]](https://www.rsc.org/images/entities/char_2009.gif) 2, and 1
2, and 1![[thin space (1/6-em)]](https://www.rsc.org/images/entities/char_2009.gif) :
:![[thin space (1/6-em)]](https://www.rsc.org/images/entities/char_2009.gif) 2.5) to check if they remain in the liquid state, although the study was centered around the eutectic composition, which is produced at 1
2.5) to check if they remain in the liquid state, although the study was centered around the eutectic composition, which is produced at 1![[thin space (1/6-em)]](https://www.rsc.org/images/entities/char_2009.gif) :
:![[thin space (1/6-em)]](https://www.rsc.org/images/entities/char_2009.gif) 1 mole ratio. After preparation, samples were dried under vacuum using a Heidolph rotary evaporator at 40 °C. The water content was measured using Karl–Fischer coulometric titrator (Metrohm 831 KF coulometer, ±0.3%). The water content for the 1
1 mole ratio. After preparation, samples were dried under vacuum using a Heidolph rotary evaporator at 40 °C. The water content was measured using Karl–Fischer coulometric titrator (Metrohm 831 KF coulometer, ±0.3%). The water content for the 1![[thin space (1/6-em)]](https://www.rsc.org/images/entities/char_2009.gif) :
:![[thin space (1/6-em)]](https://www.rsc.org/images/entities/char_2009.gif) 1 DES samples used along this work is reported in Table 1, showing low content. The samples after preparation were kept under vacuum to avoid any additional water absorption. The considered samples are reported in Fig. 3, colorless liquid samples in the studied concentration range for cineole:menthol and cineole:thymol DES, whereas pale yellow samples are obtained for carvone:menthol and carvone:thymol, because of the pale – yellowish color of carvone.
1 DES samples used along this work is reported in Table 1, showing low content. The samples after preparation were kept under vacuum to avoid any additional water absorption. The considered samples are reported in Fig. 3, colorless liquid samples in the studied concentration range for cineole:menthol and cineole:thymol DES, whereas pale yellow samples are obtained for carvone:menthol and carvone:thymol, because of the pale – yellowish color of carvone.
Table 1 Water content of the samples for the considered DES used for physicochemical properties measurements. (CAR = carvone, CIN = cineole, THY = thymol, MEN = menthol)
| DES |
Water content (wt%) |
CIN![[thin space (1/6-em)]](https://www.rsc.org/images/entities/char_2009.gif) : :![[thin space (1/6-em)]](https://www.rsc.org/images/entities/char_2009.gif) MEN (1 MEN (1![[thin space (1/6-em)]](https://www.rsc.org/images/entities/char_2009.gif) : :![[thin space (1/6-em)]](https://www.rsc.org/images/entities/char_2009.gif) 1) 1) |
0.06 |
CIN![[thin space (1/6-em)]](https://www.rsc.org/images/entities/char_2009.gif) : :![[thin space (1/6-em)]](https://www.rsc.org/images/entities/char_2009.gif) THY (1 THY (1![[thin space (1/6-em)]](https://www.rsc.org/images/entities/char_2009.gif) : :![[thin space (1/6-em)]](https://www.rsc.org/images/entities/char_2009.gif) 1) 1) |
0.11 |
CAR![[thin space (1/6-em)]](https://www.rsc.org/images/entities/char_2009.gif) : :![[thin space (1/6-em)]](https://www.rsc.org/images/entities/char_2009.gif) MEN (1 MEN (1![[thin space (1/6-em)]](https://www.rsc.org/images/entities/char_2009.gif) : :![[thin space (1/6-em)]](https://www.rsc.org/images/entities/char_2009.gif) 1) 1) |
0.25 |
CAR![[thin space (1/6-em)]](https://www.rsc.org/images/entities/char_2009.gif) : :![[thin space (1/6-em)]](https://www.rsc.org/images/entities/char_2009.gif) THY (1 THY (1![[thin space (1/6-em)]](https://www.rsc.org/images/entities/char_2009.gif) : :![[thin space (1/6-em)]](https://www.rsc.org/images/entities/char_2009.gif) 1) 1) |
0.10 |
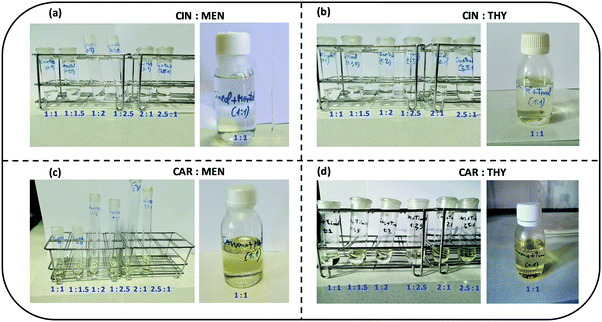 |
| | Fig. 3 Pictures of the samples considered in this for the studied DES at i:j mole ratios. Small samples for studying the i:j mole ratio effect are reported as well as the large samples for 1![[thin space (1/6-em)]](https://www.rsc.org/images/entities/char_2009.gif) : :![[thin space (1/6-em)]](https://www.rsc.org/images/entities/char_2009.gif) 1 mole ratios use for the physicochemical characterization. All the studied i:j mole ratios led to liquid DES at 293 K (temperature for which the pictures were obtained). 1 mole ratios use for the physicochemical characterization. All the studied i:j mole ratios led to liquid DES at 293 K (temperature for which the pictures were obtained). | |
2.2 Experimental procedure
Despite the low water content of the considered NADES, low hydrophilicity, the absorption of water from atmospheric humidity was studied in this work. For this purpose, 15 cm3 of each NADES were placed in Petri dishes (90 mm of diameter), with 25.5 cm2 of liquid surface exposed to air. Some sample specimens (0.01 g) were used to determine the water content by using the Karl–Fischer coulometer. The atmospheric relative humidity during these experiments was 50 ± 5%. The kinetics of water adsorption was fitted to:| | | mw = m∞w(1 − exp(−kt)) | (1) |
where mcwater stands for the water content (wt%), m∞water is the limiting absorption value, and k is the constant for an absorption rate.
Four relevant thermophysical properties were selected (density, shear viscosity, thermal conductivity, refractive index, contact angle, and surface tension) and measured at ambient pressure as a function of temperature. Density (ρ, uncertainty ±1 × 10⁻⁴ g cm−3) was measured with an Anton Paar DMA1001 vibrating tube densimeter, the cell temperature is controlled by a built-in internal Peltier to ±0.01 K. Shear viscosity (η, uncertainty ±2%) was measured using an electromagnetic VINCI Tech EV1000 viscometer39 with the cell temperature being controlled by an external circulating bath (Julabo Presto) and measured inside the measuring cell with platinum resistance thermometer (PRT, ±0.01 K). The obtained η values a as a function of temperature followed a non-Arrhenius behavior, and thus, they were fitted to Vogel–Fulcher–Taman (VFT) equation:
| |  | (2) |
The refractive index (sodium D-line,
nD, uncertainty ±1 × 10
−5) was measured with a Leica AR600 refractometer, the cell temperature controlled with an external circulator (Julabo F32), and measured to ±0.01 K with a PRT. The experimental
nD was used to calculate the molar free volume,
fm,
40 to ±0.1 cm
3 mol
−1. Thermal conductivity (
σ, 5% uncertainty) was measured with a Decagon devices KD2 Thermal analyzer (KS-1 sensor, 6 cm long, 1.3 mm diameter single needle), the temperature-controlled using a Julabo F32 bath and measured with a PRT (±0.01 K). The properties measured in this work are reported in Table S2 (ESI
†).
To characterize the polarity of the NADES, solvatochromic measurements were carried using Reichardt's dye (Sigma-Aldrich, 90% purity). Measurements on 1 × 10⁻⁴ M dye solutions were done in a LanTechnics UV-18 spectrophotometer (±0.5 nm) with the cell temperature-controlled and measured through a Peltier (±0.1 K). Reichardt's normalized solvatochromic parameter, ENT, was calculated from the maximum wavelength of the obtained spectra.
Contact angle measurements were carried out on glass, copper, stainless steel 304, and 316 via First Ten Angstroms Dynamic Contact Angle Analyzer FTA200 with a standard deviation of 1°. The surface tension data on the studied DES were collected via SensaDyneSurface Tensiometer apparatus with a standard deviation of 0.5 dyn cm−1. Both surface tension and contact angle measurements were carried out at ambient conditions (293.15 K and 1 atm). The glass and metal sheets were cleaned with acetone and dried prior to measurements.
2.3 Prediction of selected thermophysical properties by machine learning methods
ML methods were applied for the prediction of density and dynamic viscosity. These properties were selected considering their relevance and the availability of a suitable number of experimental data for type V NADES, which can be used for training the developed models. Other relevant properties (e.g., melting points, refraction, indices, or vaporization enthalpies), which are of relevance for basic and applied purposes, cannot be considered at this stage because the available experimental data for type V NADES are still very scarce, and few types of HBAs/HBDs are considered. Therefore, ML method for density and viscosity prediction in type V NADES were considered in this work. A database from the available literature for type V NADES was built (ESI†_DATABASE_ML, ESI†). The considered density data are in the 288.15 to 358.15 K temperature range and 0.8 to 1.1 g cm−3 density range. For viscosity, the database considers data in the 293.15 to 353.15 K temperature range and 2.0 to 370 mPa s viscosity range. For both properties, 46 different HBAs/HBDs were considered and obtained from the available literature and used for training purposes. For the development of predictive models for the selected properties, 3D inductive molecular descriptors by Cherkasov41 were considered, which were calculated from optimized structures of isolated molecules, using DFT at BP86/def-TZVP theoretical level in TmoleX,42 with the Online Chemical Database (OCHEM) Descriptors Calculator.43 Additionally, HOMO–LUMO gaps for each compound were calculated from DFT optimized structures. Therefore 55 molecular descriptors were considered for each HBA/HBD (ESI†). The database with physicochemical properties from the literature and calculated molecular descriptors were used for training the developed models, and these trained models were used for pure predictive purposes for the type V NADES considered in this work (cineole:menthol, cineole:thymol, carvone:menthol, carvone:thymol) and compared with experimental data (Table S2, ESI†). All the ML calculations were carried out using MATLAB. Different ML methods were considered, including (i) linear regressions, (ii) regression trees, (iii) Support Vector Machines (SVM), (iv) Gaussian Process Regression (GPR), and (v) ensembles of trees, with the model leading to the lower Root Mean Square Error (RMSE) being selected for predicting properties of type V NADES considered in this work.
2.4 Molecular modeling
The prediction of relevant phase equilibria properties in the studied NADES were carried out with the COnductor-like Screening MOdel for Real Solvents (COSMO-RS), which has been previously proven to be suitable for this purpose in several types of DES.44,45 Calculations were carried out with the COSMOtherm software (version 2021 – 21.0). For COSMO-RS calculations, COSMO files for the isolated molecules (HBAs and HBDs) were obtained from optimized structures calculated at BP86/def-TZVP DFT theoretical level as in Turbomole software (TmoleX 2021). COSMO files for isolated DES components were combined in COSMOtherm software in the required HBA:HBD ratios.
The properties of the considered NADES were studied at the short-range hydrogen bonding by studying minimal HBA![[thin space (1/6-em)]](https://www.rsc.org/images/entities/char_2009.gif) :
:![[thin space (1/6-em)]](https://www.rsc.org/images/entities/char_2009.gif) HBD clusters at i
HBD clusters at i![[thin space (1/6-em)]](https://www.rsc.org/images/entities/char_2009.gif) :
:![[thin space (1/6-em)]](https://www.rsc.org/images/entities/char_2009.gif) j ratio. These clusters were geometrically optimized with the ORCA program46 using the B3LYP47–49 functional combined with 6-311++G(d,p) basis set and D350 dispersion contribution (semiempirical Grimme's method). The topological characterization of these clusters was done according to the Quantum Theory of Atoms in Molecule (QTAIM51) as in the MultiWFN software.52 Hydrogen bonding is characterized by the developed bond critical points (BCPs) at the interaction region. Likewise, the strength of the interactions was quantified with the interaction energies, ΔE, calculated as the difference between the total energy of the cluster minus those of the corresponding monomers, corrected according to the counterpoise method.53 The ChelpG method54 was used to calculate the atomic charges.
j ratio. These clusters were geometrically optimized with the ORCA program46 using the B3LYP47–49 functional combined with 6-311++G(d,p) basis set and D350 dispersion contribution (semiempirical Grimme's method). The topological characterization of these clusters was done according to the Quantum Theory of Atoms in Molecule (QTAIM51) as in the MultiWFN software.52 Hydrogen bonding is characterized by the developed bond critical points (BCPs) at the interaction region. Likewise, the strength of the interactions was quantified with the interaction energies, ΔE, calculated as the difference between the total energy of the cluster minus those of the corresponding monomers, corrected according to the counterpoise method.53 The ChelpG method54 was used to calculate the atomic charges.
Classical MD simulations were carried out using the MDynaMix v.5.255 software for systems at pressures and temperatures as reported in Table S3 (ESI†) and for the forcefields included in Table S4 (ESI†). Force field parameters were obtained from the SwissParam database (Merck Molecular Force Field56) with atomic charges obtained from ChelpG – DFT optimized structures for independent monomers (HBAs and HBDs). The systems used for simulations considered simulation boxes as built with Packmol.57 Simulations were carried out using periodic boundary conditions in the three space directions. MD simulations were carried out in three steps consecutive procedure: (i) 1 ns NVT simulations at 303 K, (ii) 10 ns NPT equilibration step, at each selected pressure–temperature condition, and (iii) 50 ns NPT production simulations at each selected pressure–temperature condition. The equilibration was assured by monitoring the time evolution of total potential energy as well as for selected properties such as density. Nevertheless, the low viscosity of the considered NADES (Table S2, ESI†) assured proper evolution of the simulations in the considered simulation time. The systems pressure and temperature were controlled with the Nose–Hoover method,58 with 30 and 1000 ps as temperature and pressure coupling times, respectively. The Tuckerman–Berne double-time step algorithm (with long- and short-time steps of 1 and 0.1 fs) was applied for solving the equations of motion. Coulombic interactions were treated with the Ewald summation method (1.5 nm cut-off radius).59 Intermolecular interactions were described with the Lennard-Jones potential with 15 Å cut-off distance and Lorentz–Berthelot mixing rules for cross terms.
The considered HBAs and HBDs are of natural origin, with low toxicity and suitable biodegradability. Nevertheless, the ecotoxicological properties of the considered NADES were predicted in this work using the ADMETSTAR 2.0 software tool.60 The input file requires the optimized geometry of the compound from DFT simulations, and Simplified Molecular Input Line Entry System (SMILES) data input format is created from the optimized structures of each system and used as input files for the ecotoxicological predictions. SMILES for the NADES were created for the structures of each system and used as input files for the ecotoxicological predictions. ADMETSTAR predictor software is a machine learning-based software tool that is used to obtain quick estimates and predictions on various parameters, including cytotoxicity, solubility, log![[thin space (1/6-em)]](https://www.rsc.org/images/entities/char_2009.gif) P, pKa, and some other relevant properties. The prediction software uses quantitative structure–activity relationship and quantitative method providing a mathematical relationship approaches to obtain predictions. The input file requires the optimized geometry of the compound from DFT simulations, and Simplified Molecular Input Line Entry System (SMILES) data input format is created from the optimized structures of each system and used as input files for the ecotoxicological predictions.
P, pKa, and some other relevant properties. The prediction software uses quantitative structure–activity relationship and quantitative method providing a mathematical relationship approaches to obtain predictions. The input file requires the optimized geometry of the compound from DFT simulations, and Simplified Molecular Input Line Entry System (SMILES) data input format is created from the optimized structures of each system and used as input files for the ecotoxicological predictions.
3. Results and discussion
3.1 Predicted ecotoxicological properties
The ecotoxicological properties of the considered type V NADES should be mainly originated in those for the involved HBAs and HBDs. The considered HBAs are safe substances. For example, cineole is widely used in the food industry and medicine with extremely large doses required for acute toxic effects,61 and for carvone, its regular use as a food additive allows to consider it also as a safe substance.62 For the HBDs, menthol is considered a safe compound, with extremely high doses required for fatal effects,63 and thus fatalities are rarely reported for this compound.64 In the case of thymol, the FDA also recognizes this substance as safe,65 although some cases of toxicity have been reported.66 The relevant predicted ecotoxicological properties for the four studied type V NADES are reported in Table 2. The reported NADES show neither carcinogenicity nor mutagenesis effect; likewise, they are not toxic via oral ingestion. The only relevant effect on human health may arise from eye contact. These fluids are also biodegradable, and the only relevant environmental effect rises from a certain fish aquatic toxicity, which may be related to their water solubility. Nevertheless, we may conclude that these NADES are safe both for humans and the environment. The low toxicity levels for these NADES are related to the selection of HBA and HBD components, the development of additional hydrogen bonding for the formation of the NADES does not lead to any substantial increase in the ecotoxicity, thus as for the HBAs/HBDs involved, the NADES may also be considered as safe substances.
Table 2
In silico predicted ecotoxicological properties for the NADES systems studied in this work. (−) indicates nontoxic, (+) indicates toxic, (III) for acute oral toxicity indicates slightly toxic, {} values indicate the probability for each property. (+1 the most toxic and −1 least toxic nature, color coding indicates red more toxic, green more non-toxic). (CAR = carvone, CIN = cineole, THY = thymol, MEN = menthol)
| Property |
CIN![[thin space (1/6-em)]](https://www.rsc.org/images/entities/char_2009.gif) : :![[thin space (1/6-em)]](https://www.rsc.org/images/entities/char_2009.gif) MEN (1 MEN (1![[thin space (1/6-em)]](https://www.rsc.org/images/entities/char_2009.gif) : :![[thin space (1/6-em)]](https://www.rsc.org/images/entities/char_2009.gif) 1) 1) |
CIN![[thin space (1/6-em)]](https://www.rsc.org/images/entities/char_2009.gif) : :![[thin space (1/6-em)]](https://www.rsc.org/images/entities/char_2009.gif) THY (1 THY (1![[thin space (1/6-em)]](https://www.rsc.org/images/entities/char_2009.gif) : :![[thin space (1/6-em)]](https://www.rsc.org/images/entities/char_2009.gif) 1) 1) |
CAR![[thin space (1/6-em)]](https://www.rsc.org/images/entities/char_2009.gif) : :![[thin space (1/6-em)]](https://www.rsc.org/images/entities/char_2009.gif) MEN (1 MEN (1![[thin space (1/6-em)]](https://www.rsc.org/images/entities/char_2009.gif) : :![[thin space (1/6-em)]](https://www.rsc.org/images/entities/char_2009.gif) 1) 1) |
CAR![[thin space (1/6-em)]](https://www.rsc.org/images/entities/char_2009.gif) : :![[thin space (1/6-em)]](https://www.rsc.org/images/entities/char_2009.gif) THY (1 THY (1![[thin space (1/6-em)]](https://www.rsc.org/images/entities/char_2009.gif) : :![[thin space (1/6-em)]](https://www.rsc.org/images/entities/char_2009.gif) 1) 1) |
| Carcinogenicity |
(−) {0.9429} |
(−) {0.8143} |
(−) {0.9571} |
(−) {0.9143} |
| Eye irritation |
(+) {0.8997}
|
(+) {0.9243}
|
(+) {0.9395}
|
(+) {0.9714}
|
| Ames mutagenesis |
(−) {0.9000} |
(−) {0.8800} |
(−) {0.8800} |
(−) {0.8900} |
| Biodegradation |
(−) {0.8750} |
(−) {0.7500} |
(−) {0.7000} |
(−) {0.7250} |
| Crustacea aquatic toxicity |
(−) {0.6300} |
(+) {0.5900}
|
(−) {0.6300} |
(−) {0.5700} |
| Fish aquatic toxicity |
(+) {0.7722}
|
(+) {0.9561}
|
(+) {0.9935}
|
(+) {0.9972}
|
| Acute oral toxicity |
(III) {0.7953} |
(III) {0.7599} |
(III) {0.7156} |
(III) {0.8192} |
Water solubility (log![[thin space (1/6-em)]](https://www.rsc.org/images/entities/char_2009.gif) S) S) |
−3.211 |
−3.807 |
−3.821 |
−4.348 |
3.2 Economics
The development of new fluids such as those considered in this work requires a clarification of their origin and cost, which would allow on one side to infer the sustainability of any chemical processor technology based on these fluids as well as the possibility of realistic scaling up to industrial level considering the economy of the developed processes. The main characteristics of the involved HBAs and HBDs are summarized in Fig. 4. All these monoterpenoids can be extracted from natural sources considering different types of plants that contain large percentages of these compounds, and although some of them can also be synthesized considering different synthetic routes,67 their natural origin assures their sustainability. Likewise, the extraction of these monoterpenoids from their natural sources may be carried out using environmentally sustainable procedures, i.e., in the absence of volatile solvents, such as supercritical CO2 extraction.68 On the economics of these products, costs per kg reported in Fig. 4 are lower than 20$, which considering that the developed NADES can be prepared by a simple procedure of mixing and heating to mild conditions, support the conclusion of these NADES as low-cost sustainable fluids.
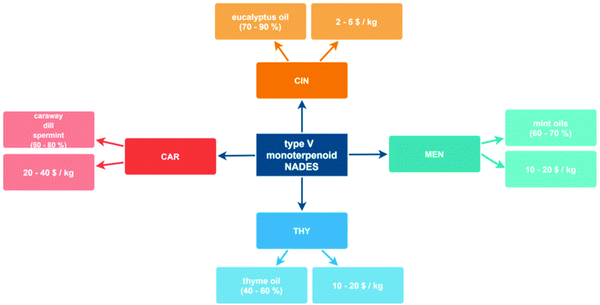 |
| | Fig. 4 Scheme of the possible natural sources and prices for HBA and HBD components leading to the NADES considered in this work. | |
3.3 Thermophysical properties
The experimental properties for the type V NADES considered in this work are reported in Table S2 (ESI†) as a function of temperature. The studied fluids are low density and low viscous fluids. It should be remarked that the largest viscosity is obtained for cineole:thymol at 293.15 K (25.1 mPa s), whereas the remaining NADES have viscosities lower than 10 mPa s even at ambient temperature, which is of great relevance for their possible application for heat and mass transfer operations.
Among the most important properties of NADES is the solid–liquid transition temperature (melting point). In the first stage, the four studied NADES were prepared at different HBA:HBD mole ratios, Fig. 3. All the prepared NADES were low viscous liquids at ambient temperature (293.15 K), remaining in the liquid state (no solid or turbidity formation) up to 10 weeks after their preparation. The prepared samples for the different mole ratios were cooled in a thermostatic bath up to 273.15 K, all of them remaining in liquid state for hours at this temperature, therefore confirming low melting point for all the possible HBA:HBD combinations, and thus having a large liquid window. Solid–Liquid equilibria (SLE) was predicted for the four studied NADES using the COSMO-RS method, which allowed to predict the eutectic composition and temperature, Fig. 5. The predicted eutectic compositions correspond close to 1![[thin space (1/6-em)]](https://www.rsc.org/images/entities/char_2009.gif) :
:![[thin space (1/6-em)]](https://www.rsc.org/images/entities/char_2009.gif) 1 HBA
1 HBA![[thin space (1/6-em)]](https://www.rsc.org/images/entities/char_2009.gif) :
:![[thin space (1/6-em)]](https://www.rsc.org/images/entities/char_2009.gif) HBD for cineole:thymol and carvone:thymol cases. Although the predictions for the eutectic compositions for cineole
HBD for cineole:thymol and carvone:thymol cases. Although the predictions for the eutectic compositions for cineole![[thin space (1/6-em)]](https://www.rsc.org/images/entities/char_2009.gif) :
:![[thin space (1/6-em)]](https://www.rsc.org/images/entities/char_2009.gif) menthol and carvone
menthol and carvone![[thin space (1/6-em)]](https://www.rsc.org/images/entities/char_2009.gif) :
:![[thin space (1/6-em)]](https://www.rsc.org/images/entities/char_2009.gif) thymol are close to 1
thymol are close to 1![[thin space (1/6-em)]](https://www.rsc.org/images/entities/char_2009.gif) :
:![[thin space (1/6-em)]](https://www.rsc.org/images/entities/char_2009.gif) 1.5, 1
1.5, 1![[thin space (1/6-em)]](https://www.rsc.org/images/entities/char_2009.gif) :
:![[thin space (1/6-em)]](https://www.rsc.org/images/entities/char_2009.gif) 1 molar mixing ratios in the lab has yielded eutectic solution, thus for all studied cases 1
1 molar mixing ratios in the lab has yielded eutectic solution, thus for all studied cases 1![[thin space (1/6-em)]](https://www.rsc.org/images/entities/char_2009.gif) :
:![[thin space (1/6-em)]](https://www.rsc.org/images/entities/char_2009.gif) 1 compositions have been considered for the experimental work. Regarding the predicted eutectic temperature, very low values are inferred for all the considered systems (especially for those containing thymol), thus confirming the wide liquid range for all the HBA:HBD compositions around the eutectic point.
1 compositions have been considered for the experimental work. Regarding the predicted eutectic temperature, very low values are inferred for all the considered systems (especially for those containing thymol), thus confirming the wide liquid range for all the HBA:HBD compositions around the eutectic point.
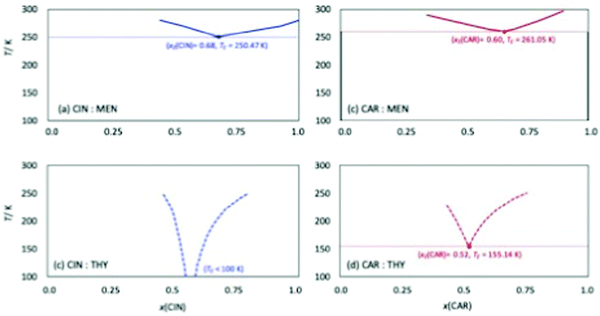 |
| | Fig. 5 Solid–liquid equilibria for the reported DES calculated form COSMO-RS. Parenthesized values show calculated eutectic point for each DES. Melting point for CAR, CIN, THY, MEN are 25.2 °C, 2.9 °C, 51 °C, and 38 °C respectively. | |
It is well known the water effect on DES structure and properties,69 and although the NADES considered in this work may be considered as hydrophobic (or poorly hydrophilic), the ability to absorb water from atmospheric humidity was studied, Fig. 6. Low water amounts were absorbed (lower than 0.5 wt% content upon 3 hours of exposition to atmosphere), with the largest values being obtained for carvone:menthol. In all the cases, the kinetics of the water absorption was successfully described according to eqn (1), with saturation being reached after 2–3 hours of exposition. Therefore, the studied NADES does not absorb large amounts of water. Thus they can be safely handled at atmospheric conditions without large changes in their properties, as it is well-known that this low water content (<0.5 wt%) maintains the most relevant DES features.70
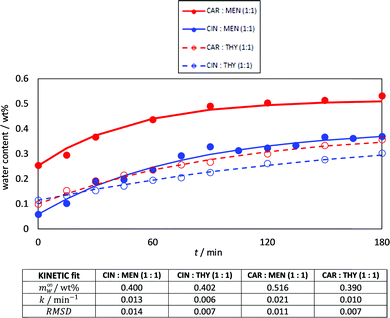 |
| | Fig. 6 Kinetics for atmospheric water absorption in the reported DES at 298 K. Lines show fitting to kinetic model, eqn (1), with the parameters reported at the bottom of the figure. | |
Density plays a pivotal role in engineering applications and design, and thus it was measured and reported in Fig. 7a as a function of temperature. Thymol-based NADES are denser than those based on menthol as HBDs, whereas those NADES with carvone are denser than those for cineole for a fixed HBD. The values of density for the studied type V NADES are in the 0.88 to 0.7 g cm−3 range. The analysis of the literature density data for type V DES, ESI†_DATABASE_ML (ESI†), shows most of the data in the 0.8 to 1.0 g cm−3 range; therefore, the comparison of density values for type V DES with those for type III (with densities usually larger than 1.1 g cm−3![[thin space (1/6-em)]](https://www.rsc.org/images/entities/char_2009.gif) 71) indicates that type V DES are less dense than type III ones. The temperature evolution of density follows a linear decrease which allowed the calculation of isobaric thermal expansion coefficient, αp, Fig. 7b. The αp values are in the 0.8 to 0.92 kK−1, which are larger than for most of the type III DES (usually lower than 0.8 kK−1).72–74
71) indicates that type V DES are less dense than type III ones. The temperature evolution of density follows a linear decrease which allowed the calculation of isobaric thermal expansion coefficient, αp, Fig. 7b. The αp values are in the 0.8 to 0.92 kK−1, which are larger than for most of the type III DES (usually lower than 0.8 kK−1).72–74
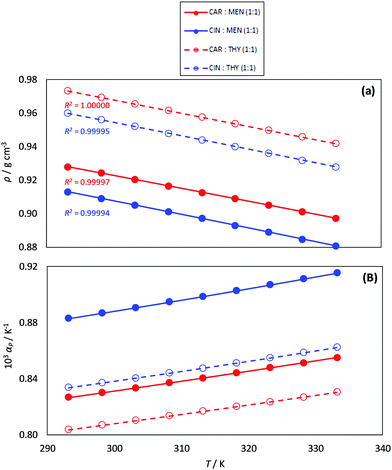 |
| | Fig. 7 Experimental (a) density, ρ, and (b) isobaric thermal expansion coefficient, αp, for the reported DES as a function of temperature. R2 coefficients for the linear fits of ρ vs. T are reported in panel (a). | |
The experimental nD is reported as well as the calculated fm, Fig. 8. The nD follows the same evolution with HBA and HBD type as density; therefore, the NADES with larger densities (carvone:thymol) led to the larger nD values. The temperature evolution of nD is also linear in the studied temperature range. Likewise, the calculated fm are larger for cineole:menthol, in agreement with the lower densities, than for the other considered NADES, and evolve in a linear composition with temperature. The fm values for the considered NADES are larger than for common type III DES, which points to less efficient molecular packings for type V DES in comparison with type III ones.75 This behavior can be explained considering the presence of strong coulombic forces within type III DES, leading to shorter intermolecular separations, thus to denser fluids.
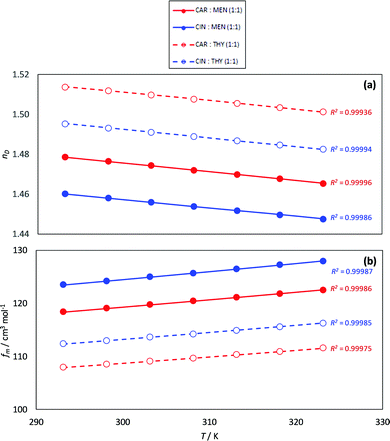 |
| | Fig. 8 Experimental (a) refractive index, nD, and (b) free volume, fm, for the reported DES as a function of temperature. R2 coefficients for the linear fits of (nD or fm) vs. T are reported in panels (a and b). | |
Viscosity is a thermophysical property of great relevance for practical purposes. One of the main disadvantages of some type III DES stand on their large viscosity (usually larger than 100 mPa s at close to ambient conditions76–78), which hinders some of their possible uses at a large industrial scale.76,79 The viscosity data reported in Fig. 9 show low viscous fluids, with the larger viscosity obtained for cineole:thymol, but being lower than 25 mPa s for all the considered NADES and temperatures. This low viscosity would allow a suitable application of the considered fluids for different technological applications without the need for equipment oversizing at an industrial scale, thus decreasing the costs of their application. The temperature evolution of viscosity follows a non-Arrhenius behavior for the four studied NADES, Fig. 9, and thus it was fitted to VFT model, eqn (2), with the fitting parameters reported in Fig. 9. The T0 parameters of the VFT fits, which is closely related to the glass transition temperature,80 are low, thus confirming the low melting point temperatures reported in Fig. 5. Thermal conductivity was also measured, Fig. 10, with larger values for carvone and thymol-containing systems, in agreement with density values, Fig. 7. The thermal conductivity data for the studied type III NADES are lower than for typical type III NADES, which use to show values above 0.2 W m−1 K−1.81,82
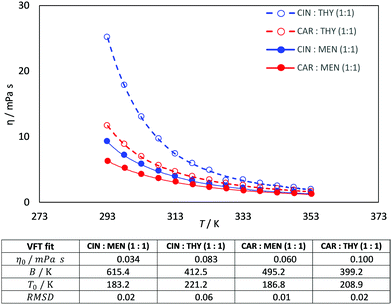 |
| | Fig. 9 Experimental dynamic viscosity, η, for the reported DES as a function of temperature. R2 coefficients for the linear fits of ρ vs. values in the table show the results of VFT fits. | |
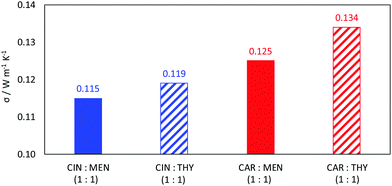 |
| | Fig. 10 Experimental thermal conductivity, σ, for reported DES at 298.15 K. | |
Surface tension and contact angle are important properties for characterizing the solvent's interfacial behavior at surfaces and are essential for designing separation applications. Surface tension and contact angle measurements for deep eutectic solvents are limited in literature, and they are mostly reported for commonly studied systems based on choline chloride (e.g., ChCl: urea, a.k.a. reline). Surface tension experimental data for studied NADES samples at ambient conditions are reported in Table 3 and Fig. 11. Results indicate the ranking of the experimented surface tension values can be ranked as carvone:thymol > cineole:thymol > carvone:menthol > cineole:menthol. The effect of thymol leads to higher values, whereas menthol lowers the surface tension values. Also, carvone has a more dominant effect compared to cineole in surface tension values. This behavior shows that thymol-based systems has larger cohesive energies than menthol-based systems and it can be explained with stronger HBD character of thymol. Typical viscous choline chloride-based DES have ∼47.5 dyn cm−1,83 terpene-based NADES have shown approximately 30–40% less surface tension values. This behavior leads to higher mobility and less resistance to penetration on the surfaces in separation applications. On the other hand, contact angle measurements are parallel with the surface tension findings. The results presented in Table 4 and Fig. 12 indicate the high wetting capability of the presented NADES systems. Similar to surface tension measurements, carvone and thymol, including cases, yielded higher contact angles compared to cineole and menthol including cases. Carvone-based systems showed higher contact angle values on stainless steel, especially on SS-304, and cineole-based systems had higher values on copper compared to glass and stainless steel.
Table 3 Surface tension (dyn cm−1) measurement on studied NADES samples. (CAR = carvone, CIN = cineole, THY = thymol, MEN = menthol)
| CIN:MEN |
CIN:THY |
CAR:MEN |
CAR:THY |
| 22.4 ± 0.5 |
29.6 ± 0.2 |
28.0 ± 0.7 |
31.3 ± 0.2 |
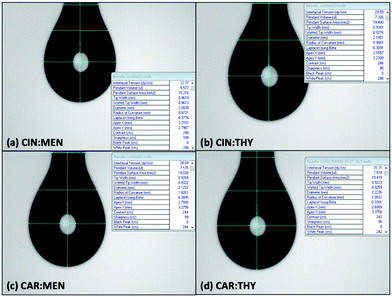 |
| | Fig. 11 Surface tension pendant drop measurement images. | |
Table 4 Contact angle measurements (degrees) of studied NADES samples on different surfaces. (CAR = carvone, CIN = cineole, THY = thymol, MEN = menthol)
| Compound |
Glass |
Copper |
SS-304 |
SS-316 |
| CAR:THY |
35.7 ± 2.7 |
28.5 ± 4.0 |
44.5 ± 3.2 |
43.4 ± 3.1 |
| CAR:MEN |
23.7 ± 2.1 |
24.9 ± 4.5 |
26.1 ± 4.7 |
21.1 ± 2.2 |
| CIN:THY |
31.2 ± 2.2 |
41.0 ± 3.3 |
37.2 ± 6.7 |
35.7 ± 3.5 |
| CIN:MEN |
22.1 ± 3.6 |
29.7 ± 5.5 |
26.1 ± 2.3 |
27.9 ± 3.1 |
 |
| | Fig. 12 Contact angle measurement images. | |
Finally, the polarity of the NADES was studied using ENT as reported in Fig. 13. Reichardt's polarity scale has been previously considered to study type III DES.84,85 The ENT values reported in Fig. 13 are lower than 0.5, which are lower than the typical values for type III DES (usually larger than 0.784,85). Carvone and thymol containing type III NADES led to larger ENT, thus leading to more polar NADES. Nevertheless, it may be concluded that the considered type V NADES are less polar than most of the common type III NADES.
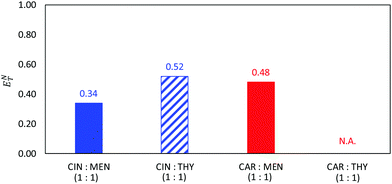 |
| | Fig. 13 Normalized Reichardt's polarity parameter, ENT, for the reported DES as at 298.15 K. ENT for CAR:THY was not possible to be measured. | |
3.4 Machine learning for density and viscosity prediction
Machine learning methods have been successfully applied for the correlation and prediction of DES physicochemical properties86 as well as DES applications.87 Nevertheless, ML methods have not been applied for the study of type V NADES as the ones considered in this work. Density was predicted using SVM methods, the training with the considered database (308 experimental data points) led to low RMSE (Fig. 14a), thus successful predictive ability was obtained, and although some outliers are obtained, the developed model is suitable considering the very different types of considered HBAs/HBDs. The developed SVM model was applied to the NADES studied in this work (cineole:menthol, cineole:thymol, carvone:menthol, and carvone:thymol), not included in the training set, showing excellent performance, Fig. 14b.
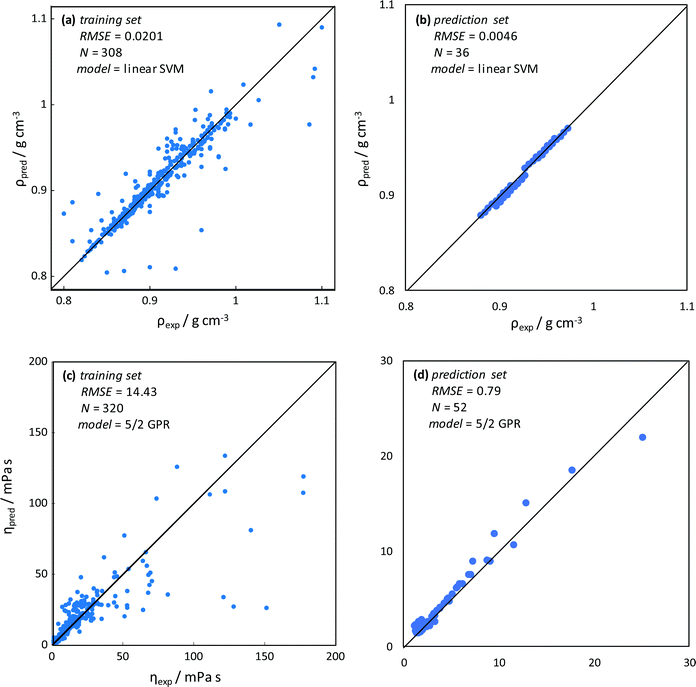 |
| | Fig. 14 Results of machine learning for density, ρ, and dynamic viscosity, η, prediction. Values predicted from the model (pred) and experimental (exp) data. Panels (a and c) show training sets with experimental data for type V DES from the literature (ESI†_DATABASE_ML, ESI†). Panels (b and d) show predictions using the developed models for CIN:MEN, CIN:THY, CAR:MEN and CAR:THY and comparison with data obtained in this work (Table S2, ESI†). RMSE (root mean square error), N (number of data points), SVM (Support Vector Machines), and GPR (Gaussian Process Regression). | |
In the case of viscosity, a 5/2 GPR model was selected, the considered training set led to reasonably low RMSE considering the large viscosity range, with the presence of some outliers (Fig. 14c). Most of the outliers appear for high viscosity, which can be caused because most of the considered database is for viscosity lower than 50 mPa s, with a small number of data points for larger viscosity, as type V NADES used to be low viscous fluids. Therefore, the high viscosity region in the database is poorly represented, thus leading to these outliers, which is not a relevant problem considering the low viscosity of the type V NADES as the ones considered in this work. The developed model was applied for the prediction of the viscosity in the NADES in this work, leading to excellent predictions (Fig. 14d). Therefore, the developed SVM and GPR ML models are suitable for the prediction of density and viscosity in the studied type V NADES.
3.5 Molecular modeling: DFT
Prior to building NADES structures, isolated HBA and HBD compounds geometries were optimized. This step was followed with the building of NADES structures via optimized HBAs and HBDs by placing them at various spatial positions around each other, considering O site(s) being the most dominating interaction focal point between the HBAs and HBDs. Compounds were built by Avogadro software,88 and DFT geometry optimizations were carried out with ORCA code. There was a total of 5 positions for cineole-based NADES cases, and 6 positions for carvone-based NADES cases were considered (Fig. S2, ESI†), and the most favorable NADES geometries were selected after identifying the minimum final optimized energies and maximum binding energy between the HBA and HBD. The final optimized NADES structures are provided in Fig. 15, and their binding energy values are also provided in Table 5. According to binding energy values, binding energies are ranked as carvone:thymol > cineole:thymol > carvone:menthol > cineole:menthol. Furthermore, the interaction energies could also lead to a discussion on the hydrogen bond donning capability within the NADES itself. Furthermore, interaction energies also show that thymol it is less prone to self-associate and its hydrogen bonding with the HBA is stronger that in the menthol-based systems. This observation is also in line with the observed higher cohesive energy behavior of thymol-based systems through the surface tension measurements.
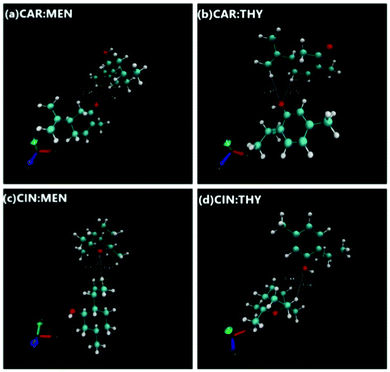 |
| | Fig. 15 Optimized NADES structure geometries. | |
Table 5 HBA and HBD binding energies for the optimized NADES geometries with smallest total energy. (CAR = carvone, CIN = cineole, THY = thymol, MEN = menthol)
| Compound |
DES/a.u. |
HBA/a.u. |
HBD/a.u. |
Binding energy/a.u. |
| CAR:THY |
929.082 |
464.523 |
464.557 |
0.001815 |
| CAR:MEN |
932.686 |
464.523 |
468.161 |
0.001139 |
| CIN:THY |
931.505 |
466.947 |
464.557 |
0.000366 |
| CIN:MEN |
935.109 |
466.947 |
468.161 |
−0.000004 |
Following the NADES structure optimization, a single CO2 molecule was placed around the selected NADES at multiple positions (6 positions in each case). Final optimized geometries of NADES + CO2 systems have been obtained via ORCA DFT calculations, and the interaction energies between the NADES and CO2 are calculated as shown in eqn (1), and the highest interaction energy cases were considered resembling the most vigorous interaction between the CO2 and NADES structures.
| | | Eint = ENADES+CO2 − (ECO2 + ENADES) | (3) |
Calculated interaction energies established between the NADES and CO
2 compounds are provided in
Table 6, with the highest binding energy cases highlighted with red fonts. As per the presented values in
Table 6 the highest binding energy cases are notes as [carvone]:[menthol] + CO
2_p04, [carvone]:[thymol] + CO
2_p05, [cineole]:[menthol] + CO
2_p02 and [cineole]:[thymol] + CO
2_p04. Further detailed quantum theory atom in a molecule (QTAIM) analysis were carried out over these specific cases. The main objective of carrying out the QTAIM analysis is to obtain the electronic properties of the molecular systems and enumerate the bonding characteristics and strength that are established between the HBA/HBD/CO
2 structures. To do this, electron charge density (
ρ) and Laplacian of the electron charge density function (∇
2ρ) are used to infer on deep examination of the interatomic interactions. As per the Popelier criteria,
89 intermolecular interactions are characterized as hydrogen bonding when the
ρ and ∇
2ρ at the specific bond critical point (BCP) fall within 0.002 to 0.04 a.u. and 0.020 to 0.139 a.u ranges, respectively. Higher these values lead to stronger H-bonding.
Fig. 16 shows the notable BCPs and their paths established between the HBA/HBD and NADES/CO
2 compounds. According to reported
ρ and ∇
2ρ values in
Table 7, the characteristics of CO
2 attraction with the NADES structures are driven based on the weak van der Waals type interactions. The highest ∇
2ρ values are highlighted with red font, and the ranking of the highest ∇
2ρ values at notable BCPs referring to CO
2 interactions are obtained to be carvone:thymol > cineole:thymol > carvone:menthol > cineole:menthol, which is overlapping with the trends observed in thermophysical properties and the NADES binding energies. Carvone and thymol lead to higher binding energies and stronger interactions with CO
2. The results presented in
Table 7 indicate that carvone:thymol, carvone:menthol, and cineole:thymol interact strongly with CO
2 molecules through the HBD sites. In contrast, cineole:menthol interacts with CO
2 through its HBA. In all cases, the strongest attractions with HBA and HBD are established through the (HBA/HBD)H⋯O(CO
2). To support the QTAIM analysis, the reduced density gradient (RDG) isosurfaces were plotted, and their analysis focused on the nature and strength of the interactions displayed in the isosurface for the DES and CO
2 structures. All of the interactions of both HBA/HBD and CO
2 have been visualized with RDG plots, Fig. S3 (ESI
†). From RDG isosurfaces, it is clearly observed that van der Waals type of interactions have been established between CO
2 and HBA/HBD. Another important result that can be inferred from the RDG isosurfaces is that the inclusion of CO
2 does not disrupt the interaction between the HBA and HBD; thus, leading to the preservation of NADES structural integrity. In addition to QTAIM and RDG plots, density of states (DOS) plots and electrostatic potential (ESP) isosurfaces are provided in Fig. S4 and S5 (ESI
†). According to DOS and HOMO–LUMO diagrams, conjugated structure leads to low Δ
E, and the presented values refer to the light absorption in the UV region and weak van der Waals interactions between the NADES + CO
2 structures, Fig. S4 (ESI
†). ESP isosurface plots provide an effective visualization of the total charge distribution and relative polarity of the studied DES + CO
2 structures. In the attached plots isosurfaces HBA area is covered with blue (−) and red (+) corresponding to the effect of the abundant π-electron cloud. There are also small areas having remarkable positive and negative ESP values, corresponding to the regions close to the global ESP minimum and maximum. Regarding CO
2, for all the cases, it is controlled by either blue minimum or red maximum, except for the case of carvone:menthol + CO
2, Its balanced minimum and maximum isosurfaces surrounding the molecule. Also observed in all cases, the negative charge of O atoms in CO
2 stabilizes the positive charge at the active site of the NADES structure. It, it shows that the greatest negative electrostatic potential is located mainly over the O
![[double bond, length as m-dash]](https://www.rsc.org/images/entities/char_e001.gif)
, with a minimum value ranging from −1.5 eV and −1.6 eV and the positive region is mostly on the methyl groups over the HBA. Thus, the positive charge is more spread over the C–H of the HBD and C
![[double bond, length as m-dash]](https://www.rsc.org/images/entities/char_e001.gif)
O.
Table 6 Interaction energies between CO2 and NADES. For simplicity only the most energetically favorable configurations are included. (CAR = carvone, CIN = cineole, THY = thymol, MEN = menthol)
| Compound |
DES (a.u.) |
HBA (a.u.) |
HBD (a.u.) |
Binding energy |
| (a.u.) |
(kJ mol−1) |
| [CAR]:[MEN] + CO2_p04 |
932.694 |
464.523 |
468.161 |
0.009347 |
24.85 |
| [CAR]:[THY] + CO2_p06 |
929.083 |
464.523 |
464.557 |
0.002657 |
7.06 |
| [CIN]:[MEN] + CO2_p04 |
935.110 |
466.947 |
468.161 |
0.001087 |
2.89 |
| [CIN]:[THY] + CO2_p01 |
931.513 |
466.947 |
464.557 |
0.008200 |
21.80 |
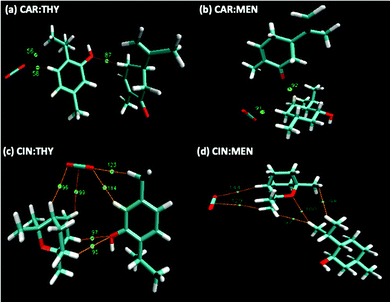 |
| | Fig. 16 QTAIM analysis of the notable BCPs and paths for the NADES + CO2 systems. BCPs are indicated with green dots and corresponding paths are highlighted in orange. (a) CARV:THY, (b) CARV:MA, (c) CIN:THY, (d) CIN:MEN. | |
Table 7 Electron density (ρ) and Laplacian electron density (∇2ρ) of notable BCPs for studied NADES + CO2 systems. (CAR = carvone, CIN = cineole, THY = thymol, MEN = menthol)
| Compound |
Sites |
Cp |
ρ
|
∇2ρ |
| CAR:THY |
(HBA)H⋯O(HBD) |
87 |
6.44 × 10⁻⁴ |
1.88 × 10⁻² |
| (HBD)H⋯O(CO2) |
56 |
4.63 × 10⁻⁴ |
7.86 × 10⁻³ |
| (HBD)H⋯O(CO2) |
58 |
4.98 × 10⁻⁴ |
1.13 × 10⁻² |
|
|
| CAR:MEN |
(HBA)O⋯H(HBD) |
92 |
6.82 × 10⁻⁴ |
1.81 × 10⁻² |
| (HBD)H⋯O(CO2) |
91 |
4.15 × 10⁻⁴ |
6.12 × 10⁻³ |
|
|
| CIN:THY |
(HBA)H⋯HBD(O) |
95 |
−1.29 × 10⁻³ |
4.38 × 10⁻⁴ |
| (HBA)H⋯HBD(O) |
97 |
3.83 × 10⁻⁴ |
6.11 × 10⁻³ |
| (HBA)H⋯O(CO2) |
96 |
3.21 × 10⁻⁴ |
4.52 × 10⁻³ |
| (HBA)H⋯C(CO2) |
99 |
2.81 × 10⁻⁴ |
3.66 × 10⁻³ |
| (HBD)H⋯O(CO2) |
114 |
3.95 × 10⁻⁴ |
6.33 × 10⁻³ |
| (HBD)H⋯O(CO2) |
123 |
4.33 × 10⁻⁴ |
7.43 × 10⁻³ |
|
|
| CIN:MEN |
(HBA)H⋯H(HBD) |
97 |
3.05 × 10⁻⁴ |
4.47 × 10⁻³ |
| (HBA)H⋯H(HBD) |
98 |
2.28 × 10⁻⁴ |
3.00 × 10⁻³ |
| (HBA)O⋯H(HBD) |
100 |
3.47 × 10⁻⁴ |
4.50 × 10⁻³ |
| (HBA)H⋯C(CO2) |
129 |
7.79 × 10⁻⁵ |
8.87 × 10⁻⁴ |
| (HBA)H⋯O(CO2) |
144 |
1.35 × 10⁻⁴ |
1.46 × 10⁻³ |
3.6 Molecular modeling: MD
The MD study provided information on the nanoscopic features of the studied type V NADES. The main properties of the considered NADES should be dependent on the nature of the HBA (cineole or carvone)–HBD (menthol or thymol) hydrogen bonding, and thus the corresponding Radial Distribution Functions (RDFs) are reported in Fig. 18–d. These HBA–HBD RDFs show a first narrow and intense peak at 1.75 Å for the interaction between the Oxygen atom in cineole/carvone and the corresponding hydroxyl group in menthol/thymol, which confirms the development of hydrogen bonding. This RDF peak is more intense for thymol than for menthol. Likewise, the effect of temperature on the peak intensity is almost negligible (only a slight decrease) with increasing temperature (293 to 353 K). The integration of RDFs led to the corresponding solvation numbers, N, Fig. 18a, which show a larger extension of interactions for thymol as HBD and for carvone as HBA. Results in Fig. 17e–17h show RDFs for HBA–HBA interactions, which discard the HBA self-association because of the absence of relevant peaks and are only characterized by the presence of neighbor HBA molecules in HBA–HBD clusters, Fig. 18b. Nevertheless, RDFs for HBA–HBA interactions containing cineole are more structured than those for carvone, with systems with cineole showing a second solvation shell well defined, Fig. 18g and h, which upon integration, Fig. 19, shows a larger number of HBA molecules in the neighborhood of cineole in comparison with carvone. For HBD–HBD RDFs, Fig. 18i–l, the intense peak confirms that HBD molecules are self-associated by hydrogen bonding. Moreover, HBD–HBD peaks for menthol containing NADES are more intense than for THYMOL ones, as well as for systems with cineole than for carvone, which is the opposite behavior to HBA–HBD interactions. Therefore, menthol systems are remarkably more self-associated than thymol ones, Fig. 18c, which leads to a decrease of HBA–menthol hetero association in comparison with HBA–thymol ones. An analogous effect is inferred for cineole/carvone as HBAs, Fig. 19a and c.
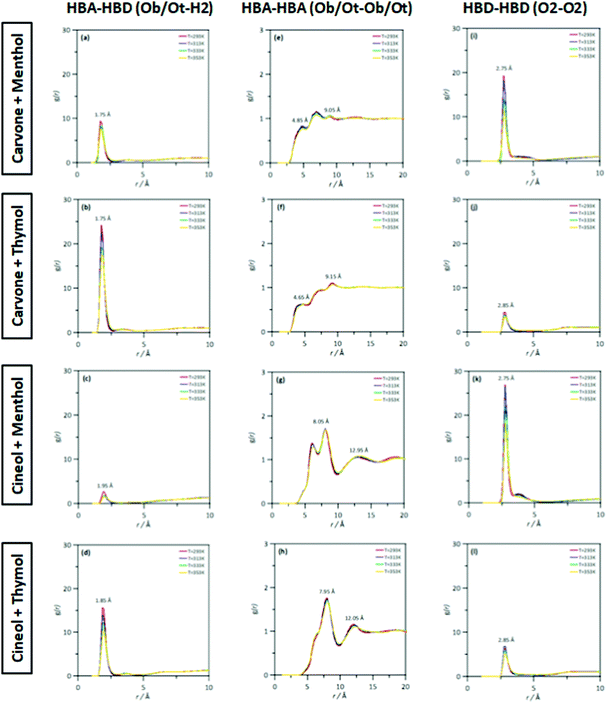 |
| | Fig. 17 Site–site radial distribution functions, g(r), for HBA:HBD, HBA:HBA and HBD:HBD sites in the reported DES at 293/313/333/353 K and 0.1 MPa. Atomic labelling as in Fig. 1. | |
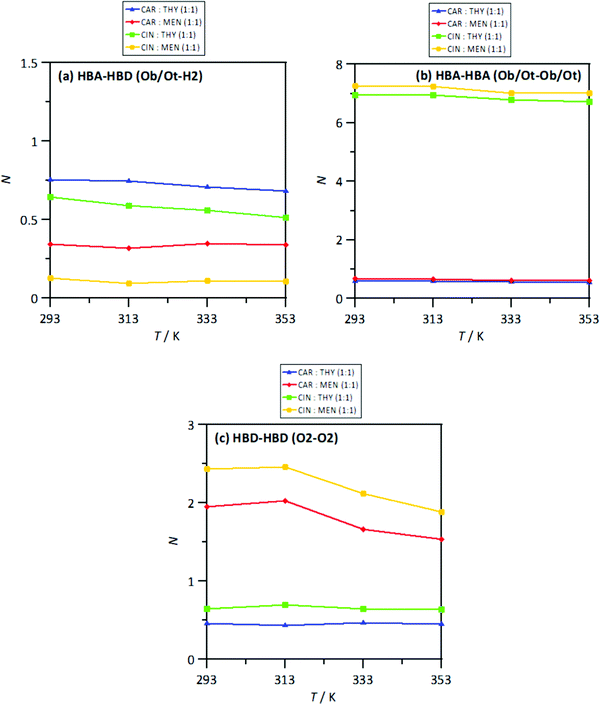 |
| | Fig. 18 Solvation numbers, N, obtained from the integration of radial distribution functions reported in Fig. 14, corresponding to the first solvation sphere, defined as the first minimum in the corresponding radial distribution function for HBA:HBD, HBA:HBA and HBD:HBD sites in the reported DES at 293/313/333/353 K and 0.1 MPa. Atomic labelling as in Fig. 1. | |
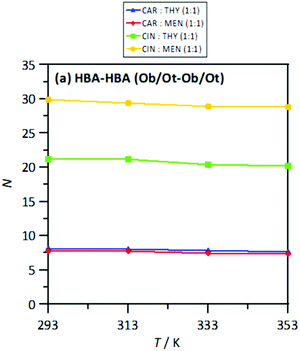 |
| | Fig. 19 Solvation numbers, N, obtained from the integration of radial distribution functions reported in Fig. 10, corresponding to the second solvation sphere, defined as the second minimum in the corresponding radial distribution function for HBA:HBA site in the reported DES at 293/313/333/353 K and 0.1 MPa. Atomic labelling as in Fig. 1. | |
The extension of hydrogen bonding was quantified using a geometrical criterion considering 3.5 Å and 60° for donor–acceptor separation and angle, respectively. Results for the number of hydrogen bonds per molecule, NH, for HBA–HBD interactions are reported in Fig. 15a, confirming the development of hetero association by hydrogen bonding, especially for thymol-containing systems and in larger extension for carvone than for cineole. Exactly the opposite effect is inferred for HBD–HBD hydrogen bonding, larger for menthol than for thymol systems, Fig. 20b. Therefore, a clear competition between the trend to self-associate and heteroassociate is inferred for the considered NADES, which is shifted to one or other side considering the type of HBA and HBD. Nevertheless, the strength of the homo or hetero association developed in the studied NADES is confirmed as they are not remarkably weakened even at 353 K. The trend to develop hydrogen bonding is confirmed through the Spatial Distribution Functions (SDFs) as reported in Fig. 21a, which show a highly localized distribution around the HBD hydrogen bond donor sites. The main difference in SDFs stands for cineole + thymol system, which apart of the spot in the vicinity of the thymol hydroxyl site, two additional spots are formed above and below the aromatic ring of thymol molecule, which can be produced by the self-interaction of thymol molecules. The development of HBA–HBD hydrogen bonding is confirmed through the Combined Distribution Functions (CDFs) reported in Fig. 22. Although the spots appearing at a short distance and large angels confirm the formed hydrogen bonds, the cineole containing systems show different CDFs in comparison with carvone ones, characterized by maxima at around 120° in comparison with those at roughly 170° for carvone, and also wider spots, corresponding to the lower extension of hydrogen bonding for cineole containing systems, Fig. 20a, as for the increase of HBD–HBD self-interactions for systems containing cineole as HBA.
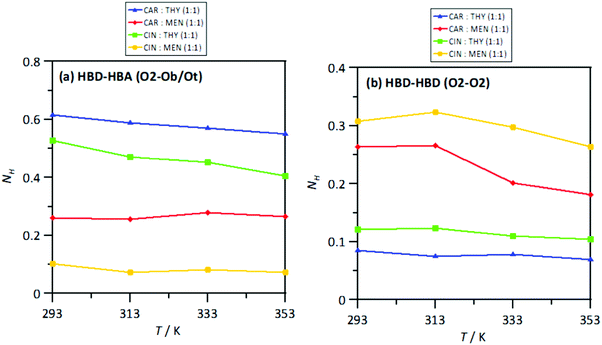 |
| | Fig. 20 Average number of hydrogen bonds per HBD molecule, NH, for the reported atomic pairs (HBA:HBD and HBD:HBD) in the reported DES from MD simulations at 293/313/333/353 K and 0.1 MPa. Atomic labelling as in Fig. 1. | |
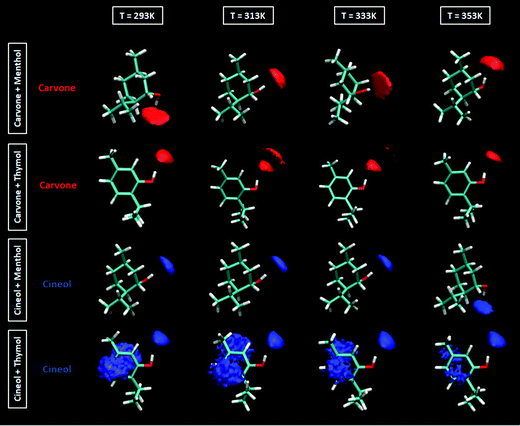 |
| | Fig. 21 Spatial distribution functions of the corresponding centers-of-mass around a central HBD molecule for the reported DES at 293/313/333/353 K and 0.1 MPa. | |
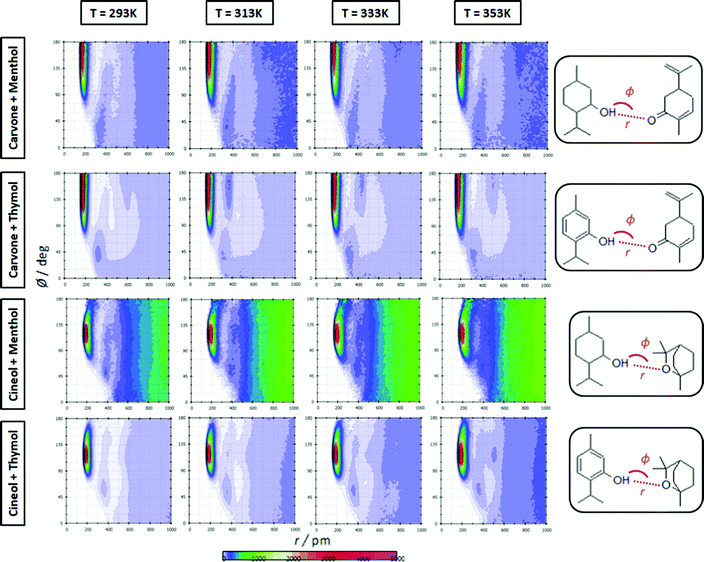 |
| | Fig. 22 Combined distribution functions of radial distribution functions (x-axis) and angular distribution functions (y-axis) for the reported distances, r, and angles, φ, (HBA:HBD interactions) for the reported DES at 293/313/333/353 K and 0.1 MPa. | |
The strength of the interactions was quantified by the intermolecular interaction energies, Einter, for the corresponding molecular pairs, Fig. 23. The Einter for HBA–HBD interactions, Fig. 23a, are in agreement with those for the number of hydrogen bonds per molecule, Fig. 20a, i.e., a larger number of interactions larger (in absolute value) Einter. Nevertheless, in all the cases, the HBA–HBD interactions are characterized by large Einter. Although results in Fig. 17 discarded HBA–HBA strong specific interactions, Einter reported in Fig. 18b show non-negligible values, especially for systems containing menthol as HBDs. Likewise, results in Fig. 23c showing Einter for HBD–HBD interactions also confirms this type of hydrogen bonding, especially when menthol is present, in agreement with results in Fig. 20b. Therefore, thymol favors heteroassociation with HBAs in comparison with menthol, cineole favors HBD homoassociation, and the interplay between these factors determine the structure of the NADES. This effect of the homo and heteroassociation through hydrogen bonding is also quantified through the calculated self-diffusion coefficients, D, obtained from mean square displacements, Fig. S6 (ESI†), and Einstein's equation, Fig. 24. The D values for HBAs are slightly larger than for the HBDs, although these differences are minor, showing highly correlated HBA/HBD self-diffusion, which corresponds to the developed heteroassociations through hydrogen bonding. The lower D values are obtained for cineole containing NADES, which agrees with cineole promoting HBD–HBD self-association as well as maintaining HBA–HBD heteroassociation. Nevertheless, although D coefficient decrease upon heating, this change agrees with the large interaction energies in the studied temperature range produced by the developed homo and heteroassociation through hydrogen bonding.
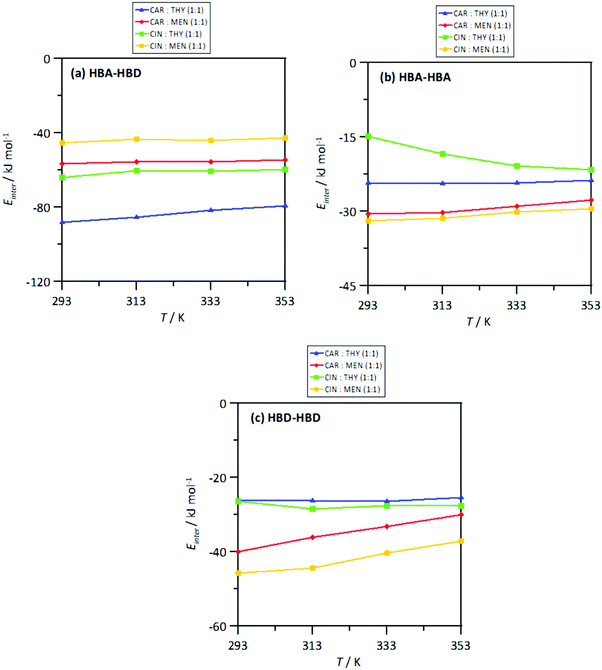 |
| | Fig. 23 Intermolecular interaction energy, Einter (sum of Lennard-Jones and coulombic contributions), for HBA:HBD, HBA:HBA and HBD:HBD interacting sites in the reported DES at 293/313/333/353 K and 0.1 MPa. | |
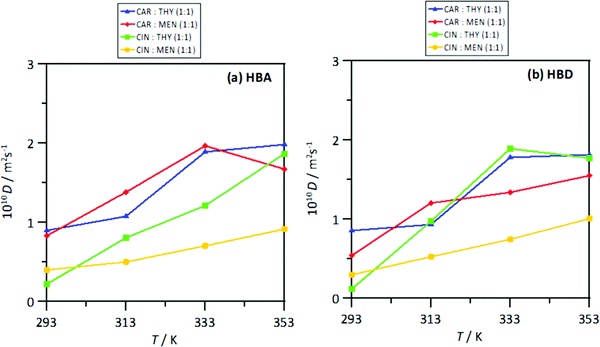 |
| | Fig. 24 Self-diffusion coefficient (calculated from msd using Einsten's equation), D, for (a) HBA and (b) HBD in the reported DES at 293/313/333/353 K and 0.1 MPa. Values are calculated for corresponding centers-of-mass. | |
4. Conclusions
In this work, Type V natural deep eutectic solvents based on monoterpenoids (cineole, carvone, menthol, and thymol) are studied using a combined experimental and molecular modeling approach. The reported physicochemical properties showed low viscous fluids whose properties were characterized as a function of temperature. Machine learning methods have been successfully applied for the correlation and prediction of DES physicochemical properties, and it was shown that the entire low viscosity region has been represented and predicted in good agreement with the experimental data, whereas the high viscosity region in the database is poorly represented. QTAIM calculations showed that carvone and thymol lead to higher binding energies and stronger interactions with CO2 (HBA/HBD)H⋯O(CO2). It is clearly observed that hydrogen bonding between the HBA/HBD through both DFT and MD simulations. On the other hand, van der Waals type of interactions have been established between CO2 and HBA/HBD. Another important result that can be inferred from the QTAIM calculations is that the inclusion of CO2 does not disrupt the interaction between the HBA and HBD; thus, leading to the preservation of NADES structural integrity. Supporting results have been obtained from the MD simulations regarding the structural integrity of the proposed NADES structures. MD studies have also shown that menthol systems are remarkably more self-associated than thymol ones leading to a decrease of HBA–menthol heteroassociations in comparison with HBA–thymol ones. MD studies also have shown that THYMOL favors heteroassociation with HBAs in comparison with menthol, cineole favors HBD homoassociation, and the interplay between these factors determine the structure of the NADES. Considering these findings, monoterpenoid-based can form NADES structures, and they have shown structural integrity during their exposure to the CO2 environment. Their low viscous behavior favors the minimization of mass transfer limitations, and low contact angle leads to a high wettability profile. However, poor thermal stability limits the actual operating temperatures in near-real life process applications. These NADES can be considered some applications, especially as solubilizers or extracting agents, and it is essential to gas sorption experimental data at elevated pressures to rule out their suitability for CO2 capture processes.
Conflicts of interest
There are no conflicts to declare.
Acknowledgements
This work was funded by Ministerio de Ciencia, Innovación y Universidades (Spain, project RTI2018-101987-B-I00) and Western Michigan University Faculty Research and Creative Activities Award (FRACAA-23-0039670). We also acknowledge SCAYLE (Supercomputación Castilla y León, Spain) for providing supercomputing facilities. The statements made herein are solely the responsibility of the authors.
References
- D. A. Alonso, A. Baeza, R. Chinchilla, G. Guillena, I. M. Pastor and D. J. Ramón, Deep Eutectic Solvents: The Organic Reaction Medium of the Century, Eur. J. Org. Chem., 2016, 612–632 CrossRef CAS
 .
.
- A. P. Abbott, G. Capper, D. L. Davies, R. K. Rasheed and V. Tambyrajah, Novel solvent properties of choline chloride/urea mixtures, Chem. Commun., 2003, 70–71 RSC
 .
.
- E. L. Smith, A. P. Abbott and K. S. Snyder, Deep eutectic solvents (DESs) and their applications, Chem. Rev., 2014, 114, 11060–11082 CrossRef CAS PubMed
 .
.
- A. P. Abbott, J. C. Barron, K. S. Ryder and D. Wilson, Eutectic-based ionic liquids with metal-containing anions and cations, Chem. – Eur. J., 2007, 13, 6495–6501 CrossRef CAS PubMed
 .
.
- S. Dutta and K. Nath, Prospect of ionic liquids and deep eutectic solvents as new generation draw solution in forward osmosis process, J. Water Process Eng., 2018, 21, 163–176 CrossRef
 .
.
- M. Atilhan and S. Aparicio, Review and perspectives for effective solutions to grand challenges of energy and fuels technologies via novel deep eutectic solvents, Energy Fuels, 2021, 35, 6402–6419 CrossRef CAS
 .
.
- E. L. Smith, A. P. Abbott and K. S. Ryder, Deep eutectic solvents (DESs) and their applications, Chem. Rev., 2014, 114, 11060–11082 CrossRef CAS PubMed
 .
.
- B. B. Hansen, S. Spittle, B. Chen, D. Poe, Y. Zhang, J. M. Klein, A. Horton, L. Adhikari, T. Zelovich, B. W. Doherty, B. Gurkan, E. J. Maginn, A. Ragauskas, M. Dadmun, T. A. Zawodzinski, G. A. Baker, M. E. Tuckerman, R. F. Savinell and J. R. Sangoro, Deep eutectic solvents: a review of fundamentals and applications, Chem. Rev., 2021, 121, 1232–1285 CrossRef CAS PubMed
 .
.
- D. O. Abranches, M. A. Martins, L. P. Silva, N. Schaeffer, S. P. Pinho and J. A. Coutinho, Phenolic hydrogen bond donors in the formation of non-ionic deep eutectic solvents: the quest for type V DES, Chem. Commun., 2019, 55, 10253–10256 RSC
 .
.
- C. Florindo, F. Lima, B. Dias-Ribeiro and I. M. Marrucho, Deep eutectic solvents: overcoming 21st century challenges, Curr. Opin. Green Sustain. Chem., 2019, 18, 31–36 CrossRef
 .
.
- O. S. Hammond, D. T. Bowron and K. J. Edler, The effect of water upon deep eutectic solvent nanostructure: an unusual transition from ionic mixture to aqueous solution, Angew. Chem., 2017, 129, 9914–9917 CrossRef
 .
.
- C. Ma, A. Laaksonen, C. Liu, X. Lu and X. Ji, The peculiar effect of water on ionic liquids and deep eutectic solvents, Chem. Soc. Rev., 2018, 47, 8685–8720 RSC
 .
.
- D. J. G. P. van Osch, C. H. J. T. Dietz, S. E. E. Warrag and M. C. Kroon, The curious case of hydrophobic deep eutectic solvents: a story on the discovery, design, and applications, ACS Sustainable Chem. Eng., 2020, 8, 10591–10612 CAS
 .
.
- Y. H. Choi, J. van Spronsen, Y. Dai, M. Verberne, F. Hollmann, I. W. Arends, G. J. Witkamp and R. Verpoorte, Plant Physiol., 2011, 156, 1701–1705 CrossRef CAS PubMed
 .
.
- Y. Liu, B. Friesen, J. B. McAlpine, D. C. Lankin, S. N. Chen and G. F. Pauli, Natural deep eutectic solvents: properties, applications, and perspectives, J. Nat. Prod., 2018, 81, 679–690 CrossRef CAS PubMed
 .
.
- A. Misan, J. Nadpal, A. Stupar, M. Pojic, A. Mandic and R. Verpoorte, The perspectives of natural deep eutectic solvents in agri-food sector, Crit. Rev. Food Sci. Nutr., 2020, 60, 2564–2592 CrossRef CAS PubMed
 .
.
- M. Bystrzanowska and M. Tobiszewski, Assessment
and design of greener deep eutectic solvents – A multicriteria decision analysis, J. Mol. Liq., 2021, 321, 114878 CrossRef CAS
 .
.
- A. Kumar and M. N. D. S. Cordeiro, Probing the environmental toxicity of deep eutectic solvents and their components: an in silico modeling approach, ACS Sustainable Chem. Eng., 2019, 7, 10649–10660 CrossRef
 .
.
- E. Slupek, P. Makos and J. Gebicki, Theoretical and economic evaluation of low-cost deep eutectic solvents for effective biogas upgrading to bio-methane, Energies, 2020, 13, 3379 CrossRef
 .
.
- M. Atilhan and S. Aparicio, Review on chemical enhanced oil recovery: Utilization of ionic liquids and deep eutectic solvents, J. Pet. Sci. Eng., 2021, 205, 108746 CrossRef CAS
 .
.
- N. Zhang, Z. Huang, H. Zhang, J. Ma, B. Jiang and L. Zhang, Highly Efficient and Reversible CO2 Capture by Task-Specific Deep Eutectic Solvents, Ind. Eng. Chem. Res., 2019, 58, 13321–13329 CrossRef CAS
 .
.
- S. Emami and A. Shayanfar, Deep eutectic solvents for pharmaceutical formulation and drug delivery applications, Pharm. Dev. Technol., 2020, 25, 779–796 CrossRef CAS PubMed
 .
.
- A. Roda, A. M. Matias, A. Paiva and A. R. C. Duarte, Polymer science and engineering using deep eutectic solvents, Polymers, 2019, 11, 912 CrossRef PubMed
 .
.
- A. Abo-Hamad, M. Hayyan, M. A. AlSaadi and M. A. Hashim, Potential applications of deep eutectic solvents in nanotechnology, Chem. Eng. J., 2015, 273, 551–567 CrossRef CAS
 .
.
- J. Wu, Q. Liang, W. Yu, Q. F. Lu, L. Ma, X. Qin and G. Chen, b. Li, Deep eutectic solvents for boosting electrochemical energy storage and conversion: a review and perspective, Adv. Funct. Mater., 2021, 31, 2011102 CrossRef CAS
 .
.
- E. I. Ahmed, A. P. Abbott and K. S. Ryder, Lubrication studies of some type III deep eutectic solvents (DESs), AIP Conf. Proc., 2017, 1888, 020006 CrossRef
 .
.
- Y. P. Mbous, M. Hayyan, A. Hayyan, W. F. Wong, M. A. Hashim and C. Y. Looi, Applications of deep eutectic solvents in biotechnology and bioengineering—Promises and challenges, Biotechnol. Adv., 2017, 35, 105–134 CrossRef CAS PubMed
 .
.
- X. Ge, C. Gu, X. Wang and J. Tu, Potential applications of deep eutectic solvents in nanotechnology, J. Mater. Chem. A, 2017, 5, 8209–8229 RSC
 .
.
- R. Hakkinen and A. P. Abbott, Deep eutectic solvents—Teaching nature lessons that it knew already, Adv. Bot. Res., 2021, 97, 1–16 Search PubMed
 .
.
- D. J. G. P. van Osch, C. H. J. T. Dietz, J. van Spronsen, M. C. Kroon, F. Gallucci, M. van Sint Annaland, R. Tuinier and A. C. S. Sustainable, Chem. Eng., 2019, 7, 2933–2942 CAS
 .
.
- T. Krizek, M. Bursova, R. Horsley, M. Kuchar, P. Tuma, R. Cabala and T. Hlozek, Menthol-based hydrophobic deep eutectic solvents: Towards greener and efficient extraction of phytocannabinoids, J. Cleaner Prod., 2018, 193, 391–396 CrossRef CAS
 .
.
- T. Fan, Z. Yan, C. Yang, S. Qiu, X. Peng, J. Zhang, L. Hu and L. Chen, Preparation of menthol-based hydrophobic deep eutectic solvents for the extraction of triphenylmethane dyes: quantitative properties and extraction mechanism, Analyst, 2021, 146, 1996–2008 RSC
 .
.
- Y. An and K. H. Row, Evaluation of menthol-based hydrophobic deep eutectic solvents for the extraction of bisphenol a from environment water, Anal. Lett., 2021, 54, 1533–1545 CrossRef CAS
 .
.
- T. Brouwer, B. C. Dielis, J. M. Bock and B. Schuur, Hydrophobic deep eutectic solvents for the recovery of bio-based chemicals: solid–liquid equilibria and liquid–liquid extraction, Processes, 2021, 9, 796 CrossRef CAS
 .
.
- A. G. Pekel, E. Kurtulbas, I. Toprakci and S. Sahin, Menthol-based deep eutectic solvent for the separation of carbamazepine: reactive
liquid-liquid extraction, Biomass Convers. Biorefin., 2020 DOI:10.1007/s13399-020-00707-z
 .
.
- X. H. Fan, L. T. Wang, Y. H. Chang, J. Y. An, Y. W. Zhu, Q. Yang, D. Meng and Y. J. Fu, Application of green and recyclable menthol-based hydrophobic deep eutectic solvents aqueous for the extraction of main taxanes from Taxus chinensis needles, J. Mol. Liq., 2021, 326, 114970 CrossRef CAS
 .
.
- N. Schaeffer, D. O. Abranches, L. P. Silva, M. A. R. Martins, P. J. Carvalho, O. Russina, A. Triolo, L. Paccou, Y. Guinet, A. Hedoux and J. A. P. Coutinho, Non-ideality in thymol + menthol type v deep eutectic solvents, ACS Sustainable Chem. Eng., 2021, 9, 2203–2211 CrossRef CAS
 .
.
- M. A. R. Martins, L. P. Silva, N. Schaeffer, D. O. Abranches, G. J. Maximo, S. P. Pinho and J. A. P. Coutinho, Greener terpene-terpene eutectic mixtures as hydrophobic solvents, ACS Sustainable Chem. Eng., 2019, 7, 17414–17423 CrossRef CAS
 .
.
- R. Alcalde, G. García, M. Atilhan and S. Aparicio, Systematic study on the viscosity of ionic liquids: measurement and prediction, Ind. Eng. Chem. Res., 2015, 54, 10918–10924 CrossRef CAS
 .
.
- A. S. L. Gouveia, L. C. Tome and I. M. Marrucho, Density, viscosity, and refractive index of ionic liquid mixtures containing cyano and amino acid-based anions, J. Chem. Eng. Data, 2016, 61, 83–93 CrossRef CAS
 .
.
- A. Cherkasov, Inductive QSAR descriptors. Distinguishing compounds with antibacterial activity by artificial neural networks, Int. J. Mol. Sci., 2005, 6, 63–86 CrossRef CAS
 .
.
- S. G. Balasumramani, G. P. Chen, S. Coriani, M. Diedenhofer, M. S. Frank, Y. J. Franzke, F. Furche1, R. Grotjahn, M. E. Harding, C. Hattig, A. Hellweg, B. Helmich-Paris, C. Holzer, U. Huniar, M. Kaupp, A. M. Khah, S. K. Khani, T. Müller, F. Mack, B. D. Nguyen, S. M. Parker, E. Perlt, D. Rappoport, K. Reiter, S. Roy, M. Rückert, G. Schmitz, M. Sierka, E. Tapavicza, D. P. Tew, C. van Wüllen, V. K. Voora, F. Weigend, A. Wodyński and J. M. Yu, TURBOMOLE: Modular program suite for ab initio quantum-chemical and condensed-matter simulations, J. Chem. Phys., 2020, 152, 184107 CrossRef PubMed
 .
.
- I. Sushko, S. Novotarskyi, R. Körner, A. K. Pandey, M. Rupp, W. Teetz, S. Brandmaier, A. Abdelaziz, V. V. Prokopenko, V. Y. Tanchuk, R. Todeschini, A. Varnek, G. Marcou, P. Ertl, V. Potemkin, M. Grishina, J. Gasteiger, S. C. Baskin, V. A. Palyulin, E. V. Radchenko, W. J. Welsh, V. Kholodovych, D. Chekmarev, A. Cherkasov, J. Aires-de-Sousa, Q. Y. Zhang, A. Bender, F. Nigsch, L. Patiny, A. Williams, V. Tkachenko and I. V. Tetko, Online chemical modeling environment (OCHEM): web platform for data storage, model development and publishing of chemical information, J. Comput.-Aided Mol. Des., 2011, 25, 533–554 CrossRef CAS PubMed
 .
.
- D. O. Abranches, M. Larriba, L. P. Silva, M. Melle-Franco, J. F. Palomar, S. P. Pinto and J. A. P. Coutinho, Using COSMO-RS to design choline chloride pharmaceutical eutectic solvents, Fluid Phase Equilib., 2019, 497, 71–78 CrossRef CAS
 .
.
- A. Kovacs, E. C. Neyts, I. Cornet, M. Wijnants and P. Billen, Using COSMO-RS to design choline chloride pharmaceutical eutectic solvents, ChemSusChem, 2020, 13, 71–78 CrossRef PubMed
 .
.
- F. Neese, The ORCA program system, Wiley Interdiscip. Rev.: Comput. Mol. Sci., 2012, 2, 73–78 CAS
 .
.
- C. Lee, W. Yang and R. G. Parr, Development of the Colle-Salvetti correlation-energy formula into a functional of the electron density, Phys. Rev. B: Condens. Matter Mater. Phys., 1988, 37, 785–789 CrossRef CAS PubMed
 .
.
- A. D. Becke, Density-functional exchange-energy approximation with correct asymptotic behavior, Phys. Rev. A: At., Mol., Opt. Phys., 1988, 38, 3098–3100 CrossRef CAS PubMed
 .
.
- A. D. Becke, Density-functional thermochemistry. III. The role of exact exchange, J. Chem. Phys., 1993, 98, 5648–5652 CrossRef CAS
 .
.
- S. Simon, M. Duran and J. Dannenberg, How does basis set superposition error change the potential surfaces for hydrogen-bonded dimers?, J. Chem. Phys., 1996, 105, 11024 CrossRef CAS
 .
.
-
R. F. W. Bader, Atoms in Molecules: A Quantum Theory, Oxford, 1990 Search PubMed
 .
.
- T. Lu and F. Chen, Multiwfn: A multifunctional wavefunction analyzer, J. Comput. Chem., 2012, 33, 580–592 CrossRef CAS PubMed
 .
.
- S. Simon, M. Duran and J. Dannenberg, How does basis set superposition error change the potential surfaces for hydrogen-bonded dimers?, J. Chem. Phys., 1996, 105, 11024–11031 CrossRef CAS
 .
.
- C. M. Breneman and K. B. Wiberg, Determining atom-centered monopoles from molecular electrostatic potentials. The need for high sampling density in formamide conformational analysis, J. Comput. Chem., 1990, 11, 361–373 CrossRef CAS
 .
.
- A. P. Lyubartsev and A. Laaksonen, MdynaMix – A scalable portable parallel MD simulation package for arbitrary molecular mixtures, Comput. Phys. Commun., 2000, 128, 565–589 CrossRef CAS
 .
.
- V. Zoete, M. A. Cuendet, A. Grosdidier and O. Michielin, SwissParam: a fast force field generation tool for small organic molecules, J. Comput. Chem., 2011, 32, 2359–2368 CrossRef CAS PubMed
 .
.
- L. Martínez, R. Andrade, E. G. Birgin and J. M. Martínez, Packmol: A package for building initial configurations for molecular dynamics simulations, J. Comput. Chem., 2009, 30, 2157–2164 CrossRef PubMed
 .
.
- W. G. Hoover, Canonical dynamics: Equilibrium phase-space distributions, Phys. Rev. A: At., Mol., Opt. Phys., 1985, 31, 1695 CrossRef PubMed
 .
.
- U. L. Essmann, M. L. Perera, T. Berkowitz, H. Darden, H. Lee and L. G. Pedersen, A smooth particle mesh ewald method, J. Chem. Phys., 1995, 103, 8577–8593 CrossRef CAS
 .
.
- H. Yang, C. Lou, L. Sun, J. Li, Y. Cai, Z. Wang, W. Li, G. Liu and Y. Tang, AdmetSAR 2.0: web-service for prediction and optimization of chemical ADMET properties, Bioinformatics, 2019, 35, 1067–1069 CrossRef CAS PubMed
 .
.
- J. Xu, Z. Q. Hu, C. Wang, Z. Q. Yin, Q. Wei, L. J. Zhou, L. Li, Y. H. Du, R. Y. Jia, Q. J. Fan, X. X. Liang, C. L. He and L. Z. Yin, Acute and subacute toxicity study of 1,8-cineole in mice, Int. J. Clin. Exp. Pathol., 2014, 7, 1495–1501 Search PubMed
 .
.
- EFSA Scientific Committee, Scientific Opinion on the safety assessment of carvone, considering all sources of exposure, EFSA J., 2014, 12, 3806 CrossRef
 .
.
- M. Baibars, S. Eng, K. Shaheen, A. H. Alraiyes and M. C. Alraies, Menthol toxicity: an unusual case of coma, Case Rep. Clin. Med., 2012, 187039 Search PubMed
 .
.
- A. Kumar, U. Baitha, P. Aggarwal and N. Jamshed, A fatal case of menthol poisoning, Int. J. Appl. Basic Med. Res., 2016, 6, 137–139 CrossRef CAS PubMed
 .
.
- M. A. Tabari, M. R. Youssefi, F. Maggi and G. Benelli, Toxic and repellent activity of selected monoterpenoids (thymol, carvacrol and linalool) against the castor bean tick, Ixodes ricinus (Acari: Ixodidae), Vet. Parasitol., 2017, 245, 86–91 CrossRef CAS PubMed
 .
.
- K. Xie, D. P. Tashkin, M. Z. Luo and J. Y. Zhang, Chronic toxicity of inhaled thymol in lungs and respiratory tracts in mouse model, Pharmacol. Res. Perspect., 2019, 7, e00516 CAS
 .
.
- E. J. L. Lana, K. A. da Silva-Rocha, I. V. Kozhevnikov and E. V. Gusevskaya, Synthesis of 1,8-cineole and 1,4-cineole by isomerization of α-terpineol catalyzed by heteropoly acid, J. Mol. Catal. A: Chem., 2006, 259, 99–102 CrossRef CAS
 .
.
- D. Villanueva-Bermejo, I. Angelov, G. Vicente, R. P. Stateva, M. Rodríguez, G. Reglero, E. Ibañez and T. Fornari, Extraction of thymol from different varieties of thyme plants using green solvents, J. Sci. Food Agric., 2015, 95, 2901–2907 CrossRef CAS PubMed
 .
.
- O. S. Hammond, D. T. Bowron and K. J. Edler, The effect of water upon deep eutectic solvent nanostructure: an unusual transition from ionic mixture to aqueous solution, Angew. Chem., Int. Ed., 2017, 56, 9782–9785 CrossRef CAS PubMed
 .
.
- L. Sapir and D. Harries, Restructuring a Deep Eutectic Solvent by Water: The nanostructure of hydrated choline chloride/urea, J. Chem. Theory Comput., 2020, 16, 3335–3342 CrossRef CAS PubMed
 .
.
- T. El-Achkar, H. Greige-Gerges and S. Fourmentin, Basics and properties of deep eutectic solvents: a review, Environ. Chem. Lett., 2021, 19, 3397–3408 CrossRef CAS
 .
.
- B. Nowosielski, M. Jamrogiewicz, J. Luczak, M. Smiechoowski and D. Warminska, Experimental and predicted physicochemical properties of monopropanolamine-based deep eutectic solvents, J. Mol. Liq., 2020, 309, 113110 CrossRef CAS
 .
.
- T. Cui, C. Li, J. Yin, S. Li, Y. Jia and M. Bao, Design, synthesis and properties of acidic deep eutectic solvents based on choline chloride, J. Mol. Liq., 2017, 236, 338–343 CrossRef
 .
.
- C. Florindo, F. S. Oliveira, L. P. N. Rebelo, A. M. Fernandes and I. M. Marrucho, Insights into the synthesis and properties of deep eutectic solvents based on cholinium chloride and carboxylic acids, ACS Sustainable Chem. Eng., 2014, 2, 2416–2425 CrossRef CAS
 .
.
- D. Lapeña, L. Lomba, M. Artal, C. Lafuente and B. Giner, Thermophysical characterization of the deep eutectic solvent choline chloride:ethylene glycol and one of its mixtures with water, Fluid Phase Equilib., 2019, 492, 1–9 CrossRef
 .
.
- G. García, S. Aparicio, R. Ullah and M. Atilhan, Deep Eutectic Solvents: Physicochemical properties and gas separation applications, Energy Fuels, 2015, 29, 2616–2644 CrossRef
 .
.
- R. Haghbakhsh, K. Parvaneh, S. Raeissi and A. Shariati, A general viscosity model for deep eutectic solvents: The free volume theory coupled with association equations of state, Fluid Phase Equilib., 2018, 470, 193–202 CrossRef CAS
 .
.
- J. N. Al-Dawsari, A. Bessadok-Jemai, I. Wazeer, S. Mokraoui, M. A. AlMansour and M. K. Hadj-Kali, Fitting of experimental viscosity to temperature data for deep eutectic solvents, J. Mol. Liq., 2020, 310, 113127 CrossRef CAS
 .
.
- T. Aissaoui, I. M. AlNashef, U. A. Qureshi and Y. Benguerba, Potential applications of deep eutectic solvents in natural gas sweetening for CO2 capture, Rev. Chem. Eng., 2017, 33, 523–550 CAS
 .
.
- Q. Gao and Z. Jian, Fragility and Vogel-Fulcher-Tammann parameters near glass transition temperature, Mater. Chem. Phys., 2020, 252, 123252 CrossRef CAS
 .
.
- R. K. Gautam and D. Seth, Thermal conductivity of deep eutectic solvents, J. Therm. Anal. Calorim., 2020, 140, 2633–2640 CrossRef CAS
 .
.
- T. H. Ibrahim, M. A. Sabri, N. A. Jabbar and P. Nancarrow, Thermal conductivity of choline chloride – based deep eutectic solvents and their mixtures with water: measurement and estimation, Molecules, 2020, 25, 3816 CrossRef CAS PubMed
 .
.
- Y. Chen, W. Chen, L. Fu, Y. Yang, Y. Wang, X. Hu, F. Wang and T. Mu, Ind. Eng. Chem. Res., 2019, 58, 12741–12750 CrossRef CAS
 .
.
- A. Pandey, R. Rai, M. Pal and S. Pandey, How polar are choline chloride-based deep eutectic solvents?, Phys. Chem. Chem. Phys., 2014, 16, 1559–1568 RSC
 .
.
- C. Florindo, A. J. S. McIntosh, T. Welton, L. C. Brnaco and I. M. Marrucho, A closer look into deep eutectic solvents: exploring intermolecular interactions using solvatochromic probes, Phys. Chem. Chem. Phys., 2018, 20, 206–213 RSC
 .
.
- A. Kovacs, E. C. Neyts, I. Cornet, M. Wijnants and P. Billen, Modeling the physicochemical properties of natural deep eutectic solvents, ChemSusChem, 2020, 13, 3789–3804 CrossRef CAS PubMed
 .
.
- A. Dashti, M. Raji, P. Amani, A. Baghban and A. H. Mohammadi, Insight into the estimation of equilibrium CO2 absorption by Deep Eutectic Solvents using computational approaches, Separ. Sci. Technol., 2020, 56(14), 2351–2368 CrossRef
 .
.
- S. Adams, P. de Castro, P. Echenique, J. Estrada, M. D. Hanwell, P. Murray-Rust, P. Sherwood, J. Thomas and J. A. Townsend, The Quixote project: collaborative and open quantum chemistry data management in the internet age, J. Cheminf., 2011, 3, 38 Search PubMed
 .
.
- U. Koch and P. L. A. Popelier, Characterization of C-H-O hydrogen bonds on the basis of charge density, J. Phys. Chem., 1995, 99, 9747–9754 CrossRef CAS
 .
.
Footnote |
| † Electronic supplementary information (ESI) available: Table S1 (specifications of the considered chemicals); Table S2 (thermophysical properties of the studied DES as a function of temperature); Tables S3 (systems used for MD simulations); Table S4 (force field parameterizations for MD simulations); Fig. S1 (comparison of experimental and MD predicted density); Fig. S2 (Studied NADES structures at various different spatial positions), Fig. S3 (reduced density gradient (RDG) isosurfaces of studied NADES + CO2 systems), Fig. S4 (density of states (DOS) plots and HOMO–LUMO energy gaps for the studied NADES + CO2 systems), Fig. S5 (electrostatic potential isosurfaces on studied NADES + CO2 systems), Fig. S6 (mean square displacements from MD simulations). See DOI: 10.1039/d1cp04509a |
|
| This journal is © the Owner Societies 2022 |
Click here to see how this site uses Cookies. View our privacy policy here.  *b and
Santiago
Aparicio
 *a
*a
![[thin space (1/6-em)]](https://www.rsc.org/images/entities/char_2009.gif) :
:![[thin space (1/6-em)]](https://www.rsc.org/images/entities/char_2009.gif) 1 mole ratio as an archetypical type V NADES, in which the NADES formation was proposed to be produced by the different acidity of the hydroxyl groups in aromatic and aliphatic rings. Additional components for type V were proposed by Abranches et al.,9 such as coumarin (COU) or butylated hydroxytoluene with melting points slightly above the ambient temperature.9 Additional type V NADES were proposed by van Osch et al.30 considering menthol, thymol, or tetradecanol. The interest in these type V DES, specially menthol-based ones, have recently increased; thus, NADES such as MENTHOL–organic acids or menthol–fatty acids31–33 have been developed and considered for different technological applications such as the recovery of bio-based chemicals,34 liquid–liquid extraction,35 or biomolecules extraction.36 The physicochemical properties, such as non-ideality, as well as nanoscopic characterization using molecular dynamics simulations (MD), have been reported for menthol–thymol type V DES, showing a strong dependency on the DES properties and the temperature dependence of hydrogen bonding.37 Likewise, type V DES show suitable thermophysical properties such as low viscosity,38 which removes the drawbacks of many high viscous DES for heat or mass transfer operations.
1 mole ratio as an archetypical type V NADES, in which the NADES formation was proposed to be produced by the different acidity of the hydroxyl groups in aromatic and aliphatic rings. Additional components for type V were proposed by Abranches et al.,9 such as coumarin (COU) or butylated hydroxytoluene with melting points slightly above the ambient temperature.9 Additional type V NADES were proposed by van Osch et al.30 considering menthol, thymol, or tetradecanol. The interest in these type V DES, specially menthol-based ones, have recently increased; thus, NADES such as MENTHOL–organic acids or menthol–fatty acids31–33 have been developed and considered for different technological applications such as the recovery of bio-based chemicals,34 liquid–liquid extraction,35 or biomolecules extraction.36 The physicochemical properties, such as non-ideality, as well as nanoscopic characterization using molecular dynamics simulations (MD), have been reported for menthol–thymol type V DES, showing a strong dependency on the DES properties and the temperature dependence of hydrogen bonding.37 Likewise, type V DES show suitable thermophysical properties such as low viscosity,38 which removes the drawbacks of many high viscous DES for heat or mass transfer operations.

![[thin space (1/6-em)]](https://www.rsc.org/images/entities/char_2009.gif) :
:![[thin space (1/6-em)]](https://www.rsc.org/images/entities/char_2009.gif) HBD mole ratios were considered (2.5
HBD mole ratios were considered (2.5![[thin space (1/6-em)]](https://www.rsc.org/images/entities/char_2009.gif) :
:![[thin space (1/6-em)]](https://www.rsc.org/images/entities/char_2009.gif) 1, 2
1, 2![[thin space (1/6-em)]](https://www.rsc.org/images/entities/char_2009.gif) :
:![[thin space (1/6-em)]](https://www.rsc.org/images/entities/char_2009.gif) 1, 1.5
1, 1.5![[thin space (1/6-em)]](https://www.rsc.org/images/entities/char_2009.gif) :
:![[thin space (1/6-em)]](https://www.rsc.org/images/entities/char_2009.gif) 1, 1
1, 1![[thin space (1/6-em)]](https://www.rsc.org/images/entities/char_2009.gif) :
:![[thin space (1/6-em)]](https://www.rsc.org/images/entities/char_2009.gif) 1, 1
1, 1![[thin space (1/6-em)]](https://www.rsc.org/images/entities/char_2009.gif) :
:![[thin space (1/6-em)]](https://www.rsc.org/images/entities/char_2009.gif) 1.5, 1
1.5, 1![[thin space (1/6-em)]](https://www.rsc.org/images/entities/char_2009.gif) :
:![[thin space (1/6-em)]](https://www.rsc.org/images/entities/char_2009.gif) 2, and 1
2, and 1![[thin space (1/6-em)]](https://www.rsc.org/images/entities/char_2009.gif) :
:![[thin space (1/6-em)]](https://www.rsc.org/images/entities/char_2009.gif) 2.5) to check if they remain in the liquid state, although the study was centered around the eutectic composition, which is produced at 1
2.5) to check if they remain in the liquid state, although the study was centered around the eutectic composition, which is produced at 1![[thin space (1/6-em)]](https://www.rsc.org/images/entities/char_2009.gif) :
:![[thin space (1/6-em)]](https://www.rsc.org/images/entities/char_2009.gif) 1 mole ratio. After preparation, samples were dried under vacuum using a Heidolph rotary evaporator at 40 °C. The water content was measured using Karl–Fischer coulometric titrator (Metrohm 831 KF coulometer, ±0.3%). The water content for the 1
1 mole ratio. After preparation, samples were dried under vacuum using a Heidolph rotary evaporator at 40 °C. The water content was measured using Karl–Fischer coulometric titrator (Metrohm 831 KF coulometer, ±0.3%). The water content for the 1![[thin space (1/6-em)]](https://www.rsc.org/images/entities/char_2009.gif) :
:![[thin space (1/6-em)]](https://www.rsc.org/images/entities/char_2009.gif) 1 DES samples used along this work is reported in Table 1, showing low content. The samples after preparation were kept under vacuum to avoid any additional water absorption. The considered samples are reported in Fig. 3, colorless liquid samples in the studied concentration range for cineole:menthol and cineole:thymol DES, whereas pale yellow samples are obtained for carvone:menthol and carvone:thymol, because of the pale – yellowish color of carvone.
1 DES samples used along this work is reported in Table 1, showing low content. The samples after preparation were kept under vacuum to avoid any additional water absorption. The considered samples are reported in Fig. 3, colorless liquid samples in the studied concentration range for cineole:menthol and cineole:thymol DES, whereas pale yellow samples are obtained for carvone:menthol and carvone:thymol, because of the pale – yellowish color of carvone.
![[thin space (1/6-em)]](https://www.rsc.org/images/entities/char_2009.gif) :
:![[thin space (1/6-em)]](https://www.rsc.org/images/entities/char_2009.gif) MEN (1
MEN (1![[thin space (1/6-em)]](https://www.rsc.org/images/entities/char_2009.gif) :
:![[thin space (1/6-em)]](https://www.rsc.org/images/entities/char_2009.gif) 1)
1)![[thin space (1/6-em)]](https://www.rsc.org/images/entities/char_2009.gif) :
:![[thin space (1/6-em)]](https://www.rsc.org/images/entities/char_2009.gif) THY (1
THY (1![[thin space (1/6-em)]](https://www.rsc.org/images/entities/char_2009.gif) :
:![[thin space (1/6-em)]](https://www.rsc.org/images/entities/char_2009.gif) 1)
1)![[thin space (1/6-em)]](https://www.rsc.org/images/entities/char_2009.gif) :
:![[thin space (1/6-em)]](https://www.rsc.org/images/entities/char_2009.gif) MEN (1
MEN (1![[thin space (1/6-em)]](https://www.rsc.org/images/entities/char_2009.gif) :
:![[thin space (1/6-em)]](https://www.rsc.org/images/entities/char_2009.gif) 1)
1)![[thin space (1/6-em)]](https://www.rsc.org/images/entities/char_2009.gif) :
:![[thin space (1/6-em)]](https://www.rsc.org/images/entities/char_2009.gif) THY (1
THY (1![[thin space (1/6-em)]](https://www.rsc.org/images/entities/char_2009.gif) :
:![[thin space (1/6-em)]](https://www.rsc.org/images/entities/char_2009.gif) 1)
1)
![[thin space (1/6-em)]](https://www.rsc.org/images/entities/char_2009.gif) :
:![[thin space (1/6-em)]](https://www.rsc.org/images/entities/char_2009.gif) HBD clusters at i
HBD clusters at i![[thin space (1/6-em)]](https://www.rsc.org/images/entities/char_2009.gif) :
:![[thin space (1/6-em)]](https://www.rsc.org/images/entities/char_2009.gif) j ratio. These clusters were geometrically optimized with the ORCA program46 using the B3LYP47–49 functional combined with 6-311++G(d,p) basis set and D350 dispersion contribution (semiempirical Grimme's method). The topological characterization of these clusters was done according to the Quantum Theory of Atoms in Molecule (QTAIM51) as in the MultiWFN software.52 Hydrogen bonding is characterized by the developed bond critical points (BCPs) at the interaction region. Likewise, the strength of the interactions was quantified with the interaction energies, ΔE, calculated as the difference between the total energy of the cluster minus those of the corresponding monomers, corrected according to the counterpoise method.53 The ChelpG method54 was used to calculate the atomic charges.
j ratio. These clusters were geometrically optimized with the ORCA program46 using the B3LYP47–49 functional combined with 6-311++G(d,p) basis set and D350 dispersion contribution (semiempirical Grimme's method). The topological characterization of these clusters was done according to the Quantum Theory of Atoms in Molecule (QTAIM51) as in the MultiWFN software.52 Hydrogen bonding is characterized by the developed bond critical points (BCPs) at the interaction region. Likewise, the strength of the interactions was quantified with the interaction energies, ΔE, calculated as the difference between the total energy of the cluster minus those of the corresponding monomers, corrected according to the counterpoise method.53 The ChelpG method54 was used to calculate the atomic charges.![[thin space (1/6-em)]](https://www.rsc.org/images/entities/char_2009.gif) P, pKa, and some other relevant properties. The prediction software uses quantitative structure–activity relationship and quantitative method providing a mathematical relationship approaches to obtain predictions. The input file requires the optimized geometry of the compound from DFT simulations, and Simplified Molecular Input Line Entry System (SMILES) data input format is created from the optimized structures of each system and used as input files for the ecotoxicological predictions.
P, pKa, and some other relevant properties. The prediction software uses quantitative structure–activity relationship and quantitative method providing a mathematical relationship approaches to obtain predictions. The input file requires the optimized geometry of the compound from DFT simulations, and Simplified Molecular Input Line Entry System (SMILES) data input format is created from the optimized structures of each system and used as input files for the ecotoxicological predictions.![[thin space (1/6-em)]](https://www.rsc.org/images/entities/char_2009.gif) :
:![[thin space (1/6-em)]](https://www.rsc.org/images/entities/char_2009.gif) MEN (1
MEN (1![[thin space (1/6-em)]](https://www.rsc.org/images/entities/char_2009.gif) :
:![[thin space (1/6-em)]](https://www.rsc.org/images/entities/char_2009.gif) 1)
1)![[thin space (1/6-em)]](https://www.rsc.org/images/entities/char_2009.gif) :
:![[thin space (1/6-em)]](https://www.rsc.org/images/entities/char_2009.gif) THY (1
THY (1![[thin space (1/6-em)]](https://www.rsc.org/images/entities/char_2009.gif) :
:![[thin space (1/6-em)]](https://www.rsc.org/images/entities/char_2009.gif) 1)
1)![[thin space (1/6-em)]](https://www.rsc.org/images/entities/char_2009.gif) :
:![[thin space (1/6-em)]](https://www.rsc.org/images/entities/char_2009.gif) MEN (1
MEN (1![[thin space (1/6-em)]](https://www.rsc.org/images/entities/char_2009.gif) :
:![[thin space (1/6-em)]](https://www.rsc.org/images/entities/char_2009.gif) 1)
1)![[thin space (1/6-em)]](https://www.rsc.org/images/entities/char_2009.gif) :
:![[thin space (1/6-em)]](https://www.rsc.org/images/entities/char_2009.gif) THY (1
THY (1![[thin space (1/6-em)]](https://www.rsc.org/images/entities/char_2009.gif) :
:![[thin space (1/6-em)]](https://www.rsc.org/images/entities/char_2009.gif) 1)
1)![[thin space (1/6-em)]](https://www.rsc.org/images/entities/char_2009.gif) S)
S)
![[thin space (1/6-em)]](https://www.rsc.org/images/entities/char_2009.gif) :
:![[thin space (1/6-em)]](https://www.rsc.org/images/entities/char_2009.gif) 1 HBA
1 HBA![[thin space (1/6-em)]](https://www.rsc.org/images/entities/char_2009.gif) :
:![[thin space (1/6-em)]](https://www.rsc.org/images/entities/char_2009.gif) HBD for cineole:thymol and carvone:thymol cases. Although the predictions for the eutectic compositions for cineole
HBD for cineole:thymol and carvone:thymol cases. Although the predictions for the eutectic compositions for cineole![[thin space (1/6-em)]](https://www.rsc.org/images/entities/char_2009.gif) :
:![[thin space (1/6-em)]](https://www.rsc.org/images/entities/char_2009.gif) menthol and carvone
menthol and carvone![[thin space (1/6-em)]](https://www.rsc.org/images/entities/char_2009.gif) :
:![[thin space (1/6-em)]](https://www.rsc.org/images/entities/char_2009.gif) thymol are close to 1
thymol are close to 1![[thin space (1/6-em)]](https://www.rsc.org/images/entities/char_2009.gif) :
:![[thin space (1/6-em)]](https://www.rsc.org/images/entities/char_2009.gif) 1.5, 1
1.5, 1![[thin space (1/6-em)]](https://www.rsc.org/images/entities/char_2009.gif) :
:![[thin space (1/6-em)]](https://www.rsc.org/images/entities/char_2009.gif) 1 molar mixing ratios in the lab has yielded eutectic solution, thus for all studied cases 1
1 molar mixing ratios in the lab has yielded eutectic solution, thus for all studied cases 1![[thin space (1/6-em)]](https://www.rsc.org/images/entities/char_2009.gif) :
:![[thin space (1/6-em)]](https://www.rsc.org/images/entities/char_2009.gif) 1 compositions have been considered for the experimental work. Regarding the predicted eutectic temperature, very low values are inferred for all the considered systems (especially for those containing thymol), thus confirming the wide liquid range for all the HBA:HBD compositions around the eutectic point.
1 compositions have been considered for the experimental work. Regarding the predicted eutectic temperature, very low values are inferred for all the considered systems (especially for those containing thymol), thus confirming the wide liquid range for all the HBA:HBD compositions around the eutectic point.
![[thin space (1/6-em)]](https://www.rsc.org/images/entities/char_2009.gif) 71) indicates that type V DES are less dense than type III ones. The temperature evolution of density follows a linear decrease which allowed the calculation of isobaric thermal expansion coefficient, αp, Fig. 7b. The αp values are in the 0.8 to 0.92 kK−1, which are larger than for most of the type III DES (usually lower than 0.8 kK−1).72–74
71) indicates that type V DES are less dense than type III ones. The temperature evolution of density follows a linear decrease which allowed the calculation of isobaric thermal expansion coefficient, αp, Fig. 7b. The αp values are in the 0.8 to 0.92 kK−1, which are larger than for most of the type III DES (usually lower than 0.8 kK−1).72–74


![[double bond, length as m-dash]](https://www.rsc.org/images/entities/char_e001.gif) , with a minimum value ranging from −1.5 eV and −1.6 eV and the positive region is mostly on the methyl groups over the HBA. Thus, the positive charge is more spread over the C–H of the HBD and C
, with a minimum value ranging from −1.5 eV and −1.6 eV and the positive region is mostly on the methyl groups over the HBA. Thus, the positive charge is more spread over the C–H of the HBD and C![[double bond, length as m-dash]](https://www.rsc.org/images/entities/char_e001.gif) O.
O.


.
.
.
.
.
.
.
.
.
.
.
.
.
.
.
.
.
.
.
.
.
.
.
.
.
.
.
.
.
.
.
.
.
.
.
.
.
.
.
.
.
.
.
.
.
.
.
.
.
.
.
.
.
.
.
.
.
.
.
.
.
.
.
.
.
.
.
.
.
.
.
.
.
.
.
.
.
.
.
.
.
.
.
.
.
.
.
.
.


