
 Open Access Article
 This Open Access Article is licensed under a Creative Commons Attribution-Non Commercial 3.0 Unported Licence
Transfer learned potential energy surfaces: accurate anharmonic vibrational dynamics and dissociation energies for the formic acid monomer and dimer†
Silvan
Käser
 and
Markus
Meuwly
*
and
Markus
Meuwly
*
Department of Chemistry, University of Basel, Klingelbergstrasse 80, CH-4056 Basel, Switzerland. E-mail: m.meuwly@unibas.ch
First published on 26th October 2021
Abstract
The vibrational dynamics of the formic acid monomer (FAM) and dimer (FAD) is investigated from machine-learned potential energy surfaces at the MP2 (PESMP2) and transfer-learned (PESTL) to the CCSD(T) levels of theory. The normal mode (MAEs of 17.6 and 25.1 cm−1) and second order vibrational perturbation theory (VPT2, MAEs of 6.7 and 17.1 cm−1) frequencies from PESTL for all modes below 2000 cm−1 for FAM and FAD agree favourably with experiment. For the OH stretch mode the experimental frequencies are overestimated by more than 150 cm−1 for both FAM and FAD from normal mode calculations. Conversely, VPT2 calculations on PESTL for FAM reproduce the experimental OH frequency to within 22 cm−1. For FAD the VPT2 calculations find the high-frequency OH stretch at 3011 cm−1, compared with an experimentally reported, broad (∼100 cm−1) absorption band with center frequency estimated at ∼3050 cm−1. In agreement with earlier reports, MD simulations at higher temperature shift the position of the OH-stretch in FAM to the red, consistent with improved sampling of the anharmonic regions of the PES. However, for FAD the OH-stretch shifts to the blue and for temperatures higher than 1000 K the dimer partly or fully dissociates using PESTL. Including zero-point energy corrections from diffusion Monte Carlo simulations for FAM and FAD and corrections due to basis set superposition and completeness errors yields a dissociation energy of D0 = −14.23 ± 0.08 kcal mol−1 compared with an experimentally determined value of −14.22 ± 0.12 kcal mol−1.
1 Introduction
Vibrational spectroscopy is a powerful means to relate the structure and dynamics of molecules in the gas phase1 and in solution.2,3 Combined with state-of-the art atomistic simulation techniques, molecular-level information related to the structural dynamics of spectroscopic reporters (–CO, –NO, –SCN, –N3),4–8 or the thermodynamics in protein–ligand complexes9,10 can be obtained. One of the pertinent questions is (a) whether or not classical molecular dynamics (MD) simulations can be used for accurate vibrational dynamics and (b) what level of theory and accuracy in representing the energies from electronic structure calculations is required for a meaningful contribution of simulations to assigning and interpreting experimentally determined spectra. Electronic structure calculations and their representations as full-dimensional potential energy surfaces (PESs) have progressed to a degree that now allows direct comparison with experiments.11,12Generating full-dimensional, reactive PESs even for small molecules is a challenging task.12,13 This often requires datasets consisting of tens of thousands of ab initio calculations to adequately describe configurational space of the system of interest. While calculations at the density functional theory (DFT) or Møller–Plesset perturbation (MP2) levels of theory are cost-efficient, reaction barriers are less accurate.14 On the other hand, the “gold standard” coupled cluster with perturbative triples (CCSD(T)) approach scales as N7 (with N being the number of basis functions)15 which becomes quickly computationally prohibitive for full-dimensional PESs even for moderately sized molecules (Natoms ∼ 10). Recent applications of novel machine learning (ML) approaches combined with transfer learning (TL)16–18 and related Δ-ML19 in physical/computational chemistry14,18,20–23 were shown to be data and cost-effective alternatives which will also be explored in the present work.
Formic acid (HCOOH), the simplest carboxylic acid, is an important intermediate in chemical synthesis and relevant to atmospheric chemistry.24 It is also a promising fuel and H2 carrier25,26 which can be produced by electrocatalytic CO2 reduction reactions and, thus, may contribute to decreasing atmospheric CO2 levels.26,27 Formic acid monomer (FAM) and its dimer (formic acid dimer, FAD) have been the subject of several experimental28–35 and theoretical34,36–45 studies. In the vapor phase, formic acid exists as hydrogen bonded dimers46 making it a prototype for complexes with hydrogen bonds such as enzymes or DNA base pairs.47 The experimental IR spectrum has been reported for both, FAM and FAD.28,30,34,48–53
For FAM a recent study of both, cis- and trans-FAM, analyses a global PES constructed using regression techniques with energies from CCSD(T)(F12*)/cc-pVTZ-F12 calculations as the reference.39 Vibrational eigenstates for both conformers were calculated using vibrational configuration interaction (VCI) and the fundamentals for trans-FAM were found to be in close agreement with experiment (RMSD = 3 cm−1). Subsequently, a second full-dimensional CCSD(T)-F12a/aug-cc-pVTZ based PES for the two FAM conformers was used in multi-configuration time-dependent Hartree (MCTDH) vibrational calculations.45 The trans fundamental transitions were found to agree to within 5 cm−1 with experiment. Additionally, vibrational states of deuterated cis- and trans-FAM were calculated using the block-improved relaxation method.54 The two PESs39,45 are further analyzed in detail in ref. 55 and are used for comparison with experiments for FAM and deuterated isotopologues of both isomers. Vibrational eigenstates were obtained from high order canonical Van Vleck perturbation theory (CVPT). Such high level anharmonic treatments of vibrations on high quality PESs are crucial for understanding and potentially (re)assigning experimental spectra as was found for trans-FAM:39,45,55 assignment of the O–H in plane bend ν5 which is in resonance with the O–H torsional overtone 2ν9 has been ambiguous for a long time. Based on the high-level calculations the fundamental was assigned to 1306 cm−1 and the overtone to a spectroscopic feature at 1220 cm−1. This assignment was subsequently supported by Raman jet experiment.50 Interestingly, this reassignment was recently supported from second order vibrational perturbation theory (VPT2) calculations using a neural network-(NN) based PES.23
For FAD a considerable amount of computational work has been done on its dynamics,56,57 infrared (IR) spectroscopy34 and tunneling splittings.40,41 A recent PES based on 13475 CCSD(T)-F12a energies with the cc-pVTZ and aug-cc-pVTZ basis sets for H and C/O atoms (CCSD(T)-F12a/haTZ), respectively, was fit to permutationally invariant polynomials40 which reported a barrier for double proton transfer of 2853 cm−1 (8.16 kcal mol−1). This was used for computing the zero-point energy (ZPE) based on diffusion Monte Carlo (DMC) calculations, for vibrational self consistent field (VSCF)/VCI calculations of fundamentals and to determine ground-state tunneling splittings in a reduced-dimensional approach. The tunneling splitting obtained was 0.037 cm−1 which is larger than the experimentally reported value58,59 of 0.016 cm−1. Subsequently,41 the same PES was used for computing tunneling splittings without reducing the dimensionality of the problem using the ring-polymer instanton approach.60 The value of 0.014 cm−1 was considerably closer to experiment and a more recent measurement based on IR techniques reported a tunneling splitting of 0.011 cm−1.61
More recently the CCSD(T)-F12a PES was extended with a new dipole moment surface (DMS) at the MP2/haTZ level of theory and used for the analysis of the FAD IR spectrum.42 Both, VSCF and VCI calculations were performed and compared with results from classical and “semi-classically” prepared quasiclassical MD simulations and experiment.43 Classical MD corresponds to NVE simulations run at 300 K whereas the harmonic ZPE is added in the “semi-classically” prepared approach. For both approaches, the X–H stretch frequencies remain at higher frequencies compared to experiment. This effect is ascribed to the inability of MD simulations to correctly sample anharmonicities. The high-quality PES and DMS42 were recently employed to assess the fingerprint region of FAD using variational vibrational computations and curvilinear kinetic energy operator representation.62
Experimentally, the dissociation energy of FAD into two FAMs has been determined from spectroscopy and statistical thermodynamics to be D0 = 59.5(5) kJ mol−1 (∼14.22 kcal mol−1).33 For the double proton transfer barrier, the most recent value from microwave spectroscopy (measured tunneling splitting of 331.2 MHz) is 2559 cm−1 (30.6 kJ mol−1 or 7.3 kcal mol−1) from analysis of a 3D model.63 This is consistent with a best value of 7.2 kcal mol−1 from a morphed MP2 surface that was determined from atomistic simulations and compared with IR experiments of the proton transfer band.34 Earlier experiments reported a larger splitting of 0.0158 cm−1 (corresponding to 473.7 MHz) which yields a somewhat higher barrier for double proton transfer.58 Yet more recent work in the infrared found 0.011367 cm−1 (340.8 MHz) which is closer to the most recent microwave data.61
In order to assess the expected magnitude of error cancellation due to shortcomings in the electronic structure method used and the fact that MD-based spectroscopy only samples the bottom of the potential well at ambient conditions, extensive higher-level calculations at the MP2 and CCSD(T) levels of theory were carried out together with the aug-cc-pVTZ basis set. This reference data was then represented as a NN based on the PhysNet architecture.64 Additionally, TL16–18 to the CCSD(T)/aug-cc-pVTZ level of theory was used to further improve the quality of the PES. Using these PESs for formic acid monomer and dimer, the harmonic and anharmonic vibrations, and the IR spectrum from finite-temperature MD simulations are determined. From this the complexation-induced red shifts can be determined and compared with experiment. Furthermore, DMC simulations are run to obtain an estimate for the ZPE of both molecules. The DMC calculations are a meaningful probe for the robustness of the PES and the resulting ZPEs are used for the determination of the binding energy of the dimer.
First, the methods are presented and discussed. Next, the accuracy of the NN-based PESs is assessed and the vibrational spectra for FAM and FAD are determined and compared with experiment. Then, the results from DMC simulations are presented and, finally, the results are discussed and conclusions are drawn.
2 Computational details
2.1 Electronic structure calculations and PhysNet representation
The PESs for FAM and FAD are represented by a NN of the PhysNet architecture,64 which has been used for different chemical systems recently.20,21,65–68 PhysNet is a high-dimensional NN69 of the “message-passing” type.70 It constructs a feature vector for each atom in a molecule describing the atom's local chemical environment. These feature vectors (descriptors) are iteratively refined (learned) and used to predict atomic contributions to the total energy E and partial charges qi. The forces Fi needed to run MD simulations are obtained from reverse-mode automatic differentiation71 and the molecular dipole moment is calculated from the partial charges following . Details of the PhysNet approach are described elsewhere.64 The parameters of PhysNet are fitted to ab initio energies, forces and dipole moments calculated at the MP272/aug-cc-pVTZ73 level of theory using Molpro.74
A dataset of reference structures is required for training PhysNet. An ensemble of 20![[thin space (1/6-em)]](https://www.rsc.org/images/entities/char_2009.gif) 000 FAM (5000) and FAD (15000) geometries are generated from Langevin dynamics at 2000 K using the atomic simulation environment (ASE)75 at the PM7 level of theory.76,77 For FAD, the transition state (TS) region is sampled by harmonically biasing the geometry toward the TS structure, similar to the umbrella sampling approach.78 This dataset is extended with geometries of fragments of the FAM molecule (H2, CH4, H2O, CO, H3COH, H2CO) following the amons approach.79 For the amons, 1000 geometries each are generated using Langevin dynamics at 1000 K. Based on initial PhysNet representations of the PES, the dataset was extended with one round of adaptive sampling.80,81 The final MP2 dataset contains 26000 reference structures and was split randomly according to 20800/2600/2600 for training/validation/testing. Henceforth, this PES is referred to as PESMP2.
000 FAM (5000) and FAD (15000) geometries are generated from Langevin dynamics at 2000 K using the atomic simulation environment (ASE)75 at the PM7 level of theory.76,77 For FAD, the transition state (TS) region is sampled by harmonically biasing the geometry toward the TS structure, similar to the umbrella sampling approach.78 This dataset is extended with geometries of fragments of the FAM molecule (H2, CH4, H2O, CO, H3COH, H2CO) following the amons approach.79 For the amons, 1000 geometries each are generated using Langevin dynamics at 1000 K. Based on initial PhysNet representations of the PES, the dataset was extended with one round of adaptive sampling.80,81 The final MP2 dataset contains 26000 reference structures and was split randomly according to 20800/2600/2600 for training/validation/testing. Henceforth, this PES is referred to as PESMP2.
To further improve the quality of the PES, TL16–18 from the MP2 to the CCSD(T) level of theory was performed. The data set for TL contained 866 geometries: 425 for FAM and 441 for FAD. For FAM, they were generated from normal mode sampling82 at different temperatures (between 10 and 2000 K) and geometries for FAD were those along the minimum energy path (MEP), along particular normal modes and geometries obtained from normal mode sampling. Ab initio energies, forces and dipole moments for the 866 geometries were determined at the CCSD(T)/aug-cc-pVTZ73,83,84 level of theory using MOLPRO.74 Then, the PhysNet model was retrained on the TL-data set by initializing the NN with the parameters from the trained NN at the MP2 level as a good initial guess. The data set was split randomly according to 85/10/5% into training/validation/test set and the learning rate was reduced to 10−4 compared with 10−3 when learning a model from scratch. The final TL PES is referred to as PESTL.
2.2 Vibrational calculations
Harmonic and anharmonic frequencies can be determined using PESMP2 and PESTL. First, harmonic frequencies are computed from diagonalization of the mass-weighted Hessian matrix. Next, anharmonic frequencies are obtained (i) from finite-temperature IR spectra calculated from the dipole–dipole autocorrelation function85–87 of MD simulations and (ii) from VPT2 as implemented in the Gaussian software88 using PESMP2 and PESTL as external potentials.Finite-temperature MD simulations were carried out using ASE75 and PESMP2 and PESTL. The trajectories are started from the equilibrium geometry of FAM and FAD, respectively, and initialized with random momenta drawn from a Maxwell–Boltzmann distribution corresponding to 300 K and the simulations are carried out in the NVE ensemble with a time step of Δt = 0.5 fs. After equilibration for 50 ps the simulations are propagated for 200 ps. The molecular dipole moment μ(t) is recorded for structures separated by 0.5 fs and the dipole–dipole autocorrelation is computed as C(t) = 〈μ(0)μ(t)〉. Infrared spectra C(ω) are then obtained by Fourier transformation of C(t) and applying a Blackman filter. All finite-temperature spectra are averages over 1000 independent NVE MD simulations.
2.3 Diffusion Monte Carlo
DMC calculations are used to determine ZPEs (i.e. the quantum ground state energy) for FAM and FAD, and to examine PESTL for holes. Here, the unbiased DMC algorithm was used.14,89,90 A set of thousands to tens of thousands of random walkers is initialized and subsequently the atoms in each walker are displaced randomly at every timestep. The ensemble of walkers represents the nuclear wavefunction of the molecule. Based on a walker's potential energy Ei with respect to a reference energy, Er, they remain alive and can give birth to new walkers, or can be killed. The walkers die and replicate according to the following probabilities:14| Pdeath = 1 − e−(Ei−Er)Δτ (Ei > Er) | (1) |
| Pbirth = e−(Ei−Er)Δτ − 1 (Ei < Er). | (2) |
 | (3) |
Following ref. 14, the DMC calculations were performed in Cartesian coordinates and in full dimensionality. For both, FAM and FAD, ten independent DMC simulations were performed. To obtain an estimate of the ZPEs 30000 walkers were advanced for 50000 time steps following an equilibration period of 5000 time steps. A step size of Δτ = 5.0 a.u. was used. For converging the DMC simulations outlined above and to obtain statistically meaningful results more than 3 × 10¹⁰(= 30000 × 55000 × 10 × 2) energy evaluations were required in total. The computational efficiency of a PES is crucial for DMC simulations which requires a large number of energy evaluations. The Tensorflow library,91 in which PhysNet is implemented, allows training and evaluation of the NN on graphics processing units (GPUs). The use of GPUs for the evaluation of PhysNet speeds up the calculations as they can be performed in a highly parallel manner.92 Here, all DMC calculations were performed on a GeForce RTX 2080Ti GPU with 12 Gb of RAM. Each DMC simulation for FAM (FAD) takes 8.7 (23.7) h on average.
3 Results
3.1 Quality of the PhysNet PESMP2 and PESTL
First, the quality of the NN-learned energy functions is considered. To assess the reproducibility of the PhysNet models, two independent models are trained for the MP2 reference data. Both are evaluated on a test set containing 2600 randomly chosen structures of the dataset which were not used during training. The model yielding lower mean absolute and root mean squared errors (MAE and RMSE) on the test set is then used for the simulations and for TL. The out of sample performances of both PESMP2 and PESTL are summarized in Table 1 and Fig. 1.| PES1MP2 | PES2MP2 | PESTL | |
|---|---|---|---|
| MAE(E) | 0.012 | 0.014 | 0.007 |
| RMSE(E) | 0.019 | 0.028 | 0.016 |
| MAE(F) | 0.026 | 0.029 | 0.076 |
| RMSE(F) | 0.195 | 0.411 | 0.580 |
| MAE(μ) | 0.001 | 0.001 | 0.002 |
| RMSE(μ) | 0.002 | 0.002 | 0.008 |
| 1 − R2(E) | 3.7 × 10⁻⁹ | 8.5 × 10⁻⁹ | 4.1 × 10⁻⁹ |
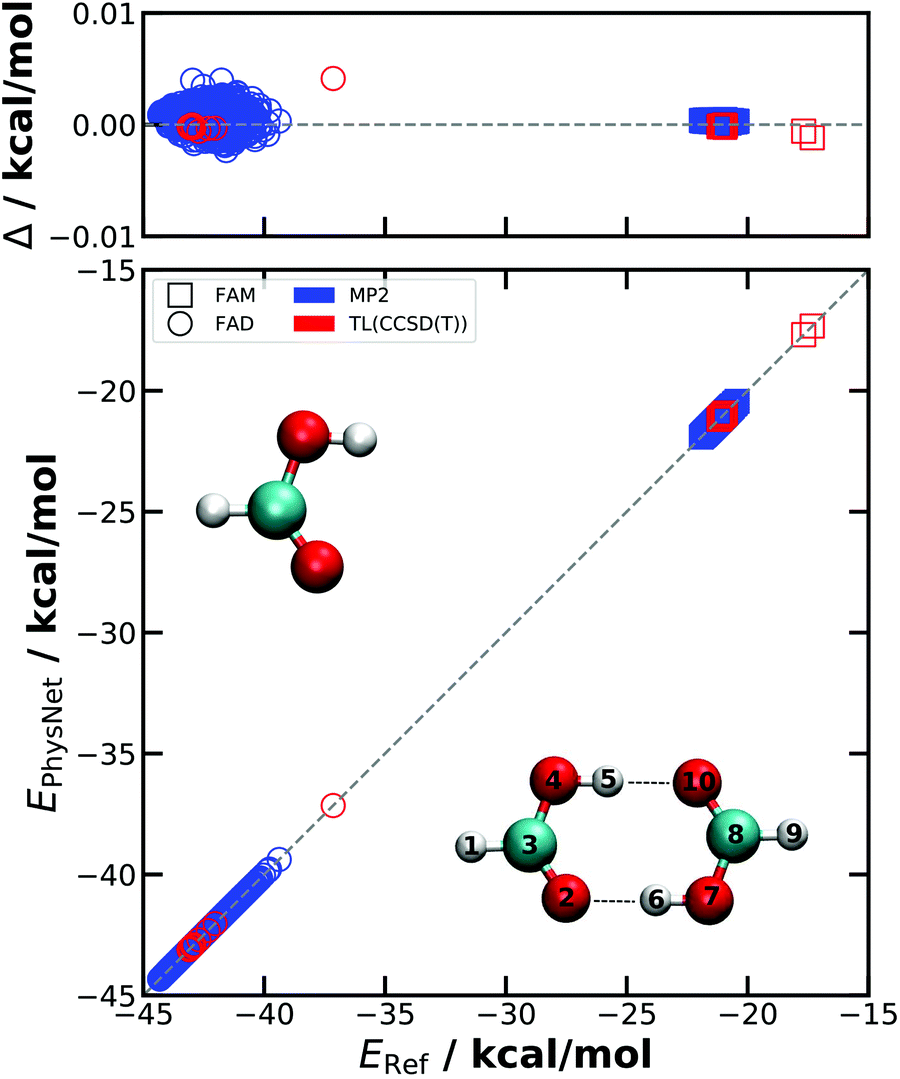 | ||
| Fig. 1 The accuracy of the PESMP2 and PESTL energies is shown with respect to the appropriate reference ab initio values taken from the separate test sets. For PESMP2, only the performance of the superior model is shown and only FAM and FAD geometries of the test set are considered. The deviations Δ = ERef−EPhysNet for geometries in the test sets remain well below 0.01 kcal mol−1. The structures of FAM and FAD are shown together with labels and the hydrogen bonds indicated by dotted lines. | ||
The better of the two PESMP2 is characterized by MAE(E) = 0.012 kcal mol−1, RMSE(E) = 0.019 kcal mol−1, MAE(F) = 0.026 kcal mol−1 Å−1 and RMSE(F) = 0.195 kcal mol−1 Å−1. Accuracies similar to PESMP2 are achieved for PESTL, although the test set (44 geometries) is smaller than for learning at the MP2 level: the performance is MAE(E) = 0.007 kcal mol−1, RMSE(E) = 0.016 kcal mol−1, MAE(F) = 0.076 kcal mol−1 Å−1, and RMSE(F) = 0.580 kcal mol−1 Å−1, see Table 1 which also reports results for the dipole moments.
The quality of PESMP2 can also be assessed in terms of molecular geometries and the energy barrier for double proton transfer. The MP2/AVTZ optimized geometries of FAM, FAD and the proton transfer TS (see Tables S1–S3, ESI†) are reproduced by PESMP2 with RMSEs smaller than 0.003 Å. The energy barrier for PESMP2 is 6.69 kcal mol−1 compared with 6.71 kcal mol−1 from ab initio calculations, i.e. a difference of 0.02 kcal mol−1. The proton transfer barrier, which is underestimated at the MP2 level of theory, is one of the essential features of the FAD PESTL. Earlier studies at the coupled cluster level of theory yielded barrier heights of 7.95, 8.16 and 8.30 kcal mol−1 using the CCSD(T)-F12a/haDZ, CCSD(T)-F12a/haTZ//CCSD(T)-F12a/haDZ and CCSD(T)/aV5Z//MP2/aV5Z level of theory, respectively.37,40 The barrier for DPT at the CCSD(T)/aug-cc-pVTZ level was found to be 7.9 kcal mol−1.34 This agrees favourably with a barrier of 7.92 kcal mol−1 from the present PESTL. The experimental barrier height is estimated to be 7.3 kcal mol−1 using a 3D-model to reproduce the tunneling splitting of 331.2 MHz.63 A somewhat lower barrier for DPT (7.2 kcal mol−1) was also found from morphing an MP2-based full-dimensional PES to reproduce the experimentally observed, broad IR absorption from finite-temperature MD simulations.34
The dissociation energy De on PESTL for FAD into two FAMs is −16.79 kcal mol−1 which is identical to that from explicit ab initio calculations at the CCSD(T)/AVTZ level of theory.38 Because the training set for the full-dimensional PES contains structures of FAM and FAD, dissociation along the reaction path connects the minimum energy structures of the two asymptotic states (2 separate FAMs and FAD, respectively).
3.2 Harmonic frequencies
The FAM harmonic frequencies calculated from the two PhysNet PESs are compared to their respective MP2 and CCSD(T) reference values in Fig. 2 (squares) and Table S4 (ESI†) reports all frequencies. The harmonic frequencies on PESMP2 reproduce their reference frequencies with a MAE of 0.2 cm−1. It is noteworthy that PESTL is able to reproduce the CCSD(T) harmonic frequencies of FAM with a MAE of 0.2 cm−1 with only 425 FAM geometries used in the TL. | ||
| Fig. 2 The accuracy of harmonic frequencies using PESMP2 and PESTL compared with the corresponding reference ab initio values. The FAD CCSD(T) values are taken from ref. 36. Almost no error is visible for FAM whereas errors up to ∼30 cm−1 are found for FAD. | ||
Similarly for FAD, the PhysNet harmonic frequencies are compared with those from direct ab initio calculations in Fig. 2 (circles) and Table S5 (ESI†). Frequencies from PESMP2 match the ab initio harmonic frequencies with a MAE of 2.1 cm−1 and a maximum unsigned deviation of 7 cm−1 for mode 24. For FAD the harmonic frequencies on PESTL show a somewhat larger MAE than frequencies from PESMP2. The reference CCSD(T)/aug-cc-pVTZ harmonic frequencies were those from ref. 36. The MAE between reference frequencies and those from PESTL is 10.7 cm−1 and deviations up to ∼30 cm−1 for single frequencies occur.
3.3 VPT2 calculations
VPT2 calculations are carried out for FAM and FAD using PESMP2 and PESTL as a complement to finite-T spectra, see Fig. 3 and 4 and Table 2. The VPT2 frequencies for FAM obtained from PESTL agree well with experiment (MAE of 8.4 cm−1) for which the largest deviation is found for the highest frequency mode, i.e. a difference of 22.2 cm−1. The corresponding intensities capture the general trend of the experiment and, converse to the finite-T spectra (see below), even the intensities of the two lowest modes agree with experiment (see Fig. 3). For FAD, the MAE of the VPT2 frequencies is 19.3 cm−1 compared with experiment whereas the intensities agree favourably (see Fig. 4). For FAD the MAEs of the VPT2 calculations on the two NN-learned PESs with respect to MP2 reference and experiment are 6.4 cm−1 (PESMP2) and 19.3 cm−1 (PESTL), respectively. For PESTL the deviations are largest for the low (modes 1 to 6, MAE of 30.2 cm−1) and high frequency vibrations (modes 22 to 24), see Table 2. | ||
| Fig. 3 Infrared spectrum of FAM obtained from PESMP2 (blue) and from PESTL (red) using finite-T simulations (IR) and the VPT2 approach. The results are complemented with experimental frequencies for comparison.29,39 The gray dashed lines indicate the positions of the experimental frequencies and the XH peaks are scaled for better readability. The intensities of the VPT2 calculation capture the general trend of the experimental measurements whereas it is less clear for the finite-T spectra. The finite-T spectra (IR) are calculated from the dipole–dipole auto-correlation function of 1000 MDs each run for 200 ps with PESMP2 and PESTL at 300 K. | ||
 | ||
| Fig. 4 Infrared spectrum of FAD obtained from the PESMP2 (panel A) and from the PESTL (panel B) using finite-T simulations (A and B) and the VPT2 approach (C). The results are complemented with experimental frequencies33,36 and intensities for 7 fundamentals104 (D). Six intensities of ref. 104 were estimated based on experimental data from ref. 105 and extended with one intensity from ref. 106. Experimentally, the intensity of the OH stretch is distributed over a much wider frequency range.30 The gray dashed lines indicate the positions of the observed fundamental frequencies. The finite-T spectra (IR) are calculated from the dipole–dipole auto-correlation function of 1000 MDs each run for 200 ps with the PESMP2 and PESTL at 300 K. | ||
| FAM | FAD | |||||||
|---|---|---|---|---|---|---|---|---|
| PESMP2 | MP2 | PESTL | Expa | PESMP2 | MP2 | PESTL | Exp | |
| 1 | 619.9 | 619.5 | 621.6 | 626.17 | 78.0 | 70.2 | 91.6 | 69.2b |
| 2 | 643.0 | 641.8 | 632.2 | 640.73 | 178.5 | 160.4 | 164.4 | 161.0c |
| 3 | 1036.7 | 1036.4 | 1029.1 | 1033.47 | 185.0 | 171.0 | 200.9 | 168.5b |
| 4 | 1097.2 | 1098.2 | 1098.6 | 1104.85 | 206.2 | 197.3 | 229.4 | 194.0c |
| 5 | 1222.2 | 1220.6 | 1296.0 | 1306.2 | 255.8 | 246.0 | 265.8 | 242.0c |
| 6 | 1380.7 | 1381.0 | 1374.9 | 1379.05 | 281.1 | 271.9 | 327.6 | 264.0d |
| 7 | 1761.3 | 1760.5 | 1768.2 | 1776.83 | 686.4 | 678.5 | 679.6 | 682.0c |
| 8 | 2975.4 | 2967.8 | 2935.3 | 2942.06 | 713.4 | 707.6 | 707.4 | 698.0b |
| 9 | 3549.8 | 3554.9 | 3548.3 | 3570.5 | 945.2 | 936.0 | 925.6 | 911.0e |
| 10 | 971.6 | 966.1 | 958.1 | 942f | ||||
| 11 | 1065.2* | 1062.6 | 1075.4 | 1050g | ||||
| 12 | 1083.9* | 1076.6 | 1084.6 | 1060h | ||||
| 13 | 1237.1 | 1233.0 | 1238.2 | 1214h | ||||
| 14 | 1238.4 | 1240.6 | 1240.1 | 1233.9i | ||||
| 15 | 1370.4 | 1369.2 | 1371.2 | 1371.78i | ||||
| 16 | 1376.7 | 1373.2 | 1374.4 | 1375h | ||||
| 17 | 1403.0* | 1407.6 | 1406.6 | 1415g | ||||
| 18 | 1426.7* | 1430.7 | 1435.0 | 1454b | ||||
| 19 | 1662.6 | 1659.1 | 1661.6 | 1666k | ||||
| 20 | 1732.9 | 1732.9 | 1734.5 | 1741k | ||||
| 21 | 2763.0* | 2763.5 | 2875.0 | 2900d | ||||
| 22 | 2945.4* | 2961.7 | 2912.3 | 2939.7l | ||||
| 23 | 2961.8 | 2962.9 | 2920.1 | 2949h | ||||
| 24 | 2968.5 | 2963.4 | 3011.2 | 3050b | ||||
| MAE | 2.0 | 8.4 | 6.4 | 19.3 | ||||
One interesting observation concerns the correct assignment55 of the fundamental ν5 (mode 5 in Table 2) and 2ν9 (first overtone of mode 2 in Table 2) modes in FAM. VPT2 calculations using PESTL find ν5 at 1296.0 cm−1 and 2ν9 = 1211.9 cm−1 which is consistent with recent Raman data measured in a jet reporting a frequency of 1306 cm−1 and 1220 cm−1 for the fundamental and the overtone, respectively.50 VPT2 calculations at the MP2 level using PESMP2, on the other hand, find ν5 = 1220.6 and 2ν9 = 1297.9 cm−1, i.e. the opposite assignment compared with experiment and calculations at the higher level of theory.
For the errors of the VPT2 calculation of FAD there are several potential reasons. First, PESTL is less accurate in reproducing harmonic frequencies at the CCSD(T) level. Secondly, the low frequency harmonic modes 1 to 6 agree well with experiment (see Table S5, ESI†). However, VPT2 determines anharmonic corrections to be added to or subtracted from the harmonic frequencies. Hence, if the harmonic frequencies agree well with experiment, the VPT2 frequencies potentially differ from experimental values and the disagreement is larger for larger anharmonic corrections as is often the case for low frequency vibrations. Thirdly, VPT2 calculations also may incur larger errors, in particular for proton-bound dimers with large amplitude motions.98 Finally, the above errors can also accumulate which then leads to worse agreement between experimentally observed and computed anharmonic frequencies despite the high quality of PESTL. It should be noted that VPT2 calculations at the CCSD(T) level using conventional electronic structure codes for FAM is computationally demanding and for FAD it is unfeasible. To this end, more approximate, hybrid schemes using harmonic frequencies from a higher calculation (e.g. CCSD(T)) and anharmonic corrections calculated at a lower level of theory (e.g. MP2) were applied for FAD.38 Alternatively, reduced-dimensionality (RD) approaches such as RD-VPT2 exist.99
3.4 Finite-T infrared spectra
The experimental Fourier Transform transmittance spectrum of FAD recorded in a jet reported30 a broad band with superimposed sharp features extending from below 2600 cm−1 up to at least 3300 cm−1. The sharp features arise mostly from combination bands and make it difficult to assign one specific absorption feature to the OH stretch vibration. However, it is reasonable to assume that it is located to the blue side of the CH-stretch band rather than to the red side of it. Interestingly, the width of the jet-cooled spectrum is comparable to that recorded at room temperature. Hence, cooling only leads to sharpening of certain features but not to a simpler spectrum. This is consistent with other studies on formic and acetic acid.31,101 A potential assignment of the OH stretch vibration in FAD was made30 to a signature at 3084 cm−1 by comparing with earlier calculations (SCF with double zeta basis set).102 Similarly, earlier Raman spectra of (DCOOH)2 reported a broad absorption around and above 3000 cm−1 and assigned features between 2565 cm−1 and 3427 cm−1 to the dimer OH stretching band.103 Finally, a broad absorption was also found from lower resolution, room temperature IR spectroscopy34 for which spectral subtraction techniques were used to obtain the IR spectrum of FAD. The transition assigned to the OH-stretch was the region between 2600 and 3400 cm−1 with a maximum at ∼3100 cm−1.34 Hence, assignment of the OH-stretch frequency is not straightforward. Here, a position of 3050 ± 100 cm−1 was used to compare with. However, it needs to be stressed that considerable uncertainty about both, the position and the width of this band exist.
The failure of finite-T MD simulations to even qualitatively capture the spectroscopy of high-frequency modes is primarily related to the fact that at T ∼ 300 K, at which most MD studies are carried out, the anharmonicities of X–H vibrations are not sampled adequately. Because constraining the correct amount of ZPE in the modes of polyatomic molecules is as of now an unsolved problem,43 an alternative that has been considered is to run MD simulations at higher temperature.43,100 Here, simulations with increasing amount of energy in the OH stretch of FAM and FAD have been carried out using PESTL. The NVE simulations are run with excess energies of 0.1, 0.3, 0.6, and 0.9 eV for FAM and of 0.1 and 0.3 eV for FAD in each of the OH stretch modes. For comparison, the (harmonic) ZPE of FAM in this mode is 1647 cm−1 (equivalent to 0.2 eV). This energy is initially placed into the OH stretch(es) as kinetic energy. The E-dependent IR spectra (Fig. 5) correspond to an ensemble of 45 trajectories run for 200 ps each. For FAM it was found that with increasing energy content in the OH stretch the associated band shifts progressively towards the red as expected. With an excess of 0.5 eV the computed OH stretch aligns with that reported from experiment.
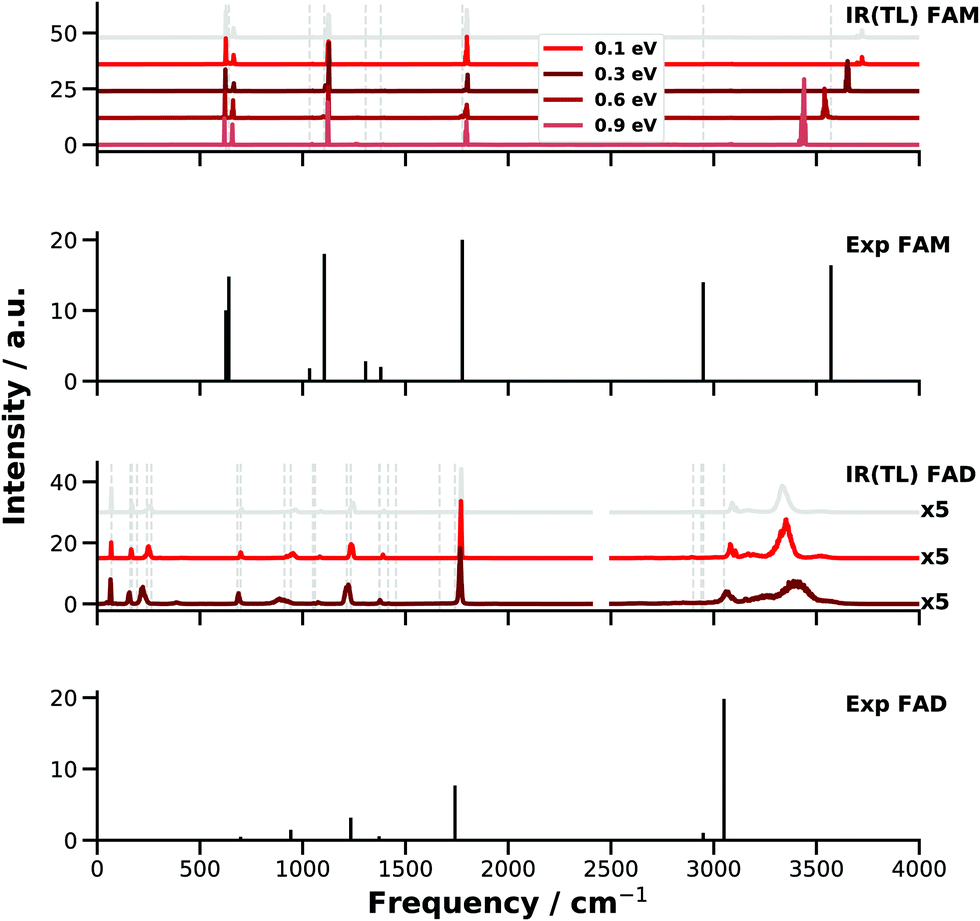 | ||
| Fig. 5 IR spectra from E-dependent MD simulations for FAM and FAD with PESTL. For comparison, for FAM the harmonic ZPE of the OH stretch is 0.23 eV and the total ZPEs are ∼0.9 and 1.9 eV. The grey vertical lines mark the peak positions of the experiments29,39 and the grey spectra are calculated from room temperature simulations on PESTL (see Fig. 3 and 4). For FAM a clear energy dependence is seen: the OH peak ∼3725 cm−1 with an energy of 0.1 eV shifts to the red and reaches ∼3435 cm−1 with an energy of 0.9 eV. This energy dependence was not achieved for FAD, for which the OH stretch peak was mainly broadened and blue shifted for 0.3 eV. In contrast, the C–H peak is red shifted as expected. For FAD, the IR signals above 2500 cm−1 are scaled by a factor of 5 for better visibility. | ||
Even though the energy redistribution to the lower frequency modes does occur on the time scale of the simulations the spectroscopic features below 2000 cm−1 do not respond strongly to the increased temperature. To assess the redistribution of vibrational energy a supplemental trajectory is run for FAM with an excess of 0.5 eV in the OH stretch mode. The energy remains in this mode for at least 150 ps after which it slowly redistributes into other degrees of freedom, see Fig. S1 (ESI†).
For FAD running the simulations at higher temperature apparently does not solve the problem of overestimating the location of the XH bands. As one additional complication, the binding energy, i.e. EFAD − 2EFAM, of the dimer is only −16.79 kcal mol−1 (−0.73 eV). Hence, excitation of the two OH stretch vibrations with more than ∼8.5 kcal mol−1 (∼0.35 eV) leads to dissociation of the dimer and the spectroscopy of the H-bonded OH⋯O motifs can not be probed. For the simulations with 0.1 eV of excess the OH⋯O hydrogen bond (distance between O10 and H5 or O2 and H6, see Fig. 1) extends up to 2.3 Å compared with an equilibrium separation of 1.68 Å. With an excess of 0.3 eV the two OH⋯O “bonds” elongate up to 3.3 Å. This indicates considerable destabilization of the dimer due to partial breaking of the hydrogen bonds and the two FAMs in the dimer start to behave more like monomers without fully dissociating FAD. Loosening the OH⋯O contact affects, however, the vibrational frequency of the OH stretch. Visual inspection also shows that an out of plane bending motion of the two monomers is excited due to vibrational energy redistribution which further weakens the OH⋯O hydrogen bond. For the simulations of FAD with 0.3 eV excess the OH stretch shifts to the blue by ∼70 cm−1 whereas the CH stretch shifts to the red as expected for simulations at higher temperature.
3.5 Diffusion Monte Carlo and binding energy D0
The ML PESs can also be used to determine the dissociation energy D0 of FAD from computations. For this, a high-quality estimate for the total ZPE for FAM and FAD is required which can be obtained from DMC simulations. The average ZPE from 10 independent DMC simulations for FAM using the PESTL is 20.932 ± 0.033 kcal mol−1 (7321.1 ± 11.5 cm−1). Similarly for FAD a ZPE of 43.741 ± 0.013 kcal mol−1 (15298.9 ± 4.5 cm−1) was found. The average DMC energies and standard deviations are determined from block averaging.107 These ZPEs (accounting for anharmonicity) compare also favourably with 20.900 and 43.885 kcal mol−1, respectively, for the monomer and the dimer from the VPT2 calculations using the same PES (PESTL). Similarly, the result for FAD also agrees well with a recent study using a PES based on permutationally invariant polynomials at the CCSD(T)-F12a/haTZ level of theory and DMC calculations which reported a ZPE of 15337 ± 7 cm−1 (43.850 ± 0.020 kcal mol−1).40
Based on these ZPEs the FAD dissociation energy D0 = DCe − 2ZPEFAM + ZPEFAD can be determined. Here, DCe is the corrected (see below) binding energy (“from the bottom of the potential”) and ZPEFAM and ZPEFAD are the ZPEs of FAM and FAD, respectively. The dissociation energy De needs to be corrected (a) to account for basis set superposition error (BSSE) and (b) to include effects due to finite-size basis set effects by extrapolation to the complete basis set (CBS) limit. These corrections were determined in previous work38 and will be used here. This is possible because De = −16.79 kcal mol−1 from the present work for dissociation of FAD into two FAMs each at their respective equilibrium structure, is identical to the value reported from the earlier CCSD(T)/aug-cc-pVTZ calculations.38 Including corrections for BSSE at the CBS limit yields DCe = −16.11 kcal mol−1.38 Together with the ZPEs of FAM and FAD determined above this yields a best estimate of D0 = −14.23 ± 0.08 kcal mol−1 where the error is that of the ZPEs from the DMC calculations. This value is consistent, within error bars, with the experimentally reported value of −14.22 ± 0.12 kcal mol−133 and compares with D0 = −14.3 ± 0.1 kcal mol−1 from computations with ZPEs obtained from a hybrid VPT2 approach (harmonic frequencies from CCSD(T)/AVQZ and correcting for anharmonic effects using MP2/AVDZ).38
4 Discussion and conclusion
In this work the harmonic and anharmonic vibrational spectra for FAM and FAD in the gas phase have been determined based on correctly dissociating machine-learned PESs at the MP2 level of theory and transfer-learned to the CCSD(T) level of theory with the aug-cc-pVTZ basis set. Harmonic frequencies on PESMP2 and PESTL from diagonalizing the Hessian are in good agreement with those determined from conventional ab initio calculations. Accounting for anharmonicity in the vibrations through VPT2 calculations yields spectra in good agreement with those observed experimentally. The finite-temperature MD simulations find good agreement with experimental spectra for all modes below 2000 cm−1 but disagree by several 100 cm−1 for the high-frequency XH stretch vibrations. This confirms earlier findings and is related to the fact that MD simulations at 300 K do not sample the mechanical anharmonicity of XH stretch or any other strongly anharmonic modes sufficiently to give reliable frequencies from such an approach. Contrary to that, a 24-mode VSCF/VCI calculation on a PES calculated at the CCSD(T)-F12a/haTZ level of theory and fit to permutationally invariant polynomials40 correctly describes the spectroscopy and increased width of the OH-stretch band.43The present work also allows to make contact with a recent assessment35 of various sources of errors in the spectroscopy and thermodynamics of FAD which reported that “More often than not, the overestimation of harmonic downshifts in DFT is qualitatively compensated by the inability of classical dynamics to sample the anharmonic region probed by the quantum nature of the hydrogen atom. This frequently provides right answers for the wrong reasons whenever high-frequency XH stretching spectra are simulated, because in this case, temperatures of several 1000 K would be needed to sample the relevant fundamental vibrational displacements.” While some of these statements are supported by the present results, others require amendments.
In agreement with this assessment the present work finds that energies up to 0.5 eV (∼5800 K) are required for the OH stretch vibration in FAM to agree with experiment. This is consistent with the temperature  required to reproduce the stretching fundamental of a simple Morse oscillator with harmonic wavenumber ωe.108 On the other hand, the CCSD(T)-level quality of PESTL allows to probe whether or not accidental agreement with experiment is found for the complexation induced red shifts Δω and Δν. For the harmonic frequencies, the red shifts are Δω = −511 cm−1 and Δω = −433 cm−1 from normal mode calculations at the MP2 and CCSD(T) levels of theory, compared with −518 and −449 cm−1 from normal modes on the respective NN-learned PESMP2 and PESTL, see Tables S4 and S5 (ESI†). MD simulations with PESMP2 at 300 K find Δν = −477 cm−1 compared with −521 ± 100 cm−1 estimated from experiments,30 see Table 3. With PESTL the red shift is Δν = −412 cm−1 and the VPT2 calculations yield a shift of −537 cm−1. It should be noted that VPT2 calculations are known to have limitations for proton bound dimers.98 This is also consistent with the present finding that the ZPEs of FAD from DMC simulations and VPT2 calculations using PESTL differ by 0.14 kcal mol−1 (50 cm−1) whereas that for FAM is virtually identical.
The shifts from finite-T MD simulations still suffer from the limitation that the anharmonicity of the OH stretch is not sufficiently sampled, irrespective of the level of theory at which the PES was determined. However, it is likely that the magnitude and the direction of the error in the anharmonic OH stretch frequencies differ for FAM compared with FAD. This can be seen most clearly in Fig. 5 where the OH stretch in FAM/FAD shifts to the red/blue with increasing internal energy, respectively. The complexation induced red shift from simulations on PESMP2 is within 44 cm−1 of the experimentally observed value whereas that on (higher-level) PESTL is lower by 109 cm−1. Given the close agreement for the anharmonic OH-stretch for FAM from simulations on the two PESs it is expected that PESTL for FAD is of similar quality as for FAM and only minor improvement is expected by adding additional reference points in the transfer learning. This is supported by the finding that for the OH stretch Δω from MP2 calculations differs from that on PESMP2 by 7 cm−1 whereas for CCSD(T) and PESTL the difference is 16 cm−1. Likewise, using a larger basis set, such as aug-cc-pVQZ, is unlikely to change ω and ν of the OH stretch appreciably because the harmonic frequencies from CCSD(T)/aug-cc-pVTZ and CCSD(T)/aug-cc-pVQZ differ only by 3 cm−1, see Table 3. Thus, the apparent “agreement” between experiment and spectra computed from the present MD simulations on PESMP2 is due to differential undersampling the anharmonicity of the OH coordinate at 300 K for FAM and FAD and also due to the uncertainty in assigning the OH-stretch in FAD more definitively.
This changes as soon as DPT occurs, because then the full anharmonicity of the energy function along the XH coordinate must be sampled. From simulations with multiple forward and backward crossings in the MD simulations it is expected that the anharmonicity is comprehensively sampled which should provide more realistic IR spectra. Previous work on FAD accomplished this by using the Molecular Mechanics with Proton Transfer (MMPT)109 PES for which trajectories 250 ns in length were carried out which sampled 25 DPT events.34 Such long simulation times become accessible because these energy functions can be evaluated at the speed of a conventional empirical force field. Furthermore, the MMPT function used did not allow FAD to dissociate into two monomers.
In summary, the present work uses machine-learned, full dimensional and reactive PESs at the MP2 and CCSD(T) levels of theory for FAM and FAD to characterize their vibrational dynamics. It is established that for framework vibrational modes (below 2000 cm−1) computed frequencies from VPT2 and finite-T MD simulations agree well with experiments. However, for the high-frequency XH stretch modes – in particular the OH modes – MD simulations do not sufficiently sample the anharmonicities which leads to a considerable overestimation of the experimentally observed frequencies. Hence, it is primarily the use of MD simulations that is the source of errors for the disagreement between experiments and simulations. The estimated experimentally observed red shift of −521 ± 100 cm−1 for the OH stretch peak30 compares with −477 cm−1 from finite-T simulations on PESMP2 and −412 cm−1 when using PESTL in the simulations. The red shift from the VPT2 calculations is −537 cm−1. However, there is considerable uncertainty on the position and width of the OH-stretch fundamental which makes it less suited for direct comparison with computations.
For FAM, running simulations at elevated temperatures does not affect the framework modes but shifts the OH stretch modes towards the frequencies observed in experiments. On the other hand, for FAD destabilization of the dimer prevents using such an approach. Hence, computing accurate complexation-induced spectral shifts remain a challenge even on high-level PESs due to shortcomings in the dynamics simulations underlying the spectroscopy. This is also not expected to change if approximate quantum methods such as quasiclassical MD (QCMD) or ring-polymer MD (RPMD) simulations are used, as was shown explicitly.44,100 The computed dissociation energy of D0 = −14.23 ± 0.08 kcal mol−1 from a combination of electronic structure calculations and DMC simulations on the CCSD(T)-quality PESTL is in favourable agreement with the value of −14.22 ± 0.1 kcal mol−1 from experiments.
Full-dimensional PESs for medium-sized molecules as the one used here provide an ideal starting point for the accurate exploration of molecular motions. Notable efforts in this direction include a PIP-based PES for 15-atom tropolone110 or reproducing kernel Hilbert space (RKHS)-based representations for molecular systems up to 10 atoms.111 For the motion of H2 in hydrates, which is inherently a high-dimensional problem, an NN-based energy function has been successfully developed to follow quantum diffusion.112 Similarly, NN-based energy functions have been used for accurate spectroscopic studies of van der Waals complexes such as HCl–H2O and its isotopologues.113 Finally, NN-based energy functions have also been used for bond-forming/bond-breaking processes.67,114 These developments together with suitable embedding in surrounding environments provide considerable scope to more quantitatively characterize challenging problems in physical chemistry at molecular-level detail.
Data availability statement
The MP2 and CCSD(T) datasets are available on Zenodo (https://doi.org/10.5281/zenodo.5583206) and the PhysNet codes can be downloaded from github (https://github.com/MMunibas/PhysNet).Conflicts of interest
There are no conflicts of interest to declare.Acknowledgements
We thank Prof. J. M. Bowman and Dr C. Qu for fruitful exchange on the implementation of DMC and Prof. M. Suhm and Dr A. Nejad for valuable correspondence. This work was supported by the Swiss National Science Foundation through grants 200021-117810, 200020-188724 and the NCCR MUST, and the University of Basel.References
- T. R. Rizzo, J. A. Stearns and O. V. Boyarkin, Spectroscopic studies of cold, gas-phase biomolecular ions, Int. Rev. Phys. Chem., 2009, 28, 481–515 Search PubMed.
- K. El Hage, S. Brickel, S. Hermelin, G. Gaulier, C. Schmidt, L. Bonacina, S. C. Van Keulen, S. Bhattacharyya, M. Chergui and P. Hamm, et al., Implications of short time scale dynamics on long time processes, Struct. Dyn., 2017, 4, 061507 Search PubMed.
- C. R. Baiz, B. Błasiak, J. Bredenbeck, M. Cho, J.-H. Choi, S. A. Corcelli, A. G. Dijkstra, C.-J. Feng, S. Garrett-Roe and N.-H. Ge, et al., Vibrational spectroscopic map, vibrational spectroscopy, and intermolecular interaction, Chem. Rev., 2020, 120, 7152–7218 CrossRef CAS.
- Z. Getahun, C. Huang, T. Wang, B. De Leon, W. DeGrado and F. Gai, Using nitrile-derivatized amino acids as infrared probes of local environment, J. Am. Chem. Soc., 2003, 125, 405–411 CrossRef CAS PubMed.
- S. M. Salehi, D. Koner and M. Meuwly, Dynamics and infrared spectroscopy of monomeric and dimeric wild type and mutant insulin, J. Phys. Chem. B, 2020, 124, 11882–11894 CrossRef CAS PubMed.
- J. M. Schmidt-Engler, L. Blankenburg, B. Blasiak, L. J. G. W. van Wilderen, M. Cho and J. Bredenbeck, Vibrational lifetime of the SCN protein label in H2O and D2O reports site-specific solvation and structure changes during PYP's photocycle, Anal. Chem., 2020, 92, 1024–1032 CrossRef CAS PubMed.
- S. M. Salehi and M. Meuwly, Site-selective dynamics of azidolysozyme, J. Chem. Phys., 2021, 154, 165101 CrossRef CAS PubMed.
- H. T. Turan and M. Meuwly, Spectroscopy, dynamics, and hydration of S-nitrosylated myoglobin, J. Phys. Chem. B, 2021, 125, 4262–4273 CrossRef CAS PubMed.
- R. Bloem, K. Koziol, S. A. Waldauer, B. Buchli, R. Walser, B. Samatanga, I. Jelesarov and P. Hamm, Ligand Binding Studied by 2D IR Spectroscopy Using the Azidohomoalanine Label, J. Phys. Chem. B, 2012, 116, 13705–13712 CrossRef CAS.
- P. Mondal and M. Meuwly, Vibrational Stark spectroscopy for assessing ligand-binding strengths in a protein, Phys. Chem. Chem. Phys., 2017, 19, 16131–16143 RSC.
- D. Koner, R. J. Bemish and M. Meuwly, Dynamics on multiple potential energy surfaces: quantitative studies of elementary processes relevant to hypersonics, J. Phys. Chem. A, 2020, 124, 6255–6269 CrossRef CAS PubMed.
- M. Meuwly, Machine learning for chemical reactions, Chem. Rev., 2021, 121, 10218–10239 CrossRef CAS PubMed.
- O. T. Unke, S. Chmiela, H. E. Sauceda, M. Gastegger, I. Poltavsky, K. T. Schütt, A. Tkatchenko and K.-R. Müller, Machine learning force fields, Chem. Rev., 2021, 121(16), 10142–10186 CrossRef CAS.
- C. Qu, P. L. Houston, R. Conte, A. Nandi and J. M. Bowman, Breaking the coupled cluster barrier for machine-learned potentials of large molecules: The case of 15-atom acetylacetone, J. Phys. Chem. Lett., 2021, 12, 4902–4909 CrossRef CAS.
- R. A. Friesner, Ab initio quantum chemistry: Methodology and applications, Proc. Natl. Acad. Sci. U. S. A., 2005, 102, 6648–6653 CrossRef CAS PubMed.
- S. J. Pan and Q. Yang, A survey on transfer learning, IEEE Trans. Knowledge Data Eng., 2009, 22, 1345–1359 Search PubMed.
- M. E. Taylor and P. Stone, Transfer learning for reinforcement learning domains: A survey, J. Mach. Learn. Res., 2009, 10, 1633–1685 Search PubMed.
- J. S. Smith, B. T. Nebgen, R. Zubatyuk, N. Lubbers, C. Devereux, K. Barros, S. Tretiak, O. Isayev and A. E. Roitberg, Approaching coupled cluster accuracy with a general-purpose neural network potential through transfer learning, Nat. Commun., 2019, 10, 1–8 CrossRef PubMed.
- R. Ramakrishnan, P. Dral, M. Rupp and O. A. von Lilienfeld, Big data meets quantum chemistry approximations: The Δ-machine learning approach, J. Chem. Theory Comput., 2015, 11, 2087–2096 CrossRef CAS PubMed.
- S. Käser, O. T. Unke and M. Meuwly, Reactive dynamics and spectroscopy of hydrogen transfer from neural network-based reactive potential energy surfaces, New J. Phys., 2020, 22, 055002 CrossRef.
- S. Käser, D. Koner, A. S. Christensen, O. A. von Lilienfeld and M. Meuwly, Machine learning models of vibrating H2CO: Comparing reproducing kernels, FCHL, and PhysNet, J. Phys. Chem. A, 2020, 124, 8853–8865 CrossRef PubMed.
- A. Nandi, C. Qu, P. L. Houston, R. Conte and J. M. Bowman, Δ-machine learning for potential energy surfaces: A PIP approach to bring a DFT-based PES to CCSD(T) level of theory, J. Chem. Phys., 2021, 154, 051102 CrossRef CAS PubMed.
- S. Käser, E. D. Boittier, M. Upadhyay and M. Meuwly, Transfer learning to CCSD(T): Accurate anharmonic frequencies from machine learning models, J. Chem. Theory Comput., 2021, 17, 3687–3699 CrossRef PubMed.
- P. Khare, N. Kumar, K. Kumari and S. Srivastava, Atmospheric formic and acetic acids: An overview, Rev. Geophys., 1999, 37, 227–248 CrossRef CAS.
- R. van Putten, T. Wissink, T. Swinkels and E. A. Pidko, Fuelling the hydrogen economy: Scale-up of an integrated formic acid-to-power system, Int. J. Hydrogen Energy, 2019, 44, 28533–28541 CrossRef CAS.
- Q. Wang, J. Warnan, S. Rodrguez-Jiménez, J. J. Leung, S. Kalathil, V. Andrei, K. Domen and E. Reisner, Molecularly engineered photocatalyst sheet for scalable solar formate production from carbon dioxide and water, Nat. Energy, 2020, 5, 703–710 CrossRef CAS.
- C. Xia, P. Zhu, Q. Jiang, Y. Pan, W. Liang, E. Stavitski, H. N. Alshareef and H. Wang, Continuous production of pure liquid fuel solutions via electrocatalytic CO2 reduction using solid-electrolyte devices, Nat. Energy, 2019, 4, 776–785 CrossRef CAS.
- F. Ito and T. Nakanaga, A jet-cooled infrared spectrum of the formic acid dimer by cavity ring-down spectroscopy, Chem. Phys. Lett., 2000, 318, 571–577 CrossRef CAS.
- M. Freytes, D. Hurtmans, S. Kassi, J. Liévin, J. Vander Auwera, A. Campargue and M. Herman, Overtone spectroscopy of formic acid, Chem. Phys., 2002, 283, 47–61 CrossRef CAS.
- R. Georges, M. Freytes, D. Hurtmans, I. Kleiner, J. Vander Auwera and M. Herman, Jet-cooled and room temperature FTIR spectra of the dimer of formic acid in the gas phase, Chem. Phys., 2004, 305, 187–196 CrossRef CAS.
- P. Zielke and M. Suhm, Raman jet spectroscopy of formic acid dimers: low frequency vibrational dynamics and beyond, Phys. Chem. Chem. Phys., 2007, 9, 4528–4534 RSC.
- Z. Xue and M. Suhm, Probing the stiffness of the simplest double hydrogen bond: The symmetric hydrogen bond modes of jet-cooled formic acid dimer, J. Chem. Phys., 2009, 131, 054301 CrossRef CAS PubMed.
- F. Kollipost, R. W. Larsen, A. V. Domanskaya, M. Nörenberg and M. A. Suhm, Communication: The highest frequency hydrogen bond vibration and an experimental value for the dissociation energy of formic acid dimer, J. Chem. Phys., 2012, 136, 151101 CrossRef CAS PubMed.
- K. Mackeprang, Z.-H. Xu, Z. Maroun, M. Meuwly and H. G. Kjaergaard, Spectroscopy and dynamics of double proton transfer in formic acid dimer, Phys. Chem. Chem. Phys., 2016, 18, 24654–24662 RSC.
- A. Nejad and M. A. Suhm, Concerted pair motion due to double hydrogen bonding: The formic acid dimer case, J. Ind. Inst. Sci., 2020, 100, 5–19 CrossRef.
- R. Kalescky, E. Kraka and D. Cremer, Local vibrational modes of the formic acid dimer-the strength of the double hydrogen bond, Mol. Phys., 2013, 111, 1497–1510 CrossRef CAS.
- S. D. Ivanov, I. M. Grant and D. Marx, Quantum free energy landscapes from ab initio path integral metadynamics: Double proton transfer in the formic acid dimer is concerted but not correlated, J. Chem. Phys., 2015, 143, 124304 CrossRef PubMed.
- E. Miliordos and S. S. Xantheas, On the validity of the basis set superposition error and complete basis set limit extrapolations for the binding energy of the formic acid dimer, J. Chem. Phys., 2015, 142, 094311 CrossRef PubMed.
- D. P. Tew and W. Mizukami, Ab initio vibrational spectroscopy of cis-and trans-formic acid from a global potential energy surface, J. Phys. Chem. A, 2016, 120, 9815–9828 CrossRef CAS.
- C. Qu and J. M. Bowman, An ab initio potential energy surface for the formic acid dimer: Zero-point energy, selected anharmonic fundamental energies, and ground-state tunneling splitting calculated in relaxed 1–4-mode subspaces, Phys. Chem. Chem. Phys., 2016, 18, 24835–24840 RSC.
- J. O. Richardson, Full-and reduced-dimensionality instanton calculations of the tunnelling splitting in the formic acid dimer, Phys. Chem. Chem. Phys., 2017, 19, 966–970 RSC.
- C. Qu and J. M. Bowman, High-dimensional fitting of sparse datasets of CCSD(T) electronic energies and MP2 dipole moments, illustrated for the formic acid dimer and its complex IR spectrum, J. Chem. Phys., 2018, 148, 241713 CrossRef PubMed.
- C. Qu and J. M. Bowman, Quantum and classical IR spectra of (HCOOH)2, (DCOOH)2 and (DCOOD)2 using ab initio potential energy and dipole moment surfaces, Faraday Discuss., 2018, 212, 33–49 RSC.
- C. Qu and J. M. Bowman, IR spectra of (HCOOH)2 and (DCOOH)2: Experiment, VSCF/VCI, and ab initio molecular dynamics calculations using full-dimensional potential and dipole moment surfaces, J. Phys. Chem. Lett., 2018, 9, 2604–2610 CrossRef CAS PubMed.
- F. Richter and P. Carbonnière, Vibrational treatment of the formic acid double minimum case in valence coordinates, J. Chem. Phys., 2018, 148, 064303 CrossRef PubMed.
- W. Reutemann and H. Kieczka, Ullmann's Encyclopedia of Industrial Chemistry, American Cancer Society, 2011 Search PubMed.
- R. M. Balabin, Polar (acyclic) isomer of formic acid dimer: Gas-phase Raman spectroscopy study and thermodynamic parameters, J. Phys. Chem. A, 2009, 113, 4910–4918 CrossRef CAS PubMed.
- R. C. Millikan and K. S. Pitzer, Infrared spectra and vibrational assignment of monomeric formic acid, J. Chem. Phys., 1957, 27, 1305–1308 CrossRef CAS.
- G. Luiz, A. Scalabrin and D. Pereira, Gas phase infrared Fourier transform spectra of H12COOH and H13COOH, Infrared Phys. Technol., 1997, 38, 45–49 CrossRef CAS.
- A. Nejad, M. A. Suhm and K. A. Meyer, Increasing the weights in the molecular work-out of cis- and trans-formic acid: Extension of the vibrational database via deuteration, Phys. Chem. Chem. Phys., 2020, 22, 25492–25501 RSC.
- R. C. Millikan and K. S. Pitzer, The infrared spectra of dimeric and crystalline formic acid, J. Am. Chem. Soc., 1958, 80, 3515–3521 CrossRef CAS.
- F. Ito and T. Nakanaga, Jet-cooled infrared spectra of the formic acid dimer by cavity ring-down spectroscopy: observation of the O-H stretching region, Chem. Phys., 2002, 277, 163–169 CrossRef CAS.
- K. A. Meyer, J. A. Davies and A. M. Ellis, Shifting formic acid dimers into perspective: vibrational scrutiny in helium nanodroplets, Phys. Chem. Chem. Phys., 2020, 22, 9637–9646 RSC.
- A. Aerts, P. Carbonnière, F. Richter and A. Brown, Vibrational states of deuterated trans- and cis-formic acid: DCOOH, HCOOD, and DCOOD, J. Chem. Phys., 2020, 152, 024305 CrossRef CAS PubMed.
- A. Nejad and E. L. Sibert III, The Raman jet spectrum of trans-formic acid and its deuterated isotopologs: Combining theory and experiment to extend the vibrational database, J. Chem. Phys., 2021, 154, 064301 CrossRef CAS PubMed.
- Y. Kim, Direct dynamics calculation for the double proton transfer in formic acid dimer, J. Am. Chem. Soc., 1996, 118, 1522–1528 CrossRef CAS.
- S. Miura, M. E. Tuckerman and M. L. Klein, An ab initio path integral molecular dynamics study of double proton transfer in the formic acid dimer, J. Chem. Phys., 1998, 109, 5290–5299 CrossRef CAS.
- M. Ortlieb and M. Havenith, Proton transfer in (HCOOH)2: An IR high-resolution spectroscopic study of the antisymmetric C-O stretch, J. Phys. Chem. A, 2007, 111, 7355–7363 CrossRef CAS PubMed.
- K. G. Goroya, Y. Zhu, P. Sun and C. Duan, High resolution jet-cooled infrared absorption spectra of the formic acid dimer: A reinvestigation of the C-O stretch region, J. Chem. Phys., 2014, 140, 164311 CrossRef PubMed.
- J. O. Richardson and S. C. Althorpe, Ring-polymer instanton method for calculating tunneling splittings, J. Chem. Phys., 2011, 134, 054109 CrossRef PubMed.
- Y. Zhang, W. Li, W. Luo, Y. Zhu and C. Duan, High resolution jet-cooled infrared absorption spectra of (HCOOH)2, (HCOOD)2, and HCOOH–HCOOD complexes in 7.2 μm region, J. Chem. Phys., 2017, 146, 244306 CrossRef PubMed.
- A. M. Santa Dara, G. Avila and E. Mátyus, Fingerprint region of the formic acid dimer: Variational vibrational computations in curvilinear coordinates, Phys. Chem. Chem. Phys., 2021, 23, 6526–6535 RSC.
- W. Li, L. Evangelisti, Q. Gou, W. Caminati and R. Meyer, The barrier to proton transfer in the dimer of formic acid: A pure rotational study, Angew. Chem., Int. Ed., 2019, 58, 859–865 CrossRef CAS PubMed.
- O. T. Unke and M. Meuwly, PhysNet: A neural network for predicting energies, forces, dipole moments, and partial charges, J. Chem. Theory Comput., 2019, 15, 3678–3693 CrossRef CAS PubMed.
- U. Rivero, O. T. Unke, M. Meuwly and S. Willitsch, Reactive atomistic simulations of Diels–Alder reactions: The importance of molecular rotations, J. Chem. Phys., 2019, 151, 104301 CrossRef PubMed.
- S. Brickel, A. K. Das, O. T. Unke, H. T. Turan and M. Meuwly, Reactive molecular dynamics for the [Cl–CH3–Br]− reaction in the gas phase and in solution: a comparative study using empirical and neural network force fields, Electron. Struct., 2019, 1, 024002 CrossRef CAS.
- S. Käser, O. T. Unke and M. Meuwly, Isomerization and decomposition reactions of acetaldehyde relevant to atmospheric processes from dynamics simulations on neural network-based potential energy surfaces, J. Chem. Phys., 2020, 152, 214304 CrossRef PubMed.
- B. C. Sweeny, H. Pan, A. Kassem, J. C. Sawyer, S. G. Ard, N. S. Shuman, A. A. Viggiano, S. Brickel, O. T. Unke and M. Upadhyay, et al., Thermal activation of methane by MgO+: Temperature dependent kinetics, reactive molecular dynamics simulations and statistical modeling, Phys. Chem. Chem. Phys., 2020, 22, 8913–8923 RSC.
- J. Behler and M. Parrinello, Generalized neural-network representation of high-dimensional potential-energy surfaces, Phys. Rev. Lett., 2007, 98, 146401 CrossRef PubMed.
- J. Gilmer, S. S. Schoenholz, P. F. Riley, O. Vinyals and G. E. Dahl, Neural message passing for quantum chemistry. Proc. of the 34th Int. Conf. on Machine Learning, vol. 70, 2017, pp. 1263–1272.
- A. G. Baydin, B. A. Pearlmutter, A. A. Radul and J. M. Siskind, Automatic differentiation in machine learning: A survey, J. Mach. Learn. Res., 2017, 18, 5595–5637 Search PubMed.
- C. Møller and M. S. Plesset, Note on an approximation treatment for many-electron systems, Phys. Rev., 1934, 46, 618–622 CrossRef.
- R. A. Kendall, T. H. Dunning Jr and R. J. Harrison, Electron affinities of the first-row atoms revisited. Systematic basis sets and wave functions, J. Chem. Phys., 1992, 96, 6796–6806 CrossRef CAS.
- H.-J. Werner, P. J. Knowles, G. Knizia, F. R. Manby, M. Schütz, P. Celani, W. Györffy, D. Kats, T. Korona, R. Lindhet al., MOLPRO, version 2019, a package of ab initio programs, 2019 Search PubMed.
- A. H. Larsen, J. J. Mortensen, J. Blomqvist, I. E. Castelli, R. Christensen, M. Dułak, J. Friis, M. N. Groves, B. Hammer and C. Hargus, et al., The atomic simulation environment – A Python library for working with atoms, J. Phys.: Condens. Matter, 2017, 29, 273002 CrossRef PubMed.
- J. J. P. Stewart, S. C. C. MOPAC 2016, Colorado Springs, CO, USA, 2016 Search PubMed.
- J. J. Stewart, Optimization of parameters for semiempirical methods V: modification of NDDO approximations and application to 70 elements, J. Mol. Model., 2007, 13, 1173–1213 CrossRef CAS PubMed.
- G. M. Torrie and J. P. Valleau, Nonphysical sampling distributions in Monte Carlo free-energy estimation: Umbrella sampling, J. Comput. Phys., 1977, 23, 187–199 CrossRef.
- B. Huang and O. A. von Lilienfeld, Quantum machine learning using atom-in-molecule-based fragments selected on the fly, Nat. Chem., 2020, 12, 945–951 CrossRef CAS PubMed.
- J. Behler, Perspective: Machine learning potentials for atomistic simulations, J. Chem. Phys., 2016, 145, 170901 CrossRef PubMed.
- J. Behler, Constructing high-dimensional neural network potentials: A tutorial review, Int. J. Quantum Chem., 2015, 115, 1032–1050 CrossRef CAS.
- J. S. Smith, O. Isayev and A. E. Roitberg, ANI-1, A data set of 20 million calculated off-equilibrium conformations for organic molecules, Sci. Data, 2017, 4, 170193 CrossRef CAS PubMed.
- J. A. Pople, M. Head-Gordon and K. Raghavachari, Quadratic configuration interaction. A general technique for determining electron correlation energies, J. Chem. Phys., 1987, 87, 5968–5975 CrossRef CAS.
- G. D. Purvis III and R. J. Bartlett, A full coupled-cluster singles and doubles model: The inclusion of disconnected triples, J. Chem. Phys., 1982, 76, 1910–1918 CrossRef.
- M. Thomas, M. Brehm, R. Fligg, P. Vöhringer and B. Kirchner, Computing vibrational spectra from ab initio molecular dynamics, Phys. Chem. Chem. Phys., 2013, 15, 6608–6622 RSC.
- M. Schmitz and P. Tavan, Vibrational spectra from atomic fluctuations in dynamics simulations. I. Theory, limitations, and a sample application, J. Chem. Phys., 2004, 121, 12233–12246 CrossRef CAS PubMed.
- M. Schmitz and P. Tavan, Vibrational spectra from atomic fluctuations in dynamics simulations. II. Solvent-induced frequency fluctuations at femtosecond time resolution, J. Chem. Phys., 2004, 121, 12247–12258 CrossRef CAS PubMed.
- V. Barone, Anharmonic vibrational properties by a fully automated second-order perturbative approach, J. Chem. Phys., 2005, 122, 014108 CrossRef PubMed.
- J. B. Anderson, A random-walk simulation of the Schrödinger equation: H3+, J. Chem. Phys., 1975, 63, 1499–1503 CrossRef CAS.
- I. Kosztin, B. Faber and K. Schulten, Introduction to the diffusion Monte Carlo method, Am. J. Phys., 1996, 64, 633–644 CrossRef.
- M. Abadi, P. Barham, J. Chen, Z. Chen, A. Davis, J. Dean, M. Devin, S. Ghemawat, G. Irving, M. Isard, et al., Tensorflow: A system for large-scale machine learning. 12th USENIX symposium on operating systems Design and Implementation (OSDI 16), 2016, pp. 265–283.
- R. J. DiRisio, F. Lu and A. B. McCoy, GPU-accelerated neural network potential energy surfaces for diffusion Monte Carlo, J. Phys. Chem. A, 2021, 125, 5849–5859 CrossRef CAS PubMed.
- Z. Xue, Raman spectroscopy of carboxylic acid and water aggregates, Logos Verlag Berlin GmbH, 2011 Search PubMed.
- F. Kollipost, Dissertation: Schwingungsdynamik in O–H⋯O-verbrückten Aggregaten: FTIR-Spektroskopie vom Nah- bis zum Ferninfraroten, 2015, http://hdl.handle.net/11858/00-1735-0000-0023-9644-9.
- J. E. Bertie and K. H. Michaelian, The Raman spectra of gaseous formic acid-h2 and-d2, J. Chem. Phys., 1982, 76, 886–894 CrossRef CAS.
- K. A. Meyer and M. A. Suhm, Vibrational exciton coupling in homo and hetero dimers of carboxylic acids studied by linear infrared and Raman jet spectroscopy, J. Chem. Phys., 2018, 149, 104307 CrossRef PubMed.
- F. Kollipost, R. W. Larsen, A. Domanskaya, M. Nörenberg and M. Suhm, Communication: The highest frequency hydrogen bond vibration and an experimental value for the dissociation energy of formic acid dimer, J. Chem. Phys., 2012, 136, 151101 CrossRef CAS PubMed.
- P. R. Franke, J. F. Stanton and G. E. Douberly, How to VPT2: accurate and intuitive simulations of CH stretching infrared spectra using VPT2 + K with large effective Hamiltonian resonance treatments, J. Phys. Chem. A, 2021, 125, 1301–1324 CrossRef CAS PubMed.
- V. Barone, M. Biczysko, J. Bloino, M. Borkowska-Panek, I. Carnimeo and P. Panek, Toward anharmonic computations of vibrational spectra for large molecular systems, Int. J. Quantum Chem., 2012, 112, 2185–2200 CrossRef CAS.
- Z.-H. Xu and M. Meuwly, Vibrational spectroscopy and proton transfer dynamics in protonated oxalate, J. Phys. Chem. A, 2017, 121, 5389–5398 CrossRef CAS PubMed.
- T. Häber, U. Schmitt, C. Emmeluth and M. A. Suhm, Ragout-jet FTIR spectroscopy of cluster isomerism and cluster dynamics: from carboxylic acid dimers to N2O nanoparticles, Faraday Discuss., 2001, 118, 331–359 RSC.
- Y. T. Chang, Y. Yamaguchi, W. H. Miller and H. F. Schaefer III, An analysis of the infrared and Raman spectra of the formic acid dimer (HCOOH)2, J. Am. Chem. Soc., 1987, 109, 7245–7253 CrossRef CAS.
- J. E. Bertie, K. H. Michaelian, H. H. Eysel and D. Hager, The Raman-active O–H and O–D stretching vibrations and Raman spectra of gaseous formic acid-d1 and -OD, J. Chem. Phys., 1986, 85, 4779–4789 CrossRef CAS.
- I. Yokoyama, Y. Miwa and K. Machida, Extended molecular mechanics calculations of thermodynamic quantities, structures, vibrational frequencies, and infrared absorption intensities of formic acid monomer and dimer, J. Am. Chem. Soc., 1991, 113, 6458–6464 CrossRef CAS.
- Y. Maréchal, IR spectra of carboxylic acids in the gas phase: A quantitative reinvestigation, J. Chem. Phys., 1987, 87, 6344–6353 CrossRef.
- D. Berckmans, H. P. Figeys, Y. Marechal and P. Geerlings, Ab initio and LMO studies on the integrated intensities of infrared absorption bands of polyatomic molecules. 7. The formic acid dimer. Influence of hydrogen bonding and isotopic substitution, J. Phys. Chem., 1988, 92, 66–73 CrossRef CAS.
- J. Toulouse, R. Assaraf and C. J. UmrigarAdvances in Quantum Chemistry, Elsevier, 2016, vol. 73, pp. 285–314 Search PubMed.
- M. Suhm and F. Kollipost, Femtosecond single-mole infrared spectroscopy of molecular clusters, Phys. Chem. Chem. Phys., 2013, 15, 10702–10721 RSC.
- S. Lammers, S. Lutz and M. Meuwly, Reactive force fields for proton transfer dynamics, J. Comput. Chem., 2008, 29, 1048–1063 CrossRef CAS PubMed.
- P. Houston, R. Conte, C. Qu and J. M. Bowman, Permutationally invariant polynomial potential energy surfaces for tropolone and H and D atom tunneling dynamics, J. Chem. Phys., 2020, 153, 024107 CrossRef CAS PubMed.
- D. Koner and M. Meuwly, Permutationally invariant, reproducing kernel-based potential energy surfaces for polyatomic molecules: From formaldehyde to acetone, J. Chem. Theory Comput., 2020, 16, 5474–5484 CrossRef CAS PubMed.
- Y.-J. Zhang, A. Khorshidi, G. Kastlunger and A. A. Peterson, The potential for machine learning in hybrid QM/MM calculations, J. Chem. Phys., 2018, 148, 241740 CrossRef PubMed.
- P. M. Felker, Y. Liu, J. Li and Z. Bacic, DCl–H2O, HCl–D2O, and DCl–D2O dimers: Inter-and intramolecular vibrational states and frequency shifts from fully coupled quantum calculations on a full-dimensional neural network potential energy surface, J. Phys. Chem. A, 2021, 125, 6437–6449 CrossRef CAS PubMed.
- J. Zeng, L. Cao, M. Xu, T. Zhu and J. Z. Zhang, Complex reaction processes in combustion unraveled by neural network-based molecular dynamics simulation, Nat. Commun., 2020, 11, 1–9 Search PubMed.
Footnote |
| † Electronic supplementary information (ESI) available. See DOI: 10.1039/d1cp04393e |
| This journal is © the Owner Societies 2022 |