 Open Access Article
Spectroscopic observation and ultrafast coherent vibrational dynamics of the aqueous phenylalanine radical†
Muhammad Shafiq
Bin Mohd Yusof
,
Jing Xuan
Siow
,
Ningchen
Yang
,
Wei Xin
Chan
and
Zhi-Heng
Loh
 *
*
Division of Chemistry and Biological Chemistry, School of Physical and Mathematical Sciences, Nanyang Technological University, 21 Nanyang Link, Singapore 637371, Singapore. E-mail: zhiheng@ntu.edu.sg
First published on 13th January 2022
Abstract
The phenylalanine radical (Phe˙) has been proposed to mediate biological electron transport (ET) and exhibit long-lived electronic coherences following attosecond photoionization. However, the coupling of ultrafast structural reorganization to the oxidation/ionization of biomolecules such as phenylalanine remains unexplored. Moreover, studies of ET involving Phe˙ are hindered by its hitherto unobserved electronic spectrum. Here, we report the spectroscopic observation and coherent vibrational dynamics of aqueous Phe˙, prepared by sub-6 fs photodetachment of phenylalaninate anions. Sub-picosecond transient absorption spectroscopy reveals the ultraviolet absorption signature of Phe˙. Ultrafast structural reorganization drives coherent vibrational motion involving nine fundamental frequencies and one overtone. DFT calculations rationalize the absence of the decarboxylation reaction, a photodegradation pathway previously identified for Phe˙. Our findings guide the interpretation of future attosecond experiments aimed at elucidating coherent electron motion in photoionized aqueous biomolecules and pave way for the spectroscopic identification of Phe˙ in studies of biological ET.
Introduction
Phenylalanine (Phe) is one of the essential amino acids that serves as a precursor in the biosynthesis of tyrosine, 3,4-dihydroxyphenylalanine (DOPA), dopamine, norepinephrine, and epinephrine.1,2 Being an amino acid with an aromatic sidechain, along with tryptophan and tyrosine, its ionization potential is ∼1–2 eV lower than those of amino acids with aliphatic sidechains.3,4 As such, radiation damage of phenylalanine induced by ionizing radiation is expected to be facile. While studies of radiation-molecule interaction by pulse radiolysis5 and ab initio simulations6 have uncovered pathways for the hydroxylation of phenylalanine in aqueous solution, little is known about the spectroscopic signature or the ultrafast dynamics of the phenylalanine radical (Phe˙). Earlier nanosecond to microsecond UV flash photolysis studies of phenylalanine in aqueous solution revealed parallel photodissociation and photoionization pathways (Scheme 1).7–9 The transient absorption spectra collected at the earliest time delay of 20 ns revealed the absorption signature of either the benzyl radical photoproduct (at acidic or neutral pH values) or the phenylalanine triplet state (at alkaline pH values), with no sign of the Phe˙ radical.9 Unlike the well-established spectroscopic signatures of the tyrosyl10–12 and tryptophan radicals,13–19 the Phe˙ radical species has been elusive, presumably due to its rapid decarboxylation.Our study of the ultrafast structural rearrangement dynamics of the Phe˙ radical is primarily motivated by the recent report of long-lived coherent electron motion in gas-phase phenylalanine, triggered by attosecond photoionization.20 There, sudden ionization of the inner-valence electrons of phenylalanine by an attosecond extreme ultraviolet pulse, followed by probing with a 4 fs near-infrared pulse, led to oscillations in the yield of the 2-phenylethanamine dication [(PhCH2–CH–NH2)2+] as a function of time delay. Over the pump–probe time delay range of ∼10 – 35 fs, the dication yield oscillates with a frequency of 0.234 PHz (7790 cm−1). The origin of the oscillation is attributed to coherent electron motion as this oscillation frequency lies beyond the calculated highest fundamental vibrational frequency of the Phe˙ radical (3730.9 cm−1).21 It is surprising that an electronic coherence survives in a molecule with many vibrational degrees of freedom and over multiple oscillation periods without any noticeable sign of decoherence. Nevertheless, the experimentally observed oscillation frequency is in good agreement with the 0.25 PHz frequency obtained from theoretical simulations of electron dynamics, and the experimental observation of an electronic coherence was recently extended to tryptophan, for which a beat frequency of 0.252 PHz (8390 cm−1) was found.22 We note, however, that the interpretation of the experimental results thus far does not consider the coupling of the coherent electron motion to vibrational wave packet dynamics that will invariably be triggered by impulsive ionization. In anticipation of the extension of these attosecond experiments into the condensed phase, our goal is to identify the vibrational modes along which vibrational wave packet dynamics will be launched upon the impulsive ejection of electrons from aqueous phenylalanine.
Further motivation for investigating the Phe˙ radical in aqueous solution comes from the recent suggestion that it participates in long-distance hole transport in proteins.23,24 This proposal appears to be counterintuitive, given that the oxidation potential is significantly higher for phenylalanine (3.22 V vs. SHE) than tryptophan (1.62 V vs. SHE) or tyrosine (2.12 V vs. SHE),25 thus making reversible oxidation – required for long-range hole transport – unfavorable. A combination of nanosecond flash photolysis measurements and ab initio simulations was recently employed to show that the presence of amide groups in a peptide environment stabilizes the arene radical, hence presumably facilitating the oxidation of phenylalanine residue.26 This study, along with earlier flash photolysis studies of phenylalanine,7,8 however, did not reveal a clear spectroscopic signature of the Phe˙ radical. The unknown electronic absorption spectrum of the Phe˙ radical prevents its spectroscopic identification and hampers further studies aimed at elucidating the role of the Phe˙ radical in long-range biological electron transfer.
In this study, we employ a combination of optical pump–probe spectroscopy and ab initio simulations to investigate the ultrafast dynamics of the Phe˙ radical in aqueous solution. The Phe˙ radical is prepared by using sub-6 fs laser pulses to drive the strong-field photodetachment of the aqueous phenylalaninate anion, Phe− (Fig. 1). Subsequent probing in the UV for pump–probe time delays extending to 10 ps reveals the differential absorption (ΔA) spectrum of the Phe˙ radical. The ΔA signal oscillates as a function of time delay due to vibrational wave packet dynamics. Following our earlier work on the ultrafast photodetachment of aqueous phenoxide, we identify the observed vibrational frequencies with vibrational modes along which structural rearrangement occur following photodetachment.27 The experimental results are complemented by ab initio calculations of the vibrational frequencies of the Phe˙ radical, hydrated to different extents by explicit water molecules of solvation, as well as its potential energy curve along the decarboxylation reaction coordinate.
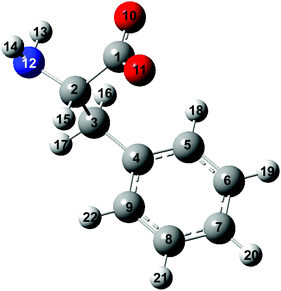 | ||
| Fig. 1 Structure of the phenylalaninate anion. The carbon, hydrogen, oxygen and nitrogen atoms are in gray, white, red and blue, respectively. | ||
Methods
Experimental
The experimental setup for femtosecond optical pump–probe spectroscopy is based on a chirped-pulse-amplified Ti:sapphire laser system (Coherent, Legend Elite Duo-USX). The laser system has an output of 4.3 mJ, 30 fs pulses at 1 kHz repetition rate and 800 nm center wavelength. The laser pulses undergo spectral broadening by self-phase modulation in a hollow-core fiber filled with helium at 2 bars. Subsequently, the pulses are temporally compressed by chirped mirrors (Ultrafast Innovations GmbH, PC1332). The compressed pulses are then directed to an 80T/20R beamsplitter (Layertec, 131191), where 80% of the compressed pulses (∼0.6 mJ) enter a visible-NIR 4f-pulse shaper equipped with a 128-element spatial light modulator (SLM) (Biophotonics Solutions, FemtoJock-P) for further pulse compression. The visible-NIR 4f-pulse shaper performs adaptive pulse compression of the visible-NIR pulses, correcting for higher-order dispersion introduced by spectral broadening and by the various optical components in the laser beam path, thus ensuring that transform-limited pulses are used in the experiments. The output beam has a wavelength range of 530–750 nm, with a center wavelength of 642 nm (1.93 eV photon energy; Fig. S1a, ESI†). The multiphoton intrapulse interference phase scan (MIIPS) technique is utilized to measure the spectral phase of the laser pulse at the sample, after which the SLM is used to introduce an oppositely signed spectral phase to the laser pulse, thus compressing it to the transform-limited pulse duration.28 A second-order interferometric autocorrelation trace is acquired by the multiple independent comb shaping (MICS) technique (Fig. S2a, ESI†),29 revealing a full-width at half-maximum (FWHM) pulse duration of 5.6 fs, <1.1× the transform limit.The transform-limited visible-NIR pulses, which serve as the strong-field photodetachment pump pulses, are focused onto the sample by a 50 cm focal length spherical mirror. An optical delay stage line, driven by a piezo translation stage (Physik Instrumente, N-664.3A) is positioned in the detachment pump beam path to provide a variable time delay between pump and probe pulses in 5 fs or 10 fs steps for measurements that extend to 3 ps or 10 ps time delay, respectively. The beam waist (1/e2 radius) of the pump beam at the sample target is 100 μm and the maximum pulse energy is 34 μJ. The corresponding peak intensity of the pump beam is 3.6 × 10¹³ W cm−2. An achromatic half-waveplate (B. Halle, RAC4.2.15 L) is introduced in the path of the ionizing pump pulses to allow independent control of the relative polarization between pump and probe pulses.
The remaining 20% output after the chirped mirrors is directed to a 10 μm-thick Type I beta-barium borate (BBO) crystal (Castech, θ = 44.0°) to generate the UV probe via second-harmonic generation. Dichroic beamsplitters (Layertec, 106163) are introduced after the BBO crystal to remove the residual fundamental beam. The resultant broadband UV output has a wavelength range of 290–370 nm (Fig. S1b, ESI†). The UV beam is split by a reflective neutral density filter (Edmund Optics, 88271) to produce the probe and reference beams. Subsequently, the UV probe beam is focused onto the sample by a 15 cm focal length off-axis parabolic reflector (Thorlabs, MPD369H-P01). The focused UV probe at the sample target has a beam waist (1/e2 radius) of 40 μm and a pulse energy of 100 nJ, resulting in a peak intensity of 1.6 × 10¹¹ W cm−2.
A synchronized optical chopper is positioned in the photodetachment pump beam path before the sample to modulate the repetition rate of the pump pulse at a frequency of 0.5 kHz. The probe beam that is transmitted through the microjet then focused into a 300 mm spectrograph (Princeton Instruments, Acton SP2300). The spectrograph is equipped with a 500 nm blaze, 600 grooves per mm grating and a 1024 pixels silicon photodiode array detector (Stresing, S8381-1024Q) with a read-out rate of 1 kHz, which allows simultaneous acquisition of the probe spectra obtained with and without the photodetachment pump pulse. The silicon photodiode array detectors are interfaced with desktop computers for automated data acquisition. The reference UV pulses are focused into an identical spectrograph, which is equipped with similar grating and photodiode array operating at 1 kHz repetition rate. Single-shot referencing reduces noise caused by shot-to-shot fluctuations of the probe beam. The focal spot size of the probe beam is generally ∼3× smaller than that of the ionizing pump beam, hence minimizing the effect of spatial averaging on the observed ultrafast dynamics. The cross-correlation of the pump and probe, obtained by difference frequency generation (DFG) in a 10 μm thick Type I BBO crystal (Castech, θ = 37.0°), yields an instrument response of 24 fs FWHM (Fig. S2b, ESI†).
L-Phenylalanine (Sigma-Aldrich, reagent grade ≥ 98%) and sodium hydroxide (Schedelco, Grade AR) are used as received without further purification. Since phenylalanine is relatively insoluble in water (85 mM at its isoelectric point),30 it is dissolved in sodium hydroxide solution to produce a 400 mM phenylalaninate anion solution. Given that the pKa of the carboxylic group31 is 2.18, we expect >99.9% deprotonation of the carboxyl group at pH 14. Thus, phenylalanine exists in our experiment exclusively in the anionic form. The sample target comprises a slit nozzle (Metaheuristics, Type-L) combined with a peristaltic pump (Cole-Parmer, 07528-10) and a dampener to produce a microjet. The volume flow rate of ∼92 mL min−1 corresponds to a vertical flow rate of ∼8.5 mm ms−1, sufficiently high to ensure that a fresh sample volume is exposed to each pump pulse. By spectral interferometry, the thickness of the liquid jet is 12 μm (Fig. S3, ESI†), which is thick enough to produce a sizeable differential absorption signal (ΔA ∼ 0.01) while minimizing the temporal broadening of the pulses in the liquid jet due to dispersion. In addition, the thin liquid jet limits the group-velocity mismatch between the pump and probe pulses to <1 fs.
Theoretical
The optimized equilibrium geometries and calculated vibrational frequencies of the phenylalaninate anion and the phenylalanine radical are obtained with the GAUSSIAN 16 program.32 DFT calculations employ the hybrid exchange functional of Becke (B3),33 the correlation functional of Lee, Yang and Parr (LYP),34 and the 6-311G++(d,p) split-valence triple-ξ basis set, which comprises d-orbital polarization and diffuse functions on the heavy atoms (carbon, oxygen and nitrogen) and p-orbital polarization and diffuse functions on the hydrogen atoms. Two types of molecular models are used in the calculations. The first model is the isolated phenylalaninate anion or the phenylalanine radical, whereas the second model includes explicit water molecules of hydration. In the case of the microhydrated models, several water molecules are directly hydrogen-bonded to the carboxylate (–CO2) and amine (–NH2) groups of the amino acid (Fig. 2). The polarizable continuum model (PCM) is included in both models to mimic the interaction of radical species with the dielectric environment of the surrounding solvent.35 The water molecules present in the microhydrated species are fully relaxed during the geometry optimization process. Each geometry optimization is followed by vibrational frequency calculation to verify the optimized geometry corresponds to a local minimum.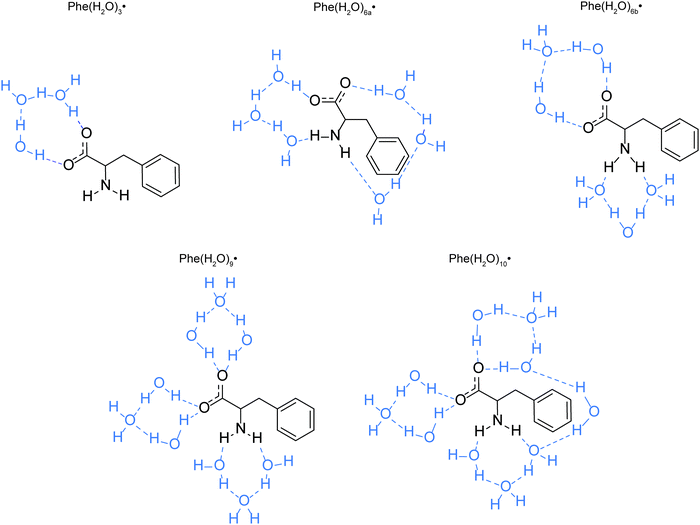 | ||
| Fig. 2 Models of the microhydrated Phe˙ radicals. The hydrogen bonds are indicated as blue dashed lines. | ||
To investigate the possible decarboxylation of the phenylalaninate anion upon photodetachment, constrained geometry optimization calculations are performed on the phenylalanine radical while varying the C–C bond length between the carboxylate carbon (C1) and the α-carbon (C2). The C1–C2 distance is varied between 1.5–5.0 Å, in increments of 0.05 Å. The plot of the potential energy as a function of C1–C2 distance yields the potential energy curve (PEC) along the C1–C2 elongation coordinate. These PEC calculations are performed for the isolated and the various microhydration models of the phenylalanine radical, all with the inclusion of PCM. Geometry optimizations are also performed to locate the transition states of Phe(H2O)3˙, Phe(H2O)6a˙, and Phe(H2O)9˙ with respect to decarboxylation. The energies of the transition states computed in this manner are within ∼0.1 meV of those found by constrained geometry optimization, thus suggesting that the transition states obtained by constrained geometry optimization are first-order saddle points.
Results & discussion
Strong-field resonance-enhanced multiphoton photodetachment of Phe−
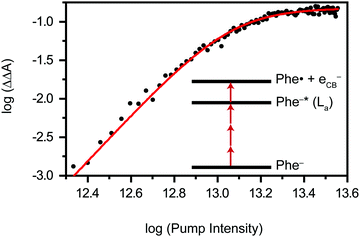
Previous studies of phenylalanine in alkaline medium have shown that 4.68 eV (265 nm) photoexcitation to the S1 (ππ*) state yields the Phe˙ radical via delayed electron ejection from the T1 state. The Phe˙ radical then undergoes decarboxylation to form the 2-phenylethanamine radical and CO2.7–9 In the present study, we exclude the possibility of photodetachment occurring via the S1 or T1 state. Instead, our pump-power dependence measurement reveals a three-photon photodetachment process (Fig. 3 and Section S1, ESI†). Given the vertical ionization energy of aqueous phenylalanine (8.7 eV)25 and the vertical electron affinity of liquid water (∼1 eV),36,37 the total energy input provided by the three-photon process (5.8 eV) is insufficient to eject an electron from the aqueous phenylalaninate anion and inject it into the conduction band of liquid water, even when one considers that the broad photoelectron band of aqueous phenylalanine extends to ∼7.5 eV binding energy.25 As such, we believe that strong-field photodetachment proceeds under our experimental conditions via a (3+1) process involving an intermediate Phe− anion excited state (inset of Fig. 3).The intermediate excited state that is accessed by the three-photon excitation of Phe− is likely to be its La state,38,39 which is related to the 1B1u excited state of benzene. In the far-UV absorption spectrum of the aqueous Phe− anion, the electronic transition to the La state appears as a shoulder at 212 nm (5.85 eV).39 This transition energy is well-matched to the total energy input of 5.8 eV from three-photon photoexcitation, thus lending support to the results of the pump-power dependence study. From this La excited state, the absorption of an additional photon leads to photodetachment of Phe− and the concomitant injection of an electron into the conduction band of liquid water. While nominally a π → π* transition, our TD-DFT calculations suggest that the transition to the La state also involves the promotion of the electron in the HOMO, localized primarily on the amino acid backbone (see below).
Spectroscopic observation of the Phe˙ radical
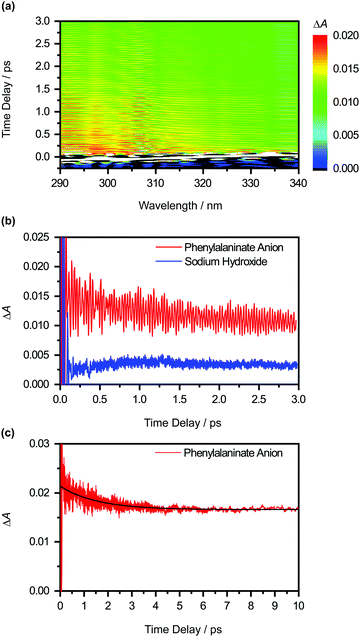
The differential absorption (ΔA) spectrum of the photodetached aqueous phenylalaninate anion, collected as a function of pump–probe time delay, is shown in Fig. 4a. The ΔA signal exhibits pronounced amplitude modulations as a function of time delay (Fig. 4b). In addition, close examination of the ΔA spectrum reveals structure in the 290–320 nm region, reminiscent of a vibronic progression, while the spectral region beyond >320 nm is featureless. Strong-field multiphoton photodetachment of the Phe− anion yields the Phe˙ radical and an injected electron in the conduction band of liquid water. The conduction-band electron undergoes trapping37 and subsequent vibrational relaxation to yield the hydrated electron.40–45 The featureless, broadband absorption spectrum of the hydrated electron spans the UV to the NIR and is peaked at 715 nm.46 The structure observed in the ΔA spectrum thus cannot be ascribed to the hydrated electron. Instead, we attribute the spectral features to the Phe˙ radical absorption.Aside from the pronounced amplitude modulations, the time-resolved ΔA signal also exhibits a gradual decay as a function of pump–probe time delay (Fig. 4c). To extract the timescale relevant to the observed decay dynamics, we employ global fitting of the spectrally resolved ΔA(λ, t) signal to the expression
 | (1) |
The Phe˙ radical that is initially produced by vertical photodetachment exists as a vibrationally hot state in the Franck–Condon region. As such we tentatively assign τd to the timescale for vibrational relaxation, which gives rise to changes in the absorption spectrum due to a combination of changing Franck–Condon factors and non-Condon effects. A similar vibrational relaxation timescale of 0.93 ± 0.02 ps has recently been reported for the tyrosyl radical anion, prepared by the strong-field photodetachment of the tyrosinate dianion.47 Another possible explanation for the observed decay dynamics is the depopulation of the Phe˙ radical by fragmentation, for example, via the decarboxylation pathway that was previously observed from nanosecond laser and microsecond flash photolysis studies of the Phe− anion in alkaline medium.7–9 While our experimental data does not provide any direct evidence that rules out the possibility of decarboxylation occurring in the phenylalanine radical – indeed this has been shown in studies of gas-phase photodetached carboxylate anions to be the dominant dissociation pathway48,49 – we note that both anion photoelectron spectroscopy and ab initio calculations have shown that microhydrated carboxyl radicals are stable with respect to decarboxylation.50,51 Consistent with previous studies of microhydrated carboxyl radicals, results from our DFT calculations suggest that decarboxylation does not occur on the picosecond timescale (see below).
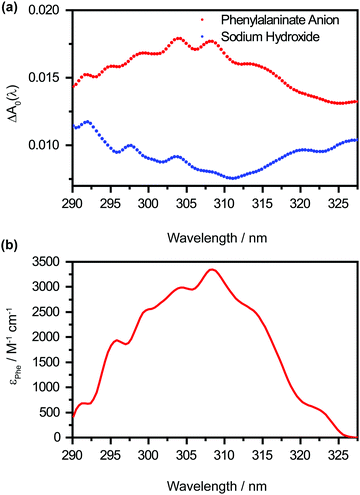
The offset spectrum ΔA0(λ) represents the differential absorption spectrum in the limit of large pump–probe time delays. It is of interest because it encodes the hitherto unobserved absorption spectrum of the Phe˙ radical. However, the retrieved ΔA0(λ) (Fig. 5a, in red) comprises absorption contributions from the Phe˙ and OH˙ radicals, the latter produced by the photodetachment of hydroxide anions OH− present in the alkaline medium, as well as hydrated electrons, produced by the photodetachment of both Phe− and OH− anions. To obtain the absorption spectrum of the Phe˙ radical, it is necessary to remove the contributions from the OH˙ radical and the hydrated electron that originate from the OH− anion. This is done by performing a control experiment on a NaOH-only sample under identical photodetachment conditions. Employing the same global analysis procedure on the NaOH-only data yields the offset spectrum ΔANaOH0(λ) (Fig. 5a, in blue). Taking the difference between the offset spectra gives the absorption spectrum that is associated with the Phe˙ radical, i.e., ΔAPhe0(λ) = ΔA(λ) − ΔANaOH0(λ). It shows a vertical offset, most likely due to the absorption of hydrated electrons produced by the photodetachment of the Phe− anion, not accounted for by ΔANaOH0(λ). From the value of the offset [ΔAPhe0 = (2.8 ± 0.1) × 10−3] and the molar extinction coefficient of the hydrated electron at 327 nm (ε = 1286 M−1 cm−1), along with the path length of the microjet (L = 12 ± 1 μm), we infer that photodetachment of Phe− anions produces 1.8 ± 0.2 mM of hydrated electrons, and hence, Phe˙ radicals. This corresponds to a photodetachment yield of ∼0.5% if one neglects the geminate recombination between hydrated electrons and the Phe˙ radicals on the few-picosecond timescale, an assumption that is supported by previous studies of photoionized aqueous indole.52 Given this initial concentration of Phe˙ radicals, the molar extinction coefficients for the Phe˙ radical can thus be determined (Fig. 5b). Aside from the main peak at 308 nm [εmax = (3.3 ± 0.4) × 103 M−1 cm−1], the molar extinction spectrum of the Phe˙ radical exhibits a pronounced vibronic progression with a spacing of 482 ± 15 cm−1 (Fig. S4, ESI†), which coincides with a benzene ring deformation mode (see below).
Vibrational wave packet dynamics of the Phe˙ radical
The pronounced modulations in the ΔA spectra as a function of time delay (Fig. 3a) encode vibrational wave packet dynamics. We quantitatively analyze the wave packet dynamics by computing the spectral first-moment time trace, 〈E(t)〉, given as | (2) |
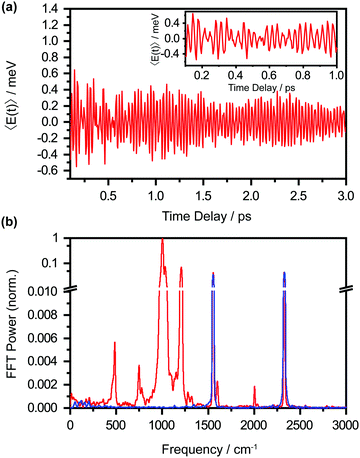
In the above expression, E represents the probe photon energy, t is the pump–probe time delay and ΔA(E,t) is the differential absorbance as a function of probe photon energy and pump–probe time delay. Ei and Ef define the spectral range over which the spectral first-moment is computed; in this case, Ei and Ef is 3.90 eV (318 nm) and 4.13 eV (300 nm), respectively. The resultant 〈E(t)〉 trace is shown in Fig. 6a, with the inset showing a zoomed-in view of 〈E(t)〉.
The oscillatory nature of the 〈E(t)〉 trace arises from vibrational wave packet motion, involving vibrational modes for which the potential energy curves of the Phe− anion and the Phe˙ radical are displaced. Following vertical photodetachment, the initial vibrational probability density of the Phe− anion that is projected onto the Phe˙ radical potential energy curve evolves as a coherent superposition of vibrational eigenstates of the Phe˙ radical, giving rise to wave packet motion. This wave packet motion modulates the transition energy of the probe pulse to the probe final state, Phe˙*, thus resulting in the observed oscillations in the 〈E(t)〉 trace. This time-domain approach to the identification of vibrational modes that are coupled to photodetachment is complementary to measurements of the Franck–Condon progression in the valence photoelectron spectrum. We note that energy-resolved measurements, however, would not be feasible for molecules in aqueous solutions due to the extensive inhomogeneous broadening (∼1 eV) associated with the multiple hydration configurations in aqueous solutions.25,53 Fast-Fourier transform (FFT) of the 〈E(t)〉 trace yields the vibrational frequencies (Fig. 6b), which in turn can be used to identify the vibrational modes that participate in wave packet motion. Table 1 summarizes the vibrational frequencies, their relative FFT powers, and their vibrational mode assignments obtained from DFT calculations (see below).54,55
| FFT Analysis | Calculated frequencya (cm−1) | Assignmentb | |
|---|---|---|---|
| Frequency (cm−1) | Power (norm.) | ||
| a The calculated frequencies are based on the equilibrium geometry of the microhydrated phenylalanine radical Phe(H2O)10˙. b Numbered assignments denote benzene ring modes in the Wilson notation.54,55 Numbers in parentheses refers to minor contributions of phenyl vibrational modes to the main vibrational mode, in descending order of importance. | |||
| 486 | 5.6 × 10⁻² | 515 | 16b |
| 750 | 3.7 × 10⁻² | 759 | 11 |
| 776 | 1.7 × 10⁻² | 770 | NH2 Wag |
| 1003 | 1 | 1015 | 12 |
| 1032 | 7.5 × 10⁻² | 1048 | 19a |
| 1208 | 7.0 × 10⁻² | 1223 | Chain CH2 wag |
| 1282 | 1.3 × 10⁻³ | 1298 | 1 (19a, 12, 7a, 20a, 8a, 12, 6a)* |
| 1319 | 9.9 × 10⁻⁴ | 1351 | Chain CH2 wag/NH2 twist |
| 1601 | 2.3 × 10⁻³ | 1640 | 9a/NH2 wag |
| 2005 | 1.9 × 10⁻³ | — | Overtone of 1003 cm−1 |
| 1555 | 4.3 × 10⁻² | Oxygen | |
| 2327 | 4.4 × 10⁻² | Nitrogen | |
The FFT power spectrum is dominated by the peak at 1003 cm−1, assigned to the benzene ring breathing mode (v12). This peak is >10× more intense than the next strongest peak, assigned to the benzene trigonal bend (v19a). The peak that appears at 2005 cm−1 is assigned, in the absence of a calculated vibrational frequency in that frequency range, to the first overtone of the v12 mode. The emergence of the overtone indicates large-amplitude wave packet motion along the v12 mode. Interestingly, time-domain analysis reveals damping times of 5.5 ± 0.7 ps and 0.13 ± 0.07 ps for the fundamental and overtone frequencies, respectively (Table S1, ESI†). The markedly shorter damping time for the overtone reflects the stronger anharmonic coupling of higher vibrational levels to other vibrational modes, thus promoting more rapid dephasing. A control experiment performed with aqueous NaOH (pH 14) yields the vibrational frequencies of N2 (2329 cm−1) and O2 (1555 cm−1) only;56,57 these originate from impulsive stimulated Raman scattering of N2 and O2 molecules in air, in which the experiments are performed. This result strongly suggests that the vibrational frequencies listed in Table 1 originate from the Phe˙ radical.
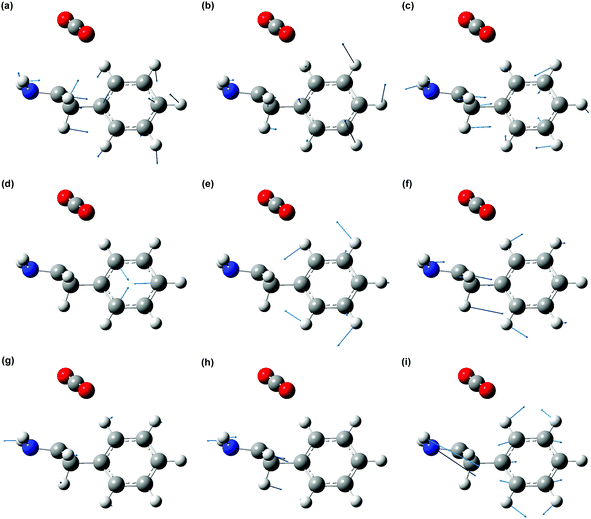
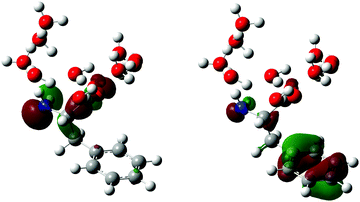
The displacement vectors of vibrational modes that contribute to the wave packet (Fig. 7) involve both the phenyl sidechain and the amino acid backbone. To rationalize this result, we first recall that photodetachment of the Phe− anion under our experimental conditions proceeds via its electronically excited La state, located 5.8 eV above the ground state and accessed via three-photon resonant excitation. Subsequent ejection of the electron from the La state by the absorption of an additional photon yields the Phe˙ radical. The hole density distribution of the La state thus reflects the electron density distribution that is removed by photodetachment. According to TD-DFT calculations, the electronically excited states located ∼5.8 eV above the Phe− ground state originate predominantly from transitions from the HOMO and HOMO–1 orbitals (Section S2, ESI†). The HOMO and HOMO−1 orbitals are localized on the amino acid backbone and the phenyl ring, respectively (Fig. 8). Removal of the electron density about these moieties by strong-field photodetachment thus triggers structural rearrangement involving both the amino acid backbone and the phenyl sidechain.
To gain further insight into the extent of structural reorganization induced by photodetachment, we examine the C–C, C–N, and C–O bond lengths of the optimized structures of the microhydrated Phe− anion and Phe˙ radical (Table 2). Interestingly, the phenyl C–C bond lengths undergo negligible changes (<0.1 pm) upon photodetachment. This lies in contrast to the few-picometer changes in the C–C bond lengths previously calculated for the phenoxide anion and the tyrosinate dianion upon their photodetachment to yield the phenoxyl radical27 and the tyrosine radical anion,47 respectively. To resolve this apparent discrepancy, it should be noted that the FFT power of a particular vibrational mode Qi depends on both the displacements between the Phe− anion and the Phe˙ radical potentials as well as between the Phe˙ radical and Phe˙* probe final-state potentials. Both displacements must be non-vanishing for wave packet motion to be observable in 〈E(t)〉. In the case of the Phe˙ radical, the ability to resolve sub-0.1 pm changes in the phenyl C–C bonds suggests that a large displacement must exist between the Phe˙ and Phe˙* potential energy curves along mode Qi. This large displacement is consistent with the strong UV resonance Raman activities observed for the phenylalanine ring modes.38
| Bond | Bond length/pm | Difference/pm | |
|---|---|---|---|
| Phenylalaninate anion | Phenylalanine radical | ||
| C1–C2 | 154.80 | 190.50 | 35.70 |
| C2–C3 | 154.68 | 152.65 | −2.03 |
| C3–C4 | 151.28 | 151.38 | 0.10 |
| C4–C5 | 139.98 | 139.87 | −0.11 |
| C5–C6 | 139.59 | 139.56 | 0.03 |
| C6–C7 | 139.42 | 139.41 | 0.01 |
| C7–C8 | 139.61 | 139.57 | −0.04 |
| C8–C9 | 139.39 | 139.37 | −0.02 |
| C9–C4 | 140.18 | 140.11 | −0.07 |
| C1–O10 | 126.31 | 121.59 | −4.72 |
| C1–O11 | 126.29 | 121.77 | −4.52 |
We note that the experimentally measured vibrational frequencies are compared to those computed for the microhydration models of the Phe˙ radical. As these models exhibit an equilibrium C1–C2 bond length (∼1.9–2.0 Å; see below) that is elongated relative to that of the microhydrated Phe− anion (∼1.55 Å), it might seem counterintuitive that the vibrational wave packet dynamics at the Franck–Condon region can be assigned to the vibrational frequencies computed for a structure that is located away from the Franck–Condon region. According to classical trajectory calculations, elongation of the C1–C2 bond length from 1.55 Å to 2.0 Å requires ∼40 fs, too long to serve as an impulsive excitation of any of the vibrational modes observed in the FFT power spectrum (Fig. 6b). That is, the observed wave packet dynamics is unlikely to originate from reaction-driven coherence58,59 about the equilibrium Phe˙ radical geometry. Instead, we hypothesize that the vibrational modes that are coherently excited at the Franck–Condon region of the Phe˙ radical are weakly coupled to C1–C2 bond elongation, such that the frequencies of the vibrational modes that participate in wave packet motion are relatively unaffected by C1–C2 bond elongation. In support of this, we note that the displacement vectors in Fig. 7 do not exhibit any C1–C2 stretching character. Moreover, mapping the observed vibrational modes of the Phe˙ radical to the analogous modes of the 2-phenylethanamine radical, the latter being the decarboxylation product, reveals that the vibrational frequencies of the phenylethanamine backbone are relatively insensitive to decarboxylation and hence, C1–C2 bond elongation (Table S2, ESI†). Future investigations that employ time-resolved femtosecond stimulated Raman spectroscopy (FSRS)60–62 or impulsive stimulated Raman spectroscopy (ISRS)63,64 can be used to identify vibrational modes, such as the CO2 bend, which are sensitive to C1–C2 bond elongation. These modes can then be used to track the vibrational relaxation dynamics of the Phe˙ radical from the Franck–Condon region to its equilibrium geometry. In the present work, rapid dephasing promoted by the strong anharmonic coupling between the C1–C2 elongation and, for example, the CO2 bend49 suppresses the observation of vibrational wave packet dynamics along these modes. We note that the strong quenching of vibrational coherences involving vibrational modes that are strongly coupled to the reaction coordinate has previously been observed in intersystem crossing,65 internal conversion,66 and excited-state intramolecular proton transfer.67
Aside from intramolecular structural rearrangement, the DFT calculations also reveal large changes in the intermolecular distances between the microhydrating water molecules and the –NH2 and –CO2 groups of phenylalanine. For the amine group, the two intermolecular NH2⋯OH2 distances decrease from 3.344 Å and 3.194 Å to 2.916 Å and 2.904 Å, respectively. The contraction of the NH2⋯OH2 distances is consistent with the –NH2 group gaining a partial positive charge upon photodetachment, resulting in a stronger electrostatic interaction between itself and the hydrogen bond-accepting H2O molecules. The carboxylate group, on the other hand, loses its formal negative charge upon photodetachment. The weakened hydrogen bond between the carboxylate group and the hydrogen bond-donating water molecules is reflected in the increase in the intermolecular CO2⋯H2O bond distances from 2.634 Å and 2.648 Å to 2.825 Å and 2.832 Å, respectively. These large changes in the intermolecular distances favor the initiation of intermolecular vibrational wave packet motion involving hindered translation between the Phe˙ radical and the water molecules of hydration. Based on our DFT calculations, these modes are found at ∼100–200 cm−1. Future investigations will aim to elucidate coherent intermolecular vibrational dynamics that are associated with the solvation of the Phe˙ radical.
Ab initio simulations of the vibrational frequencies and decarboxylation reaction of Phe˙
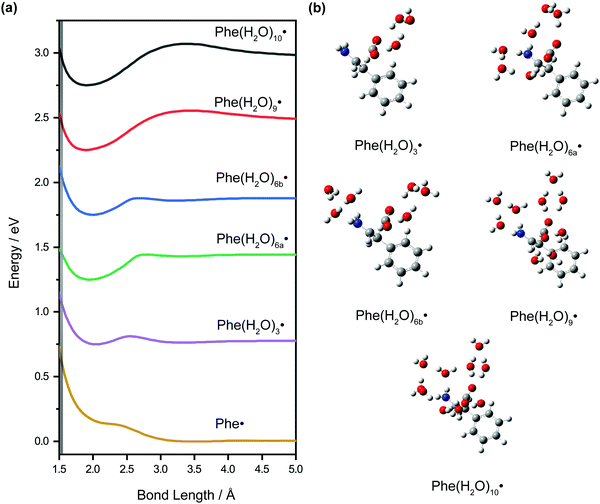
DFT calculations were performed on microhydrated Phe˙ to assign the vibrational frequencies that appear in the vibrational wave packet dynamics. The calculated vibrational frequencies reported in Table 1 are those of the microhydrated Phe(H2O)10˙ model, in which the –NH2 and –CO2 functional groups are hydrogen-bonded to three and six water molecules, respectively, and a bridging water molecule. Our results suggest that explicit water molecules of hydration are necessary to accurately model the vibrational modes, both intramolecular and intermolecular, that involve the –NH2 and –CO2 groups. For example, the calculated NH2 wag frequency is 770 cm−1 for the Phe(H2O)10˙ model with PCM, in good agreement with the experimentally observed peak at 776 cm−1 in the FFT power spectrum. In contrast, calculations of the isolated Phe˙ radical, even with PCM, yields a frequency of 687 cm−1. The complete list of vibrational frequencies of the Phe˙ radical, modeled with different microhydration configurations, is tabulated along with their assignments in Table S3 (ESI†).The inclusion of microhydration in the DFT calculations is also important for explaining the apparent absence of the decarboxylation pathway (Scheme 1), even though it was inferred from earlier flash photolysis7–9 and pulse radiolysis5 studies of phenylalanine to be one of the dominant fragmentation pathways of the Phe˙ radical. Interestingly, the optimized geometry for the isolated Phe˙ radical with PCM shows a C1–C2 bond length (RCC) of 3.478 Å, more than twice the equilibrium RCC of the Phe− anion. Constrained geometry optimization while varying RCC yields a potential energy curve that is effectively unbound with respect to C1–C2 elongation (Fig. 9a); the bond dissociation energy is only ∼6 meV. For this potential energy curve, classical trajectory calculations show that it takes only 214 fs for RCC to extend from the Franck–Condon region (1.557 Å) to 5.00 Å (Fig. S6, ESI†), where the bond is effectively broken. Our experimental data, however, does not support such an ultrafast depopulation of the Phe˙ radical. To further investigate the origin of this discrepancy, we repeat the constrained geometry optimization on models of the Phe˙ radical with different degrees of microhydration. The calculated potential energy curves are shown in Fig. 9a and the optimized geometries are shown in Fig. 9b.
The addition of explicit water molecules of hydration to the Phe˙ radical model leads to the emergence of a pronounced minimum at RCC ∼ 1.9–2.0 Å in the calculated potential energy curves. Moreover, both the barrier to dissociation and the bond dissociation energy generally increase with the degree of hydration. Going from Phe(H2O)3˙ to Phe(H2O)10˙, for example, the barrier height increases from 0.062 eV to 0.320 eV while the bond dissociation energy increases from 0.027 eV to 0.231 eV. The relevant geometrical and energetic parameters are summarized in Table 3. Notably, the Franck–Condon region goes from being destabilized with respect to the dissociation barrier to being stabilized as the degree of hydration increases. For example, the Franck–Condon region for Phe(H2O)3˙ is 0.232 eV above the dissociation barrier, whereas in the case of Phe(H2O)10˙, the Franck–Condon region is 0.135 eV below the dissociation barrier. When the Franck–Condon region lies below the dissociation barrier, the initially produced wave packet is unable to surmount the barrier, hence suppressing direct C1–C2 dissociation. The potential energy curves obtained from these calculations of the microhydrated Phe˙ radical thus provide a possible explanation for the absence of decarboxylation on the few-picosecond timescale of our experiments. Given that DFT underestimates reaction barriers,68,69 however, it is more appropriate to pay attention to how the potential energy curves (Fig. 9a) and the energetic parameters (Table 3) vary with the degree of microhydration than to the absolute values of the parameters; quantitative accuracy would require multireference configuration interaction (MRCI)70,71 or complete active space perturbation theory (CASPT2),72,73 which however are impractical for the large microhydrated Phe˙ radical. Consistent with the findings of previous ab initio studies, our results suggest that the inclusion of microhydration is needed to correctly reproduce the chemical stability of radical species in aqueous solution.53,74–78 It is important to note that energy residing within other vibrational modes, including those of the solvent bath, can promote the statistical fragmentation of the Phe˙ radical, albeit on timescales beyond the few picoseconds probed in the current experiments.
| C1–C2 bond length/Å | Dissociation barrier heighta/eV | Bond dissociation energyb/eV | Excess energyc/eV | |
|---|---|---|---|---|
| a The dissociation barrier height is referenced to the minimum of the potential energy curve. b The bond dissociation energy is the energy difference between the potential energy when the C1–C2 bond length is 5 Å and the minimum of the potential energy curve. c The excess energy refers to the energy difference between the potential energy at the Franck–Condon region and the dissociation barrier height. A positive excess energy implies that dissociation from the Franck–Condon region is energetically favorable. | ||||
| Phe˙ | 3.478 | 0.006 | 0.006 | 0.554 |
| Phe(H2O)3˙ | 2.046 | 0.062 | 0.027 | 0.232 |
| Phe(H2O)5˙ | 1.981 | 0.156 | 0.164 | 0.092 |
| Phe(H2O)6a˙ | 1.950 | 0.193 | 0.192 | −0.007 |
| Phe(H2O)6b˙ | 1.997 | 0.128 | 0.116 | 0.138 |
| Phe(H2O)9˙ | 1.899 | 0.304 | 0.232 | −0.123 |
| Phe(H2O)10˙ | 1.905 | 0.320 | 0.231 | −0.135 |
Conclusion
Femtosecond photodetachment of aqueous phenylalaninate via a strong-field (3+1)-multiphoton process leads to the formation of the hitherto unobserved Phe˙ radical. Analysis of the time-resolved ΔA spectra collected over ∼0.1 – 10-ps time delay yields the absorption spectrum of the aqueous Phe˙ radical. The absorption spectrum reveals a peak at 308 nm, with an estimated peak molar extinction coefficient of (3.3 ± 0.7) × 103 M−1 cm−1, and a vibronic progression characterized by a spacing of 482 ± 15 cm−1. Pronounced modulations of the ΔA signal as a function of time delay are observed atop the Phe˙ radical absorption. These modulations are due to coherent vibrational wave packet dynamics. FFT of the first-moment time trace resolves the wave packet dynamics into ten vibrational frequencies, assigned with the aid of DFT calculations to nine vibrational modes, with one of the vibrational frequencies being a first overtone 2ν12. Time-domain analysis yields a dephasing time of 0.13 ± 0.07 ps for the overtone, markedly shorter than the dephasing time of 5.5 ± 0.7 ps obtained for the fundamental frequency. Coherent vibrational motion along these modes is driven by the ultrafast structural rearrangement of the Phe˙ radical from the Franck–Condon region to its equilibrium geometry. Surprisingly, several vibrational modes that involve the breathing and stretching modes of the phenyl sidechain are observed, despite our DFT calculations showing only sub-0.1 pm changes in the bond lengths between the optimized geometries of the Phe− anion and the Phe˙ radical. Moreover, ab initio calculations of the potential energy curve along the C1–C2 elongation coordinate show that the isolated Phe˙ radical, with solvation modeled by PCM, is expected to undergo direct decarboxylation on the 0.2 ps timescale, contrary to the experimental result. The inclusion of explicit water molecules of hydration in the model, however, results in the emergence of a dissociation barrier. With nine water molecules hydrogen-bonded to the –NH2 and –CO2 moieties of the Phe˙ radical, direct dissociation becomes energetically unfavorable as the dissociation barrier rises above the potential energy of the Franck–Condon region. This result explains the absence of ultrafast decarboxylation on the few-picosecond timescale of our experiments and points to the importance of including explicit water molecules of solvation in theoretical models. The identification of the electronic absorption signature of the Phe˙ radical will facilitate the further exploration of the possible role played by the Phe˙ radical in mediating long-distance electron transport in biology. Moreover, the observation of vibrational modes that are coupled to electron ejection, including one that gives rise to an overtone frequency with a ∼0.1 ps-long dephasing time, is pertinent to understanding the recently reported long-lived coherent electron dynamics launched by the attosecond photoionization of phenylalanine. Just as in the present femtosecond photodetachment study, attosecond photoionization is similarly expected to launch vibrational wave packet dynamics whose coupling to coherent electronic motion should be considered. Interestingly, the appearance of an overtone frequency component in our experiments suggests that one cannot exclude the possibility that the long-lived quantum coherence reported in ref. 20 is vibrational in origin. We believe that the present findings are pertinent to future studies of electronic coherences triggered by the attosecond photoionization of biomolecules in aqueous solution.Conflicts of interest
There are no conflicts of interest to declare.Acknowledgements
We acknowledge financial support from the Ministry of Education, Singapore (RG1/20, RG105/17, and MOE2014-T2-2-052). M. S. B. M. Y. is supported by the Nanyang President's Graduate Scholarship. J. X. S. and N. Y. are supported by the C. N. Yang Scholarship.References
- N. V. Bhagavan and C.-E. Ha, in Essentials of Medical Biochemistry, ed. N. V. Bhagavan and C.-E. Ha, Academic Press, San Diego, 2nd edn, 2015, pp. 227–268 Search PubMed.
- T. Komoda and T. Matsunaga, in Biochemistry for Medical Professionals, ed. T. Komoda and T. Matsunaga, Academic Press, Boston, 2015, pp. 25–63 Search PubMed.
- P. H. Cannington and N. S. Ham, J. Electron Spectrosc. Relat. Phenom., 1983, 32, 139–151 CrossRef CAS.
- D. M. Close, J. Phys. Chem. A, 2011, 115, 2900–2912 CrossRef CAS PubMed.
- D. Wang, H.-P. Schuchmann and C. V. Sonntag, Z. Naturforsch., B: J. Chem. Sci., 1993, 48, 761–770 CrossRef CAS.
- A. Galano and A. Cruz-Torres, Org. Biomol. Chem., 2008, 6, 732–738 RSC.
- L. J. Mittal, J. P. Mittal and E. Hayon, J. Am. Chem. Soc., 1973, 95, 6203–6210 CrossRef CAS.
- L. J. Mittal, J. P. Mittal and E. Hayon, Chem. Phys. Lett., 1973, 18, 319–322 CrossRef CAS.
- D. V. Bent and E. Hayon, J. Am. Chem. Soc., 1975, 97, 2606–2612 CrossRef CAS PubMed.
- D. V. Bent and E. Hayon, J. Am. Chem. Soc., 1975, 97, 2599–2606 CrossRef CAS PubMed.
- A. Gräslund, M. Sahlin and B. M. Sjöberg, Environ. Health Perspect., 1985, 64, 139–149 Search PubMed.
- S. Oldemeyer, S. Franz, S. Wenzel, L.-O. Essen, M. Mittag and T. Kottke, J. Biol. Chem., 2016, 291, 14062–14071 CrossRef CAS PubMed.
- J. L. Redpath, R. Santus, J. Ovadia and L. I. Grossweiner, Int. J. Radiat. Biol., 1975, 27, 201–204 CAS.
- J. F. Baugher and L. I. Grossweiner, J. Phys. Chem., 1977, 81, 1349–1354 CrossRef CAS.
- S. Solar, N. Getoff, P. S. Surdhar, D. A. Armstrong and A. Singh, J. Phys. Chem., 1991, 95, 3639–3643 CrossRef CAS.
- H. Kandori, R. F. Borkman and K. Yoshihara, J. Phys. Chem., 1993, 97, 9664–9667 CrossRef CAS.
- W. G. McGimpsey and H. Görner, Photochem. Photobiol., 1996, 64, 501–509 CrossRef CAS.
- K. L. Stevenson, G. A. Papadantonakis and P. R. LeBreton, J. Photochem. Photobiol., A, 2000, 133, 159–167 CrossRef CAS.
- B. C. Larson, J. R. Pomponio, H. S. Shafaat, R. H. Kim, B. S. Leigh, M. J. Tauber and J. E. Kim, J. Phys. Chem. B, 2015, 119, 9438–9449 CrossRef CAS PubMed.
- F. Calegari, D. Ayuso, A. Trabattoni, L. Belshaw, S. De Camillis, S. Anumula, F. Frassetto, L. Poletto, A. Palacios, P. Decleva, J. B. Greenwood, F. Martín and M. Nisoli, Science, 2014, 346, 336–339 CrossRef CAS PubMed.
- F. Calegari, D. Ayuso, A. Trabattoni, L. Belshaw, S. D. Camillis, F. Frassetto, L. Poletto, A. Palacios, P. Decleva, J. B. Greenwood, F. Martín and M. Nisoli, IEEE J. Sel. Top. Quantum Electron., 2015, 21, 1–12 Search PubMed.
- M. Lara-Astiaso, M. Galli, A. Trabattoni, A. Palacios, D. Ayuso, F. Frassetto, L. Poletto, S. De Camillis, J. Greenwood, P. Decleva, I. Tavernelli, F. Calegari, M. Nisoli and F. Martín, J. Phys. Chem. Lett., 2018, 9, 4570–4577 CrossRef CAS PubMed.
- M. Vargas, N. S. Malvankar, P.-L. Tremblay, C. Leang, J. A. Smith, P. Patel, O. Synoeyenbos-West, K. P. Nevin, D. R. Lovley and S. J. Giovannoni, mBio, 2013, 4, e00105–00113 CrossRef PubMed.
- G. T. Feliciano, R. J. Steidl and G. Reguera, Phys. Chem. Chem. Phys., 2015, 17, 22217–22226 RSC.
- A. Roy, R. Seidel, G. Kumar and S. E. Bradforth, J. Phys. Chem. B, 2018, 122, 3723–3733 CrossRef CAS PubMed.
- J. G. Nathanael, L. F. Gamon, M. Cordes, P. R. Rablen, T. Bally, K. M. Fromm, B. Giese and U. Wille, ChemBioChem, 2018, 19, 922–926 CrossRef CAS PubMed.
- T. Debnath, M. S. B. Mohd Yusof, P. J. Low and Z.-H. Loh, Nat. Commun., 2019, 10, 2944 CrossRef PubMed.
- V. V. Lozovoy, I. Pastirk and M. Dantus, Opt. Lett., 2004, 29, 775–777 CrossRef PubMed.
- D. Pestov, V. V. Lozovoy and M. Dantus, Opt. Express, 2009, 17, 14351–14361 CrossRef PubMed.
- H.-C. Tseng, C.-Y. Lee, W.-L. Weng and I. M. Shiah, Fluid Phase Equilib., 2009, 285, 90–95 CrossRef CAS.
- R. L. Lundblad and F. Macdonald, Handbook of biochemistry and molecular biology, CRC Press, an imprint of Taylor and Francis, 5th edn, 2018 Search PubMed.
- M. J. Frisch, G. W. Trucks, H. B. Schlegel, G. E. Scuseria, M. A. Robb, J. R. Cheeseman, G. Scalmani, V. Barone, G. A. Petersson, H. Nakatsuji, X. Li, M. Caricato, A. V. Marenich, J. Bloino, B. G. Janesko, R. Gomperts, B. Mennucci, H. P. Hratchian, J. V. Ortiz, A. F. Izmaylov, J. L. Sonnenberg, D. Williams-Young, F. Ding, F. Lipparini, F. Egidi, J. Goings, B. Peng, A. Petrone, T. Henderson, D. Ranasinghe, V. G. Zakrzewski, J. Gao, N. Rega, G. Zheng, W. Liang, M. Hada, M. Ehara, K. Toyota, R. Fukuda, J. Hasegawa, M. Ishida, T. Nakajima, Y. Honda, O. Kitao, H. Nakai, T. Vreven, K. Throssell, J. A. Montgomery Jr., J. E. Peralta, F. Ogliaro, M. J. Bearpark, J. J. Heyd, E. N. Brothers, K. N. Kudin, V. N. Staroverov, T. A. Keith, R. Kobayashi, J. Normand, K. Raghavachari, A. P. Rendell, J. C. Burant, S. S. Iyengar, J. Tomasi, M. Cossi, J. M. Millam, M. Klene, C. Adamo, R. Cammi, J. W. Ochterski, R. L. Martin, K. Morokuma, O. Farkas, J. B. Foresman and D. J. Fox, Gaussian 16 Rev. C.01, Wallingford, CT, 2016 Search PubMed.
- A. D. Becke, Phys. Rev. A: At., Mol., Opt. Phys., 1988, 38, 3098–3100 CrossRef CAS PubMed.
- C. Lee, W. Yang and R. G. Parr, Phys. Rev. B: Condens. Matter Mater. Phys., 1988, 37, 785–789 CrossRef CAS PubMed.
- J. Tomasi, B. Mennucci and R. Cammi, Chem. Rev., 2005, 105, 2999–3094 CrossRef CAS PubMed.
- D. Grand, A. Bernas and E. Amouyal, Chem. Phys., 1979, 44, 73–79 CrossRef CAS.
- F. Ambrosio, G. Miceli and A. Pasquarello, J. Phys. Chem. Lett., 2017, 8, 2055–2059 CrossRef CAS PubMed.
- S. A. Asher, M. Ludwig and C. R. Johnson, J. Am. Chem. Soc., 1986, 108, 3186–3197 CrossRef CAS.
- T. Goto, A. Ikehata, Y. Morisawa and Y. Ozaki, J. Phys. Chem. A, 2013, 117, 2517–2528 CrossRef CAS PubMed.
- R. A. Crowell and D. M. Bartels, J. Phys. Chem., 1996, 100, 17940–17949 CrossRef CAS.
- C. Pépin, T. Goulet, D. Houde and J. P. Jay-Gerin, J. Phys. Chem. A, 1997, 101, 4351–4360 CrossRef.
- C. Silva, P. K. Walhout, K. Yokoyama and P. F. Barbara, Phys. Rev. Lett., 1998, 80, 1086–1089 CrossRef CAS.
- V. H. Vilchiz, J. A. Kloepfer, A. C. Germaine, V. A. Lenchenkov and S. E. Bradforth, J. Phys. Chem. A, 2001, 105, 1711–1723 CrossRef CAS.
- M. H. Elkins, H. L. Williams, A. T. Shreve and D. M. Neumark, Science, 2013, 342, 1496–1499 CrossRef CAS PubMed.
- M. Mostafavi and I. Lampre, in Recent Trends in Radiation Chemistry, ed. J. F. Wishart and B. S. M. Rao, World Scientific, Singapore, 2010, pp. 21–58 Search PubMed.
- F. Torche and J.-L. Marignier, J. Phys. Chem. B, 2016, 120, 7201–7206 CrossRef CAS PubMed.
- M. S. Bin Mohd Yusof, Y. L. Lim and Z.-H. Loh, Phys. Chem. Chem. Phys., 2021, 23, 18525–18534 RSC.
- Z. Lu and R. E. Continetti, J. Phys. Chem. A, 2004, 108, 9962–9969 CrossRef CAS.
- J. A. Gibbard and R. E. Continetti, RSC Adv., 2021, 11, 34250–34261 RSC.
- X.-B. Wang, B. Jagoda-Cwiklik, C. Chi, X.-P. Xing, M. Zhou, P. Jungwirth and L.-S. Wang, Chem. Phys. Lett., 2009, 477, 41–44 CrossRef CAS.
- X.-P. Xing, X.-B. Wang and L.-S. Wang, J. Phys. Chem. A, 2010, 114, 4524–4530 CrossRef CAS PubMed.
- J. Peon, G. C. Hess, J.-M. L. Pecourt, T. Yuzawa and B. Kohler, J. Phys. Chem. A, 1999, 103, 2460–2466 CrossRef CAS.
- D. Ghosh, A. Roy, R. Seidel, B. Winter, S. Bradforth and A. I. Krylov, J. Phys. Chem. B, 2012, 116, 7269–7280 CrossRef CAS PubMed.
- E. B. Wilson, Phys. Rev., 1934, 45, 706–714 CrossRef CAS.
- A. M. Gardner and T. G. Wright, J. Chem. Phys., 2011, 135, 114305 CrossRef PubMed.
- J. H. Odhner, D. A. Romanov and R. J. Levis, Phys. Rev. Lett., 2009, 103, 075005 CrossRef CAS PubMed.
- R. Salter, J. Chu and M. Hippler, Analyst, 2012, 137, 4669–4676 RSC.
- L. Zhu, J. Sage and P. Champion, Science, 1994, 266, 629–632 CrossRef CAS PubMed.
- A. T. N. Kumar, F. Rosca, A. Widom and P. M. Champion, J. Chem. Phys., 2001, 114, 701–724 CrossRef CAS.
- D. W. McCamant, P. Kukura, S. Yoon and R. A. Mathies, Rev. Sci. Instrum., 2004, 75, 4971–4980 CrossRef CAS PubMed.
- P. Kukura, D. W. McCamant, S. Yoon, D. B. Wandschneider and R. A. Mathies, Science, 2005, 310, 1006–1009 CrossRef CAS PubMed.
- R. R. Frontiera, C. Fang, J. Dasgupta and R. A. Mathies, Phys. Chem. Chem. Phys., 2012, 14, 405–414 RSC.
- H. Kuramochi, S. Takeuchi and T. Tahara, Rev. Sci. Instrum., 2016, 87, 043107 CrossRef PubMed.
- H. Kuramochi, S. Takeuchi, K. Yonezawa, H. Kamikubo, M. Kataoka and T. Tahara, Nat. Chem., 2017, 9, 660–666 CrossRef CAS PubMed.
- J. Kim, D.-g. Kang, S. K. Kim and T. Joo, Phys. Chem. Chem. Phys., 2020, 22, 25811–25818 RSC.
- C. Lee, K. Seo, M. Kim and T. Joo, Phys. Chem. Chem. Phys., 2021, 23, 25200–25209 RSC.
- J. Kim, C. H. Kim, C. Burger, M. Park, M. F. Kling, D. E. Kim and T. Joo, J. Phys. Chem. Lett., 2020, 11, 755–761 CrossRef CAS PubMed.
- Y. Zhao, B. J. Lynch and D. G. Truhlar, J. Phys. Chem. A, 2004, 108, 2715–2719 CrossRef CAS.
- A. J. Cohen, P. Mori-Sánchez and W. Yang, Science, 2008, 321, 792–794 CrossRef CAS PubMed.
- H. J. Werner and P. J. Knowles, J. Chem. Phys., 1988, 89, 5803–5814 CrossRef CAS.
- P. G. Szalay, T. Müller, G. Gidofalvi, H. Lischka and R. Shepard, Chem. Rev., 2012, 112, 108–181 CrossRef CAS PubMed.
- K. Andersson, P. Å. Malmqvist and B. O. Roos, J. Chem. Phys., 1992, 96, 1218–1226 CrossRef CAS.
- D. Roca-Sanjuán, F. Aquilante and R. Lindh, Wiley Interdiscip. Rev.: Comput. Mol. Sci., 2012, 2, 585–603 Search PubMed.
- M. Hanus, M. Kabeláč, J. Rejnek, F. Ryjáček and P. Hobza, J. Phys. Chem. B, 2004, 108, 2087–2097 CrossRef CAS.
- S. Kim and H. F. Schaefer III, J. Chem. Phys., 2007, 126, 064301 CrossRef PubMed.
- L. Belau, K. R. Wilson, S. R. Leone and M. Ahmed, J. Phys. Chem. A, 2007, 111, 7562–7568 CrossRef CAS PubMed.
- K. Khistyaev, A. Golan, K. B. Bravaya, N. Orms, A. I. Krylov and M. Ahmed, J. Phys. Chem. A, 2013, 117, 6789–6797 CrossRef CAS PubMed.
- J. C. Walton, Chem. Soc. Rev., 2021, 50, 7496–7512 RSC.
Footnote |
| † Electronic supplementary information (ESI) available. See DOI: 10.1039/d1cp04326a |
| This journal is © the Owner Societies 2022 |


