 Open Access Article
Creative Commons Attribution 3.0 Unported Licence
The influence of silica nanoparticle geometry on the interfacial interactions of organic molecules: a molecular dynamics study†
Prasad
Rama
 * and
Zareen
Abbas

Department of Chemistry and Molecular Biology, University of Gothenburg, Gothenburg – 41125, Sweden. E-mail: prasad.rama@gu.se
First published on 13th January 2022
Abstract
The role of nanoparticle shape in the interaction and adsorption of organic molecules on the particle surface is an unexplored area. On the other hand, such knowledge is not only vital for a basic understanding of organic molecule interaction with nanoparticle surfaces but also essential for evaluating the cellular uptake of nanoparticles for living organisms. The current study investigates the role of silica nanoparticle shape in the interactions of phthalic acid organic molecules by using molecular dynamics simulations. Silica nanoparticles of two different geometries namely spheroid and cuboid with varying charge densities along with protonated and deprotonated phthalic acid molecules are studied. The adsorption characteristics of phthalic acid molecules on these nanoparticles have been analysed under different aquatic environments. The interactions of phthalic acid molecules, water molecules and ions were found to be different for spheroid and cubic shaped particles at pH values of 2–3, 7 and 9–10. The interaction of phthalic acid molecules with cubical silica nanoparticles is enhanced compared to the spherical shape particles. Such an enhanced interaction was seen when the silica surface is neutral, pH 2–3 and when the silica surface is charged at pH 7 and pH 9–10 in the presence of 0.5 M NaCl electrolyte. The cuboid-shaped silica also exhibited more hydrophilicity and less negative surface potential compared to spheroid shaped particles at pH 9–10. This is due to the enhanced condensation of Na+ counter-ions at the cuboid nanoparticle solution interface as to the interface of spheroid particles, which is well in agreement with Manning's theory of counter-ion condensation. Simulation results presented in this study indicate that the shape of the silica nanoparticle has significant influence on the interaction of water molecules, counter-ions and organic molecules which consequently determine the adsorption behaviour of organic molecules on the nanoparticle surface.
1. Introduction
Silicon dioxide in the form of crystalline quartz is the most abundant oxide present on earth. On the other hand, porous silica (SiO2) nanoparticles are the most commercially produced nanoparticles and have a wide range of applications such as filler material in papermaking, hygiene products, and grouting material to name a few. Its behaviour in contact with water plays a major role not only in industrial applications but also in a variety of environmental and geochemical processes.1 Despite its vital role, the details of the aqueous silica interface at the molecular level are still not fully understood. Silica nanoparticles entering into natural aqueous systems such as fresh and saltwater interact with the organic matter released by the living organisms such as plants and animals or by industrial processes.2 Thus, these nanoparticles after entering into the aqueous systems can be transformed into a complex aggregated state due to changes in their surface properties (surface charge, potential) in different aqueous environments or by the adsorption of organic matter.3Besides the surface properties, shape of the nanoparticle can also induce specific interactions with organic matter. Shape effect of silica nanoparticles has recently been investigated in cellular uptake.4–6 For example, Huang et al.7 have reported the shape effect of mesoporous silica nanoparticles (MSNs) on cellular uptake and behaviour, it was found that nanoparticles with larger aspect ratios had a greater impact on different aspects of cellular function. Zhao et al.8 had a comparative study between spherical and rod-shaped MSNs demonstrating that nifedipine (NI) drug-loaded long rod-shaped MSNs had a higher bioavailability than NI-loaded short rod and spherical shaped MSNs.
It has also been reported that shape of the nanoparticles can influence the adsorption of metal ions or dyes on metal oxides.9,10 For instance, Tian et al.11 had examined the adsorption of methyl orange on NiCo2O4 nanoparticles of different shapes and concluded that the removal efficiency of nanorods for methyl orange is the highest. Krzysztof et al.12 have reported interactions of various benzoic acid derivatives of organic matter with respect to the flat surface of charged silica periodic in two dimensions (extended indefinitely) that has shown relatively distinctive adsorption behaviour both in pure and saline water under different pH conditions. There are also numerous studies reported on the curvature effect of silica nanoparticles13–15 on lysozymes, cytochrome etc. indicating adsorbed lysozyme or cytochrome shows a narrower orientation distribution and a greater conformation change with a decrease in surface curvature of silica nanoparticles. Hence the interface involving the silica surface plays an important role in the adsorption phenomenon.
The current work aims to study the interactions of silica nanoparticles of different geometry with small organic molecules such as Phthalic acid (PHTHA, 1,2-benzenedicarboxylic acid) in an aqueous ionic solution. Phthalic acid is a typical precursor used in the production of phthalates,16 widely known as plasticizers. Phthalates are extensively used in the manufacture of toys, cosmetics, medical tubes, plastic bottles, blood bags, glues, dye solvents and detergents etc.16,17 They contaminate the surrounding environment through leaching in water during daily usage and disposal of the products.18
Therefore, molecular-level information about the interfacial interaction of silica nanoparticles and phthalic acid organic molecules can be helpful in understanding the fate of these molecules in natural aqueous environments. Here we provide such a detailed understanding at the molecular level of spherical and cubic silica nanoparticles using fully atomistic molecular dynamic (MD) simulations. We evaluate the interactions of PHTHA molecules towards the interface of spherical and cubic silica in various aqueous environments and identify the crucial parameters such as adsorption, counter-ion condensation and surface potentials.
2. Simulation details
2.1 Simulation model
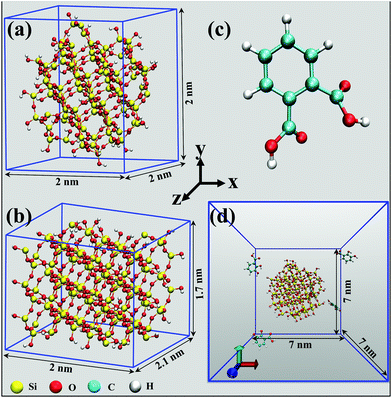
The atomic representation of models for the two different geometries of cristobalite silica (i.e.) spheroid and a cuboid having the comparable solvent accessible surface area are as shown in Fig. 1(a) and (b). The concentration of isolated silanol groups (55 on each) was kept constant and distributed randomly over their surface. The size of the spheroid nanoparticle considered is 1 nm in radius and the cuboid nanoparticle has a geometry of 2 nm in length, 2.1 nm in width and a height of 1.7 nm along the X, Z and Y-axis respectively.All the Initial coordinates for the two different geometries of silica nanoparticles and PHTHA organic molecules were generated using Visual Molecular Dynamics (VMD)19 and Avogadro20 software packages. The model had been set up such that a simulation box of dimension 7 × 7 × 7 nm3 was considered with five molecules of PHTHA distributed randomly over the box and a silica nanoparticle of respective geometry with its center of mass located at the center of the simulation box. To solvate the system, we used TIP4P water model21 of 11350 water molecules and periodic boundary corrections were applied in all the three directions. Three different models corresponding to the silica surface at different pH were obtained by deprotonating the surface silanol groups 0%, 20% and 65% which corresponds to a pH of 2–3, 7 and 9–10, respectively and assigned an additional −1 partial charge to the corresponding deprotonated oxygen.22,23 The organic molecules were modelled at different pH environments by deprotonating their carboxylic groups as per their dissociation constant values (pKa: 2.98; 5.28, one for each carboxylic group) from the literature.12,24,25 Therefore, pH 2–3 corresponds to the system where the model molecules and the silica surface were fully protonated and pH 7 corresponds where the carboxylic groups of model molecules and 20% of surface silanol groups were deprotonated. Whereas, pH 9–10 resembles where the carboxylic groups of model molecules and 65% of surface silanol groups were deprotonated. Sodium ions were added to the simulation box wherever required to keep the net charge of the system as neutral.
2.2 Computational details
The required topology files corresponding to the structural coordinate files were prepared to define all the bonds, angles, dihedrals, masses and charges of each atom as well as their charge groups present in the silica nanoparticles by utilizing the data reported in the literature.12 Topology files of protonated and deprotonated PHTHA organic molecules were prepared using the tool STaGE (Small molecule Topology GEnerator).26 All of our MD simulations were performed using the GROMACS-2019.2 package27 and OPLS-AA force field28,29 (Table S1, ESI†) was used to model the interatomic interactions. The systems are first well equilibrated in an NVT ensemble for t = 100 ps and then final production runs were performed using NPT ensemble for t = 100 ns. The simulations were performed at a temperature of T = 300 K and a pressure of P = 1 bar. A Berendsen coupling thermostat and barostat30 with a relaxation time of τ = 0.1 ps is used for temperature and τ = 2.0 ps for pressure control. van der Waals forces are calculated using a smooth cut off of 8–10 Å. The force constant was set to 40 kcal (Å−2 mol−1). To hold the silica nanoparticle at the center of the box, the silicon and oxygen atoms inside the nanoparticle were restrained and the surface silanol groups are allowed to respond as per the dynamics of the system. All the electrostatic interactions carried out in this study are evaluated using a ‘particle–particle particle-mesh’ Ewald solver31 with a grid spacing of 1 Å. A time step size of 2 fs was used for integrating the equations of motion.3. Results and discussion
3.1 Solvent accessible surface area
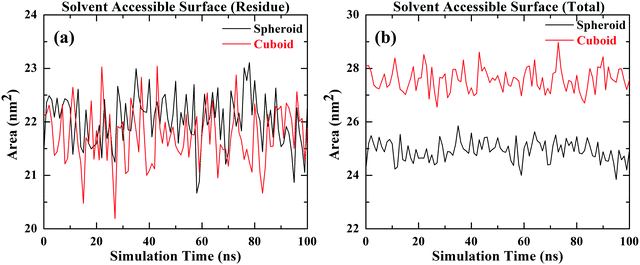
To evaluate the geometric surface area of silica nanoparticles with two different geometries namely spheroid and a cuboid, solvent accessible surface area determined by simulations has been considered as a good measure for evaluating the surface area of nanoparticles exposed to the interacting organic molecules.32 In this study solvent accessible surface area for spherical and cuboid geometries is determined by MD simulations as shown in Fig. 2. The radius of the probe sphere considered to trace out the surface area calculation is 1.4 Å which roughly mimics as a water molecule. Fig. 2(a) represents the available surface area due to the residue (silanol, Si–OH) groups accessible to the solvent surrounding the cuboid and spheroid nanoparticles. The average residual area (Si–OH) exposed to the organic molecules in both cases is equal i.e., 22 nm2. Fig. 2(b) signifies the total surface area of the silica nanoparticle accessible to the adsorption of organic molecules for both the geometries considered. From the plot, it can be inferred that the average total surface area available for the interaction of organic molecules in the case of spheroid geometry is about 25 nm2 and for cuboid geometry is 27 nm2 approximately. These molecular models with their respective interfacial areas are utilised to carry out further investigations in this study.3.2 Adsorption of PHTHA organic molecules
To explore the adsorption behaviour of PHTHA organic molecules on the silica nanoparticles with spheroid and cuboid geometry, density distribution of PHTHA molecules on the surface of silica nanoparticles are calculated and plotted as a function of distance from the center of the silica nanoparticle as shown in Fig. 3. The linear density distribution of PHTHA molecules is carried out such that the simulation box is sliced in YZ-plane with a bin width of 0.1 Å along X-axis. Fig. 3(a) corresponds to the linear density distribution of PHTHA molecules representing the interfacial interactions between the silica nanoparticles and PHTHA molecules at pH 2–3. Here one can observe strong interactions of organic molecules with both the geometries of silica surface as compared to all other pH conditions examined in this study. Specifically, PHTHA molecules have shown a strong affinity towards cuboid geometry as compared to spheroid geometry. The observed difference in affinity can be attributed to the differences induced by spheroid and cuboid geometries on the translational and rotational motions of PHTHA molecules eventually affecting their adsorption behaviour.33 The neutral organic molecules are also found closer (d ≈ −1.25 nm, 1.25 nm) to the neutral silica surface of respective geometry as compared to all other pH conditions, where silica surface is charged. This can be attributed to the van der Waals interactions which drive the adsorption of protonated PHTHA molecules resulting in close proximity to the silica surface.Fig. 3(b) represents the interactions for the case of pH 7 in both aqueous and salt environments, showing a weak interfacial interaction of PHTHA molecules towards silica nanoparticles of respective geometry due to electrostatic repulsive interactions between the negatively charged molecules and the negatively charged silica surface. A shift in the distribution of PHTHA molecules (d ≤ −1.0 nm, & d ≥ 1.0 nm) away from the geometric interface of silica nanoparticles was noticed as compared to the case of pH 2–3. The observed shift in the distribution can be ascribed to the combined effect of layer of water molecules solvating the charged silanolate (Si–O−) groups of silica (20% surface silanol groups deprotonated) surface which pushes the PHTHA molecules away from its surface and repulsive nature of interactions among negatively charged silica and PHTHA molecules.
Fig. 3(c) represents the density distribution curves for the case of pH 9–10 in which spheroid geometry showing a strong interfacial interaction with PHTHA molecules as compared to the cuboid geometry. However, with the addition of 0.5 M NaCl electrolyte the interfacial interactions of PHTHA molecules enhances with the cuboid geometry exhibiting in the layering of PHTHA molecules and the first layer is closer than the spheroid case. Such a shift of first layer closer to the cuboid silica surface is due to the enhanced counter-ion (Na+) condensation which results in counter-ion mediated interactions bridging the silanolate (Si–O−) groups of silica nanoparticle and carboxylate (–COO−) groups of PHTHA molecules. At pH 9–10, a further shift in the distribution peak (d ≤ −1.0 nm & d ≥ 1.0 nm) is observed at the geometric interface compared to the case of pH 7. The observed shift can be ascribed to the increased number of water molecules around the negatively charged silica (65% surface silanol groups deprotonated) surface in addition to the repulsive nature of interactions among the negatively charged silica and PHTHA molecules.
Thus, PHTHA organic molecules have shown relatively distinct interactions with silica nanoparticles of different geometries at various pH conditions of aqueous environments.
To illustrate the response of PHTHA molecules with respect to the geometry of silica nanoparticle, the minimum distance of approach or contacts between silica nanoparticles of spheroid or cuboid geometry and PHTHA molecules has been calculated (Fig. S1, ESI†). To obtain the number of contacts of PHTHA molecule with silica surface, the trajectories of simulations for cuboid and spheroid particles were averaged over the time period of 50 ns to 100 ns with a cut off distance of 0.6 nm from the silica surface. The average minimum distance of approach of PHTHA molecules towards the silica interface at various pH values is shown in Fig. 4.
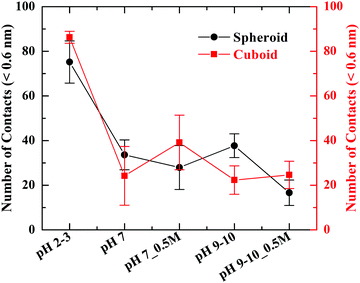 | ||
| Fig. 4 Number of contacts between silica nanoparticles of spheroid and cuboid geometry and PHTHA molecules at various pH values of the system considered. | ||
From the plot, it can be inferred that at pH 2–3, PHTHA molecules have shown a strong affinity (van der Waals attraction) towards both the geometries of silica as to all other pH conditions considered in this study. The significant reduction in the number of contacts observed at pH 7 and 9–10 is due to the repulsive nature of interactions among the negatively charged molecules and silica surfaces. However, with the addition of 0.5 M of NaCl electrolyte, at pH 7 and 9–10 the interaction of PHTHA molecules with the cuboid geometry is enhanced as compared to spheroid. This can be attributed to the increase in the condensation of Na+ ions at the cuboid nanoparticle solution interface resulting in the screening of its surface charge thereby favouring the counterion mediated attractive interactions with PHTHA molecules. The inferences drawn are well in correlation with the linear distribution plots shown in Fig. 3. For instance, simulation snapshots representing the counterion mediated binding structure and orientation of PHTHA molecules towards the spheroid and cuboid silica at pH 7_0.5 M are shown in Fig. 5. It can be observed that PHTHA molecules interact with surface silanolate groups through their carboxylate (COO−) groups mediated by Na+ ions. The rise in the condensation of Na+ ions at the interface of cuboid silica can also be observed. Water molecules are not shown here for visual clarity. Snapshots at other pH conditions are reported in Fig. S2 of ESI.†
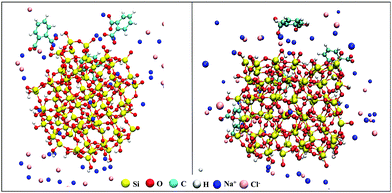 | ||
| Fig. 5 Snapshots representing the binding structure and orientation of PHTHA molecules towards the spheroid and cuboid geometries of silica nanoparticle at pH 7_0.5 M of aqueous environment. | ||
3.3 Counter-ion Adsorption
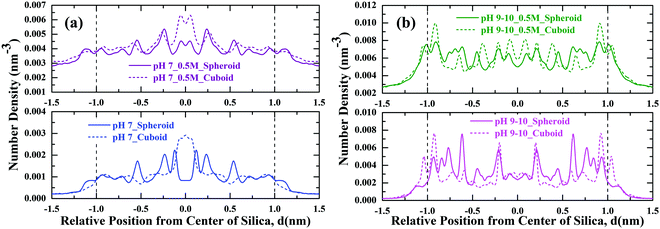
Densities of Na+ counter-ions as a function of the simulation box length for volumes that were sliced in the YZ-plane with a bin width of 0.1 Å along the X-axis are plotted in Fig. 6 at different pH conditions in aqueous ionic solutions. We observe that the number density of Na+ ions on the cuboid geometric interface is higher as compared to the spheroid case in all the cases (pH 7, pH 7_0.5 M, pH 9–10, pH 9–10_0.5 M) considered in this study. The obtained results are well in agreement with Manning's theory of counter-ion condensation on charged spheres and planes.34 According to this theory in dilute solutions of non-zero salt or simple salt, a planar surface of any charge density condenses significantly more counter-ions as compared to a charged sphere. Hence the observed counter-ion density on the cuboid geometric interface is higher at all pH values.3.4 Dynamic properties of water
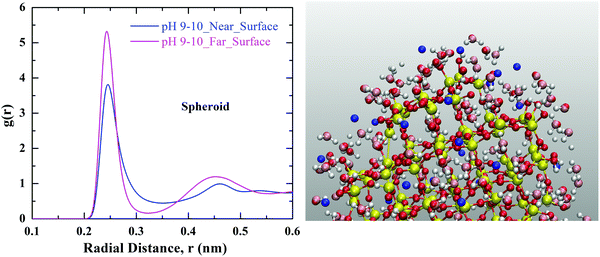
It is interesting to know about how the Na+ ion hydration changes in the vicinity of charged silica surface as compared to the ion hydration in the bulk solution. Fig. 8. Represents the coordination of water molecules around the Na+ ion in the vicinity of silica nanoparticles of spheroid geometry. We observe a decrease in the coordination of water molecules around the Na+ ion in the vicinity (≤0.2 nm) of the silica nanoparticle as compared to the Na+ ion which is far away (>2 nm) from the surface of the nanoparticle. We interpret this to the loss of water molecules surrounding Na+ ions while traversing from solvent to the surface of silica.36 Similar effect has been observed för cuboid silica and results are shown in Fig. S4 of ESI.†
Fig. 9 shows the number of hydrogen bonds averaged over the duration of simulation at various pH conditions concerning the two geometries of silica. The simulation results revealed the possible number of hydrogen bonds among the water molecules and silanol groups at the geometric interface of silica nanoparticles vary with their populations depending on the pH environment of the aqueous solutions, pH 2–3, pH 7 and pH 9–10.
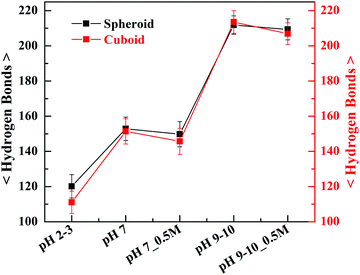 | ||
| Fig. 9 The average number of hydrogen bonds (with error bars) formed at the silica–water interface with regard to the spheroid and cuboid geometries of silica nanoparticles at various pH conditions. | ||
The average number of hydrogen bonds formed at the geometric interface of silica was found to be increased with an increase in the pH of the aqueous environment. This increase in hydrogen bond number can be attributed to the polarizability of water molecules38 induced by greater number of charged silanolate groups at an increasing pH of the solvent which in turn enhances the hydrogen-bonded interactions. The observed difference in the number of hydrogen bonds with respect to two geometries has been reduced considerably at pH 7 and pH 9–10. On the other hand, the significant difference in the number of hydrogen bonds observed at pH 2–3 can be ascribed to the weakening of the hydrogen bond structure with cuboid geometry accompanied by the orientation of the dipole water vector towards the geometrical surface of nanoparticle.39 Further, it can also be noted that with the addition of 0.5 M NaCl electrolyte there has been a slight decrease in the number of hydrogen bonds which can be inferred due to distortion in the structure of hydrogen bond40 among water molecules and the silanol groups.
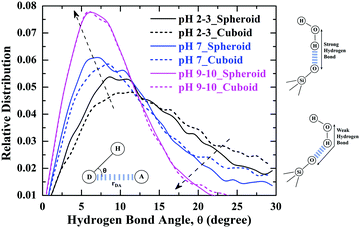
The strength of the hydrogen-bonded interactions among the water molecules and silanol groups of silica nanoparticles of respective geometry is revealed by the bond angle distributions of hydrogen-bonds among the water molecules and silanol groups as shown in Fig. 10. The lower the hydrogen-bond angle is between the water molecules and silanol groups the more is the strength of the hydrogen-bond, resulting in a more ordered network of hydrogen-bonds at silica–water interface. From Fig. 10. It can be seen that the hydrogen-bond angle distribution of water molecules solvating the silanol groups is lowered considerably with an increase in the pH of the aqueous environment indicating, the formation of a more ordered hydrogen-bonding network as the charge on the silica surface increases at increasing pH values.38,41 The root cause of this enhanced hydrogen bonded network at highly charged silica surface is the increase in polarization of coordinating water molecules. This observation is also evident from the decrease in hydrogen-bond lengths, rDA (donor–acceptor distance) calculated for the systems at different pH environments as reported in Fig. S5 of ESI.† From Fig. 10, it can also be inferred that at pH 9–10 when the surface of silica is highly charged, both the geometries of silica nanoparticles had shown a strong correlation in angle distributions among hydrogen-bonds showing a strong ordered network. On the other hand, at pH 2–3 and pH 7, there are differences observed in hydrogen-bond strengths with respect to specific geometry, but these differences are reduced as pH increases to 7. Thus, signifying strength of hydrogen-bonding interactions can be influenced by the geometry of nanoparticle and pH of the aqueous environment surrounding the silica nanoparticle.
3.5 Electrostatic potential distribution
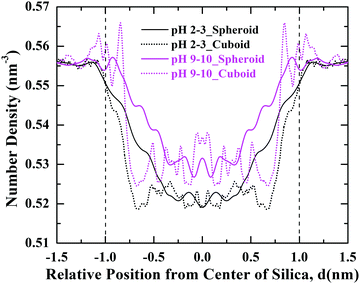
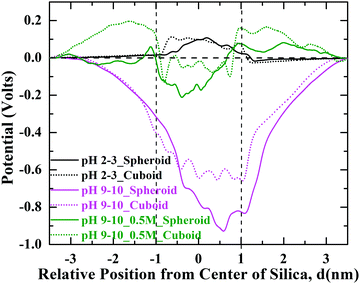
Surface charge of silica nanoparticle plays a major role in driving the interfacial interactions of organic molecules. Electrostatic interactions are long-range and are strongly dependent on the adsorbed molecules, solvent and ions surrounding the geometrically different silica nanoparticles. Electrostatics considers the evaluation of the static electrical field formed between the charged species due to the influence of each other and their local environment. Fig. 11 shows the variation of the electric potential as a function of pH environment. Electric potential values are calculated in the YZ-plane by integrating the charge density along X-axis across the simulation box. For the system with pH 9–10 we observe that surface potential of spheroid silica nanoparticle shows a large negative value, approximately 0.9 V as compared to 0.6 V for cuboid nanoparticle. The observed more negative potential on the surface of spheroid silica can be attributed to the fewer number of Na+ counter-ions condensed onto its surface resulting in less screening of its surface charge (Fig. 6(b)). However, with the addition of 0.5 M NaCl electrolyte, the surface potential on the cuboid silica has decreased to approximately 0.1 V, as a result of enhanced screening of its surface charge by the condensation of Na+ counter-ions. This result is consistent with the idea of electrostatic screening of the surface potential with the addition of salt42 and consequently, a decrease in the screening length so-called Debye length. The surface potentials observed with respect to spheroid and cuboid geometry at other pH conditions can be seen in Fig. S6 of ESI.†4. Conclusions
The study demonstrates that two different geometries of silica i.e., spheroid and cuboid have a profound effect on the interactions of PHTHA organic molecules in different aquatic environments of pH 2–3, 7, and 9–10. Moreover, it was found that the charge on the silica surface and of PHTHA molecules along with the number of condensed counter-ions determine the strength of interaction. The PHTHA molecules exhibited a strong interfacial interaction at pH 2–3 while weaker interactions at pH 7 and pH 9–10 with both spherical and cuboid shape silica nanoparticles. The observed weak interactions are due to the repulsive electrostatic interactions between the negatively charged PHTHA molecules and negatively charged silica surface. The inferences drawn are also consistent with the number of contact counts of PHTHA molecules with the geometric interface of respective silica. Atomistic MD simulations results reveal that cuboid geometry enhances the condensation of Na+ counter-ions compared to the spheroid geometry thereby validating Manning's theory of counter-ion condensation.The hydrogen-bonded interactions among the water molecules and silanol groups (H2O and Si–O−/Si–OH) at spheroid and cuboid geometric interfaces have been investigated in detail. An increase in the hydrogen-bonded network has been noticed at increasing pH values indicating more structured water at highly charged silica surfaces at pH 9–10. This is true for both spheroid and cuboid silica nanoparticles. However, at pH-2–3 where silica surface is neutral there are some differences observed namely the spheroid geometry of silica nanoparticle exhibited strong hydrogen-bonded interaction compared to the cuboid. The calculated electrostatic potential at the interface of cuboid and spheroid silica nanoparticles in NaCl electrolyte showed that potential around spheroid silica is more negative than cuboid silica. This is due to the enhanced screening of the charged cuboid surface by Na+ counter-ions as compared to the spheroid silica. The enhanced screening of the surface charge on cuboid silica in presence of 0.5 M NaCl has also led to the increased adsorption of negatively charged PHTHA molecules due to reduced repulsion between the similarly charged silica and PHTHA molecules. The outcomes showed that shape of the silica nanoparticles have profound effects on the adsorption behaviour of organic molecules, water molecules and counter-ions.
Conflicts of interest
There are no conflicts of interest to declare.Acknowledgements
The authors would like to acknowledge Mistra (The Swedish Foundation for Strategic Environmental Research) for funding (DIA 2013/48) of this work under the Mistra Environmental Nanosafety project. We are grateful to Dr Krzysztof Kolman, Prof. Lars-Anders Hansson and Dr Julian Alberto Gallego for their helpful inputs regarding the work. We also thank the Swedish National Infrastructure for Computing (SNIC) for providing us with the computational time.References
- M. Sulpizi, M. P. Gaigeot and M. Sprik, The silica–water interface: How the silanols determine the surface acidity and modulate the water properties, J. Chem. Theory Comput., 2012, 8, 1037–1047 CrossRef CAS PubMed.
- A. Philippe and G. E. Schaumann, Interactions of dissolved organic matter with natural and engineered inorganic colloids: A review, Environ. Sci. Technol., 2014, 48, 8946–8962 CrossRef CAS PubMed.
- S. K. Parida, S. Dash, S. Patel and B. K. Mishra, Adsorption of organic molecules on silica surface, Adv. Colloid Interface Sci., 2006, 121, 77–110 CrossRef CAS PubMed.
- A. Sukhanova, S. Bozrova, P. Sokolov, M. Berestovoy, A. Karaulov and I. Nabiev, Dependence of Nanoparticle Toxicity on Their Physical and Chemical Properties, Nanoscale Res. Lett., 2018, 13(44), 1–21 CAS.
- D. Napierska, L. C. J. Thomassen, D. Lison, J. A. Martens and P. H. Hoet, The nanosilica hazard: Another variable entity, Part. Fibre Toxicol., 2010, 7, 1–32 CrossRef PubMed.
- A. E. Nel, L. Mädler, D. Velegol, T. Xia, E. M. V. Hoek, P. Somasundaran, F. Klaessig, V. Castranova and M. Thompson, Nat. Mater., 2009, 8, 543–557 CrossRef CAS PubMed.
- X. Huang, X. Teng, D. Chen, F. Tang and J. He, The effect of the shape of mesoporous silica nanoparticles on cellular uptake and cell function, Biomaterials, 2010, 31, 438–448 CrossRef CAS PubMed.
- Y. Zhao, Y. Wang, F. Ran, Y. Cui, C. Liu, Q. Zhao, Y. Gao, D. Wang and S. Wang, A comparison between sphere and rod nanoparticles regarding their in vivo biological behavior and pharmacokinetics, Sci. Rep., 2017, 7, 1–11 CrossRef PubMed.
- Z. X. Cui, Y. N. Feng, Y. Q. Xue, J. Zhang, R. Zhang, J. Hao and J. Y. Liu, Shape dependence of thermodynamics of adsorption on nanoparticles: A theoretical and experimental study, Phys. Chem. Chem. Phys., 2018, 20, 29959–29968 RSC.
- Z. Liu, R. Yu, Y. Dong, W. Li and W. Zhou, Preparation of α-Fe2O3 hollow spheres, nanotubes, nanoplates and nanorings as highly efficient Cr(VI) adsorbents, RSC Adv., 2016, 6, 82854–82861 RSC.
- Y. Tian, H. Li, Z. Ruan, G. Cui and S. Yan, Synthesis of NiCo 2 O 4 nanostructures with different morphologies for the removal of methyl orange, Appl. Surf. Sci., 2017, 393, 434–440 CrossRef CAS.
- K. Kolman and Z. Abbas, Molecular dynamics exploration for the adsorption of benzoic acid derivatives on charged silica surfaces, Colloids Surf., A, 2019, 578, 123635 CrossRef CAS.
- G. Yu and J. Zhou, Understanding the curvature effect of silica nanoparticles on lysozyme adsorption orientation and conformation: A mesoscopic coarse-grained simulation study, Phys. Chem. Chem. Phys., 2016, 18, 23500–23507 RSC.
- S. Shrivastava, J. H. Nuffer, R. W. Siegel and J. S. Dordick, Position-specific chemical modification and quantitative proteomics disclose protein orientation adsorbed on silica nanoparticles, Nano Lett., 2012, 12, 1583–1587 CrossRef CAS PubMed.
- X. Sun, Z. Feng, L. Zhang, T. Hou and Y. Li, The selective interaction between silica nanoparticles and enzymes from molecular dynamics simulations, PLoS One, 2014, 9, e107696 CrossRef PubMed.
- S. S. Liang, W. T. Liao, C. J. Kuo, C. H. Chou, C. J. Wu and H. M. Wang, Phthalic acid chemical probes synthesized for protein-protein interaction analysis, Int. J. Mol. Sci., 2013, 14, 12914–12930 CrossRef PubMed.
- Environmental Biotechnology and Safety, Comprehensive Biotechnology, ed. M. Moo-Young, 2011, p. 5320 Search PubMed.
- P. A. Przybylińska and M. Wyszkowski, Environmental contamination with phthalates and its impact on living organisms, Ecol. Chem. Eng. S, 2016, 23, 347–356 Search PubMed.
- W. Humphrey, A. Dalke and K. Schulten, VMD: Visual molecular dynamics, J. Mol. Graphics, 1996, 14, 33–38 CrossRef CAS PubMed.
- M. D. Hanwell, D. E. Curtis, D. C. Lonie, T. Vandermeerschd, E. Zurek and G. R. Hutchison, Avogadro: An advanced semantic chemical editor, visualization, and analysis platform, J. Cheminf., 2012, 4, 1–17 Search PubMed.
- M. L. K. W. L. Jorgensen, J. Chandrasekhar, J. D. Madura and R. W. Impey, Comparison of simple potential functions for simulating liquid water, J. Chem. Phys., 1983, 79, 926–935 CrossRef.
- R. K. Iler, The Chemistry of Silica:Solubility, Polymerization, Colloid and Surface Properties and Biochemistry of Silica, Wiley, 1979, vol. 92, pp. 328–328 Search PubMed.
- S. Jenkins, S. R. Kirk, M. Persson, J. Carlen and Z. Abbas, Molecular dynamics simulation of nanocolloidal amorphous silica particles: Part i, J. Chem. Phys., 2007, 127, 1–10 CrossRef PubMed.
- O. H. H. C. Brown and D. H. Mcdaniel, Dissociation constants, Determ. Org. Struct. by Phys. Methods, Academic Press, 1955 Search PubMed.
- C. M. J. J. Rosenqvist, Potentiometric study of dissociation constants of dihydroxybenzoic acids at reduced ionic strengths and temperatures, Am. J. Anal. Chem., 2017, 8, 142–150 CrossRef.
- E. L. M. Lundborg, Automatic GROMACS topology generation and comparisons of force fields for solvation free energy calculations, J. Phys. Chem. B, 2015, 3, 810–823 CrossRef PubMed.
- M. J. Abraham, D. van der Spoel, E. Lindahl, B. Hess and the GROMACS development team, GROMACS 2019.2 Source code (Version 2019.2) Search PubMed.
- J. T.-R. W. L. Jorgensen, The OPLS [optimized potentials for liquid simulations] potential functions for proteins, energy minimizations for crystals of cyclic peptides and crambin, J. Am. Chem. Soc., 1988, 110, 11225–11236 Search PubMed.
- J. T.-R. W. L. Jorgensen and D. S. Maxwell, Development and testing of the OPLS all-atom force field on conformational energetics and properties of organic liquids, J. Am. Chem. Soc., 1996, 118, 11225–11236 CrossRef.
- H. J. C. Berendsen, J. P. M. Postma, W. F. Van Gunsteren, A. Dinola and J. R. Haak, Molecular dynamics with coupling to an external bath, J. Chem. Phys., 1984, 81, 3684–3690 CrossRef CAS.
- M. L. B. Ulrich Essmann, Lalith Perera, U. Essmann, L. Perera, M. L. Berkowitz, T. Darden, H. Lee and L. G. Pedersen, A smooth particle mesh Ewald method, J. Chem. Phys., 1995, 103, 8577–8593 CrossRef.
- M. L. Connolly, Analytical molecular surface calculation, J. Appl. Crystallogr., 1983, 16, 548–558 CrossRef CAS.
- P. Choo, T. Liu and T. W. Odom, Nanoparticle Shape Determines Dynamics of Targeting Nanoconstructs on Cell Membranes, J. Am. Chem. Soc., 2021, 4550–4555 CrossRef CAS PubMed.
- G. S. Manning, Counterion condensation on charged spheres, cylinders, and planes, J. Phys. Chem. B, 2007, 111, 8554–8559 CrossRef CAS PubMed.
- B. Rehl and J. M. Gibbs, Role of Ions on the Surface-Bound Water Structure at the Silica/Water Interface: Identifying the Spectral Signature of Stability, J. Phys. Chem. Lett., 2021, 2854–2864 CrossRef CAS PubMed.
- C. Sögaard, K. Kolman, M. Christensson, A. B. Otyakmaz and Z. Abbas, Hofmeister effects in the gelling of silica nanoparticles in mixed salt solutions, Colloids Surf., A, 2021, 611(July 2020), 125872 CrossRef.
- G. A. Jeffrey, An Introduction to Hydrogen Bonding, J. Am. Chem. Soc., 1998, 120, 5604 Search PubMed.
- S. Ong, X. Zhao and K. B. Eisenthal, Polarization of water molecules at a charged interface: second harmonic studies of the silica/water interface, Chem. Phys. Lett., 1992, 191, 327–335 CrossRef CAS.
- K. Tay and F. Bresme, Hydrogen bond structure and vibrational spectrum of water at a passivated metal nanoparticle, J. Mater. Chem., 2006, 16, 1956–1962 RSC.
- P. A. Covert, K. C. Jena and D. K. Hore, Throwing Salt into the Mix: Altering Interfacial Water Structure by Electrolyte Addition, J. Phys. Chem. Lett., 2014, 5(1), 143–148 CrossRef CAS PubMed.
- V. Ostroverkhov, G. A. Waychunas and Y. R. Shen, Vibrational spectra of water at water/α-quartz (0 0 0 1) interface, Chem. Phys. Lett., 2004, 386, 144–148 CrossRef CAS.
- P. Rama, A. R. Bhattacharyya, R. Bandyopadhyaya and A. S. Panwar, Ion Valence and Concentration Effects on the Interaction between Polystyrene Sulfonate-Modified Carbon Nanotubes in Water, J. Phys. Chem. C, 2018, 122, 9619–9631 CrossRef CAS.
Footnote |
| † Electronic supplementary information (ESI) available: Data for water density distribution, co-ordination of water molecules with Na+ ions, Donor–Acceptor distance for the hydrogen bonds formed at the silica–water interface, and electrostatic potential profiles were made available. See DOI: 10.1039/d1cp04315c |
| This journal is © the Owner Societies 2022 |

