
 Open Access Article
 This Open Access Article is licensed under a Creative Commons Attribution-Non Commercial 3.0 Unported Licence
Rationalising the difference in crystallisability of two sulflowers using efficient in silico methods†
Isaac J.
Sugden‡
 *a,
Nicholas F.
Francia‡
b,
Torsten
Jensen
c,
Claire S.
Adjiman
a and
Matteo
Salvalaglio
*b
*a,
Nicholas F.
Francia‡
b,
Torsten
Jensen
c,
Claire S.
Adjiman
a and
Matteo
Salvalaglio
*b
aMolecular Systems Engineering Group, Department of Chemical Engineering, Sargent Centre for Process Systems Engineering, Institute for Molecular Science and Engineering, Imperial College London, London SW7 2AZ, UK. E-mail: i.sugden@imperial.ac.uk
bThomas Young Centre and Department of Chemical Engineering, University College London, London WC1E 7JE, UK. E-mail: m.salvalaglio@ucl.ac.uk
cSchool of Chemistry, University of Bristol, Cantock's Close, Bristol, BS8 1TS, UK
First published on 14th September 2022
Abstract
The molecular structures of the first and second generation sulflowers, sulflower and persulfurated coronene (PSC), are remarkably similar: carbon ring structures decorated with sulfur atoms, without any additional moiety. However, their crystallisability is starkly different, with sulflower easily forming well-characterised crystals, but with PSC only resulting in amorphous forms, despite extensive experimental efforts. Here this phenomenon is investigated using crystal structure prediction (CSP) methods to generate plausible structures on the lattice energy surface for both systems, followed by molecular dynamics and well-tempered metadynamics to investigate their persistence at finite temperature. Coherently with experimental observations the sulflower experimental form emerges as exceptionally stable under ambient conditions and persists in all dynamic simulations. However, all PSC structures transition to amorphous phases when subjected to a small amount of work. While CSP methods are commonly used to identify a shortlist of structures that a molecule could plausibly crystallise into, this work demonstrates, for the first time, the ability of in silico methods to predict whether a molecule can crystallise into any structure at all.
1 Introduction
Organosulfur compounds offer applications in several electronics industries, such as organic field effect transistors1 and semiconductors.2 The development of this field is essential to produce new and improved functionality, which typically takes the form of adapting the molecules involved in the films, either through functionalising with organic groups, or adapting the backbone of the materials.3 A change in conjugation or aromaticity for instance, will change the energy of the frontier orbitals, the interaction of which is typically the source of the material's function.4 Crystallinity is another key consideration when designing new materials in this field, as changes in the arrangement of the molecules relative to each other can lead to large variations in physical properties, due to the localisation of frontier orbitals in organic molecules.The organic sulfur heterocycle octathio-8-circulene, or “sulflower”, as seen in Fig. 1A, is a rare example of a molecule comprised entirely of carbon and sulfur atoms.5 It was feted to be a potential “electron donor in materials science applications”, but has not been incorporated into industry due to the difficulty of preparing thin films.
 | ||
| Fig. 1 The sulflower (A) and persulfurated coronene (B) molecular diagrams. Blue and yellow spheres represent carbon and sulfur atoms respectively. | ||
Therefore, recent studies have examined derivatives and analogues of sulflower, such as the persulfurated coronene6 seen in Fig. 1B.
Persulfurated coronene represents a “second generation sulflower”, with extended conjugation, and disulfide bridges, making it a possible cathode material for lithium-sulfur batteries, as well as opening possibilities to superconductors, field effect transistors, and organic photo-voltaics. However, as previously stated, the crystalline form of the material is key to its function, and only amorphous forms of the material have been derived to date.7
This motivated a combined theoretical and experimental investigation into finding a crystal form of the molecule. Initially, crystallisation was attempted via solvent and vapour phase growth methods. Differential scanning calorimetry was used to detect any crystallisation over a heating and cooling cycle of a powdered sample of the molecule. When these methods did not yield any crystalline material, 3D electron diffraction tomography was used to detect the presence of microcrystals in the powder. Remarkably, all aggregates investigated were entirely amorphous. A theoretical study was therefore performed to probe the intermolecular interactions of the molecule. This consisted of electrostatic potential calculations, force-field-based interaction simulations between clusters of up to four molecules, and DFT calculations of the interaction potential landscape between dimers. All methods revealed a molecule that could only form interactions with other like molecules that were not conducive toward crystal growth.7 This work did not however consider the behaviour of the molecule in a periodic crystal.
Crystal structure prediction (CSP) methods seek to predict the crystal forms a molecule can take, from as little information as its molecular diagram,8 and were therefore considered for investigation of these compounds. The field has developed over the past two decades, as observed by the increasing size, flexibility, and complexity of the targets in the blind tests organised by the CCDC.9 Further, there have been several examples in the literature of structures that were predicted computationally being experimentally realised.10 Many CSP methods neglect temperature effects and rank the structures based on the lattice energy (i.e., at 0 K).8 Low-cost lattice dynamic models, such as the harmonic and isotropic quasi-harmonic approximations, are therefore usually used to estimate the free-energy at different temperatures but assume no or little variation of the structure with temperature. Moreover, disorder is not treated as standard, and comparisons to amorphous phases are not made. As well as potentially impacting the accuracy of predictions at ambient conditions, this can lead to overprediction of the likely polymorphs for a given molecule: due to thermal motion, minima in the lattice energy landscape characterized by small barriers can convert to significantly more stable structures or melt.11–13 In support of this view, it was shown that the ensemble of configurations explored by a single polymorph at ambient temperature can correspond to multiple lattice energy minima.14 For these reasons, the equilibration of CSP generated structures at 300 K and 1 bar, has been used as a valuable tool to reduce overprediction.15,16
Aims
Given the extensive experimental techniques employed in attempting to crystallise the persulfurated coronene molecule, it is instructive to consider whether the plethora of computational tools available to modern crystallographers could have i) indicated that no crystal structure for this molecule is feasible, potentially saving the experimental effort, or ii) identify a “target” crystal structure, that is feasible, and for which experimental efforts could be tuned, either through templating,17 high pressure crystallisation,18 desolvation,10,19 or other methods.With this in mind, CSP methods will be used to generate plausible structures for the sulflower system as a test case, in 3.1, and the persulfurated coronene molecule, in section 3.1. In section 3.2, molecular dynamics (MD) and metadynamics will then be used to verify the persistence of putative structures at room temperature and pressure.
2 Methods
2.1 Crystal structure prediction
The methodology adopted for CSP follows the approach described in recent publications.9,20 In both cases, the molecules were first geometry minimised in the gas phase at the PBEPBE/6-311+G(d,p) level of theory using Gaussian09,21 and atomic point charges extracted. The global search was performed using CrystalPredictor II,22 with 500 K minimisations in the 61 most common space groups, treating the molecules as rigid and fixed to their gas phase conformations. Dispersion–repulsion contributions towards the lattice energy were estimated by using a Buckingham exp-6 function with the potential parameters for carbon23 and sulphur24 from the FIT set of Williams and co-workers. Structures within 20 kJ mol−1 of the global minimum were clustered using the CSD Python API25 to compute RMSD15 values.26 If two structures were found to have an RMSD15 less than 0.3 Å, a lattice energy difference of less than 0.2 kJ mol−1 and a density difference of less than 1.0 kg m−3, the higher-energy structure was eliminated. Following analysis and clustering, DMACRYS27 was used to refine the 1000 lowest energy structures in each investigation, at the same level of theory, before a second clustering step using the same settings. The lattice energies reported in the landscapes are given per formula unit. The set of structures generated are referred to as the CSP_0 sets.2.2 Finite temperature reduction
The 20 lowest energy structures of the two CSP_0 sets were subjected to the finite-temperature reduction described in ref. 15 and 16. The 20 structures represent approximately the 5 kJ mol−1 lowest energy structures in both systems, and include a diversity of structures and all the local intermolecular environment discussed in section 3.2. The structures allow an investigation into the crystallisability propensity of the two molecules, and demonstrate this with a minimal computational effort. A larger set could be investigated with finite temperature methods, or at least all structures within the typical polymorphic range of 10 kJ mol−1,28 to increase the confidence that no other structures can be observed.The limitations of classical forcefields, especially related to the use of point charges, make the choice of the forcefield a crucial step in MD simulations and can pose a risk in terms of both accuracy in evaluating the relative energies and behaviour of structures at finite-temperature. Within this work, the general Amber force field29 (GAFF) was used to describe both molecules as it well replicates the CSP_0 lattice energies. Moreover, the experimental form I of sulflower did not exhibit any major distortion after equilibration at 300 K and 1 bar. Atom types were assigned with the AmberTools suite30 and point charges with the AM1-BCC model.31 Simulations were performed with the Gromacs MD package32,33 which requires atoms coordinate files to be written in the order specified in the forcefield.
The atom's index is then rearranged by transforming molecules in graphs and applying the VF2 graph match algorithms34 available in the python library NetworkX.35 Finally, in order to see possible transitions or formation of orientational disorder in a relative small computational time, for each crystal, a supercell of at least 200 molecules was generated. The simulation boxes were chosen to have a nearly cubic shape, with each cell edge around 4.5 nm.
Atom positions were optimized using the steepest descent algorithm. Neighbour lists were updated every 10 steps using the Verlet cutoff scheme. Electrostatic and van der Waals interactions were calculated using a cutoff of 1.0 nm, while long-range interactions were treated with the smooth particle mesh Ewald (PME)32 and Lennard-Jones PME.36 After a first atom position optimization, LAMMPS was used to relax the cell parameters (a feature not available in Gromacs), using InterMol37 to convert the molecular forcefield. A second energy minimization with Gromacs was performed to take into account differences between the two packages37 and the lattice energies recorded.
The equilibration at finite temperature and pressure consists in a 3 ns simulation in the canonical ensemble at 300 K was performed, followed by a 6 ns run in the isothermal–isobaric ensemble at 300 K and 1 bar. The temperature was controlled with the Bussi–Donadio–Parrinello thermostat38 and simulations were performed using a 2 fs timestep. The systems were equilibrated at 1 bar for the first 3 ns using the Berendsen anisotropic barostat39 and then switched to the Parrinello–Rahman barostat40 and a 1 fs timestep for the following 3 ns.
Originally a set of probabilistic structural fingerprints based on the relative position (in the form of the radial distribution function), relative orientation and possible conformations, were used to identify the differences between crystals.15 These are able to handle molecular motion and supercells of large dimensions. Being dominated by the strong anisotropic packing of both PSC and sulflower, the radial pair distribution function of the molecules' centres of mass is nearly identical for all the structures within their respective set. Therefore, it cannot be directly used as part of the structure fingerprint. The main feature that distinguishes different crystal packings is the relative orientation of the columns. This is taken as the angle, θ, between the normal vectors of the planes of each pair of molecules. In order to distinguish the relative orientation of molecules belonging to the same column from the first nearest-neighbour (NN) ones or second NN ones and so on, a two-dimensional distribution of the relative orientation between each pair of molecules and radial distribution function was used for the clustering, as shown in Fig. 2. In the distribution generation, the simulation box surrounded by 26 translated images was used, and a distance cutoff of 4 nm to account for the periodic boundary conditions was applied. A quantitative comparison between two distributions, pi and pj, is performed by calculating the Hellinger distance, Hij, as:
 | (1) |
 | (2) |
 | ||
| Fig. 2 Fingerprint generation for the experimental structure of sulflower. For each molecule, the center of mass was calculated, and the normal to the plane defined, by three atoms of the planar molecule. Distances between centers of mass and angles between normal planes were then used to generate the fingerprint of the structure. For simplicity, a supercell of 72 molecules is shown here, but typical simulation boxes contain more than 200 molecules. | ||
Well tempered metadynamics (WTMD) simulations42 were performed on the cluster centres to sample possible slow transitions. This introduces a repulsive history-dependent bias potential that acts in a reduced variables space, called the collective variables (CV) space, and helps the system to escape from its initial free energy minima. In this context, the choice of the CVs is limited to those that do not favour any specific pathway while being enough computationally efficient to allow several WTMD simulations to be computed in reasonable time. Both PSC and sulflower display a very anisotropic resistance to stress. When the system is compressed in a direction parallel to the stacked columnar packings of molecules, the cell does not tend to fluctuate in size and shape. To efficiently enhances the anisotropic distortion of the crystal supercells, while maintaining the generality and computational efficiency conditions, we used the off-diagonal elements of the simulation box as CVs. The bias potential is updated every 1 ps with Gaussians characterized by an initial height of 2 kJ mol−1 and a width of 0.1 nm for each CV. Simulations are carried on until a work per molecule equal to 3.0 kJ mol−1 has been performed on the cell. Following the procedure in ref. 16, to identify phase transitions along the trajectories, we monitored the distance RMSD43 with respect to the initial structure. In addition, to automatically detect transitions between similar geometries not captured by the distance RMSD, we performed a cluster analysis every 0.5 kJ mol−1 of work. Finally, structures were ranked according to their persistence, quantified as proportional to the work required to induce a transition away from the initial structure.
3 Results
3.1 Crystal structure prediction
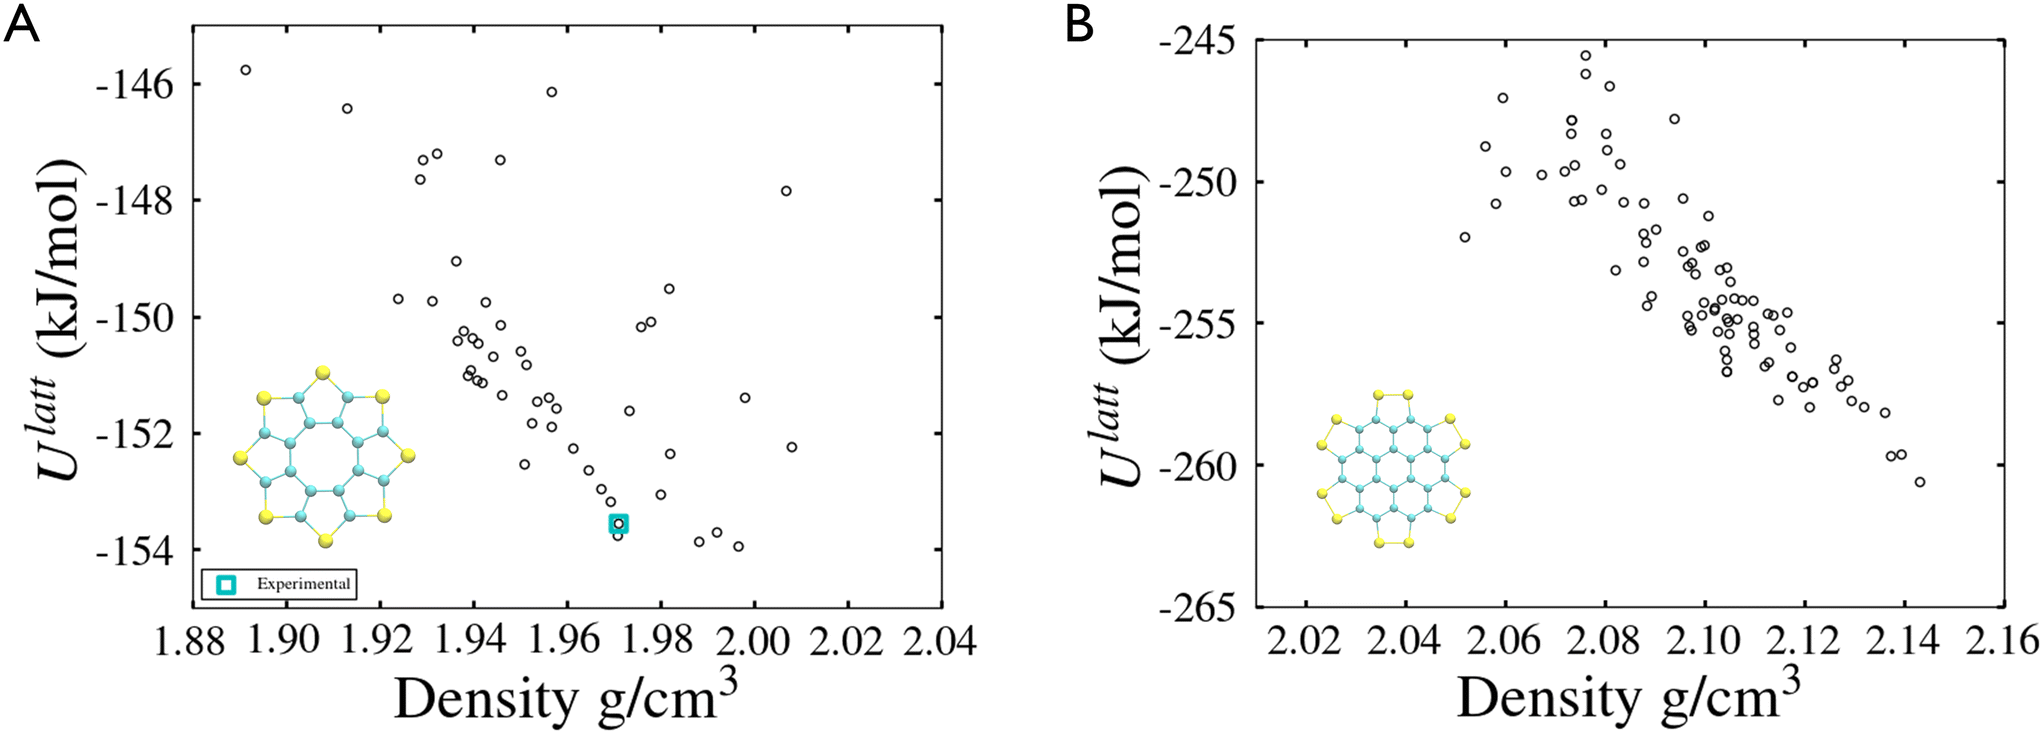 | ||
| Fig. 3 Lattice energy landscapes of sulflower (A) and persulfurated coronene (B). | ||
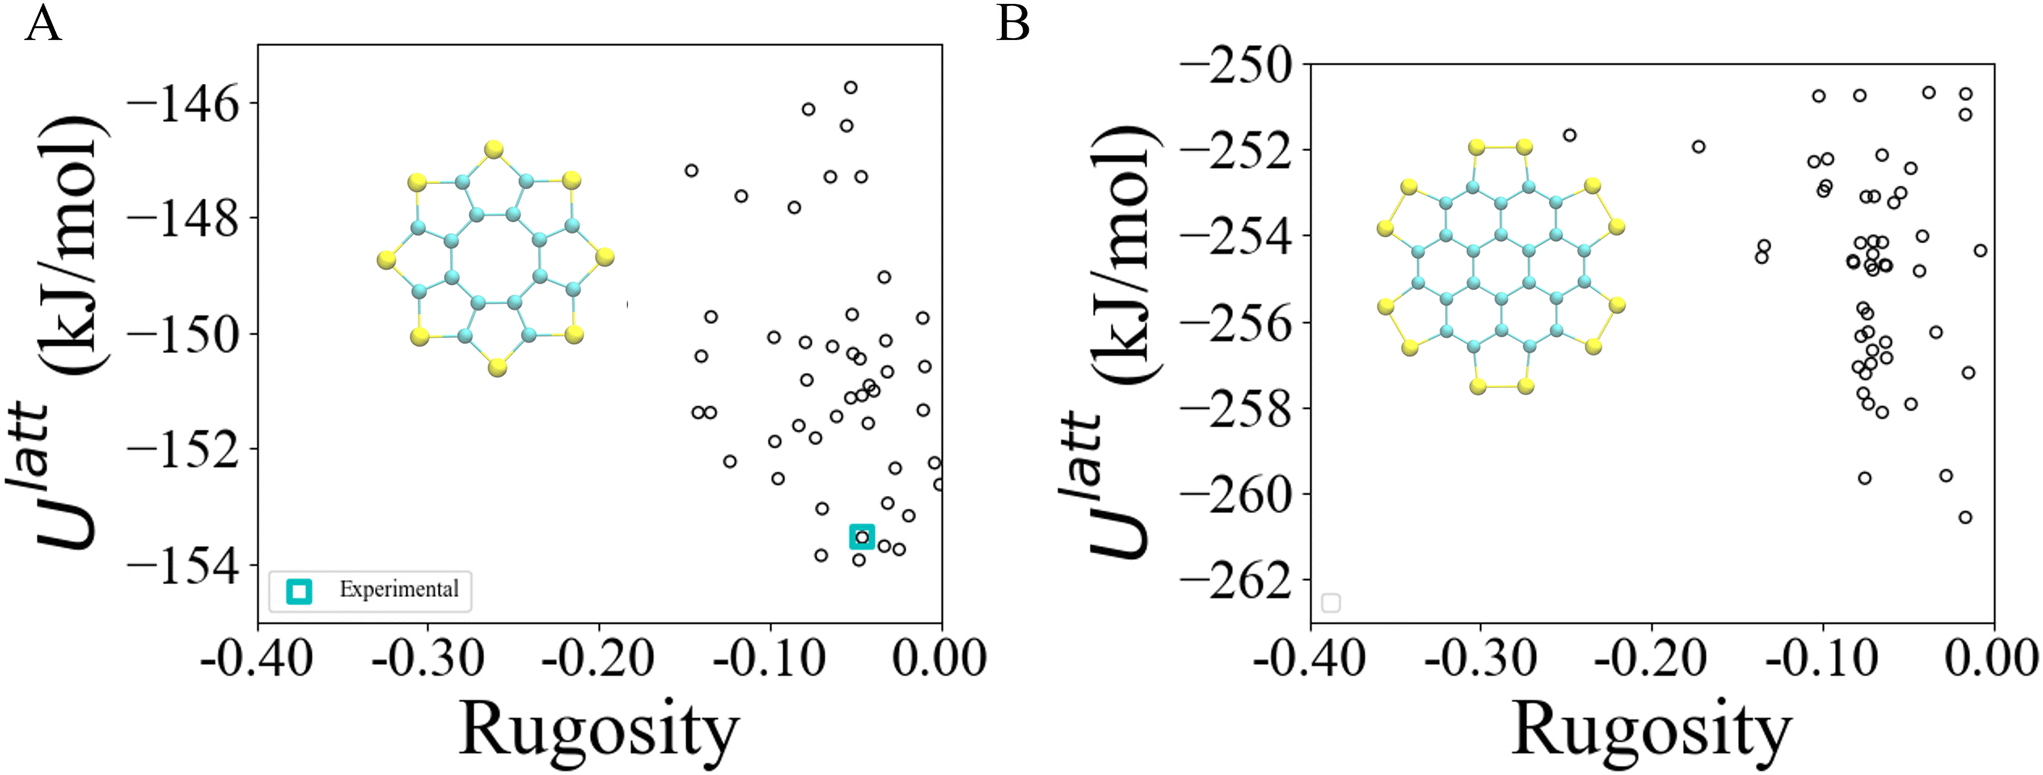 | ||
| Fig. 4 Lattice energy landscapes of sulflower (A) and persulfurated coronene (B), against rugosity. | ||
3.2 Finite-temperature reduction
The method described in section 3.2 is applied to the 20 lowest energy structures for both molecules. In both systems, GAFF tends to overestimate the lattice energy differences between states, affecting the structure ranking. Form I goes from being the 5th most stable crystal structure in the CSP_0 lattice energy landscape to the 8th using GAFF. On the other hand, the persulfurated coronene global minimum in the CSP_0 landscape remains the most stable structure also using GAFF. In plot 7, in the ESI,† we expand the GAFF energy minimisation to the two entire CSP sets, showing on average a good agreement between the two energy models. The only exception arises in the sulflower set, where structures with edge–face interactions7 exhibit particularly low energies using GAFF when compared to the energies from DMACRYS.When equilibrating the sulflower and PSC systems at 300 K and 1 bar, some structures develop orientational disorder or stacking defects. In these cases we noted that while the columns of parallel stacked molecules are preserved, their relative orientation and position can vary significantly, adopting disordered configurations. The presence of defects in the packing of columnar arrangements of monomers, is reflected in the probabilistic fingerprints, which display a variability along the angle θ axis. Orientational disorder is particularly evident in structures S13 and S15 (shown in Fig. 5 in comparison with the crystalline form I of sulflower) where no dominant orientation is present. In the ESI,† we show the fingerprints for all the structures in the two sets, in Fig. S1.† Structures with disorder were removed from further analysis, while the fingerprints of the remaining ones were used for the clustering analysis. This resulted in 13 unique crystal configurations for sulflower and 11 for the persulfurated coronene. Only the cluster centres are considered for the metadynamics step. At regular intervals of applied work, we performed a clustering analysis to identify possible transitions. Upon sampling enhanced structural fluctuations with metadynamics all PSC crystal cells resulted in disordered structures, with the global minimum emerging as the most persistent. This observation indeed suggests that the low persistence of local minima in the lattice energy landscape is responsible for the low crystallisability of PSC observed experimentally at normal temperatures and pressures. On the other hand, sulflower, which can be routinely crystallised, displays a radically different behaviour. For sulflower, in fact, upon analysing the trajectories obtained from metadynamics, we noted that 7 of the 20 structures are persistent throughout the analysis, and do not melt. In Fig. 6A, these occupy lower energies areas (in blue) with respect to the disordered states (in red). On the other hand, PSC crystalline and disordered states overlap in energy and density, as shown in Fig. 6B. Among the seven surviving structures of sulflower, we can find the experimentally known form I, which is nevertheless slightly distorted as a consequence of the compression of the simulation box along the cell vector b.
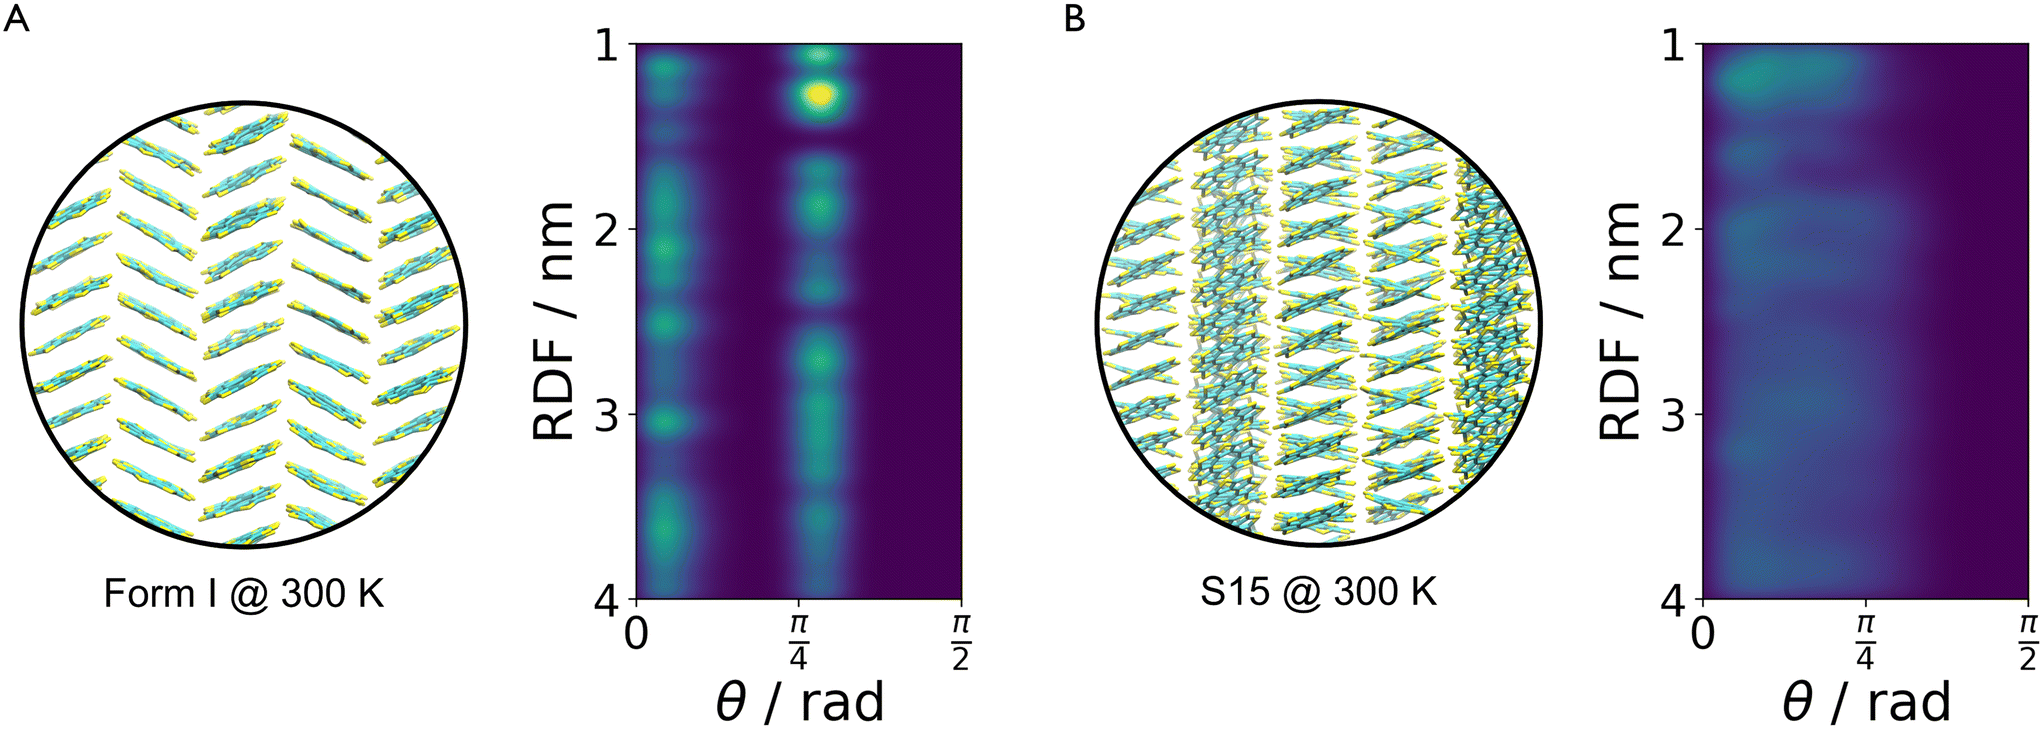 | ||
| Fig. 5 Comparison between the crystalline form I (A) and structure S15 (B) which develops orientational disorder. The fingerprints highlight these two states by showing well-defined peaks around 0° and 45° in the first case and an almost uniform distribution in the second one. | ||
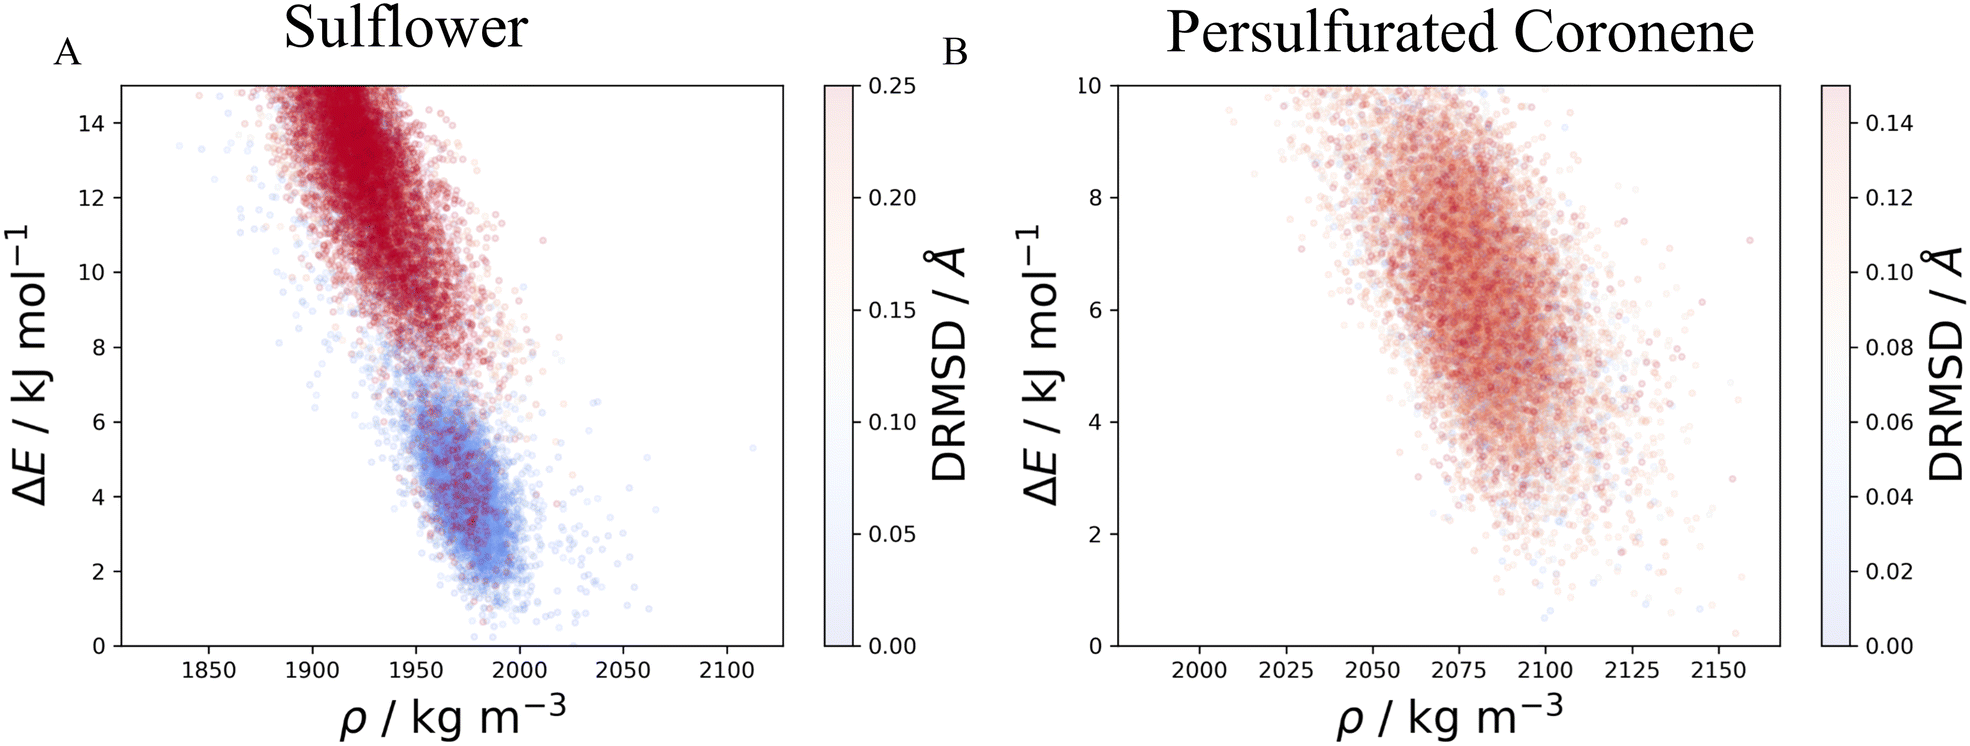 | ||
| Fig. 6 Potential energies and densities sampled in all the WTMD trajectories of sulflower (A) and PSC (B) sets. Each point corresponds to a single frame of the trajectory and is coloured based on the distance RMSD. A blue dot represents a state which maintains its initial geometry, while a red one indicates that a transition has occurred, usually to a disordered structure. These are located at higher energies with respect to ordered structures in the case of sulflower while no clear distinction between ordered and disordered states is present for PSC. | ||
The CV choice was crucial in trying to destabilise the different structures. An initial attempt was pursued using density and potential energy as CVs, in line with the previous studies in ref. 15 and 16. However, enhancing density fluctuations mainly induces the exploration of states that are isotropically compressed or expanded with respect to the starting crystal cell, making it a sub-optimal setup for both PSC and sulflower as they display an anisotropic resistance to stress. The off-diagonal elements of the simulation box were found to be a particularly effective set of CVs for such systems. In Tables 2 and 3, we summarise the results obtained for sulflower and PSC, respectively.
Most of the sulflower and all of the PSC structures are dominated by π–π (or face–face) interactions. Three sulflower structures (S2, S14 and S16), exhibit S–π (or edge–face) interactions which have a θ angle around 90°. This local dimer configuration appears to be particularly stable according to simulations with the GAFF forcefield, as the two lowest energy crystal structures feature this packing. The random relative orientation that all structures of PSC assume during WTmetaD implies that intercolumnar interactions are relatively weak, and indicates that PSC is indeed prone to convert to amorphous states by losing the ordered packing of columnar arrangement typical of large conjugated molecules. These observations agree with the study in ref. 7, in which DFT calculations at the B3LYP/6-31G(d,p) level have been performed on both PSC and sulflower dimers. This shows that while the edge–face and face–face configurations in the sulflower molecule are almost energetically equivalent, π–π interactions in the PSC are 5 times stronger than the S–π ones.
| Stage | Sulflower CPU cost (CPUHr) | PSC CPU cost (CPUHr) |
|---|---|---|
| Gas phase minimisation | 300 | 65 |
| Global search | 720 | 2100 |
| Analysis and clustering | 80 | 80 |
| Multipole refinement | 4 | 8 |
| GAFF energy minimisation | 12 | 8 |
| Equilibration | 615 | 630 |
| Metadynamics | 1200 | 280 |
| Total | 2931 | 3171 |
| IDs | CSP_0 kJ mol−1 | EM kJ mol−1 | NVT kJ mol−1 | NPT kJ mol−1 | W kJ mol−1 | Resulting state |
|---|---|---|---|---|---|---|
| Form I | 0.76 | 7.09 | 7.01 | 10.22 | >kBT | Stable |
| S2 | 0.08 | 5.43 | 5.65 | 0.00 | >kBT | Stable |
| S9 | 1.60 | 0.59 | 0.29 | 5.18 | >kBT | Stable |
| S14 | 2.36 | 9.85 | 9.38 | 0.57 | >kBT | Stable |
| S16 | 2.56 | 2.35 | 2.42 | 1.01 | >kBT | Stable |
| S18 | 2.77 | 12.18 | 11.72 | 6.60 | >kBT | Stable |
| S19 | 2.80 | 9.93 | 9.39 | 9.16 | >kBT | Stable |
| S1 | 0.00 | 5.67 | 5.70 | 10.95 | 1.88 | Disordered |
| S8 | 1.40 | 8.72 | 8.61 | 12.51 | 1.50 | Disordered |
| S12 | 2.14 | 8.29 | 8.09 | 13.10 | 0.79 | Disordered |
| S10 | 1.68 | 7.41 | 7.25 | 9.94 | 0.74 | Form I |
| S17 | 2.72 | 10.51 | 10.43 | 10.33 | 0.46 | S14 |
| S20 | 2.85 | 10.01 | 9.72 | 4.85 | 0.00 | S14 |
| S11 | 1.70 | 0.00 | 0.00 | 0.61 | — | S14 |
| S4 | 0.40 | 4.94 | 4.82 | 6.60 | — | S18 |
| S7 | 1.30 | 9.00 | 8.86 | 6.64 | — | S18 |
| S3 | 0.18 | 8.55 | 8.50 | 9.04 | — | S19 |
| S6 | 0.90 | 5.59 | 5.69 | 9.05 | — | S19 |
| S13 | 2.30 | 10.14 | 9.34 | — | — | Disordered |
| S15 | 2.48 | 8.56 | 8.47 | — | — | Disordered |
| IDs | CSP_0 kJ mol−1 | EM kJ mol−1 | NVT kJ mol−1 | NPT kJ mol−1 | W kJ mol−1 | Resulting state |
|---|---|---|---|---|---|---|
| P1 | 0.00 | 0.00 | 0.00 | 0.00 | 1.18 | Disordered |
| P19 | 4.74 | 3.93 | 2.16 | 1.65 | 0.85 | Disordered |
| P4 | 2.44 | 0.92 | 1.44 | 0.98 | 0.79 | Disordered |
| P14 | 3.89 | 6.92 | 1.12 | 0.85 | 0.78 | Disordered |
| P12 | 3.58 | 2.18 | 2.83 | 2.26 | 0.69 | Disordered |
| P2 | 0.91 | 1.43 | 1.64 | 1.34 | 0.65 | Disordered |
| P15 | 4.07 | 5.50 | 2.14 | 1.72 | 0.52 | Disordered |
| P6 | 2.64 | 1.75 | 1.85 | 1.55 | 0.51 | Disordered |
| P10 | 3.36 | 2.28 | 1.44 | 1.02 | 0.49 | Disordered |
| P7 | 2.85 | 2.41 | 2.86 | 2.35 | 0.45 | Disordered |
| P18 | 4.31 | 2.46 | 2.96 | 2.55 | 0.42 | Disordered |
| P17 | 4.31 | 4.98 | 4.40 | 0.23 | — | P1 |
| P9 | 3.34 | 4.36 | 1.75 | 1.49 | — | P2 |
| P11 | 3.50 | 2.56 | 1.80 | 1.86 | — | P2 |
| P16 | 4.21 | 4.82 | 1.77 | 1.43 | — | P14 |
| P3 | 0.97 | 1.42 | 1.74 | 1.19 | — | P14 |
| P8 | 2.89 | 5.02 | 1.97 | — | — | Disordered |
| P13 | 3.71 | 3.55 | 4.01 | — | — | Disordered |
| P20 | 4.87 | 5.82 | 4.43 | — | — | Disordered |
| P5 | 2.64 | 4.20 | 2.28 | — | — | Disordered |
4 Conclusions
Two sulfur decorated carbon ring systems were investigated using CSP with metadynamics extensions: the sulflower and persulfurated coronene systems. Sulflower was known to crystallise, whilst extensive experimental effort had resulted only in amorphous forms of the persulfurated coronene. Molecular dynamics and metadynamics allows the investigation of thermal effects on the CSP sets and in this investigation they were used to remove 13 of the 20 lowest energy sulflower structures identified by CSP as “significantly disordered” under a small amount (kBT at ambient conditions) of work, whilst the experimental form and 6 others are stable enough to be considered potential crystal forms of this molecule. However, all of the 20 lowest energy persulfurated coronene structures converted to disordered systems under small amounts of work, indicating that the crystallisation of any form of this molecule would be impossible. Our study demonstrates that the combination of CSP and metadynamics could be used to eliminate never-observed polymorphs from CSP landscapes and, importantly, to predict whether a molecule is likely to be crystallisable at all. This approach could for instance complement recent studies that have computationally screened functionalised helicenes as potential organic semiconductors using CSP methods on candidates46 with great success; it is proposed that future sulfur heterocycle fine chemical candidates are screened for viable crystal structures using the techniques demonstrated in this article.5 Data access statement
Data supporting this study are openly available from https://Zenodo.org at DOI https://doi.org/10.5281/zenodo.6656726. The PLUMED input files are also accessible via PLUMED-NEST (https://www.plumed-nest.org), the public repository for the PLUMED consortium,47 using the project ID: plumID:22.034.Conflicts of interest
There are no conflicts to declare.Acknowledgements
The CSP investigations made use of the Imperial College Research Computing Service, DOI: https://doi.org/10.14469/hpc/2232. MD and WTMD simulations were performed on the UK Materials and Molecular Modelling Hub for computational resources, which is partially funded by EPSRC (EP/P020194/1 and EP/T022213/1). IJS, and CSA would like to acknowledge financial support from the UK Engineering and Physical Sciences Research Council (EPSRC) (EP/T005556/1) and the support of Eli Lilly and Company. NFF acknowledges Eli Lilly Digital Design for support through a PhD scholarship. We would like to acknowledge the contributions of Simon Hall of Bristol University, for useful discussions about the experimental approaches and for inspiring the original experiments.Notes and references
- R. Pfattner, S. T. Bromley, C. Rovira and M. Mas-Torrent, Adv. Funct. Mater., 2016, 26, 2256–2275 CrossRef CAS.
- T. Zhu, L. Jiang, Y. Li, Z. Xie, Z. Li, L. Lv, H. Chen, Z. Zhao, L. Jiang, B. Tang and H. Huang, Angew. Chem., Int. Ed., 2019, 58, 5044–5048 CrossRef CAS PubMed.
- A. J. Petty, Q. Ai, J. C. Sorli, H. F. Haneef, G. E. Purdum, A. Boehm, D. B. Granger, K. Gu, C. P. L. Rubinger, S. R. Parkin, K. R. Graham, O. D. Jurchescu, Y. L. Loo, C. Risko and J. E. Anthony, Chem. Sci., 2019, 10, 10543–10549 RSC.
- H. Bässler and A. Köhler, in Charge transport in organic semiconductors, ed. R. M. Metzger, Springer Berlin Heidelberg, Berlin, Heidelberg, 2012, vol. 312, pp. 1–65 Search PubMed.
- K. Y. Chernichenko, V. V. Sumerin, R. V. Shpanchenko, E. S. Balenkova and V. G. Nenajdenko, Am. Ethnol., 2006, 118, 7527–7530 Search PubMed.
- R. Dong, M. Pfeffermann, D. Skidin, F. Wang, Y. Fu, A. Narita, M. Tommasini, F. Moresco, G. Cuniberti, R. Berger, K. Müllen and X. Feng, J. Am. Chem. Soc., 2017, 139, 2168–2171 CrossRef CAS PubMed.
- T. T. Jensen, C. L. Hall, J. Potticary, I. Andrusenko, M. Gemmi and S. R. Hall, Chem. Commun., 2019, 55, 14586–14589 RSC.
- D. H. Bowskill, I. J. Sugden, S. Konstantinopoulos, C. S. Adjiman and C. C. Pantelides, Annu. Rev. Chem. Biomol. Eng., 2021, 12, 593–623 CrossRef CAS PubMed.
- A. M. Reilly and A. Tkatchenko, Chem. Sci., 2015, 6, 3289–3301 RSC.
- D. E. Braun, J. A. McMahon, R. M. Bhardwaj, J. Nyman, M. A. Neumann, J. Van De Streek and S. M. Reutzel-Edens, Cryst. Growth Des., 2019, 19, 2947–2962 CrossRef CAS.
- S. L. Price, Acta Crystallogr., Sect. B: Struct. Sci., Cryst. Eng. Mater., 2013, 69, 313–328 CrossRef CAS PubMed.
- S. L. Price, Faraday Discuss., 2018, 211, 9–30 RSC.
- C. S. Adjiman, J. G. Brandenburg, D. E. Braun, J. Cole, C. Collins, A. I. Cooper, A. J. Cruz-Cabeza, G. M. Day, M. Dudek, A. Hare, L. Iuzzolino, D. McKay, J. B. Mitchell, S. Mohamed, S. Neelamraju, M. Neumann, S. Nilsson Lill, J. Nyman, A. R. Oganov, S. L. Price, A. Pulido, S. Reutzel-Edens, I. Rietveld, M. T. Ruggiero, J. C. Schön, S. Tsuzuki, J. van den Ende, G. Woollam and Q. Zhu, Faraday Discuss., 2018, 211, 493–539 RSC.
- E. C. Dybeck, D. P. McMahon, G. M. Day and M. R. Shirts, Cryst. Growth Des., 2019, 19, 5568–5580 CrossRef CAS.
- N. F. Francia, L. S. Price, J. Nyman, S. L. Price and M. Salvalaglio, Cryst. Growth Des., 2020, 20, 6847–6862 CrossRef CAS.
- N. F. Francia, L. S. Price and M. Salvalaglio, CrystEngComm, 2021, 23, 5575–5584 RSC.
- D. H. Case, V. K. Srirambhatla, R. Guo, R. E. Watson, L. S. Price, H. Polyzois, J. K. Cockcroft, A. J. Florence, D. A. Tocher and S. L. Price, Cryst. Growth Des., 2018, 18, 5322–5331 CrossRef CAS.
- M. A. Neumann and J. Van de Streek, Faraday Discuss., 2018, 211, 441–458 RSC.
- A. Pulido, L. Chen, T. Kaczorowski, D. Holden, M. A. Little, S. Y. Chong, B. J. Slater, D. P. McMahon, B. Bonillo, C. J. Stackhouse, A. Stephenson, C. M. Kane, R. Clowes, T. Hasell, A. I. Cooper and G. M. Day, Nature, 2017, 543, 657–664 CrossRef CAS PubMed.
- S. Atahan-Evrenk and A. Aspuru-Guzik, Prediction and calculation of crystal structures: Methods and applications, Springer, 2014, vol. 345, p. 294 Search PubMed.
- M. J. Frisch, G. W. Trucks and H. B. Schlegel, Gaussian 16, Revision C.01, Gaussian, 2016 Search PubMed.
- M. Habgood, I. J. Sugden, A. V. Kazantsev, C. S. Adjiman and C. C. Pantelides, J. Chem. Theory Comput., 2015, 11, 1957–1969 CrossRef CAS PubMed.
- D. E. Williams and S. R. Cox, Acta Crystallogr., Sect. B: Struct. Sci., 1984, 40, 404–417 CrossRef.
- W. D. Motherwell, H. L. Ammon, J. D. Dunitz, A. Dzyabchenko, P. Erk, A. Gavezzotti, D. W. Hofmann, F. J. Leusen, J. P. Lommerse, W. T. Mooij, S. L. Price, H. Scheraga, B. Schweizer, M. U. Schmidt, B. P. Van Eijck, P. Verwer and D. E. Williams, Acta Crystallogr., Sect. B: Struct. Sci., 2002, 58, 647–661 CrossRef PubMed.
- C. R. Groom, I. J. Bruno, M. P. Lightfoot and S. C. Ward, Acta Crystallogr., Sect. B: Struct. Sci., Cryst. Eng. Mater., 2016, 72, 171–179 CrossRef CAS PubMed.
- J. A. Chisholm and S. Motherwell, J. Appl. Crystallogr., 2005, 38, 228–231 CrossRef.
- S. L. Price, M. Leslie, G. W. Welch, M. Habgood, L. S. Price, P. G. Karamertzanis and G. M. Day, Phys. Chem. Chem. Phys., 2010, 12, 8478–8490 RSC.
- J. Nyman and G. M. Day, CrystEngComm, 2015, 17, 5154–5165 RSC.
- J. Wang, R. M. Wolf, J. W. Caldwell, P. A. Kollman and D. A. Case, J. Comput. Chem., 2004, 25, 1157–1174 CrossRef CAS PubMed.
- D. H. Case, J. E. Campbell, P. J. Bygrave and G. M. Day, J. Chem. Theory Comput., 2016, 12, 910–924 CrossRef CAS PubMed.
- A. Jakalian, B. L. Bush, D. B. Jack and C. I. Bayly, J. Comput. Chem., 2000, 21, 132–146 CrossRef CAS.
- E. Lindahl, M. Abraham, B. Hess and D. van der Spoel, GROMACS 2021 Manual, 2021, https://zenodo.org/record/4457626 Search PubMed.
- M. J. Abraham, T. Murtola, R. Schulz, S. Páll, J. C. Smith, B. Hess and E. Lindahl, SoftwareX, 2015, 1–2, 19–25 CrossRef.
- L. P. Cordella, P. Foggia, C. Sansone and M. Vento, IEEE Trans. Pattern Anal. Mach. Intell., 2004, 26, 1367–1372 CrossRef PubMed.
- A. A. Hagberg, D. A. Schult and P. J. Swart, 7th Python Sci. Conf. (SciPy 2008), 2008, pp. 11–15 Search PubMed.
- U. Essmann, L. Perera, M. L. Berkowitz, T. Darden, H. Lee and L. G. Pedersen, J. Chem. Phys., 1995, 103, 8577–8593 CrossRef CAS.
- M. R. Shirts, C. Klein, J. M. Swails, J. Yin, M. K. Gilson, D. L. Mobley, D. A. Case and E. D. Zhong, J. Comput.-Aided Mol. Des., 2017, 31, 147–161 CrossRef CAS.
- G. Bussi, D. Donadio and M. Parrinello, J. Chem. Phys., 2007, 126, 14101 CrossRef PubMed.
- H. J. Berendsen, J. P. Postma, W. F. Van Gunsteren, A. Dinola and J. R. Haak, J. Chem. Phys., 1984, 81, 3684–3690 CrossRef CAS.
- M. Parrinello and A. Rahman, Phys. Rev. Lett., 1980, 45, 1196–1199 CrossRef CAS.
- A. Rodriguez and A. Laio, Science, 2014, 344, 1492–1496 CrossRef CAS PubMed.
- A. Barducci, G. Bussi and M. Parrinello, Phys. Rev. Lett., 2008, 100, 020603 CrossRef.
- G. A. Tribello, M. Bonomi, D. Branduardi, C. Camilloni and G. Bussi, Comput. Phys. Commun., 2014, 185, 604–613 CrossRef CAS.
- R. Montis, R. J. Davey, S. E. Wright, G. R. Woollam and A. J. Cruz-Cabeza, Angew. Chem., 2020, 59, 20357–20360 CrossRef CAS.
- P. Sacchi, S. M. Reutzel-Edens and A. J. Cruz-Cabeza, CrystEngComm, 2021, 23, 3636–3647 RSC.
- J. A. Schmidt, J. A. Weatherby, I. J. Sugden, A. Santana-Bonilla, F. Salerno, M. J. Fuchter, E. R. Johnson, J. Nelson and K. E. Jelfs, Cryst. Growth Des., 2021, 21, 5036–5049 CrossRef CAS.
- M. Bonomi, G. Bussi, C. Camilloni, G. A. Tribello, P. Banáš, A. Barducci, M. Bernetti, P. G. Bolhuis, S. Bottaro, D. Branduardi, R. Capelli, P. Carloni, M. Ceriotti, A. Cesari, H. Chen, W. Chen, F. Colizzi, S. De, M. De La Pierre, D. Donadio, V. Drobot, B. Ensing, A. L. Ferguson, M. Filizola, J. S. Fraser, H. Fu, P. Gasparotto, F. L. Gervasio, F. Giberti, A. Gil-Ley, T. Giorgino, G. T. Heller, G. M. Hocky, M. Iannuzzi, M. Invernizzi, K. E. Jelfs, A. Jussupow, E. Kirilin, A. Laio, V. Limongelli, K. Lindorff-Larsen, T. Löhr, F. Marinelli, L. Martin-Samos, M. Masetti, R. Meyer, A. Michaelides, C. Molteni, T. Morishita, M. Nava, C. Paissoni, E. Papaleo, M. Parrinello, J. Pfaendtner, P. Piaggi, G. M. Piccini, A. Pietropaolo, F. Pietrucci, S. Pipolo, D. Provasi, D. Quigley, P. Raiteri, S. Raniolo, J. Rydzewski, M. Salvalaglio, G. C. Sosso, V. Spiwok, J. Šponer, D. W. Swenson, P. Tiwary, O. Valsson, M. Vendruscolo, G. A. Voth and A. White, Nat. Methods, 2019, 16, 670–673 CrossRef PubMed.
Footnotes |
| † Electronic supplementary information (ESI) available. See DOI: https://doi.org/10.1039/d2ce00942k |
| ‡ Present address: The Cambridge Crystallographic Data Centre, Cambridge, UK. |
| This journal is © The Royal Society of Chemistry 2022 |