
 Open Access Article
 This Open Access Article is licensed under a
 Creative Commons Attribution 3.0 Unported Licence
Metal oxide foams for pharmaceutical amorphization†
Jan R.
Gröls
 ab,
Thais T.
Guaraldo
a,
Carmelo
Herdes
a,
Davide
Mattia
a and
Bernardo
Castro-Dominguez
*ab
ab,
Thais T.
Guaraldo
a,
Carmelo
Herdes
a,
Davide
Mattia
a and
Bernardo
Castro-Dominguez
*ab
aCentre for Advanced Separations Engineering (CASE), Department of Chemical Engineering, University of Bath, Claverton Down, Bath BA2 7AY, UK. E-mail: bcd28@bath.ac.uk
bCentre for Sustainable and Circular Technologies (CSCT), University of Bath, Claverton Down, Bath BA2 7AY, UK
First published on 11th April 2022
Abstract
The amorphization of pharmaceutical crystals is an effective strategy to enhance the bioavailability of poorly soluble active pharmaceutical ingredients (APIs). However, this process can be challenging as these supramolecular structures arrange mainly via hydrogen bonds and π–π interactions. In this work, we propose that porous metal oxides can be used to promote the amorphization of APIs. In particular, zinc oxide foams were synthesized, characterized, and used to induce the production of amorphous paracetamol, via solvent evaporation. Amorphous paracetamol was generated inside the pores of the foam, whereas its crystalline form type I appeared on the bulk of the crystallization media. The interaction of paracetamol with zinc oxide was analyzed through zeta potential measurements and molecular dynamics simulations. The results of this work suggest that the porous 3D structure of metal oxide foams prevents nucleation, hinders hydrogen bonding, and therefore generates amorphous structures. This work demonstrates for the first time (i) the co-amorphization of PCM/MCM mixtures, (ii) how confinement and surface energy induce disruptions in crystal structure, and (iii) the performance of metal oxides as stabilizers for amorphous structures. We propose that metal oxide additives during crystallization are a novel technique that will aid in developing amorphous structures with enhanced pharmacological efficiencies than those found in native crystalline APIs.
1. Introduction
Approximately 75% of active pharmaceutical ingredients (APIs) present solubility challenges due to their crystalline structure.1 The intermolecular interactions of these structures are based on, van der Waals, electrostatic, hydrogen bonding and π–π interactions, which in sum overcome the solvation energy. Crystal engineering has developed various strategies to disrupt these interactions, including the formation of co-crystals, salts, polymorphs, and amorphous structures.2,3 Although, most strategies focus on modifying the intermolecular interactions, amorphization minimizes these interactions.4 Amorphous materials have an irregular supramolecular structure with few intermolecular interactions, thus often displaying good solubility and dissolution rates.5 However, amorphous structures have an excess in entropy, enthalpy, and free energy; characteristics that challenge their formation and long-term stability.6,7Although the amorphization of small organic molecules can be challenging, there are few established techniques for specific API molecules, including melting and quench cooling, as well as cryogenic mechanochemical amorphization.8–12 In this work, we aim at diversifying contemporary amorphization techniques by leveraging the functionalities of metal oxide foams to promote amorphization.
Metal oxide foams have been primarily studied in catalysis due to their high porosity (75–95%) and large surface areas (up to 3000 m2 m−3).13–16 Foams have also been used as scaffolds in tissue engineering and for the fabrication of filters.17,18 Although, metal oxide foams have not been yet used in crystallization processes to the best of the authors' knowledge, there are some examples where the growth of metal oxide crystals was influenced by organic molecules. For instance, El-Nahas et al. reported that organic molecules (e.g., citrate and ethylenediamine) in the presence of zinc oxide (ZnO) show significant changes in their aspect ratio during crystallization.19 Moreover, the literature has reported studies where porous substates, such as mesoporous silica, have been used to produce supramolecular APIs by exploiting the effect of confinement. For instance, Dwyer et al. produced amorphous fenofibrate when confined in nanoporous silica;20 while Ha et al. produced polymorphic structures of anthranilic acid and 5-methyl-2-[(2-nitrophyenyl)amino]-3-thiophenecarbonitrile.21
In this work, we hypothesize that (i) the electrical double layer formed in solutions containing metal oxides coupled with (ii) the confinement of the crystallization solution inside the pores of porous foams can be used to induce supramolecular changes in crystallizing APIs. Here, we focused on studying binary systems as co-amorphous mixtures are considered relevant for industrial applications, due to their stabilization properties.22,23 As a proof-of-concept, a system was chosen that includes paracetamol (PCM) and metacetamol (MCM) dissolved in water and isopropanol. Previously, this API system displayed supramolecular changes when subject to crystallization under electrically charged nanodroplets produced via electrospraying.24 Moreover, the isomers PCM and MCM, are common APIs that require excellent water solubility to provide a rapid pharmaceutical response. Water and isopropanol were chosen as solvents, as they allow the PCM/MCM system to be affected by electrical charges as well as confinement.24,25 Finally, ZnO was deemed a suitable metal oxide as it is considered safe for ingestion by the US Food and Drug Administration (FDA) up to 2 g kg−1 of body weight.26 Moreover, the food industry often uses ZnO as a zinc supplement, as this element is an essential micronutrient that serves a key role in the growth, development, and overall well-being of humans and animals.27 We envision that ZnO foams can be integrated as part of the manufacturing, formulation, and final drug delivery strategies for solid oral dosages. In fact, the literature has attempted to use these materials as a framework for advanced drug delivery.28
It is important to note that although PCM has been treated under confinement previously, it has produced crystalline polymorphs rather than amorphous structures.24 For example, Rengarajan et al. crystallized PCM in >43 nm nanoporous glasses via melting crystallization, thus generating its metastable form II.29 Here, we aim at using confinement and surface energy of the metal oxide to induce structural changes. The PCM/MCM system has been studied using different crystallization techniques, revealing that more soluble polymorphs PCM can be induced in the presence of MCM.24,30 In this work, we show that ZnO enables, for the first time, the amorphization of PCM in the presence of MCM.
2. Experimental
2.1. Preparation of metal oxide foams
ZnO foams were synthesized using a combination of gelling, heating, and sintering steps.31 Briefly, precursor aqueous solution was prepared by combining polyvinyl alcohol (PVA) (5 wt%) and cetrimonium bromide (CTAB) (0.9 wt%) in 50 mL of water. ZnO particles (40 wt%) were added to the precursor solution while stirring for 5 h. To initiate gelation and crosslinking, nitric acid (16 vol%) and 2,5-dimethoxy-2,5-dihydrofuran (4.3 vol%) were added to the ZnO suspension. Using a homogenizer, air was introduced into the suspension for 4 min at 11![[thin space (1/6-em)]](https://www.rsc.org/images/entities/char_2009.gif) 000 rpm, generating foam. This foam was subject to solvent evaporation at 80 °C for 80 min and drying for 10 h at 50 °C. Finally, the structure was subject to sintering at 900 °C for 12 h, yielding sintered mechanically robust ZnO foams.
000 rpm, generating foam. This foam was subject to solvent evaporation at 80 °C for 80 min and drying for 10 h at 50 °C. Finally, the structure was subject to sintering at 900 °C for 12 h, yielding sintered mechanically robust ZnO foams.
2.2. Crystallization experiments
As shown in Fig. 1, a cylindrical ZnO foam (2 cm diameter, 1 cm height) was placed at the bottom of a 50 mL beaker. A crystallization precursor containing 88.57 mg of PCM and MCM (75/25 wt%) in a 40/60 vol% solution of isopropanol and water was slowly poured into the beaker until the foam was completely covered. The crystallization media containing the crystallization precursor and the ZnO foam was left at room temperature for solvent evaporation. After crystallization, two types of PCM/MCM crystals were collected and subject to further analysis and characterization: (i) crystals formed in the bulk of the liquid (Beaker solids) were carefully scraped from the beaker bottom and (ii) crystals formed inside the pores of the foam (foam solids) were extracted from inside the pores after breaking the foam. Note that crystallization experiments were repeated three times to ensure the reliability of the results. | ||
| Fig. 1 Schematic of the methodology and description of the two different crystals.32 | ||
2.3. Characterization techniques
The ZnO foams, crystallization precursors and PCM/MCM post-crystallization products were subject to the following materials characterization techniques:2.4. Simulation methods
Recently, we have described the electrical confinement for polymorphic control, of the PCM/MCM API system in the same isopropanol and water solution, via molecular dynamics (MD) simulations;24 where the APIs and solvent forcefield details and their validation are given. Here, a ZnO nanopore, of 15.20 nm, that allows the coexistence of the bulk and the adsorbed phases, was modeled implementing the forcefield of Whitmore et al.33 A detailed description of the construction of the ZnO slab and nanopore simulation cell is found in the accompanying ESI.†MD simulations under the canonical ensemble, NVT, where the total number of molecules (N), volume (V), and temperature (T) are kept constant, were implemented using GROMACS 2019.34 The temperature was initially maintained using the Berendsen thermostat; after equilibration, production runs were coupled to the Nose–Hoover thermostat. Periodic boundary conditions were applied to all simulation cells. A cutoff radius of 1.5 nm was defined for the potential energies within the Verlet cutoff scheme. Electrostatics was modeled using the particle-mesh Ewald method. Simulations mimicked an APIs concentrated bulk composition (see ESI† S2) in solution and experimental system conditions (e.g., room temperature). The reported average density profiles were taken after the equilibration period, in A) API + solvent, B) API + solvent + ZnO and C) API + ZnO, monitored by the total energy evolution of each system.
3. Results
3.1. ZnO foam structures
The ZnO foams were 95% porous and presented a hierarchical structure, containing pores of different sizes. Based on the results obtained by the Micro CT, the structures had macropores of approximately 330 μm. The BET calculations suggested that the average nanopore had a diameter of 4 nm and a surface area of 16.6 m2 g−1 (see ESI† Fig. S2 and S3). The difference is given by the different size ranges accessible by each technique. Using density function theory (DFT) it was estimated that the structure had a micropore volume of 0.017 cc g−1. The structure of the ZnO foams can be observed in Fig. 2. | ||
| Fig. 2 SEM of ZnO foams and foam solids at various magnifications: (A) 500 μm, (B) and (D) 20 μm, (C) 10 μm, & (E) and (F) 5 μm. | ||
3.2. PCM/MCM crystallization products
The supramolecular structures of the ZnO foam, PCM and MCM were studied via PXRD. Fig. 3 shows the PXRD spectra for each of the polymorphic structures of PCM, MCM, and all the materials analyzed (i.e., ZnO foam, beaker solids and foam solids). Focusing on the crystallization products, it is possible to notice that these results suggest that beaker solids contain concomitant PCM crystals (both polymorphs type I (blue) and II (purple)) as well as MCM crystals (see Fig. 3). In other words, the selectivity towards a particular supramolecular crystal is non-existent. Moreover, the spectrum showed a peak at 37° (circle) corresponding to the presence of MCM hydrate. On the other hand, the spectrum corresponding to the foam solids (dark blue) shows peaks (stars) analogous to pure MCM crystals (green) only. This result suggests that the ZnO foam either: (i) excluded PCM from crystallizing inside its pores, or (ii) completely amorphized PCM. | ||
| Fig. 3 PXRD patterns of all crystals forms: PCM-I (blue) and PCM-II (purple), MCM hydrate (MCM, green), ZnO foam (foam, yellow), foam solids (dark blue) and beaker solids (red). | ||
Structural tests were included to assess the stability of all amorphous samples (see ESI† S3). These samples were characterized via PXRD after 200 days. The PXRD patterns revealed that when the product remained inside the foam, all samples maintained their amorphous structure. On the other hand, those samples preserved outside the ZnO foams displayed a crystalline PCM spectra. These results suggest that ZnO foams can be used, not only to induce amorphization, but also for stabilization during storage.
To assess the presence of each component in the products and determine whether exclusion or amorphization occurred, the products were characterized using H-NMR (see ESI† Fig. S4). Additionally, a control non-porous ZnO structure was synthesized (see ESI† S4) to differentiate the effect of the pores and the surface of ZnO. Table 1 shows the composition ratios of MCM to PCM obtained for the control and the foams. Note that for the foams, samples were taken by breaking the ZnO foam to collect the inner crystals – after the PXRD results, these types of solids are referred to as foam solids. Samples were also taken at the bulk of the crystallization media – referred as beaker solids. The results show that the beaker solids found for both the foams and the control have a 1:5 MCM to PCM composition and 1:10, respectively. The composition found inside the pores of the ZnO foams revealed a 1:4 ratio, suggesting that crystallization media interacted with the ZnO foams to yield amorphous PCM.
| Sample | MCM:PCM beaker solids | MCM:PCM foam solids |
|---|---|---|
| Bulk | Inner | |
| Foam | 1:5 (±2) |
1:4 (±1) |
| Control | 1:10 |
0 |
The amorphization of PCM was further confirmed by the DSC results. Fig. 4 displays the heat flow profiles of the foam (black) and the beaker (red) crystals at various temperatures. The profiles are certainly different with the foam solids exhibiting four distinctive points: point A represents the melting point of the amorphous PCM at 145 °C. Point B indicates that the sample crystallizes to yield the stable form PCM at 150 °C. Finally, point C represents the melting point of PCM-I around 165–169 °C – a feature shown in both foam and beaker solids.35–37
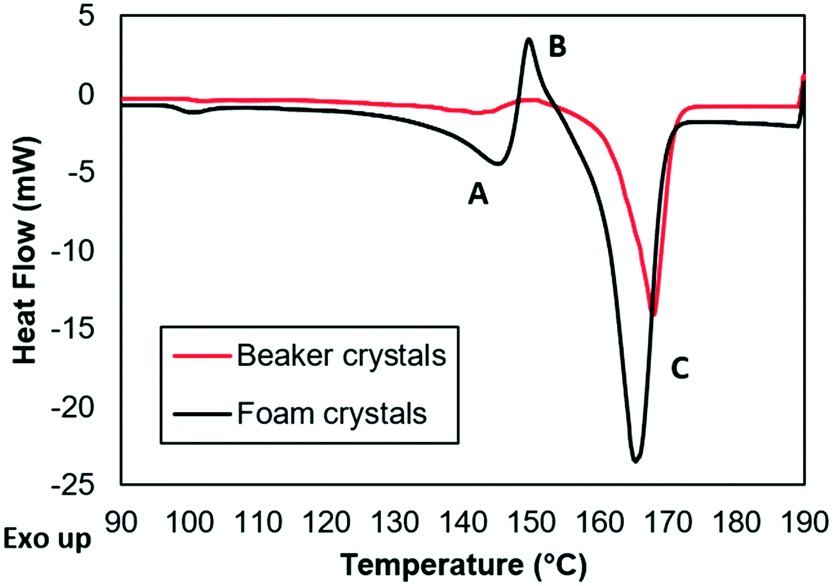 | ||
| Fig. 4 DSC of foam solids (black) and beaker solids (red). | ||
The use of metal oxides to enhance the solubility of pure APIs has been shown in previous studies. Grobelny et al. co-milled poorly water-soluble drugs and metal oxides to generate amorphous soluble structures. However, it is not clear if the amorphization was a result of the mechanochemical effect or due to the presence of the oxides.38 This method was also exploited by Shakhtshneider et al., which leveraged the use of mechanochemical processes and metal oxides to improve the properties of APIs (e.g., piroxicam, meloxicam, indomethacin, etc.). Their studies suggest that the interaction between APIs and the active surface sites of the metals provide the stability necessary to prevent their re-crystallization.39–42
To study the interaction of the crystallization solution and the ZnO foams, zeta potential measurements were performed for: (a) the crystallization solution at different PCM–MCM concentrations and (b) the ZnO foams in a water-isopropanol solution with and without PCM and MCM (see Fig. 5). The initial crystallization solution has a relatively neutral zeta potential (−1 mV) and becomes more negative as the concentration of the APIs increases. Before nucleation occurs, unstable nanoclusters of PCM and MCM and the streaming potential, induce changes in the zeta potential as the concentration of PCM/MCM increases. At a concentration of 127 mg mL−1, the solution reaches supersaturation and nucleation begins, allowing the zeta potential to increase rapidly. Increasing further the API concentration promotes crystal growth; nonetheless, the zeta potential appeared to have reached a plateau at this point. Habraken et al. described a similar trend (reduction, sudden increase and plateau) for calcium phosphate crystals caused by initial hydrodynamic shielding that prevented charge detection and reduced the growth of aggregates.43 The ZnO foams, ground to generate particles of 4.3 μm, were dispersed in a solution with and without PCM and MCM. The solution without PCM and MCM, but with ZnO displayed a zeta potential of −13.1 mV, whereas with the APIs the solution has a zeta potential of −5.4 mV. It is important to mention that the concentration of PCM and MCM in the solution was 88 mg mL−1, thus indicating that the presence of ZnO reduced the zeta potential of the PCM–MCM marginally, by −4 mV. Moreover, we found that the PCM/MCM solution had a pH of 5, suggesting that ZnO is slightly positively charged with Zn2+ ions.
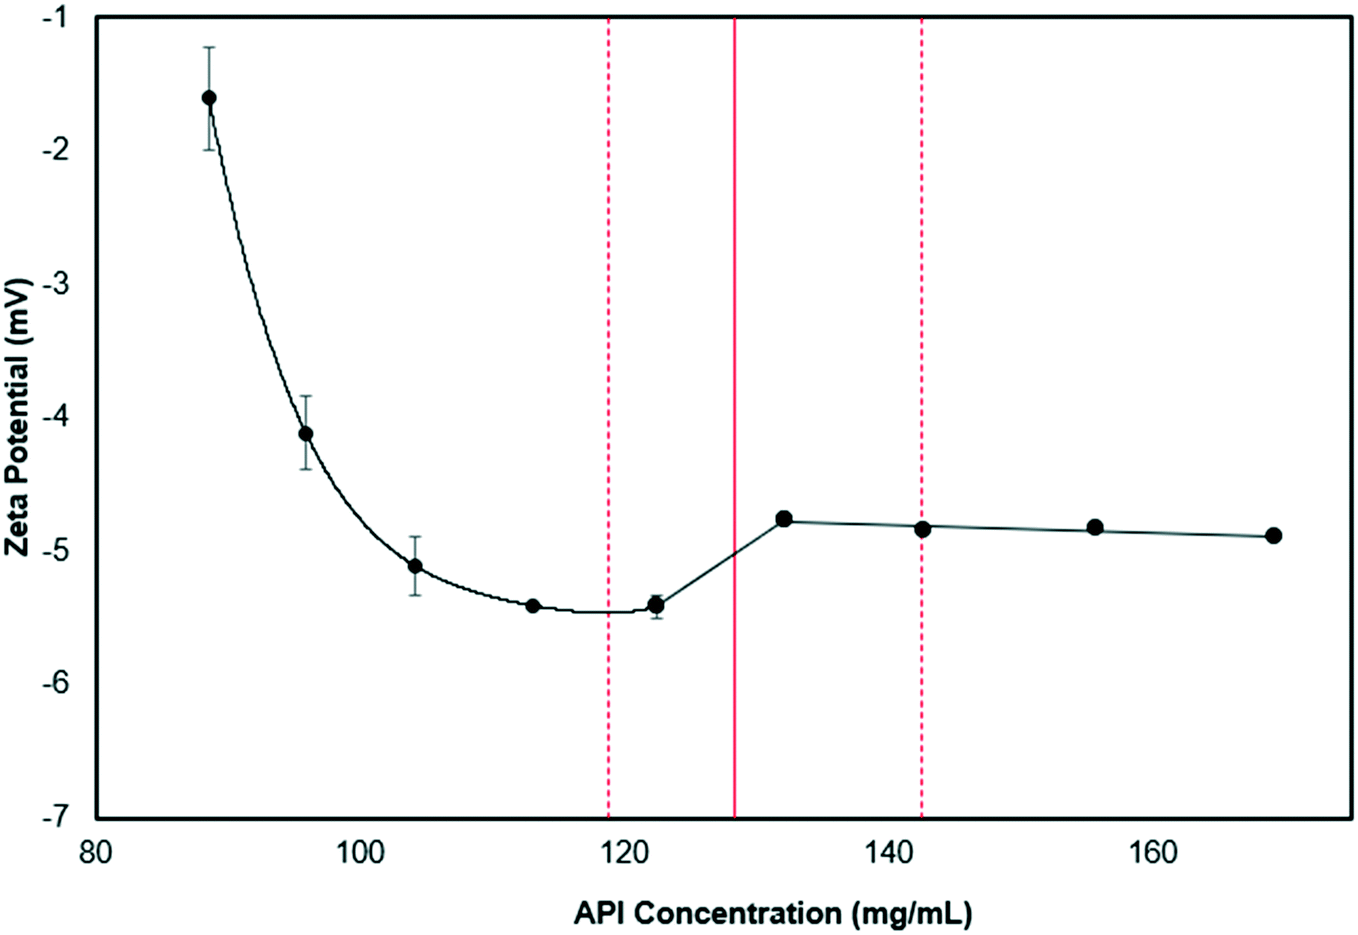 | ||
| Fig. 5 Zeta potential curve for the starting solution with increasing API concentration. | ||
4. Discussion
Initially, the crystallization solution contains four interacting components, PCM and MCM dissolved and dispersed in water and isopropanol. When ZnO is introduced into the system, the crystallization solution diffuses through pores. Both molecules, PCM and MCM, have the same molecular weight of 151.2 g mol−1, kinetic diameter and functional groups, we have previously found their self-diffusion in bulk to be identical.24,44 Therefore, their mass transport through the mesopores of ZnO can be assumed to not be selective towards either of the isomeric molecules.As time elapses, the solvent evaporates promoting the supersaturation of the solution, nucleation, and subsequent crystallization. During this process, PCM and MCM molecules interact with the surface of ZnO, creating an electrical double layer, as shown by the reduction of the zeta potential.45 Therefore, it was hypothesized that the electrical double layer inhibited the hydrogen bonding of PCM and promoted the amorphization observed in the experiments. This hypothesis was further validated via MD simulations (see ESI† S2), which compared the average partial densities profiles (spatial distribution of molecules along the z-axis of the simulation cell) of PCM and MCM in bulk (solvent solution, see Fig. 6A) and inside a ZnO nanopore with (see Fig. 6B), and without solvent (see Fig. 6C). The simulations showed that in bulk crystallization, a supersaturated solution of PCM and MCM tends to agglomerate into clusters of molecules – an effect referred to as the onset of nucleation. Fig. 6A shows that PCM and MCM have higher molecular densities at a random spatial location (i.e., 5 nm and 13 nm). When the same solution is confined into a ZnO nanopore of 15.20 nm (with a total simulation cell length of 18.40 nm of which 3.20 nm correspond to the ZnO solid, see ESI† S2), clustering is no longer present. In other words, the molecules of PCM and MCM become more evenly distributed (see Fig. 6B); this suggests that the presence of ZnO effectively inhibits nucleation. Moreover, the oxygen in the ZnO (see the left-hand side in Fig. 6B and C), appears to be slightly more energetic when in solution (see ESI† Tables S1 and S2). Indeed, Fig. 6B shows that PCM molecules (red) tend to interact more with the oxygen-rich ZnO surface (left side) than that of MCM. Upon removal of the solvents (water and isopropanol), PCM and MCM agglomerate to form a branch-like structure (see Fig. 6C). These simulations showed that the average partial densities profiles fluctuate more than in solution, suggesting that MCM and PCM agglomerate under these conditions. Interestingly, we found that after evaporation of the solvent, the interactions of the oxygen in ZnO with both APIs are identical. Based on these results, it is hypothesized that the stronger interaction of PCM with the oxygen atoms in ZnO, during supersaturation and subsequent nucleation, effectively inhibited the crystallization of PCM. In contrast, MCM crystallized immediately after nucleation due to its poor interaction with the ZnO surface. Although ZnO structures may present defect points, non-stoichiometry, and other features; this work demonstrates that the properties of ZnO foams – namely confinement and surface energy- are sufficient to produce, for the first time, amorphous PCM in MCM mixtures. Moreover, it is clear that the composition of the solvent utilized for crystallization plays a role in the APIs' adsorption onto ZnO, and therefore needs to be carefully selected. The use of metal oxides as additives to promote amorphization requires API and solvent considerations but offers access to crystals with low solubility profiles.
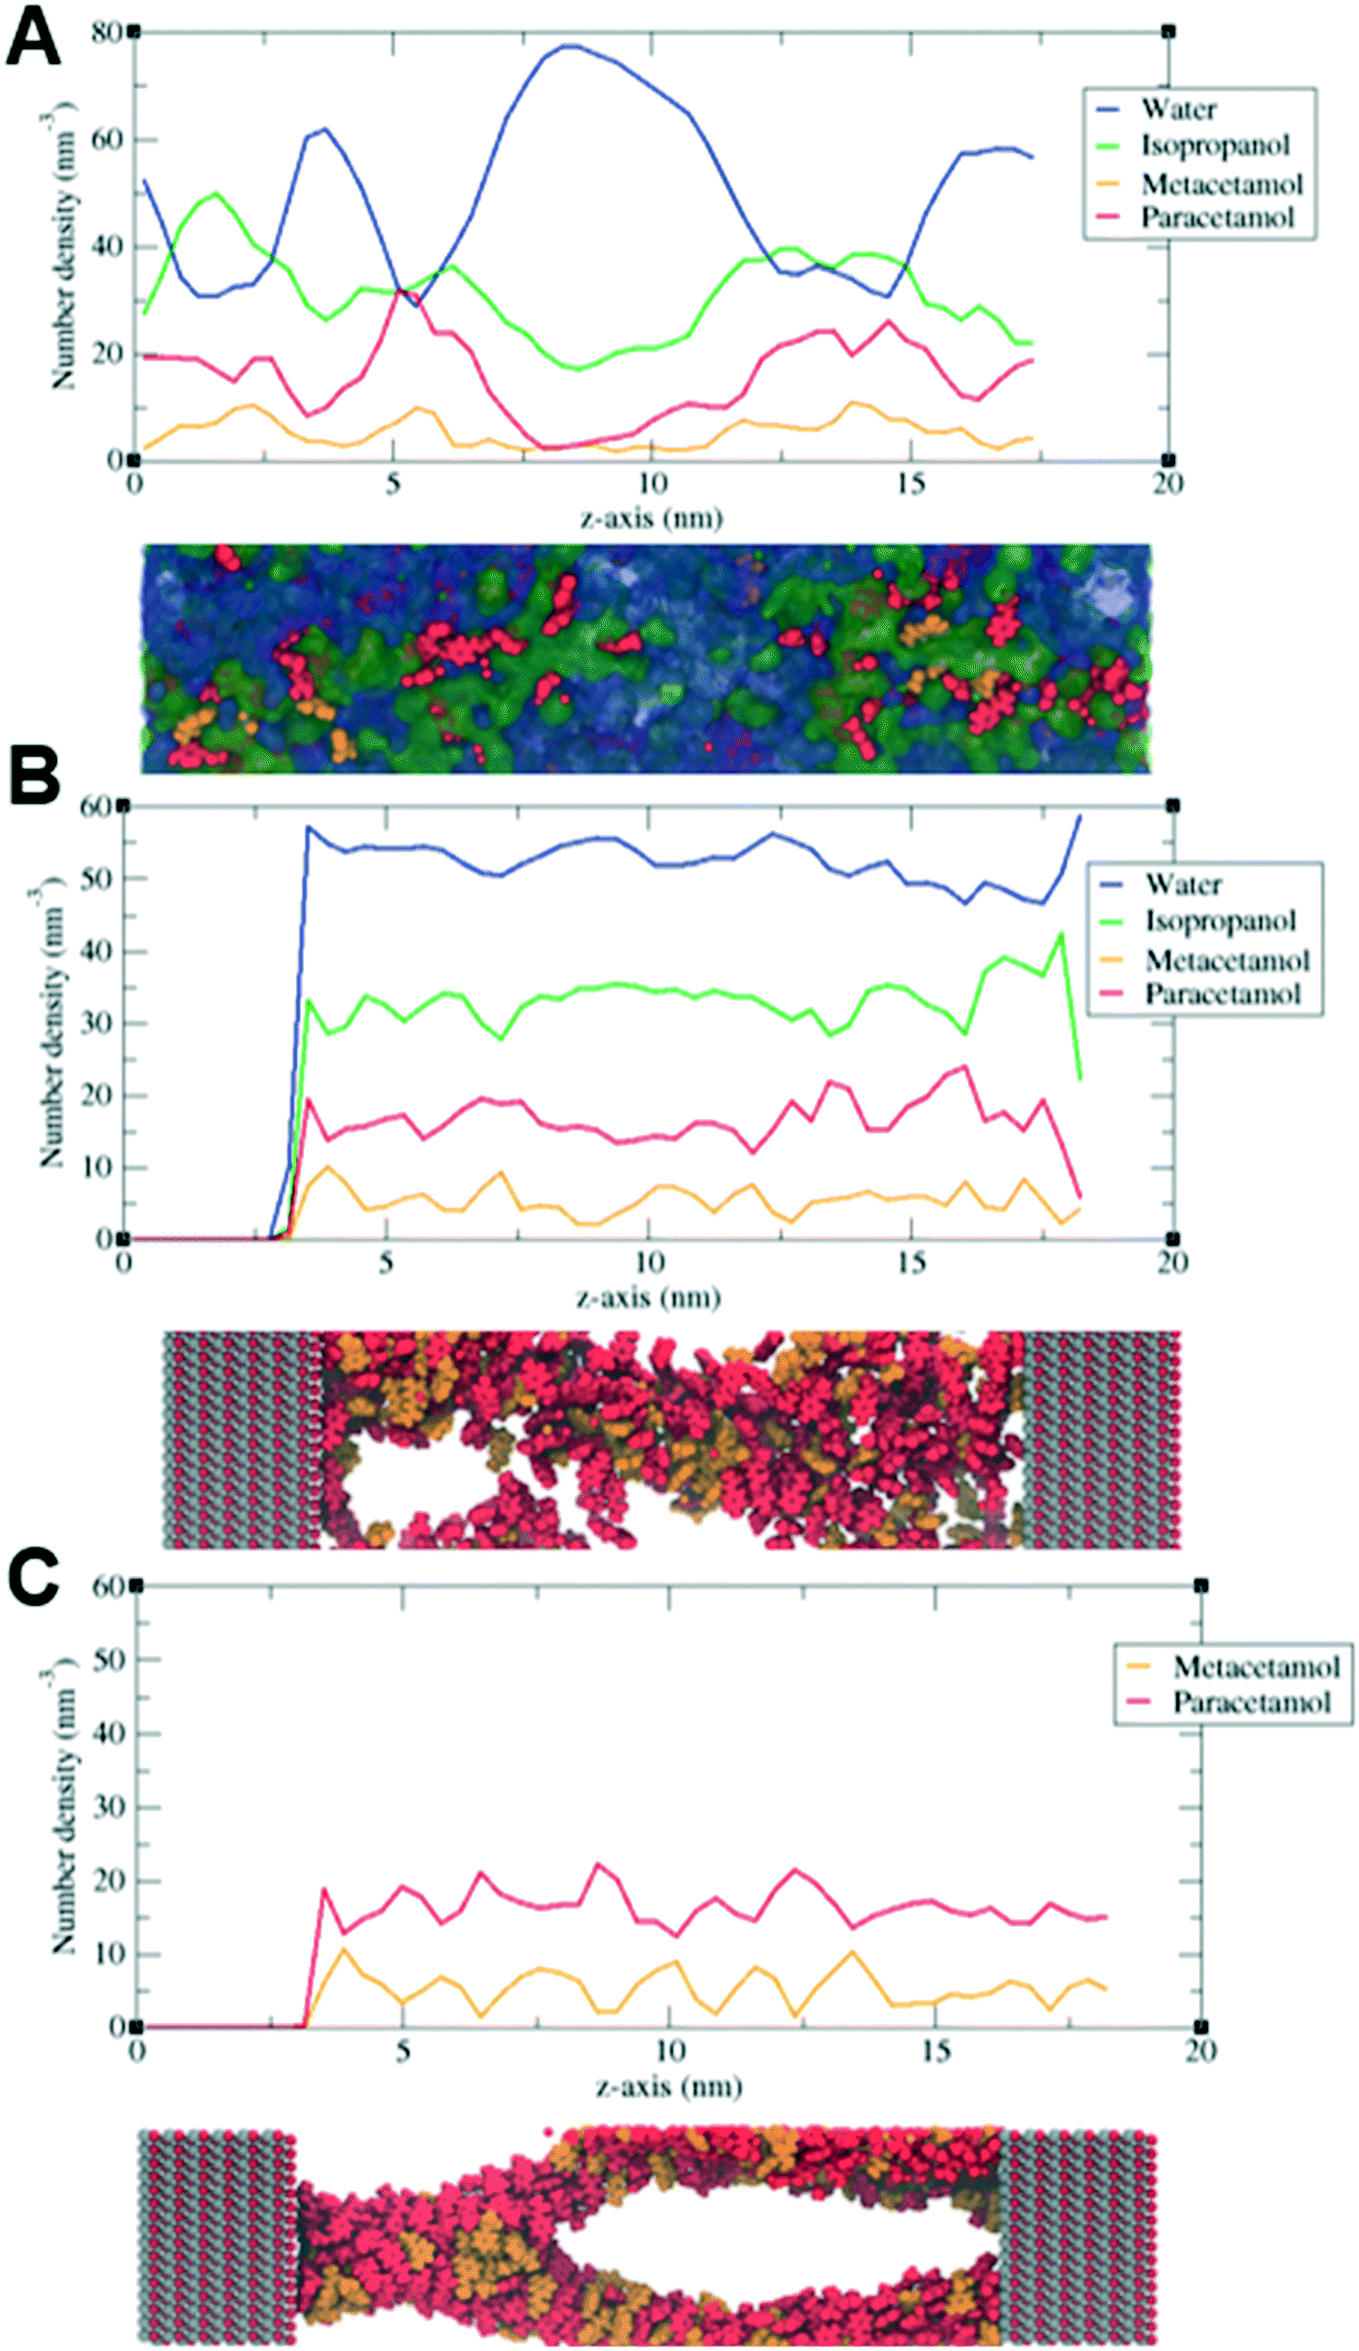 | ||
| Fig. 6 Partial densities distribution of species for A) API solution, B) API solution on ZnO pore, and C) APIs on ZnO surfaces (no solvent). | ||
5. Conclusions
In this work, we leveraged the physical properties of ZnO foams to induce supramolecular changes in the crystallization of PCM and MCM, and thus yield more soluble APIs. Through various experimental protocols and molecular simulations, we showed that while crystalline form type I PCM appeared without the presence of ZnO foams, amorphous PCM was generated inside the pores of the foam. The electrical double layer, formed at the surface of ZnO, provided the energy required to hinder nucleation and thus crystal growth. The tendency of PCM molecules to interact with the oxygen-rich ZnO surface prevented hydrogen bonding. In contrast, MCM showed a reduced interaction with ZnO and therefore remained in its crystal form. Due to all these features, metal oxides can be used as additives to produce amorphous solids in a simple, sustainable yet effective manner.Conflicts of interest
There are no conflicts to declare.Acknowledgements
This research was supported by Royal Society-Research Grant RSG\R1\180090. Jan Gröls (JG) would like to thank the University of Bath for his Ph.D. studentship and the Centre for Doctoral Training in Sustainable Chemical Technologies. The authors also acknowledge EPSRC for funding (Grant No. EP/P031382/1). The authors gratefully acknowledge the Material and Chemical Characterization Facility (MC2) at the University of Bath for technical support and assistance in this work. Moreover, we would like to acknowledge Dr. Daniel Fonseca for his contribution, sketching the graphical abstract of this work.References
- M. Rodriguez-Aller, D. Guillarme, J.-L. Veuthey and R. Gurny, J. Drug Delivery Sci. Technol., 2015, 30, 342–351 CrossRef CAS.
- Ö. Almarsson and M. J. Zaworotko, Chem. Commun., 2004, 1889–1896 RSC.
- P. Vishweshwar, J. A. McMahon, M. L. Peterson, M. B. Hickey, T. R. Shattock and M. J. Zaworotko, Chem. Commun., 2005, 4601–4603 RSC.
- O. Korhonen, K. Pajula and R. Laitinen, Expert Opin. Drug Delivery, 2017, 14, 551–569 CrossRef CAS PubMed.
- H. D. Williams, N. L. Trevaskis, S. A. Charman, R. M. Shanker, W. N. Charman, C. W. Pouton and C. J. H. Porter, Pharmacol. Rev., 2013, 65, 315–499 CrossRef PubMed.
- J. Mavračić, F. C. Mocanu, V. L. Deringer, G. Csányi and S. R. Elliott, J. Phys. Chem. Lett., 2018, 9, 2985–2990 CrossRef PubMed.
- N. Blagden, M. de Matas, P. T. Gavan and P. York, Adv. Drug Delivery Rev., 2007, 59, 617–630 CrossRef CAS PubMed.
- Q. Lu and G. Zografi, Pharm. Res., 1998, 15, 1202–1206 CrossRef CAS PubMed.
- J. Knapik, Z. Wojnarowska, K. Grzybowska, K. Jurkiewicz, L. Tajber and M. Paluch, Mol. Pharmaceutics, 2015, 12, 3610–3619 CrossRef CAS PubMed.
- A. Teja, P. B. Musmade, A. B. Khade and S. J. Dengale, Eur. J. Pharm. Sci., 2015, 78, 234–244 CrossRef CAS PubMed.
- K. Löbmann, R. Laitinen, H. Grohganz, K. C. Gordon, C. Strachan and T. Rades, Mol. Pharmaceutics, 2011, 8, 1919–1928 CrossRef PubMed.
- R. Laitinen, K. Lobmann, H. Grohganz, C. Strachan and T. Rades, Mol. Pharmaceutics, 2014, 11, 2381–2389 CrossRef CAS PubMed.
- J. Banhart, Prog. Mater. Sci., 2001, 46, 559–632 CrossRef CAS.
- P. Samal and J. Newkirk, ASM Handb. powder Metal, 2015 Search PubMed.
- A. N. M. Alhusseny, A. Nasser and N. M. J. Al-zurfi, High-porosity metal foams: potentials, applications, and formulations, IntechOpen, 2018 Search PubMed.
- Y. Oshida, Bioscience and bioengineering of titanium materials, Elsevier, 2010 Search PubMed.
- M. M. Ahammed and V. Meera, J. Hazard. Mater., 2010, 181, 788–793 CrossRef CAS PubMed.
- R. Augustine, E. A. Dominic, I. Reju, B. Kaimal, N. Kalarikkal and S. Thomas, RSC Adv., 2014, 4, 51528–51536 RSC.
- S. El-Nahas, M. S. Abd El-sadek, H. M. Salman and M. M. Elkady, Mater. Chem. Phys., 2021, 258, 123885 CrossRef CAS.
- L. M. Dwyer, V. K. Michaelis, M. O'Mahony, R. G. Griffin and A. S. Myerson, CrystEngComm, 2015, 17, 7922–7929 RSC.
- J.-M. Ha, J. H. Wolf, M. A. Hillmyer and M. D. Ward, J. Am. Chem. Soc., 2004, 126, 3382–3383 CrossRef CAS PubMed.
- L. M. Martínez, M. Videa, G. A. López-Silva, A. Carlos, J. Cruz-Angeles and N. González, Int. J. Pharm., 2014, 477, 294–305 CrossRef PubMed.
- B. C. Dominguez and J. Gröls, Cryst. Growth Des., 2022 DOI:10.1021/acs.cgd.1c01442.
- A. J. Al-Ani, C. Herdes, C. C. Wilson and B. Castro-Dominguez, Cryst. Growth Des., 2020, 20, 1451–1457 CrossRef CAS.
- H. Hojjati and S. Rohani, Org. Process Res. Dev., 2006, 10, 1101–1109 CrossRef CAS.
- M. D. Newman, M. Stotland and J. I. Ellis, J. Am. Acad. Dermatol., 2009, 61, 685–692 CrossRef CAS PubMed.
- H. M. Yusof, R. Mohamad and U. H. Zaidan, J. Anim. Sci. Biotechnol., 2019, 10, 1–22 CrossRef PubMed.
- F. Luo, M. Wang, L. Huang, Z. Wu, W. Wang, A. Zafar, Y. Tian, M. Hasan and X. Shu, ACS Omega, 2020, 5, 11799–11808 CrossRef CAS PubMed.
- G. T. Rengarajan, D. Enke, M. Steinhart and M. Beiner, Phys. Chem. Chem. Phys., 2011, 13, 21367–21374 RSC.
- A. Saleemi, I. I. Onyemelukwe and Z. Nagy, Front. Chem. Sci. Eng., 2013, 7, 79–87 CrossRef CAS.
- T. T. Guaraldo, J. Wenk and D. Mattia, Adv. Sustainable Syst., 2021, 5, 2000208 CrossRef.
- Adapted from “Beaker, Sponge, Otolith crystal”, by BioRender.com (2022). Retrieved from https://app.biorender.com/biorender.
- L. Whitmore, A. A. Sokol and C. R. A. Catlow, Surf. Sci., 2002, 498, 135–146 CrossRef CAS.
- H. J. C. Berendsen, D. van der Spoel and R. van Drunen, Comput. Phys. Commun., 1995, 91, 43–56 CrossRef CAS.
- A. P. Pawar, A. R. Paradkar, S. S. Kadam and K. R. Mahadik, AAPS PharmSciTech, 2004, 5, 57–64 CrossRef PubMed.
- C. Leyva-Porras, P. Cruz-Alcantar, V. Espinosa-Solís, E. Martínez-Guerra, C. I. Piñón-Balderrama, I. Compean Martínez and M. Z. Saavedra-Leos, Polymer, 2020, 12, 5 CAS.
- P. Di Martino, G. F. Palmieri and S. Martelli, Chem. Pharm. Bull., 2000, 48, 1105–1108 CrossRef CAS PubMed.
- P. Grobelny, I. Kazakevich, D. Zhang and R. Bogner, Pharm. Dev. Technol., 2015, 20, 118–127 CrossRef CAS PubMed.
- T. P. Shakhtshneider, S. A. Myz, M. A. Mikhailenko, T. N. Drebushchak, V. A. Drebushchak, A. P. Fedotov, Y. U. A. Chesalov, A. S. Medvedeva and V. V. Boldyrev, Chem. Sustainable Dev., 2008, 16, 457–463 Search PubMed.
- A. I. Nizovskii, A. V. Kalinkin, T. P. Shakhtshneider, M. A. Dyakonova, S. A. Myz, E. V. Boldyreva and R. Kumar, J. Struct. Chem., 2011, 52, 137–144 CrossRef CAS.
- T. P. Shakhtshneider, S. A. Myz, M. A. Mikhailenko, T. N. Drebushchak, V. A. Drebushchak, A. P. Fedotov, A. S. Medvedeva and V. V. Boldyrev, Mater. Manuf. Processes, 2009, 24, 1064–1071 CrossRef CAS.
- T. P. Shakhtshneider, S. A. Myz, M. A. Dyakonova, V. V. Boldyrev, A. L. Nizovskii, A. V. Kalinkin and R. Kumar, Acta Phys. Pol., A, 2011, 120, 272–278 CrossRef CAS.
- W. J. E. M. Habraken, J. Tao, L. J. Brylka, H. Friedrich, L. Bertinetti, A. S. Schenk, A. Verch, V. Dmitrovic, P. H. H. Bomans and P. M. Frederik, Nat. Commun., 2013, 4, 1–12 Search PubMed.
- J. A. H. Forrest, J. A. Clements and L. F. Prescott, Clin. Pharmacokinet., 1982, 7, 93–107 CrossRef CAS PubMed.
- P. Gautam, C. Mweka and E. Fahrenkrug, in ECS Meeting Abstracts, IOP Publishing, 2020, p. 2908 Search PubMed.
Footnote |
| † Electronic supplementary information (ESI) available. See DOI: https://doi.org/10.1039/d2ce00211f |
| This journal is © The Royal Society of Chemistry 2022 |