
Combined crystallographic and computational investigation of the solvent disorder present in a new tipiracil hydrochloride methanol solvate–hydrate†
Rafael
Barbas
 a,
Mercè
Font-Bardia
b,
Dafne
de Sande
a,
Antonio
Frontera
*c and
Rafel
Prohens
*a
a,
Mercè
Font-Bardia
b,
Dafne
de Sande
a,
Antonio
Frontera
*c and
Rafel
Prohens
*a
aUnitat de Polimorfisme i Calorimetria, Centres Científics i Tecnològics, Universitat de Barcelona, Baldiri Reixac 10, 08028 Barcelona, Spain. E-mail: rafel@ccit.ub.edu
bUnitat de Difracció de Raigs X, Centres Científics i Tecnològics, Universitat de Barcelona, Spain
cDepartament de Química, Universitat de les Illes Balears, Crta. de Valldemossa km 7.5, 07122 Palma, Spain. E-mail: toni.frontera@uib.es
First published on 4th April 2022
Abstract
This work reports a combined computational and experimental analysis of the crystal structure of the cancer drug tipiracil hydrochloride in the form of a methanol solvate–hydrate (4![[thin space (1/6-em)]](https://www.rsc.org/images/entities/char_2009.gif) :1:3, molar ratio). The crystal structure shows a complex network of H-bonds with static discrete disorder in two out of the three symmetry-independent solvent molecules, which has been studied by means of DVS and TGA techniques. MEP surface calculations shows a region of positive potential (σ-hole) along the C–Cl bond, which induces the formation of Cl⋯O contacts that are relevant in the crystal packing. The hydrogen and halogen bonding assemblies were further analyzed using density functional theory (DFT), the quantum theory of “atom-in-molecules” (QTAIM) and the noncovalent interaction plot (NCIplot).
:1:3, molar ratio). The crystal structure shows a complex network of H-bonds with static discrete disorder in two out of the three symmetry-independent solvent molecules, which has been studied by means of DVS and TGA techniques. MEP surface calculations shows a region of positive potential (σ-hole) along the C–Cl bond, which induces the formation of Cl⋯O contacts that are relevant in the crystal packing. The hydrogen and halogen bonding assemblies were further analyzed using density functional theory (DFT), the quantum theory of “atom-in-molecules” (QTAIM) and the noncovalent interaction plot (NCIplot).
Introduction
The development of crystal engineering, a term and a discipline coined by Gautam Desiraju, has allowed the generation of deep knowledge on the intermolecular interactions that govern the crystal packing, and as a consequence of this the highly productive design of multicomponent crystals with tailored physicochemical properties is today a reality.1 But frequently a multicomponent crystal cannot be avoided when working with organic compounds which are crystallized in organic solvents. In particular, the existence of solvates and hydrates in the area of pharmaceutical drugs can be considered ubiquitous2 and it is an important concern when formulating a drug compound due to toxicity issues of some organic solvents.3 Solvent molecules can play different roles in the structure, they can be simply voids fillers or essential parts of the structure providing with strong intermolecular interactions with the drug compound.4 Moreover, they can be precursors of new anhydrous polymorphs.5 Thus, the study of solvates has become a key aspect when developing new solid forms of drug compounds.6On the other hand, crystallographic disorder is another key aspect of multicomponent crystals, since it is shown by ∼20% of the structures contained in the Cambridge Structural Database (CSD).7 In particular, the static discrete disorder, produced when a discrete number of possible positions are occupied by a molecule in the crystal structure, occurs when different domains can coexist in the structure with very similar intermolecular interactions and packing together with equivalent energies. It is not surprising that solvates are not alien to this phenomenon8,9 because the volume occupied by most of organic solvents is usually smaller than the drug compound, which enables them to accommodate themselves in different position still establishing intermolecular interactions of similar energy.
In this sense, the hydrogen bonding (HB)10 remains as the most important interaction observed in the field of supramolecular chemistry,11 with halogen bonding (HaB) also attracting substantial interest by the crystal engineering and supramolecular catalysis communities.12–15 This is due to its higher directionality compared to hydrogen bond,13–17 which makes the synthesis and X-ray characterization of halogenated compounds a topic of continuous interest to further understand the behavior and directing role of HaBs in comparison to HBs.
Tipiracil (5-chloro-6-[(2-imino-1-pyrrolidinyl)methyl]-2,4(1H,3H)-pyrimidinedione) is a thymidine phosphorylase inhibitor which is used in combination with the cytotoxic compound trifluridine enhancing its bioavailability in the treatment of the colorectal cancer,18 the third most common cancer worldwide19 and it has been recently revealed as a potential anti-COVID-19 compound.20 In this manuscript, we report the crystal structure of the methanol solvate–hydrate of tipiracil hydrochloride and further analyze its thermal desolvation behaviour and its crystal packing in terms of the crystallographic disorder and intermolecular interactions involved. Moreover, it discloses the co-existence of several hydrogen bonds (NH⋯O,Cl; OH⋯O and CH⋯O) and (Cl⋯O HaB) interactions, which have been characterized energetically using DFT calculations and the quantum theory of atoms-in-molecules (QTAIM) aimed to estimate the contribution of each contact. Further rationalization and characterization of the noncovalent interactions have been performed using MEP and NCIPlot computational tools evidencing the key role of HBs and HaBs in the solid state of this important drug compound.
Experimental
Materials
Tipiracil hydrochloride was synthesized in methanol following the procedure described in ref. 21 and supplied by Farmhispania, S. A. Single crystals of the title compound suitable for SXCRD analysis were obtained as follows: tipiracil hydrochloride (4 mg) was dissolved in AcOEt/water (9/1 (v/v), 0.5 mL) at 25 °C and allowed to crystallize overnight.Thermogravimetric analysis (TGA)
Thermogravimetric analyses were performed on a Mettler-Toledo TGA-851e thermobalance. Experimental conditions: alumina crucibles of 70 μL volume, atmosphere of dry nitrogen with 50 mL min−1 flow rate, heating rate of 2 °C min−1.Dynamic vapor sorption (DVS)
The water sorption and desorption processes were measured on a DVS-1000 instrument from Surface Measurement Systems. The samples were mounted on a balance and studied over a humidity range from 0% to 90% RH, and then decreased to 0% RH at 25 °C using a two-cycle method. The equilibrium condition for each step was set to a mass constancy of ±0.001% over 60 min and a maximum time limit of 1440 min for each step.X-ray crystallographic analysis
:1:3, molar ratio) were collected with a D8 Venture system equipped with a multilayer monochromator and a Mo microfocus (λ = 0.71073 Å). Frames were integrated with the Bruker SAINT software package using a SAINT algorithm. Data were corrected for absorption effects using the multi-scan method (SADABS).22,23 The structures were solved and refined using the Bruker SHELXTL soft-ware package, a computer program for automatic solution of crystal structures and refined by full-matrix least-squares method with ShelXle version 4.8.0, a Qt graphical user interface for SHELXL computer program.24 Crystallographic data and structural refinements details are summarized in Table 1.
:1:3 stoichiometry)
| Crystal data | Tipiracil hydrochloride methanol solvate–hydrate |
|---|---|
| Empirical formula | C37H58Cl8N16O12 |
| Formula weight | 1202.59 |
| Temperature (K) | 100(2) |
| System | Orthorhombic |
| Space group | P212121 |
| a (Å) | 7.1291(2) |
| b (Å) | 13.5358(5) |
| c (Å) | 27.2056(11) |
| α (°) | 90 |
| β (°) | 90 |
| γ (°) | 90 |
| Vol (Å3) | 2625.29(16) |
| Z | 2 |
| Density (calc.) (Mg m−3) | 1.521 |
| Final R indices | R 1 = 0.0510, |
| [I > 2σ(I)] | wR2 = 0.1486 |
| CCDC | 2144103 |
Computational methods
The calculations of the non-covalent interactions were carried out using the Gaussian-16 (ref. 25) and the PBE0-D3/def2-TZVP level of theory.26,27 To evaluate the interactions in the solid state, the crystallographic coordinates have been used and only the position of the H-atoms optimized. The interaction energies have been computed by calculating the difference between the energies of isolated monomers and their assembly. The interaction energies were calculated with correction for the basis set superposition error (BSSE) by using the Boys–Bernardi counterpoise technique.28 The Bader's “Atoms in molecules” theory (QTAIM)29 has been used to study the interactions discussed herein by means of the AIMAll calculation package.30 The molecular electrostatic potential surfaces have been computed using the Gaussian-16 software.31In order to assess the nature of interactions in terms of being attractive or repulsive and revealed them in real space, we have used NCIPLOT index, which is a method for plotting non-covalent interaction regions,31 based on the NCI (non-covalent interactions) visualization index derived from the electronic density.32 The reduced density gradient (RDG), coming from the density and its first derivative, is plotted as a function of the density (mapped as isosurfaces) over the molecule of interest. The sign of the second Hessian eigenvalue times the electron density [i.e. sign(λ2)ρ in atomic units] enables the identification of attractive/stabilizing (blue-green coloured isosurfaces) or repulsive (yellow-red coloured isosurfaces) interactions using 3D-plots. For the plots shown in Fig. 8 the NCIplot index parameters are: RGD = 0.5; ρ cut off = 0.04 a.u.; color range: −0.04 a.u. ≤ sign(λ2)ρ ≤ 0.04 a.u.
Results and discussion
Structural description of tipiracil hydrochloride methanol solvate–hydate crystal structure
Tipiracil hydrochloride methanol solvate–hydrate crystallizes in the orthorhombic P212121 space group and the crystal structure have two molecules of tipiracil hydrochloride, half molecule of methanol and one and a half molecules of water in the asymmetric unit (Z = 2), which is shown with ORTEP representation in Fig. 1.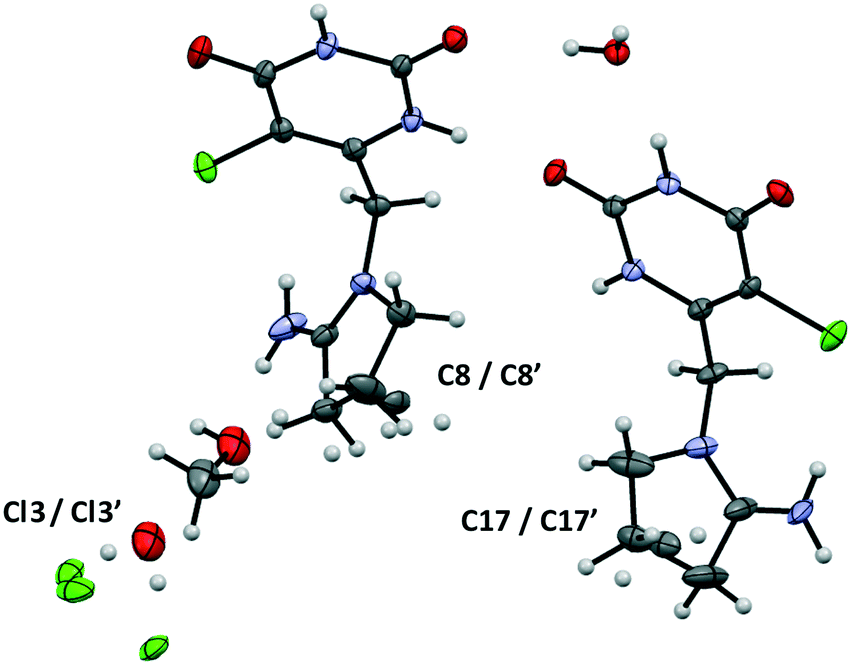 | ||
| Fig. 1 ORTEP representation of the asymmetric unit of tipiracil hydrochloride methanol solvate–hydrate. | ||
Both symmetrically independent molecules of tipiracil show at 100 K 50% static disorder because of the two slightly different conformations of the pyrrolidinyl rings. One symmetrically independent water and the methanol molecules also show static disorder with an occupancy factor of 50%, while the other water molecule is completely ordered. All three independent molecules of solvent are disposed in channels as shown in the packing representation, (Fig. 2). Thus, in order to further understand the role of these solvent channels in the crystal integrity we investigated the desolvation process by combining DVS and TGA techniques.
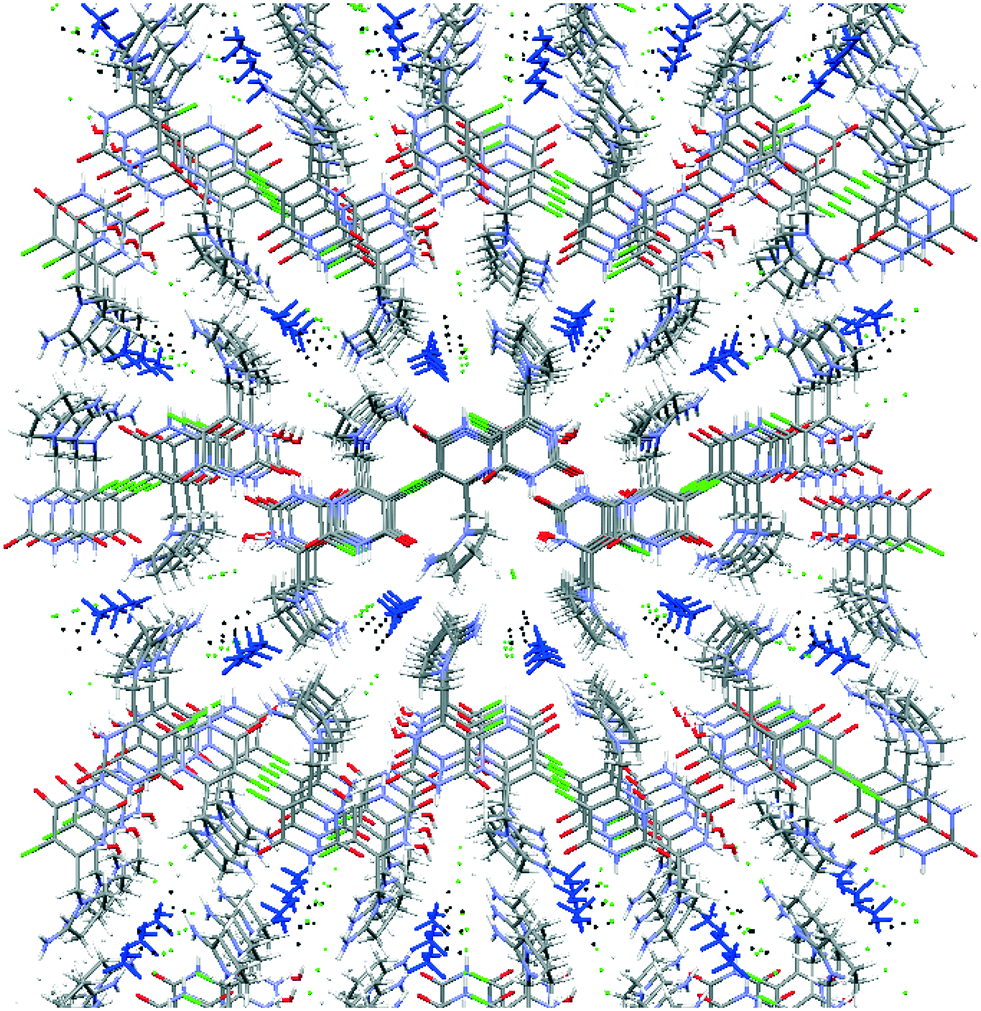 | ||
| Fig. 2 Packing of tipiracil hydrochloride methanol solvate–hydrate crystal structure showing the disordered methanol/water (50:50) channels. Methanol molecules are highlighted in blue and water in black. | ||
Thermal and desorption behavior of tipiracil hydrochloride
Tipiracil hydrochloride has been reported to exist in three crystal forms33,34 named crystal I, II and III, which were obtained using different mixtures of water and ethanol. Anhydrous crystal I is the most stable form in terms of thermal stability and it is “easier to handle in the production and packing of medicaments”,33 compared to crystal II and crystal III. Interestingly, no evidence of solvate formation was described in the original product patent33 although the single crystal of form III was obtained by crystallization of tipiracil hydrochloride in a methanol/water (1/1, v/v) solution at 20 °C. The XRPD experimental pattern of the new methanol solvate–hydrate compared to the simulated patterns from reported characteristics (2θ) peaks is shown in Fig. 3. Thus, all reported 2θ peaks of crystal II match perfectly with the bulk powder of the new methanol solvate–hydrate, (Fig. S1 and Table S4, ESI†). However, both solids were synthetized using different solvents, ethanol and methanol in each case, suggesting that this new methanol solvate hydrate form is isostructural respect to crystal II (no weight loss was reported in its TG/DTA analysis for this form).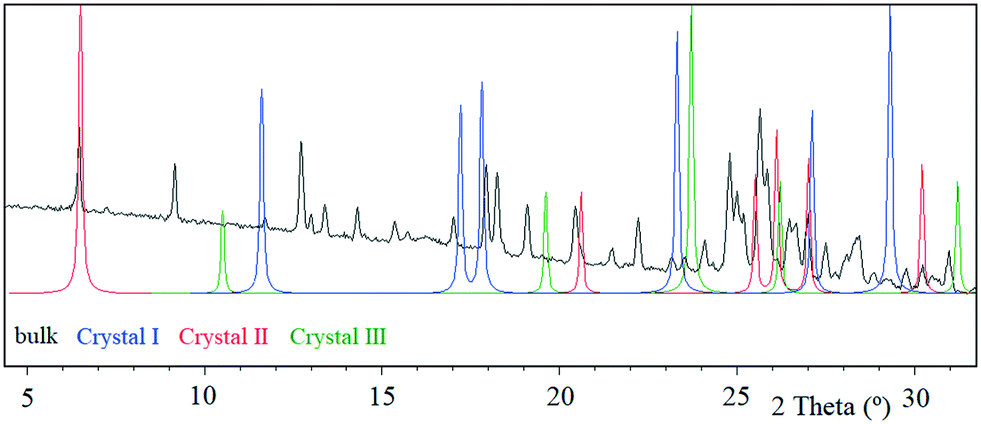 | ||
| Fig. 3 XRPD experimental pattern of tipiracil hydrochloride methanol solvate–hydrate bulk powder (black) compared to the simulated patterns from reported peak lists of US 9.527.833 B2 patent: crystal I (blue), crystal II (red) and crystal III (green). Enlargement from 5 to 30° 2θ. | ||
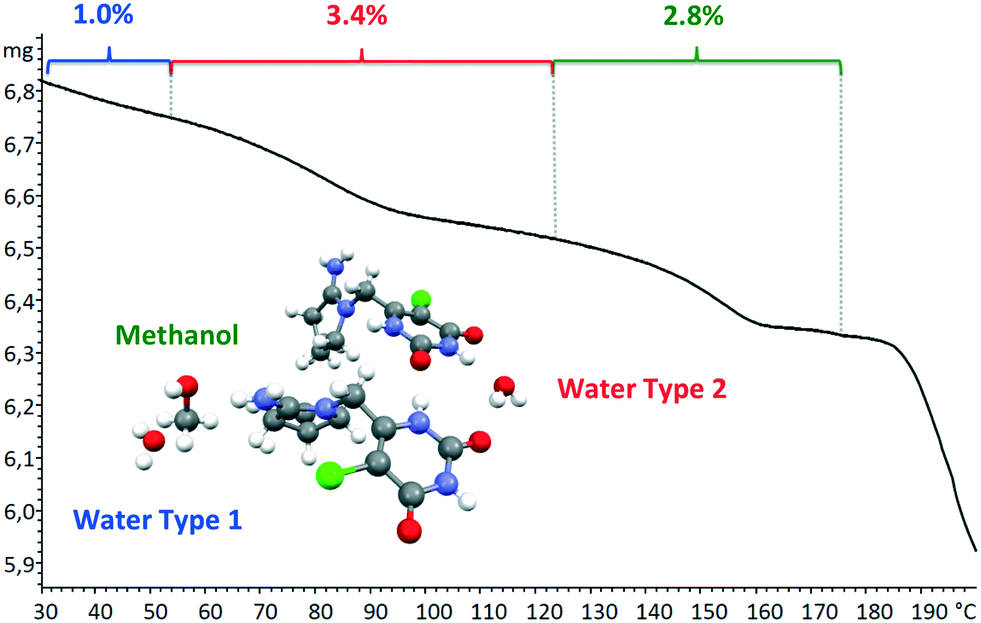
Moreover, we indexed the bulk powder diffractogram of tipiracil hydrochloride methanol solvate–hydrate with the same orthorhombic cell determined by SCXRD (Fig. S2 and S3, ESI†) confirming that the bulk powder and the single crystal correspond to the same crystal form. On the other hand, the TGA analysis of the bulk powder of tipiracil hydrochloride methanol solvate–hydrate shows a three steps desolvation process consisting of a first weight loss of 1.0% from 29 °C to 52 °C, a second weight loss of 3.4% from 52 °C to 123 °C and a third weight loss of 2.8% from 123 °C to 179 °C (Fig. S5† for further details). This desolvation profile is perfectly compatible with the three independent crystallographic positions of the solvent molecules observed in the crystal structure, which is formed by 3 molecules of water (called water type 1 and 2 in Fig. 4) and 1 molecule of methanol per every four molecules of tipiracil hydrochloride (weight loss of 4.4% and 2.8%, respectively; theoretical total weight loss of 7.2%) (Fig. 4). TGA shows that the first solvent molecule to be released upon heating is the crystallographically disordered water molecule (type 1), followed by the ordered water molecule (type 2) and finally the methanol.
 | ||
| Fig. 4 TGA curve of tipiracil hydrochloride methanol solvate–hydrate bulk powder showing the three independent and consecutive desolvation phenomena. | ||
On the other hand, the DSC analysis shows a first wide endothermic phenomenon from 75 °C with an associated heat of 27.3 J g−1 and a second endothermic phenomenon at 170 °C with an associated heat of 85.7 J g−1, (Fig. S4, ESI†). This second phenomenon can be attributed to melting followed by decomposition of a new anhydrous form, since according to the TG/DTA analysis reported in the patent,33 crystal I and III show an endothermic peak at 262.2 °C and 245.1 °C, respectively, and no definite endothermic peak was observed during the TG/DTA analysis of crystal II.
Thus, aiming to characterize this hypothesized anhydrous form, DVS experiments were performed at 25 °C with the bulk powder (Fig. 5a). DVS isotherms show, before the first cycle, 1.3% water desorption during the initial stabilization stage. Then, during the first cycle, it was registered water sorption up to 3.3% and 5.3% at 10% RH and 90% RH, respectively. A similar behavior was observed during the second cycle. The corresponding isotherms are shown in Fig. 5b, which are typical for a non-stoichiometric hydrate. The resulting solid was finally analyzed by XRPD showing the same pattern as the starting material, (Fig. S6, ESI†). Since methanol readsorption is not possible during a DVS experiment and TGA analysis shows that methanol is strongly bound and removed only at a temperature higher than 100 °C, we can hypothesize the formation of a non-isolable methanol solvate upon dehydration (∼5% loss on weight by DVS), which is rehydrated to the original methanol/water solvate when exposed to humidity ambient conditions. Further attempts to isolate this hypothesized methanol solvate were unsuccessful.
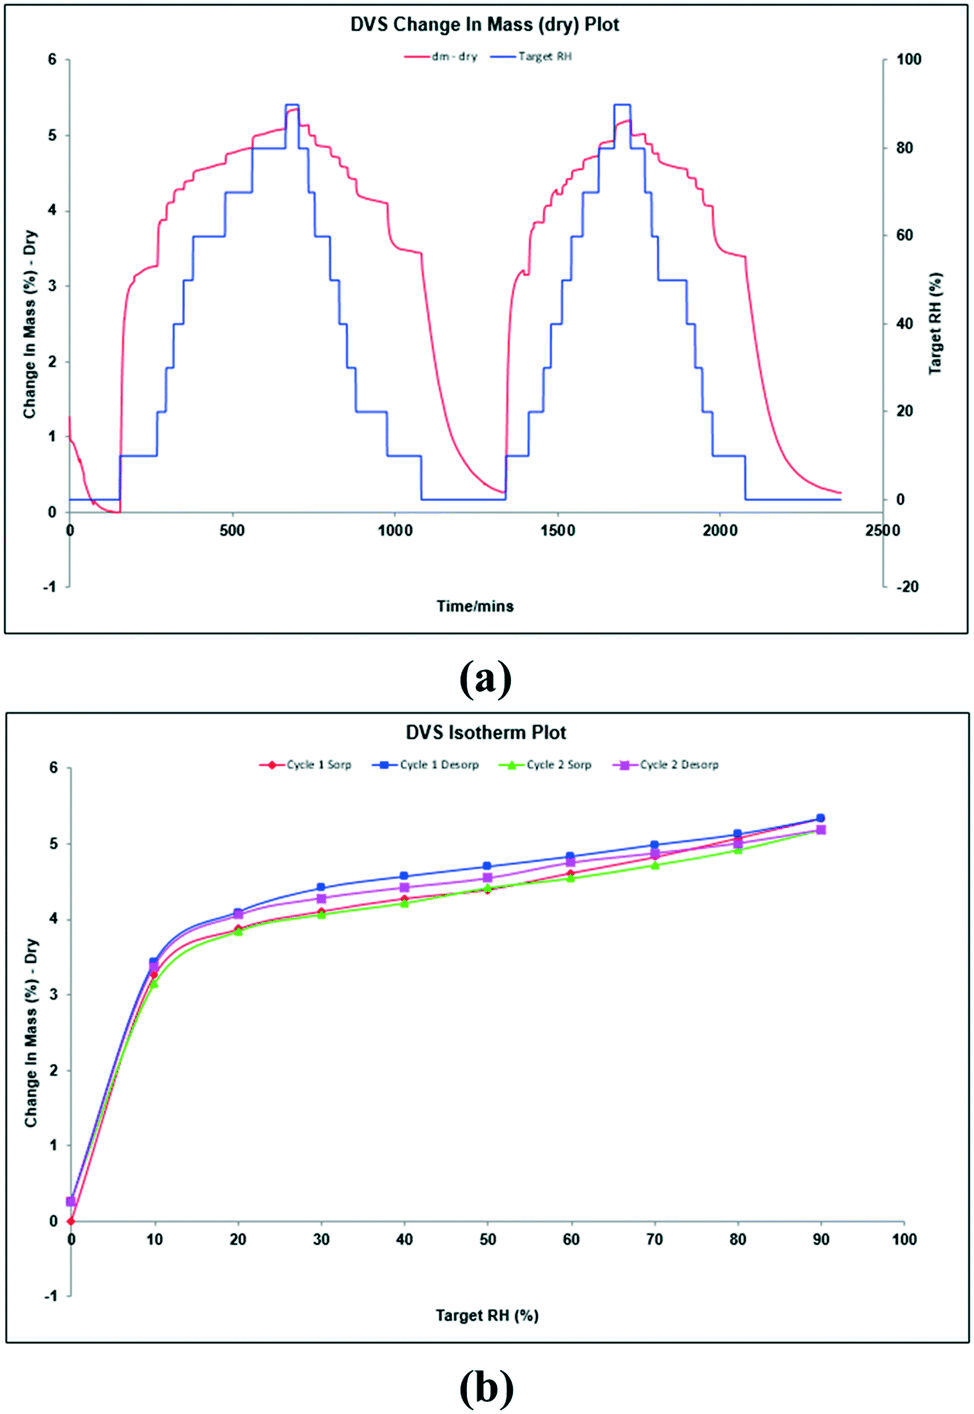 | ||
| Fig. 5 DVS sorption curves (a) and DVS isotherms (b) of tipiracil hydrochloride methanol solvate–hydrate. | ||
Once the solid-state characteristics of tipiracil hydrochloride methanol solvate–hydrate had been well determined we conducted a computational study aiming to get a deeper insight into the intermolecular forces responsible for the formation of different solvated domains in the crystal structure of the title compound and the strength of the different OH⋯O and NH⋯O contacts originating the H-bonding networks. In particular, there is an intricate combination of H-bonds the drug, water and solvent methanol molecules that influences the crystal packing and final 3D architecture of the salt. Such network, is analyzed in the following section, including the description of the geometric and energetic features of the H-bonds. Finally, the formation of a directional halogen bond is also highlighted and characterized by several computational tools.
DFT calculations
The MEP surface of compound tipiracil hydrochloride was initially computed (Fig. 6) to investigate the most nucleophilic and electrophilic parts of the salt. It is also convenient to analyze the anisotropy of the chlorine atom and the size and intensity of its σ-hole, that is usually modest in this halogen atom.35 It can be observed that the MEP minimum is located at the anionic Cl-atom as expected, displaced towards the nearby O-atom (−77.2 kcal mol−1), while the maximum MEP is located at the C![[double bond, length as m-dash]](https://www.rsc.org/images/entities/char_e001.gif) N+H2 group (+87.8 kcal mol−1). The MEP at the carbonyl O-atom is also large and negative (−33.2 kcal mol−1) and that at the NH group of the six-membered ring is large and positive (+32.6 kcal mol−1) thus confirming that both are good H-bond donor/acceptor groups. Detail of the MEP around the chorine atom is shown in Fig. 6 (bottom-left) where a reduced MEP scale was used (±30 kcal mol−1). The chlorine atom presents a large and intense σ-hole (+25.1 kcal mol−1) thus anticipating a strong ability to establish halogen bonding interactions. In spite the chlorine atom is not a good σ-hole donor,35 it presents an intense σ-hole due to the overall positive charge of the tipiracil molecule. The MEP surface anticipates a strong ability of tipiracil hydrochloride to form H-bonds in the solid state as both donor and acceptor.
N+H2 group (+87.8 kcal mol−1). The MEP at the carbonyl O-atom is also large and negative (−33.2 kcal mol−1) and that at the NH group of the six-membered ring is large and positive (+32.6 kcal mol−1) thus confirming that both are good H-bond donor/acceptor groups. Detail of the MEP around the chorine atom is shown in Fig. 6 (bottom-left) where a reduced MEP scale was used (±30 kcal mol−1). The chlorine atom presents a large and intense σ-hole (+25.1 kcal mol−1) thus anticipating a strong ability to establish halogen bonding interactions. In spite the chlorine atom is not a good σ-hole donor,35 it presents an intense σ-hole due to the overall positive charge of the tipiracil molecule. The MEP surface anticipates a strong ability of tipiracil hydrochloride to form H-bonds in the solid state as both donor and acceptor.
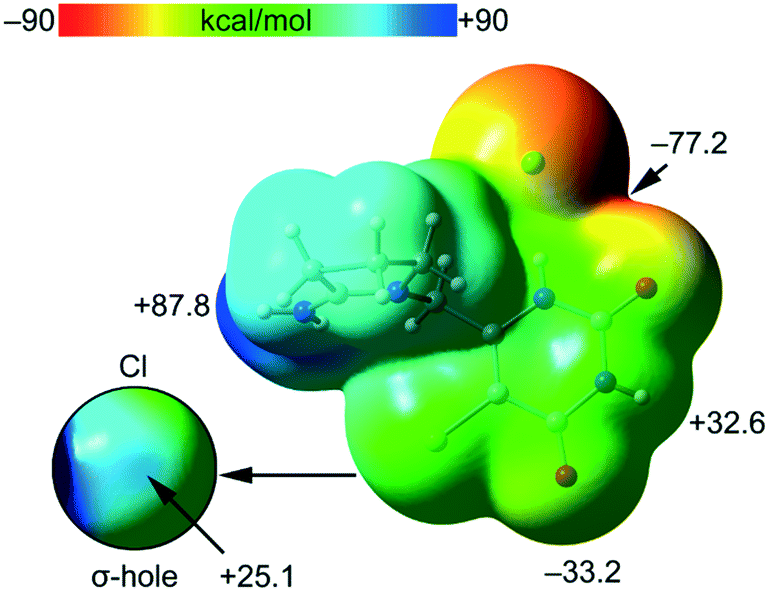 | ||
| Fig. 6 MEP surface of tipiracil hydrochloride salt at the PBE0-D3/def2-TZVP level of theory. Detail of the MEP around the halogen atom is also shown (bottom-left) where a reduced ±30 kcal mol−1 energy range has been used. The energies at selected points of the surface are given in kcal mol−1. | ||
The energetic DFT analysis is devoted to analyzing the different HB interactions that have a relevant structure-directing role in the solid state of tipiracil and have been also compared to the HaB. As commented above, two symmetrically independent tipiracil molecules cocrystallize along with one water (full occupation) and one methanol/water molecule (half occupation each one) from the solvent mixture. Fig. 7a shows a partial view of the 1D assembly formed by one of the symmetrically independent tipiracil molecules. In this infinite 1D chain, multiple H-bonding interactions are established, also involving the water molecule that bridges two tipiracil molecules via one donor and one acceptor HB with similar directionality (O–H⋯O and N–H⋯O angles are 167.7° and 168.3°, respectively). Moreover, Cl⋯O halogen bonds are also formed connecting two adjacent tipiracil molecules. Fig. 7b shows the combined QTAIM/NCIPlot analysis of one representative fragment showing that each H-bond is characterized by a bond critical point (CP, red sphere) and bond path interconnecting the H and O,N,Cl-atoms. The OH⋯O and NH⋯O,Cl interactions are also characterized by blue (strong attractive) NCIplot isosurfaces coincident to the location of the bond CPs. The CH⋯O interactions are characterized by green NCIplot isosurfaces indicating weaker interactions, as expected. The QTAIM also confirms the existence of the Cl⋯O HaB that is characterized by the corresponding bond CP, bond path and green NCIPlot index isosurface.
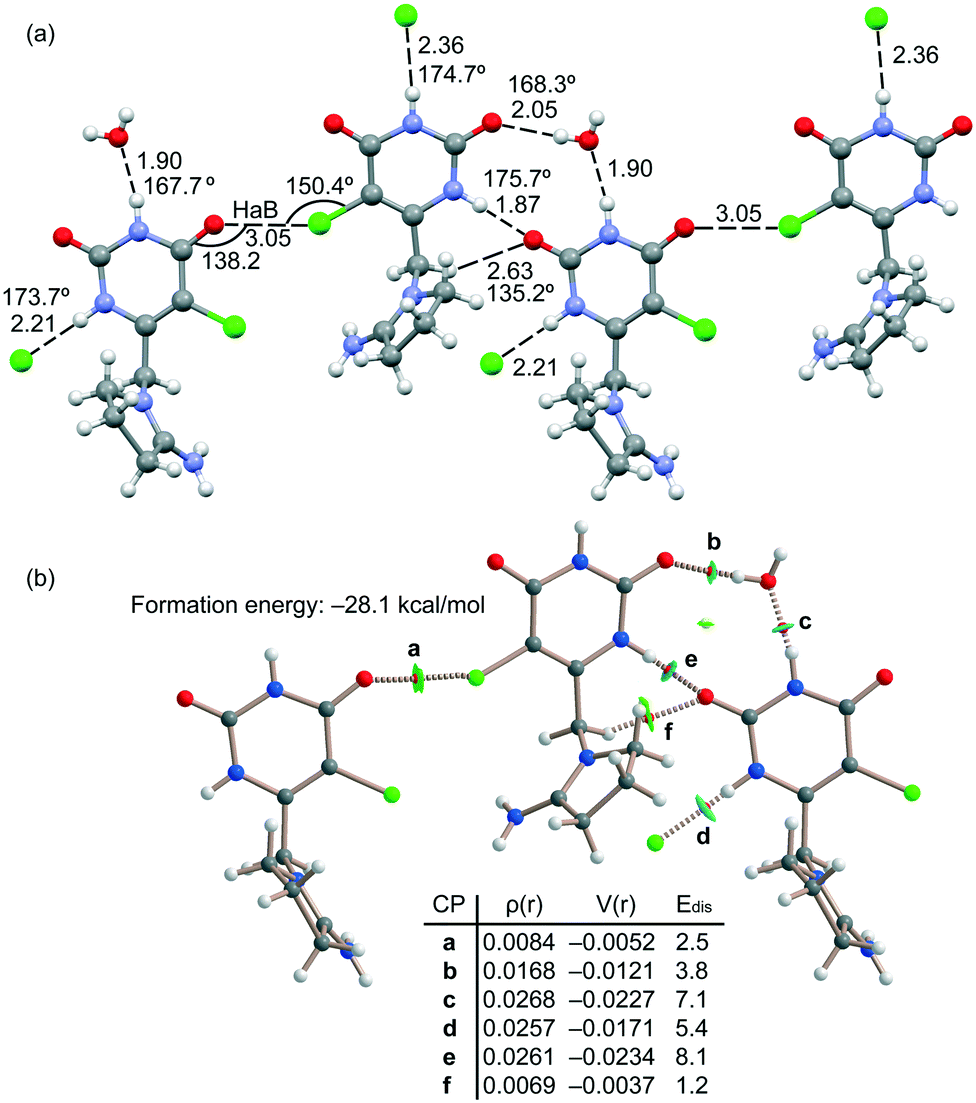 | ||
| Fig. 7 (a) Partial view of the X-ray structure of tipiracil hydrochloride. Distances in Å and angles in degrees. (b) QTAIM/NCIPlot analysis of intermolecular bond and ring CPs (red and yellow spheres, respectively) and bond paths of a supramolecular trimer of tipiracil. The ρ and V(r) values are given in a.u. Edis values are in kcal mol−1. | ||
In order to compare the strength of the different H-bonds, we have used the methodology proposed by Espinosa et al.36 to evaluate the dissociation energy of each contact. In particular, this method uses the potential energy density (Vr) at the bond CP and the equation: Edis = −1/2 × Vr. The values are indicated in Fig. 7 disclosing that the NH⋯O interactions (CPs “c” and “e”) are stronger (8.1 and 7.1 kcal mol−1) than the NH⋯O (5.4 kcal mol−1, CP “d”) and OH⋯O (3.8 kcal mol−1, CP “b”) HBs. The strength of the CH⋯O H-bond is much weaker (1.2 kcal mol−1, CP “f”) as expected for this type of HBs and worse directionality (C–H⋯O angle 135.2°). The dissociation of the Cl⋯O contact has been also evaluated using the Vr predictor and the equation proposed in the literature for HaB.37 The dissociation energy of the Cl⋯O contact is 2.5 kcal mol−1, in line with previous computations of halogen bonding interactions.38 This interaction is weaker than the conventional HBs but stronger than the CH⋯O contacts. Total formation energy of the assembly shown in Fig. 7b is −28.1 kcal mol−1, thus revealing the importance of the intricate combination of diverse interactions in the solid state of tipiracil hydrochloride.
Surveys of structures in the CSD/PDB coupled with theoretical calculations have characterized before the geometry of Cl⋯O HaBs in small13,14,39 and biological40 molecules, showing that the physical nature is principally electrostatic, with additional contributions from polarization, dispersion, and charge transfer.41 The strength of HaBs is estimated to range from around half to slightly greater than that of an average HB in directing the packing of organic crystals, which is in line with the results observed in this work.42
It should be kept in mind that the dissociation energies obtained for the different contacts and the formation energies of the assemblies computed in this section are approximate, since they have been obtained using the QTAIM parameters.
Fig. 8a shows another assembly observed in the solid state that is generated by the other symmetrically independent tipiracil molecule. In this case the infinite 1D chain is propagated by N–H⋯O H-bonds involving one NH bond belonging to the CN+H2 group. The other NH bond is blocked by interacting with the methanol molecule. These contacts are revealed by the QTAIM/NCIPlot analysis performed with a dimer extracted from the 1D chain (see Fig. 8b). It shows the corresponding bond CPs and bond paths and blue isosurfaces characterizing the strong NH⋯O H-bonds. The QTAIM/NCIPlot analysis also reveals the formation of several CH⋯O HBs involving aliphatic CH bonds and the carbonyl groups of the six-membered ring. We have also estimated the contribution of each HB as detailed in Fig. 8. The strongest H-bond corresponds to the NH⋯O involving the methanol molecule (9.7 kcal mol−1, CP “g”) in line with the short distance and the positive nature of the H-bond donor. The NH⋯O bond between the tipiracil molecules is moderately strong (5.2 kcal mol−1, CP “h”) likely due to the positive charge of both molecules. The rest of CH⋯O bonds are much weaker (∼1 kcal mol−1) in line with the H-bond donor ability of the aliphatic CH bonds. It is important to highlight that the strongest contact revealed by the Vr energy predictor involves the methanol molecule. This strongly agrees with the experimental DVS and TGA analyses that disclose the strongly bound nature of methanol in the crystal structure, which can only be removed at high temperature, suggesting that it is a fundamental part which assures the integrity of the crystal and not a mere void filler. It also reinforces the hypothesis of the existence of a non-isolable methanol solvate, which readily rehydrates to form the mixed methanol/water solvate.
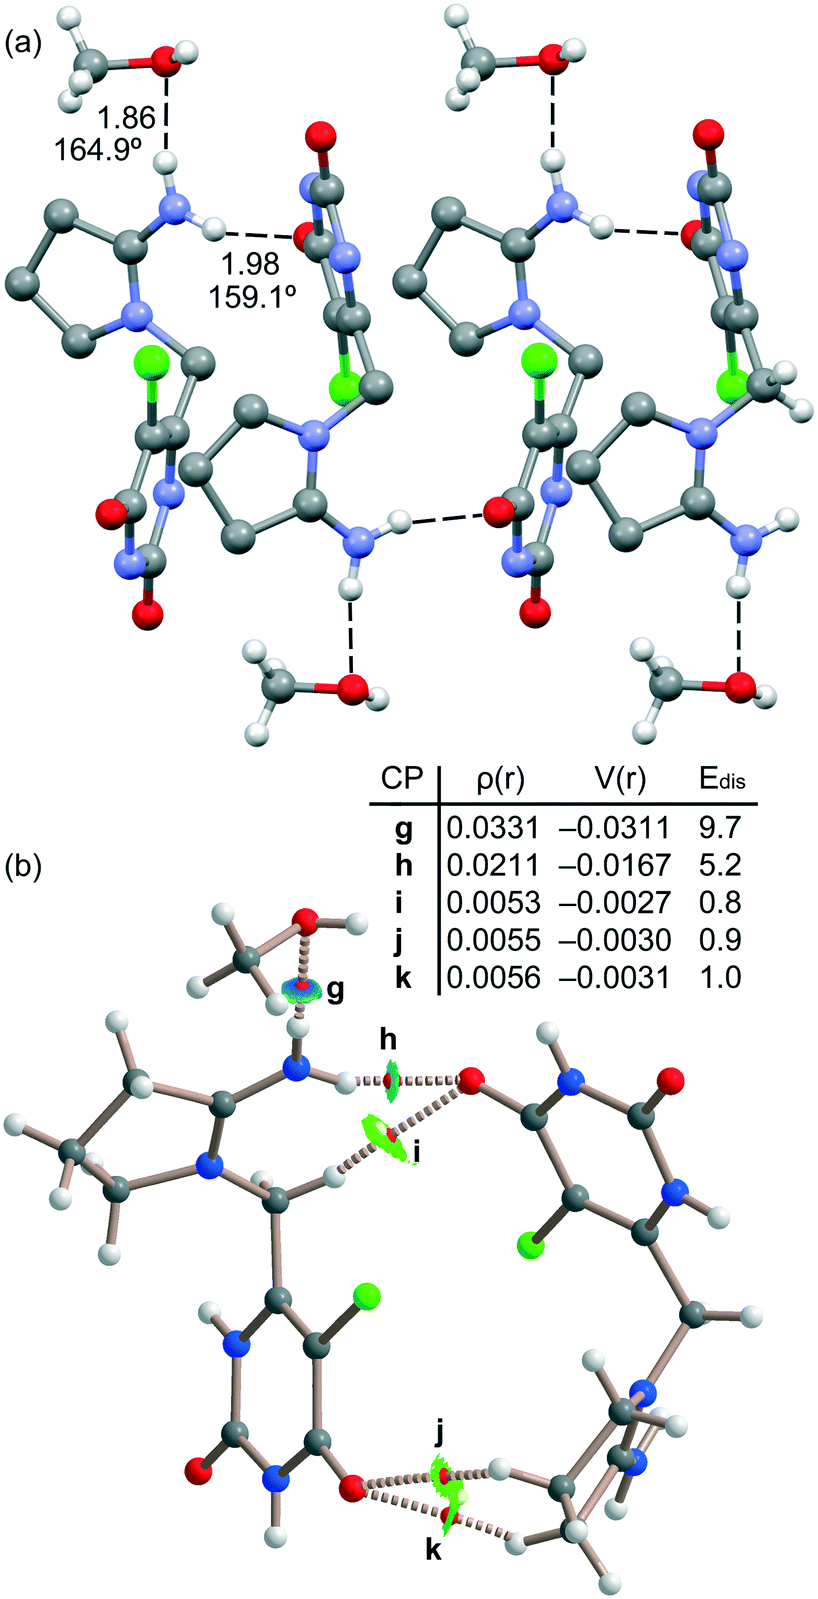 | ||
| Fig. 8 (a) Partial view of the X-ray structure of tipiracil hydrochloride. Distances in Å and angles in degrees. Some H-bonds omitted for clarity. (b) QTAIM and NCIPlot analyses of intermolecular bond and ring CPs (red spheres) bond paths (dashed lines) and isosurfaces of the dimer of tipiracil. The ρ and V(r) values are given in a.u. Edis values are in kcal mol−1. | ||
Conclusions
The first X-ray structure of tipiracil hydrochloride is reported herein as a methanol solvate–hydrate, showing static discrete disorder in two out of the three crystallographically independent solvent molecules, which has been thoroughly analyzed experimentally and compared to the scarce existent literature about the solid-state of this important drug compound. This has been complemented by a precise computational analysis, which has allowed rationalizing the role of the methanol in the crystal integrity of the title compound. The study also reveals that its crystal structure is formed by interesting 1D supramolecular assemblies and it mainly propagates by means of the formation of multiple H-bonds and Ha-bonds, which were analyzed energetically using density functional theory (DFT) calculations and the topological analysis of bond critical points. The H-bonds involving the OH and NH groups as donors are clearly dominant. Multiple CH⋯O are also observed, which are energetically less dominant. Finally, the Cl⋯O halogen bond is moderately strong in spite of the modest halogen bond ability of the Cl-atom that is due to the cationic nature of the tipiracil molecule in its hydrochloride form. This latter interaction is not considered by standard molecular dynamic simulations or docking calculations, which have been already reported for this relevant drug.43 Therefore, the results reported herein could be useful to scientists working not only in crystal engineering and solvates but also in protein–ligand interactions.Conflicts of interest
There are no conflicts to declare.Acknowledgements
We thank the MICIU/AEI of Spain (project PID2020-115637GB-I00 FEDER funds).Notes and references
- G. Desiraju, J. Am. Chem. Soc., 2013, 135, 9952–9967 CrossRef CAS PubMed.
- S. Boothroyd, A. Kerridge, A. Broo, D. Buttar and J. Anwar, Cryst. Growth Des., 2018, 18, 1903–1908 CrossRef CAS.
- S. R. Byrn, G. Zografi and X. S. Chen, Solid State Properties of Pharmaceutical Materials, John Wiley & Sons, Inc., 2017, pp. 38–47 Search PubMed.
- V. S. S. Kumar, F. C. Pigge and N. P. Rath, Cryst. Growth Des., 2004, 4, 651–653 CrossRef CAS.
- R. Barbas, M. Font-Bardia and R. Prohens, Cryst. Growth Des., 2018, 18, 3740–3746 CrossRef CAS.
- U. J. Griesser, The Importance of Solvates, Polymorphism in the Pharmaceutical Industry, ed. Hilfiker, R., Wiley, New York, 2006, ch. 8, DOI:10.1002/3527607889.ch8.
- C. R. Groom, I. J. Bruno, M. P. Lightfoot and S. C. Ward, Acta Crystallogr., Sect. B: Struct. Sci., Cryst. Eng. Mater., 2016, 72, 171–179 CrossRef CAS PubMed.
- A. J. Cruz-Cabeza, G. M. Day and W. Jones, Phys. Chem. Chem. Phys., 2011, 13, 12808–12816 RSC.
- A. D. Bond and C. C. Sun, Acta Crystallogr., Sect. C: Struct. Chem., 2020, 76, 632–638 CrossRef CAS PubMed.
- I. Alkorta, J. Elguero and A. Frontera, Crystals, 2020, 10, 180 CrossRef CAS.
- A. M. Maharramov, K. T. Mahmudov, M. N. Kopylovich and A. J. L. Pombeiro, Non-Covalent Interactions in the Synthesis and Design of New Compounds, John Wiley & Sons, Inc., Hoboken, NJ, USA, 2016 Search PubMed.
- G. R. Desiraju, Angew. Chem., Int. Ed. Engl., 1995, 34, 2311–2327 CrossRef CAS.
- P. Metrangolo and G. Resnati, Halogen Bonding: Fundamentals and Applications (Structure and Bonding), Springer, Berlin/Heidelberg, Germany, 2010 Search PubMed.
- G. Cavallo, P. Metrangolo, R. Milani, T. Pilati, A. Priimagi, G. Resnati and G. Terraneo, Chem. Rev., 2016, 116, 2478–2601 CrossRef CAS PubMed.
- M. Benito, Y. Roselló, M. Barceló-Oliver, A. Frontera and E. Molins, Int. J. Mol. Sci., 2021, 22, 10663 CrossRef CAS PubMed.
- F. Heinen, D. L. Reinhard, E. Engelage and S. M. Huber, Angew. Chem., Int. Ed., 2021, 60, 5069–5073 CrossRef CAS PubMed.
- D. Bulfield and S. M. Huber, Chem. – Eur. J., 2016, 22, 14434–14450 CrossRef CAS PubMed.
- C. B. Burness and S. T. Duggan, Drugs, 2016, 76, 1393–1402 CrossRef CAS PubMed.
- https://www.wcrf.org/dietandcancer/worldwide-cancer-data .
- Y. Kim, J. Wower, N. Maltseva, C. Chang, R. Jedrzejczak, M. Wilamowski, S. Kang, V. Nicolaescu, G. Randall, K. Michalska and A. Joachimiak, Commun. Biol., 2021, 193, 1–11 Search PubMed.
- S. Yano, H. Kazuno, T. Sato, N. Suzuki, T. Emura, K. Wierzba, J. Yamashita, Y. Tada, Y. Yamada, M. Fukushima and T. Asao, Bioorg. Med. Chem., 2004, 14, 3443–3450 CrossRef PubMed.
- SADABS Bruker AXS, Madison, Wisconsin, USA, 2004 Search PubMed; SAINT, Software Users Guide, Version 6.0, Bruker Analytical X-ray Systems, Madison, WI, 1999 Search PubMed.
- G. M. Sheldrick, SADABS v2.03, Area-Detector Absorption Correction, University of Göttingen, Germany, 1999 Search PubMed; Saint, Version 7.60A, Bruker AXS, 2008 Search PubMed; SADABS, V. 2008–1, 2008 Search PubMed.
- G. M. Sheldrick, Acta Crystallogr., Sect. A: Found. Crystallogr., 2008, 64, 112–122 CrossRef CAS PubMed.
- M. J. Frisch, G. W. Trucks, H. B. Schlegel, G. E. Scuseria, M. A. Robb, J. R. Cheeseman, G. Scalmani, V. Barone, G. A. Petersson, H. Nakatsuji, X. Li, M. Caricato, A. V. Marenich, J. Bloino, B. G. Janesko, R. Gomperts, B. Mennucci, H. P. Hratchian, J. V. Ortiz, A. F. Izmaylov, J. L. Sonnenberg, D. Williams-Young, F. Ding, F. Lipparini, F. Egidi, J. Goings, B. Peng, A. Petrone, T. Henderson, D. Ranasinghe, V. G. Zakrzewski, J. Gao, N. Rega, G. Zheng, W. Liang, M. Hada, M. Ehara, K. Toyota, R. Fukuda, J. Hasegawa, M. Ishida, T. Nakajima, Y. Honda, O. Kitao, H. Nakai, T. Vreven, K. Throssell, J. A. Montgomery, Jr., J. E. Peralta, F. Ogliaro, M. J. Bearpark, J. J. Heyd, E. N. Brothers, K. N. Kudin, V. N. Staroverov, T. A. Keith, R. Kobayashi, J. Normand, K. Raghavachari, A. P. Rendell, J. C. Burant, S. S. Iyengar, J. Tomasi, M. Cossi, J. M. Millam, M. Klene, C. Adamo, R. Cammi, J. W. Ochterski, R. L. Martin, K. Morokuma, O. Farkas, J. B. Foresman and D. J. Fox, Gaussian 16, Revision C.01, Gaussian, Inc., Wallingford CT, 2016 Search PubMed.
- S. Grimme, J. Antony, S. Ehrlich and H. Krieg, J. Chem. Phys., 2010, 132, 154104 CrossRef PubMed.
- F. Weigend, Phys. Chem. Chem. Phys., 2006, 8, 1057–1065 RSC.
- S. F. Boys and F. Bernardi, Mol. Phys., 1970, 19, 553–566 CrossRef CAS.
- R. F. W. Bader, J. Phys. Chem. A, 1998, 102, 7314–7323 CrossRef CAS.
- T. A. Keith, AIMAll (Version 13.05.06), TK Gristmill Software, Overland Park, KS, 2013 Search PubMed.
- J. Contreras-García, E. R. Johnson, S. Keinan, R. Chaudret, J.-P. Piquemal, D. N. Beratan and W. Yang, J. Chem. Theory Comput., 2011, 7, 625–632 CrossRef PubMed.
- E. R. Johnson, S. Keinan, P. Mori-Sánchez, J. Contreras-García, A. J. Cohen and W. Yang, J. Am. Chem. Soc., 2010, 132, 6498–6506 CrossRef CAS PubMed.
- I. H. Kazuno and S. T. Mutsumi, US Pat., 9527833 B2, 2016 Search PubMed.
- F. Morana, S. Gobbato, L. Cozzi, J. Roletto and P. Paissoni, WO Pat., 2019/086292 A1, 2019 Search PubMed.
- P. R. Varadwaj, A. Varadwaj and H. M. Marques, Crystals, 2020, 10, 146 CrossRef CAS.
- E. Espinosa, E. Molins and C. Lecomte, Chem. Phys. Lett., 1998, 285, 170–173 CrossRef CAS.
- L- E. Zelenkov, D. M. Ivanov, E. K. Sadykov, N. A. Bokach, B. Galmés, A. Frontera and V. Yu. Kukushkin, Cryst. Growth Des., 2020, 20, 6956–6965 CrossRef CAS.
- D. F. Mertsalov, R. M. Gomila, V. P. Zaytsev, M. S. Grigoriev, E. V. Nikitina, F. I. Zubkov and A. Frontera, Crystals, 2021, 11, 1406 CrossRef CAS.
- (a) P. Metrangolo and G. Resnati, Chem. – Eur. J., 2001, 7, 2511–2519 CrossRef CAS PubMed; (b) F. Meyer and P. Dubois, CrystEngComm, 2013, 15, 3058–3071 RSC.
- (a) P. Auffinger, F. A. Hays, E. Westhof and P. S. Ho, Proc. Natl. Acad. Sci. U. S. A., 2004, 101, 16789–16794 CrossRef CAS PubMed; (b) L. A. Hardegger, B. Kuhn, B. Spinnler, L. Anselm, R. Ecabert, M. Stihle, B. Gsell, R. Thoma, J. Diez, J. Benz, J. M. Plancher, G. Hartmann, D. W. Banner, W. Haap and F. Diederich, Angew. Chem., Int. Ed., 2011, 50, 314–318 CrossRef CAS PubMed.
- (a) K. E. Riley and P. Hobza, J. Chem. Theory Comput., 2008, 4, 232–242 CrossRef CAS PubMed; (b) M. H. Kolar, P. Carloni and P. Hobza, Phys. Chem. Chem. Phys., 2014, 16, 19111–19114 RSC.
- E. Corradi, S. V. Meille, M. T. Messina, P. Metrangolo and G. Resnati, Angew. Chem., 2000, 112, 1852–1856 CrossRef.
- K. Baby, S. Maitya, C. H. Mehta, A. Suresh, U. Y. Nayak and Y. Nayak, Arch. Med. Res., 2021, 52, 38–47 CrossRef CAS PubMed.
Footnote |
| † Electronic supplementary information (ESI) available: Crystal data and structure refinement, characterization of the bulk powder. CCDC 2144103. For ESI and crystallographic data in CIF or other electronic format see DOI: https://doi.org/10.1039/d2ce00161f |
| This journal is © The Royal Society of Chemistry 2022 |