DOI:
10.1039/D1CE01593A
(Paper)
CrystEngComm, 2022,
24, 1934-1941
Facile and single-step entrapment of chloramphenicol in ZIF-8 and evaluation of its performance in killing infectious bacteria with high loading content and controlled release of the drug†
Received
29th November 2021
, Accepted 9th February 2022
First published on 23rd February 2022
Abstract
Mutations in infectious bacteria and reduced drug efficacy have forced researchers to test new systems that combine carriers and drugs to improve performance. Here, CLN@ZIF-8 nanoparticles were synthesized by simple single-step entrapment of chloramphenicol (CLN) in zeolitic imidazolate framework-8 (ZIF-8). Chloramphenicol is a widely used antibiotic and ZIF-8 is a MOF (metal–organic framework) with proven good properties as a carrier. In this route, a high drug loading content (DLC) of 32.58 ± 2.65% and a drug loading efficiency (DLE) of 56.80 ± 6.68% were obtained. In a new and practical approach, drug release was evaluated under conditions similar to infectious environments containing higher concentrations of H2O2 and controlled release was achieved. Phosphate buffer played a decisive role in the destruction of the structure and release of the drug. The antibacterial activity was also measured by viable cell count assay and the results showed that CLN@ZIF-8 had a favorable efficacy in a short time. The structure of the compounds was also characterized using a variety of instrumental techniques.
1. Introduction
Biomedicine is being developed and updated along with other sciences and with the development of nanotechnology.1,2 In the field of using drugs to treat diseases, conventional methods are not able to respond fully, and the search for new advanced technologies is vital. Drugs may lose their effectiveness by direct administration for reasons such as low solubility, instability and metabolism. On the other hand, burst and premature release of drugs can lead to side effects such as damage to healthy cells.3–5 In order to overcome these problems, smart drug delivery has been considered for several years. Targeted systems can lead to controlled drug delivery, drug protection, good distribution, biodegradation and improved drug bioavailability.6–9 Polymeric nanoparticles,10 lipids,11 mesoporous silica12 and MOFs13 are among the new drug carriers. MOFs are crystalline compounds that result from arrays of metal segments (clusters/ions) attached to organic linkers (multi-dentate ligands) and because of their inherent properties are promising candidates for use in the medicine, environment and energy fields.14–17 Permanent porosity, excellent available surface area, adjustable pore size and high thermal/mechanical/chemical stability make MOFs more attractive materials than other carriers.17–19 After the pioneering work of Férey et al. on the use of the MIL-MOF family,20 various MOFs have been introduced for drug delivery.21 ZIF-8 (zeolitic imidazolate framework-8) is one of the most well-known MOFs that was first synthesized by Huang et al.22 and has been widely used in biomaterials applications such as imaging,23 membranes,24 sensing,25 biocatalysts26 and cargo delivery.27–30 ZIF-8 with the Zn(2-MeIm)2 formula has a zeolite-like topology that is synthesized from zinc ions and 2-methylimidazole ligands.31 ZIF-8 has been an excellent nanocarrier for cargoes such as proteins,27 enzymes28 and a variety of drugs29,32,33 due to its unique properties. Its high surface area and 11.8 Å pore size allow a satisfactory amount of active material to be loaded into ZIF-8, and unlike many MOFs, its 3.4 Å pore size aperture minimizes explosive release.32,34 The fact that both components of ZIF-8 are biological components is the cause of its low toxicity and biocompatibility.35,36 Chloramphenicol (CLN) is an amphenicol antibiotic extracted from Streptomyces venezuelae in 1947 and has been used clinically at short intervals. CLN has high antibacterial power and is effective against a variety of infectious microorganisms, so it is used to treat and prevent various infectious diseases in humans and animals.37–39 This drug with high lipophilicity shows a high ability to penetrate into body tissues.40,41 CLN is mainly used topically and is available in commercial forms such as eye drops, gels, and ointments to treat eye, ear and skin infections. Factors that have led to the popularity of CLN are that this antibacterial agent is still effective against multidrug-resistant bacteria and has a low cost.37,38,42 Due to the fact that a high dose of CLN has side effects,43 efforts have been made to solve this problem.44 The most crucial solution was to obtain new formulations. In this regard, different research groups have loaded, complexed or composited CLN with various organic and inorganic materials such as transition metals,45 silica,46 hydroxyapatite,44 polylactide-co-glycolide,41 collagen sponges,47 gelatin48 and chitosan.39 The purpose of the above-mentioned studies was to increase the efficiency and, generally, targeted drug release. In smart drug delivery, the goal is to achieve the gradual collapse of a carrier and slow release of the drug with the help of external stimuli. It is desirable to use the intrinsic properties of damaged sites, where, in the case of cancer cells, the acidic microenvironment inside them is used to achieve this purpose.29,32,33 Recently, H2O2-sensitive drug delivery systems based on MOFs have also been considered.49–52 Bacterial infections have also been shown to produce high levels of H2O2.52,53 Inspired by this finding, the controlled release of 3-azido-D-alanine from MIL-100 (Fe) MOF has been reported in an infectious microenvironment dependent on the concentration of H2O2. The resulting structure at infectious concentrations (50 μM) exhibited rapid drug release due to structural degradation.52 Herein, in light of the above, we investigated the potential of ZIF-8 in the single-step entrapment of chloramphenicol and its release behavior in H2O2 under conditions similar to infectious environments. Also, the antibacterial activity of the product was evaluated by viable cell count method.
2. Materials and methods
2.1. Materials
Chloramphenicol was donated by Jaber Ebne Hayyan Pharmaceutical Company, Tehran, Iran. The reagents required for the synthesis, including 2-methylimidazole (2-MeIm) (Sigma-Aldrich), Zn(NO3)2·6H2O (Merck), and triethylamine (TEA) (Merck) were of analytical grade. Phosphate-buffered saline (PBS) and Tris buffer were purchased from Merck Company and DNAbiotech Company, respectively. Hydrogen peroxide was provided by drm-chem Company, Iran. All materials were used as received.
2.2. Characterization
Fourier transformed infrared (FT-IR) spectra were acquired with a Bruker (Tensor 27) spectrometer by scanning from 500 to 4000 cm−1. X-ray diffraction (XRD) analysis was conducted on a D8 Advance diffractometer (Bruker, Germany) using a Cu-Kα source (λ = 1.542 Å). Flat plate diffraction data were collected in the 2θ range of 5–80°. The thermal behaviors of the samples were evaluated using an SDT Q600 V20.9 Build 20 thermal gravimetric analyzer (TGA) instrument in Ar flow, from 40 to 1000 °C with a heating rate of 10 °C min−1. The surface images and energy-dispersive X-ray spectra of the samples were obtained with a TESCAN MIRA3 scanning electron microscope (SEM). The electric charge was determined with a HORIBA SZ-100 Z zeta potential analyzer. UV-visible absorption measurements were taken on a Rayleigh spectrophotometer in the range of 200–400 nm. Nitrogen adsorption and desorption measurements were carried out at 77 K using a Micromeritics ASAP 2020 analyzer.
2.3. Synthesis of CLN@ZIF-8
Synthesis and entrapment of CLN in ZIF-8 was done in 4 entries. In the synthesis of entry 4, a solution of Zn(NO3)2·6H2O (0.20 g in 4.5 mL H2O) was added to a mixture solutions of 2-methylimidazole ligand (0.3312 g in 5 mL H2O + 0.2 mL TEA) and CLN (0.125 g in 5.5 mL H2O). After stirring the solution for 90 s, the precipitate was separated from the solution by centrifugation at 7000 rpm for 10 min, washed twice with water and separated again by centrifugation. Finally, the Falcon tube containing the product was dried overnight at 30 °C in a vacuum oven.
2.4. Drug capacity of CLN@ZIF-8
The capacity of ZIF-8 for entrapment of CLN was measured with DLC and DLE, which are as follows:
| Drug loading content (DLC) % = (weight of incorporated CLN)/(weight of CLN@ZIF-8) × 100 |
| Drug loading efficiency (DLE) % = (weight of incorporated CLN)/(total weight of CLN) × 100 |
To release the entire amount of the drug, after adding 0.2 mL of 2 M hydrochloric acid to 0.010 g of CLN@ZIF-8, the solution was diluted to 100 mL to complete the dissolution of the sample. Absorption of the clear solution at the characteristic absorption peak of CLN at 276 nm was recorded with the UV-vis spectrophotometer. Concentrations were determined using a CLN calibration curve (Fig. S1 in the ESI†).
2.5. Release of CLN
Drug release was tested in triplicate by immersing 10 mg of the sample in vials filled with 80 mL phosphate-buffered saline (PBS) solutions containing 0.5 μM and 50 μM H2O2. Sampling of the vials during shaking was performed by removing a 2.5 mL aliquot at a scheduled time and quickly replenishing it with the same fresh PBS solution. During the study, the temperature was kept at 37 °C with continuous shaking. The concentration of the released drug was obtained by using the recorded absorption of the drug in solution using the UV-vis spectrophotometer at 276 nm with the aid of the calibration curve of CLN. As control, the release was also performed in Tris buffer.
2.6. Antibacterial activity
The antibacterial activity of CLN@ZIF-8, ZIF-8, and CLN was measured by viable cell count method similar to our previous studies.54 The performance of the compounds was tested on Escherichia coli (ATCC 25922) and Staphylococcus aureus (ATCC-6538) bacteria. First, bacteria solutions at a concentration of 1×10⁵ CFU mL−1 were prepared by inoculating them in sterile Mueller Hinton broth medium. Then, according to DLC, CLN@ZIF-8, ZIF-8, and CLN solutions were prepared. Erlenmeyer flasks containing the solutions were incubated at 37 °C at 100 rpm. The solutions were sampled at 30 min, 6 h, and 24 h and cultured on plates containing sterile trypticase soy agar medium, and the plates were incubated at 37 °C for 24 h. The results were recorded as the percentage reduction in viable colonies.
3. Results and discussion
The synthesis of CLN@ZIF-8, which was accompanied by in situ entrapment of CLN into ZIF-8, was performed according to Fig. 1. In this regard, 4 entries were tested with the aim of achieving an optimal state between the DLC and DLE indicators (Table 1). In entry 1, 0.025 g of CLN along with the other conditions mentioned in Table 1 led to a DLC = 4.71% and DLE = 57.69%. Increasing the amount of the drug to 0.125 g and reducing the mixing time to 5 min gave a DLC = 31.77% and DLE = 48.92%. DLC = 32.19% and DLE = 30.48% were obtained in entry 3 by doubling the amount of CLN and reducing the mixing time to 1.5 min. The values obtained for the two indicators indicate that doubling the drug amount is not a desirable action. Therefore, 0.125 g of the drug was selected as the optimal amount. In entry 4, with 0.125 g of the drug and a mixing time of 1.5 min, DLC = 35.65% and DLE = 64.04% were obtained, which were optimal states. The results also showed that reducing the stirring time to 1.5 min did not have an adverse effect on performance. Triplicate testing of the last entry resulted in a final DLC = 32.58 ± 2.65% and DLE = 56.80 ± 6.68%. To confirm that the ligand does not affect the results for loading and release, different concentrations of 2-MeIm were examined using UV-vis spectrophotometer (Fig. S2 in the ESI†). It is known that the ligand has a maximum absorption at 205 nm, and its absorption range does not interfere with that of the drug.
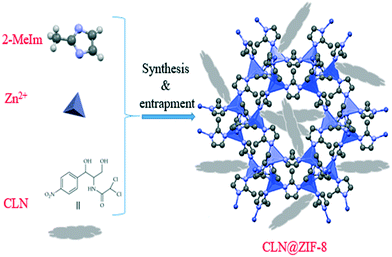 |
| | Fig. 1 Schematic of the in situ single-step synthesis method of CLN@ZIF-8. | |
Table 1 Entries and their details in the synthesis of CLN@ZIF-8
| Entry |
Zn(NO3)2·6H2O in H2O (g mL−1) |
2-MeIm in H2O (g mL−1) |
CLN in H2O (g mL−1) |
Stirring time (min) |
TEA (mL) |
DLC (%) |
DLE (%) |
| 1 |
0.4/3.5 |
0.6624/6 |
0.025/3.5 |
60 |
0.4 |
4.71 |
57.69 |
| 2 |
0.2/3.5 |
0.3312/5 |
0.125/5.5 |
5 |
0.4 |
31.77 |
48.92 |
| 3 |
0.2/3.5 |
0.3312/5 |
0.25/6 |
1.5 |
0.2 |
32.19 |
30.48 |
| 4 |
0.2/4.5 |
0.3312/5 |
0.125/5.5 |
1.5 |
0.2 |
35.65 |
64.04 |
3.1. IR spectroscopy
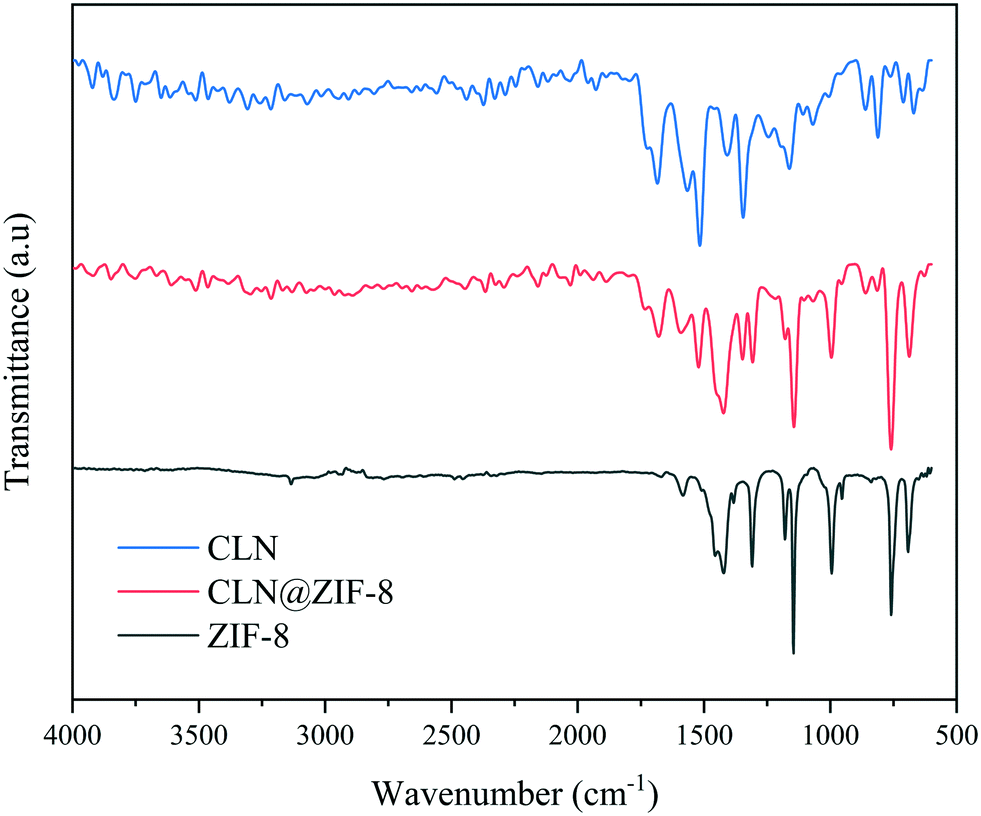
IR spectroscopy was applied to identify the presence of the drug and the type of interactions with the MOF through the characteristic absorption bands. The infrared spectra of CLN, ZIF-8 and CLN@ZIF-8 are available in Fig. 2. The CLN and ZIF-8 spectra are consistent with previously reported cases.45,55 In the CLN spectrum, the band at 1680 cm−1 is associated with the C![[double bond, length as m-dash]](https://www.rsc.org/images/entities/char_e001.gif) O bond in the amide functional group.56,57 The bands at 1518 cm−1 and 1345 cm−1 are assigned to the nitro functional group's asymmetric and symmetric stretching vibrations, respectively.45,58 Stretching vibrations specific to the CC bonds in the aromatic ring can be detected with the band at 1563 cm−1.45,56 The absorption in the 608 cm−1 region can also be attributed to C–Cl stretching.48 For ZIF-8, the bands of C–H aromatic and C–H aliphatic vibrations are observed at 3134 cm−1 and 2929 cm−1, respectively.55,59 The absorption peaks at 1585, 1419, and 1309 cm−1 belong to the CN, CC, and C–N stretching vibrations in the imidazole ring, respectively.55,59 The signals in the ranges of 940–1200 cm−1 and 650–800 cm−1 are also related to the in-plane and out-of-plane bending modes of 2-MeIm ligand, respectively.59,60 In the case of CLN@ZIF-8, the spectrum shows that bands related to CLN and ZIF-8 are present simultaneously, indicating that ZIF-8 is synthesized, and the drug is fixed. However, some shift in the CO band of the drug can be detected towards a lower wavenumber, which results from its interaction with zinc ions (CO⋯Zn) in the ZIF-8 structure.
O bond in the amide functional group.56,57 The bands at 1518 cm−1 and 1345 cm−1 are assigned to the nitro functional group's asymmetric and symmetric stretching vibrations, respectively.45,58 Stretching vibrations specific to the CC bonds in the aromatic ring can be detected with the band at 1563 cm−1.45,56 The absorption in the 608 cm−1 region can also be attributed to C–Cl stretching.48 For ZIF-8, the bands of C–H aromatic and C–H aliphatic vibrations are observed at 3134 cm−1 and 2929 cm−1, respectively.55,59 The absorption peaks at 1585, 1419, and 1309 cm−1 belong to the CN, CC, and C–N stretching vibrations in the imidazole ring, respectively.55,59 The signals in the ranges of 940–1200 cm−1 and 650–800 cm−1 are also related to the in-plane and out-of-plane bending modes of 2-MeIm ligand, respectively.59,60 In the case of CLN@ZIF-8, the spectrum shows that bands related to CLN and ZIF-8 are present simultaneously, indicating that ZIF-8 is synthesized, and the drug is fixed. However, some shift in the CO band of the drug can be detected towards a lower wavenumber, which results from its interaction with zinc ions (CO⋯Zn) in the ZIF-8 structure.
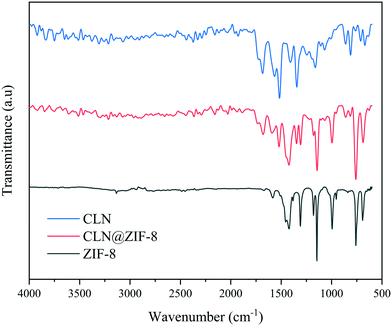 |
| | Fig. 2 Infrared spectra of CLN, ZIF-8 and CLN@ZIF-8. | |
3.2. X-ray powder diffraction (XRPD) and SEM-EDS study
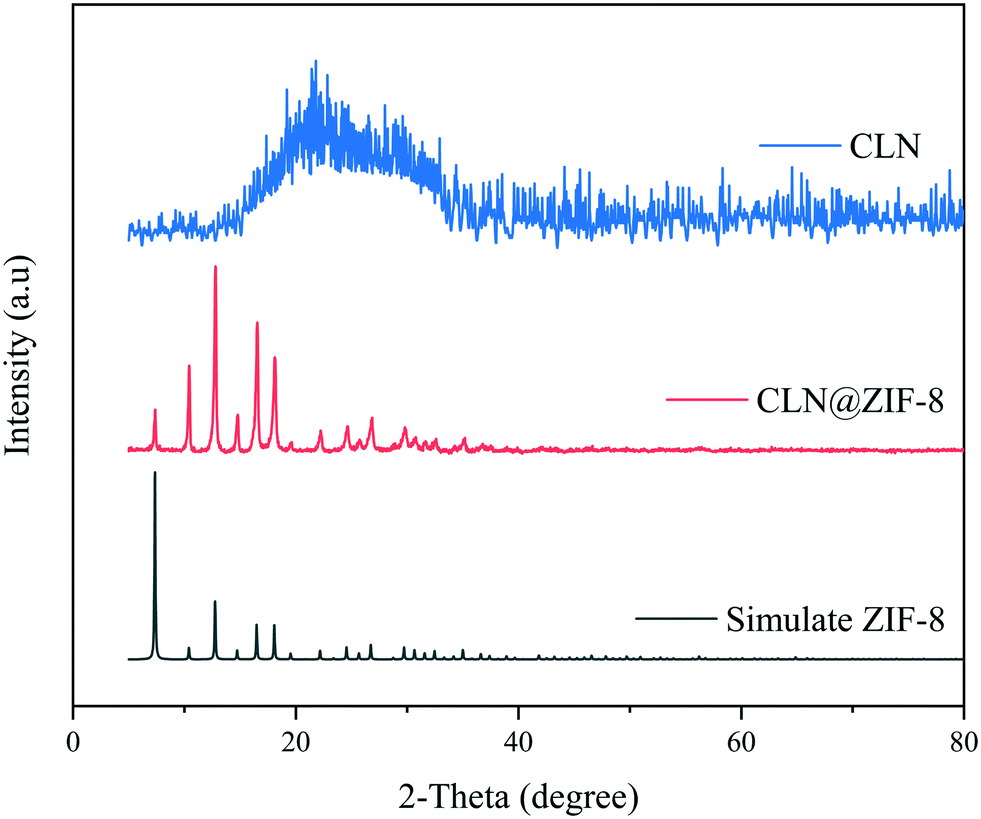
In order to confirm the formation of the ZIF-8 structure, XRPD analysis was performed. The XRPD patterns of ZIF-8, CLN and CLN@ZIF-8 are shown in Fig. 3. The position of characteristic diffraction peaks in 2-theta values of 7.3, 10.4, 12.7, 16.5, and 18.1 is in accordance with the pattern of original ZIF-8 samples.22,61 The conformance between the diffraction patterns of ZIF-8 and CLN@ZIF-8 confirms the formation of the sodalite structure of ZIF-8 in CLN@ZIF-8. The lack of a specific diffraction pattern reveals the amorphous nature of the drug. The absence of the amorphous diffraction pattern of the drug in the final pattern indicates the encapsulation of the main parts of drug molecules in the pores.32,62
 |
| | Fig. 3 XRPD patterns of ZIF-8, CLN and CLN@ZIF-8. | |
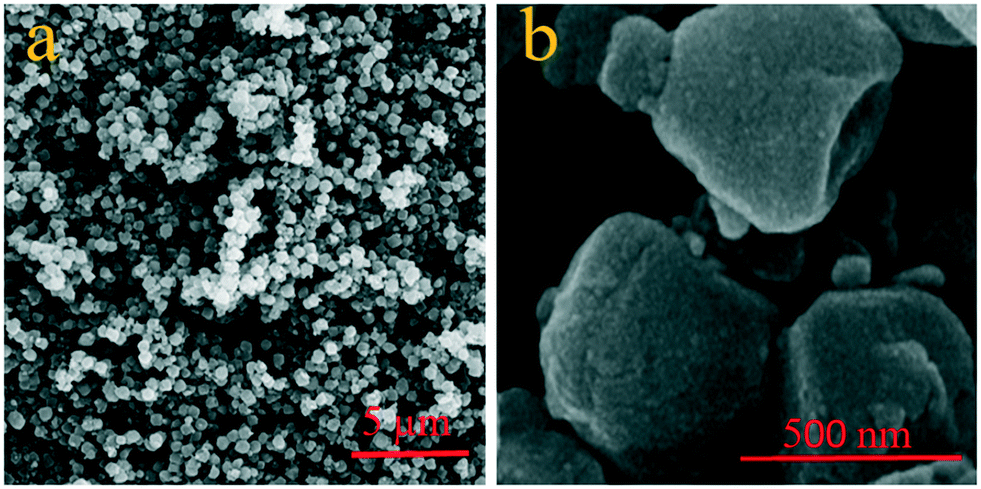
The microstructure and components of CLN@ZIF-8 were studied using SEM-EDS. As can be seen in Fig. 4, CLN@ZIF-8 has a relatively uniform composition of quasi-cubic particles with smooth edges. The synthesis method of CLN@ZIF-8 has produced particles with different morphologies compared to the conventional rhombic dodecahedra reported in other studies.63 The chemical composition of the sample was examined by EDS analysis (Fig. S3 in the ESI†). The presence of chlorine as a distinct element of the drug along with other structural elements is another confirmation of the successful loading of the drug.
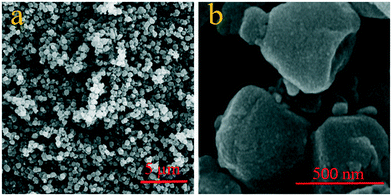 |
| | Fig. 4 SEM images of CLN@ZIF-8 in a) bulk and b) magnified form. | |
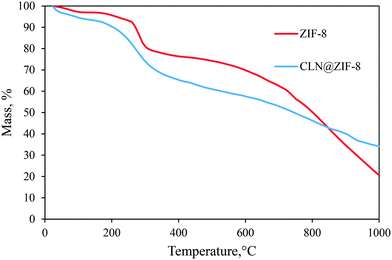
3.3. Thermal responses
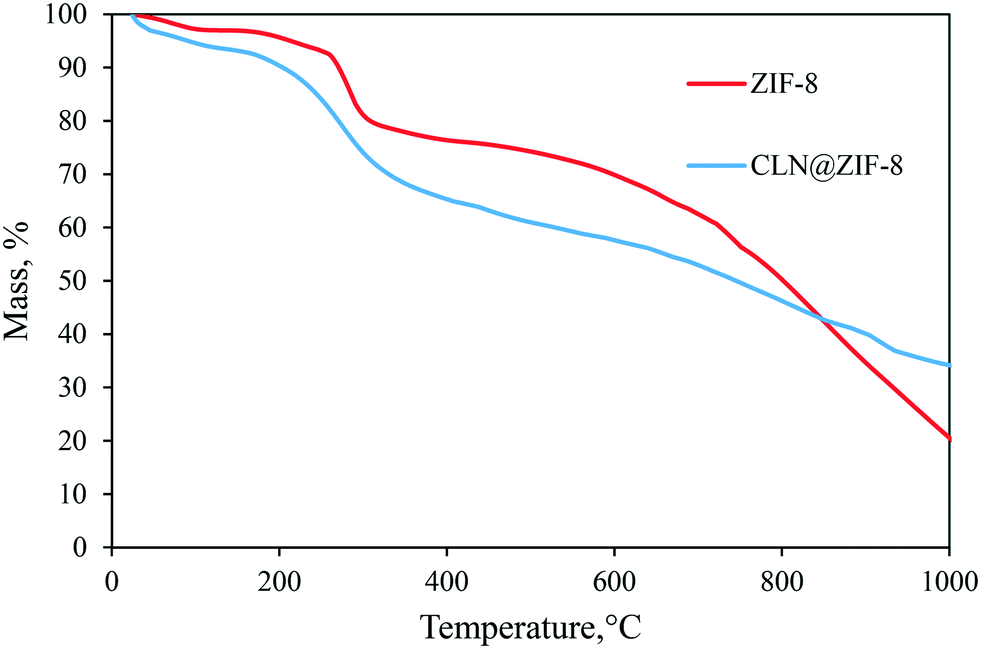
The responses of ZIF-8 and CLN@ZIF-8 to heat were investigated by the TGA technique. The thermal graphs of the samples are presented in Fig. 5. Four weight loss steps are observed for ZIF-8. In the first stage, the water content of the structure in cavities or on the surface is separated in the temperature range of 25–100 °C, and then in the second stage, the free adsorbed ligands are removed at a temperature of 175–255 °C. Immediately in the third stage, which is accompanied by a noticeable weight loss up to 300 °C, the structure is decomposed, which in the fourth stage leads to gradual carbonization to high temperatures. In CLN@ZIF-8, the presence of the drug altered the thermal response and led to the overlap of the CLN and ZIF-8 weight loss stages. The interval between the two curves also confirms the entrapment of the drug.63,64 In the CLN@ZIF-8 curve, after removal of the adsorbed molecules, the structure is disintegrated from 160 °C, which occurs at a lower temperature than the ZIF-8 disintegration. Earlier degradation arises from the melting of 2-MeIm at 145 °C and CLN at 153 °C.65 Encapsulation of some ligands with the drug occurs during rapid synthesis of ZIF-8, as previously reported.66,67 In fact, the weight loss that started at 160 °C is a combination of the drug and ligand evaporation and then the beginning of the destruction of the ZIF-8 network. The delay recorded in the melting of the drug can also be attributed to its entrapment in ZIF-8 pores, which protect the molecules from heat.68 The simultaneous presence of ligands and drugs and their gradual release, which also interfered with the destruction of the structure, has caused the boundary between the temperature stages to be not well defined, and even the amount of the loaded drug cannot be accurately obtained with this analysis.
 |
| | Fig. 5 Thermal graphs of ZIF-8, CLN and CLN@ZIF-8. | |
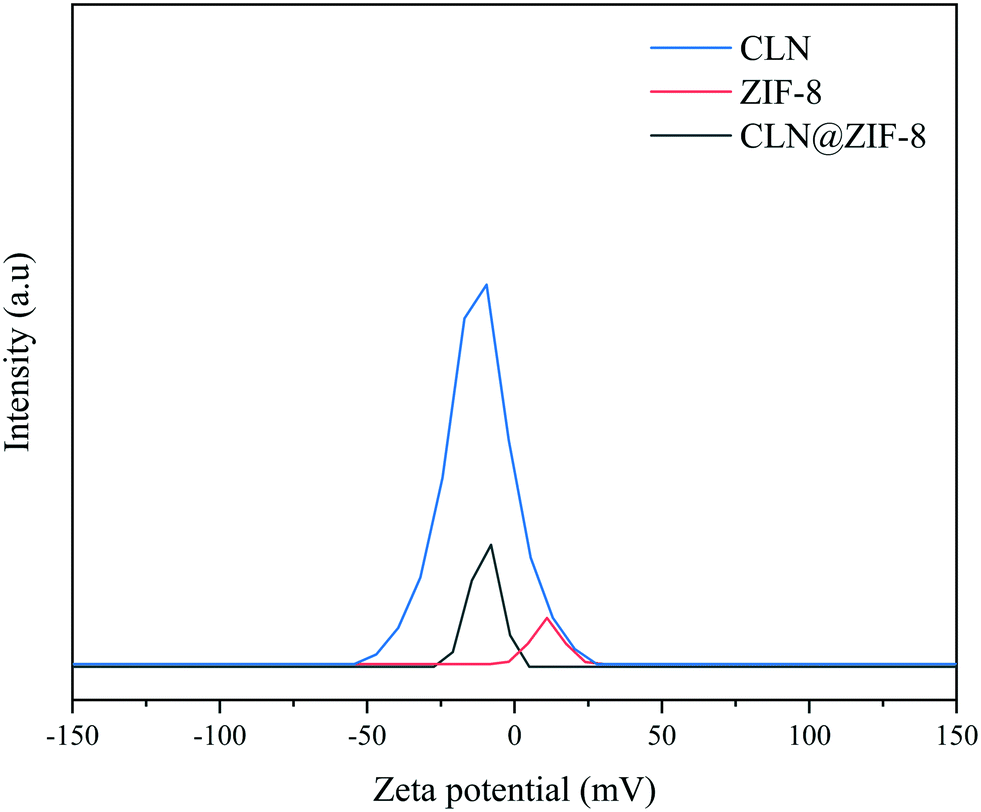
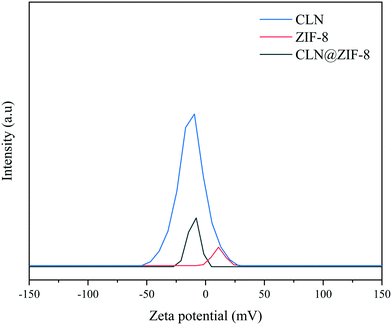
3.4. Drug location
In the first attempt to find out the location of the drug, zeta potential (ZP) analysis was performed. As demonstrated in Fig. 6, the drug-free ZIF-8 has a ZP of 11.0 mV in the positive charge range, while in the case of CLN@ZIF-8 and CLN, the values are 10.1 mV and 12.3 mV in the negative charge range, respectively. The proximity of the absolute zeta potential of these two compounds to that of ZIF-8 indicates that some of the drug molecules are adsorbed on the surface. The change in surface charge is evidence of the entrapping of drug particles in the ZIF-8 framework.69,70 According to the measurement made with Mercury software, CLN has a maximum dimension of about 7.2 Å (Fig. S4 in the ESI†), which can be easily placed in pores with a size of 11.8 Å during the synthesis of ZIF-8. The opposite charge between the drug and ZIF-8 makes them prone to electrostatic interaction.33,71 A higher intensity value of the ZP of CLN@ZIF-8 compared to that of ZIF-8 indicates its higher dispersion and better cellular uptake.33 As a complementary measure, N2 adsorption and desorption analysis was performed (Fig. S5 in the ESI†), and BET surface areas of 863 and 191 m2 g−1 and total pore volumes of 0.45 and 0.11 cm3 g−1 for ZIF-8 and CLN@ZIF-8 were obtained, respectively. The reduction in surface area and pore volume in CLN@ZIF-8 reflects the occupation of pores by drug molecules. As mentioned earlier, rapid synthesis and entrapment of some ligands result in lower values than those synthesized by the solvothermal method.61,72 However, it should be noted that the solvothermal method for the synthesis of ZIF-8 is time-consuming, requires solvents such as DMF, and is costly. By summarizing the results of the two analyses and referring to the TGA and XRPD analysis results, it can be inferred that the main part of the drug molecules are established within the ZIF-8 pores.
 |
| | Fig. 6 Zeta potentials of ZIF-8, CLN and CLN@ZIF-8. | |
3.5.
In vitro H2O2-sensitive release
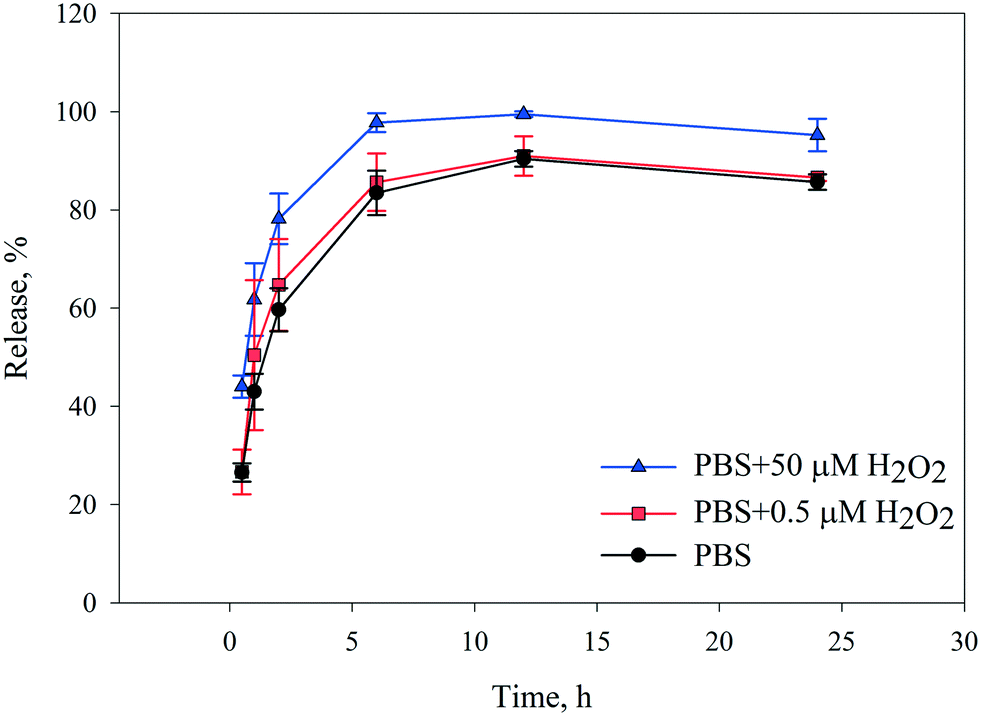
As mentioned earlier, most reported studies have evaluated stimulant-sensitive release under acidic and cancer-like conditions,32,33,62 while the specific release behavior from drug carriers in environments similar to infectious cells needs to be specifically addressed. Therefore, we first decided to monitor drug release from CLN@ZIF-8 in PBS dependent on the concentration of H2O2 under simulated conditions, with an infectious environment and a normal environment containing 50 μM and 0.5 μM H2O2, respectively. The cumulative release curves are shown in Fig. 7. As can be seen in the curves, the release is directly related to the H2O2 concentration, and with increasing concentration, the released amount increases. Regardless of the released amount, the trend of the curves is the same in all three cases. At first, the release was accompanied by a higher slope up to 6 h, and with a lower slope, the maximum release rate was reached within 12 h, which then continued with a slight decrease up to 24 h. This release behavior indicates that CLN@ZIF-8 can be considered as a system with gradual drug release for up to around 24 h. The difference between the maximum release rates in the two environments is about 10%, which indicates that the drug is released more in infected cells, but it cannot be denied that drug uptake occurs in healthy tissues and relative selectivity has occurred. It has already been reported that the type of buffer used can effectively destroy the structure.73–75 For this reason, the release of CLN@ZIF-8 in the Tris buffer was also evaluated (Fig. S6 in the ESI†). As is known, the release was still dependent on the H2O2 concentration, but it had a lower release rate compared to PBS, so at a concentration of 50 μM, 100% release was reached after 72 h. These results are consistent with the results of a previous report where more degradation occurs in PBS than in Tris buffer.75 The difference in the behavior of the two buffers arises from their contents, and in the case of ZIF-8 in PBS, it has been proven that phosphate anions have a strong affinity for the zinc metal, ligand replacement, and the formation of zinc phosphate components.30,73,75 Therefore, it can be understood that in CLN@ZIF-8, the destruction of the structure and release of the drug were due to the simultaneous effects of PBS and H2O2, among which the role of the buffer was predominant. For H2O2, just as the protonation of a ligand in acidic media causes the collapse of MOF structures,76 the gradual degradation of the ZIF-8 structure can be due to the oxidizing properties of H2O2 molecules. The slow release of the drug indicates that the drug is entrapped and adsorbed via weak CO⋯Zn coordination bonds in CLN@ZIF-8. This result confirms the data obtained from FT-IR, XRPD, TGA and ZP analyses.
 |
| | Fig. 7 The cumulative release curves of CLN from CLN@ZIF-8 in PBS. | |
3.6. Antibacterial study
The activity of the antibacterial compounds was evaluated using viable cell count assay. In this method, the effectiveness of the compounds in contact with bacteria over time is determined from the reduction in the number of viable cells of bacteria. Images of the plates showing the viable colonies (Fig. S7 in the ESI†) and the results are summarized in Table 2. It is obvious that all the compounds have bactericidal potential, and their effectiveness increases with time, so most of the antibacterial activity has occurred in 6 h. The antibacterial function is consistent with the drug release curve in which a significant amount of the drug is released within 6 h and is either maintained or improved for up to 24 h. For CLN@ZIF-8, colony reductions of 99% and 40% for E. coli and S. aureus occurred in 30 min, respectively, and within 6 h, the percentage of reduction for both bacteria reached more than 99.9%. This indicates that CLN@ZIF-8 has favorable antibacterial activity in a short time. It is important to note that CLN@ZIF-8 has always been more potent than both CLN and ZIF-8 agents, especially in the early hours. In fact, the simultaneous presence of CLN and ZIF-8 has led to synergistic power in CLN@ZIF-8. The process of reducing the number of colonies indicates that the drug has little activity in 30 min, even less than that for ZIF-8, but over time and upon controlled release, CLN has helped to improve the antibacterial activity. ZIF-8's antibacterial activity is also noteworthy, and perhaps the effect seen in CLN@ZIF-8 in the early hours can be attributed to it. ZIF-8's antibacterial activity has also been reported in a previous report.77 Continuity in ZIF-8 antibacterial activity indicates its significant contribution to the obtained results at all times.
Table 2 Percentage of viable cells of S. aureus and E. coli over time
| Sample |
Reduction of S. aureus (%) |
| 30 min |
6 h |
24 h |
| ZIF-8 |
∼40 |
90 |
95 |
| CLN |
10 |
>99 |
>99 |
| CLN@ZIF-8 |
∼40 |
>99.9 |
>99.9 |
| Blank |
0 |
0 |
0 |
| Sample |
Reduction of E. coli (%) |
| 30 min |
6 h |
24 h |
| ZIF-8 |
10 |
90 |
>99.9 |
| CLN |
20 |
>99 |
>99 |
| CLN@ZIF-8 |
99 |
>99.9 |
>99.9 |
| Blank |
0 |
0 |
0 |
4. Conclusion
In this work, single-step synthesis of CLN@ZIF-8 was performed using chloramphenicol trapping during ZIF-8 synthesis. The characterization techniques such as FT-IR, XPRD, EDS, TGA, ZP analysis and N2 adsorption and desorption confirmed the successful synthesis and encapsulation of the drug in the pores of the ZIF-8 framework. Measurements by UV-vis spectrophotometry showed significant DLC and DLE values of 32.58 ± 2.65% and 56.80 ± 6.68%, respectively. Cumulative drug release was investigated in H2O2-containing phosphate buffer and Tris buffer. It was found that CLN@ZIF-8 had a relatively selective release under conditions similar to infectious environments with high concentrations of H2O2 (50 μM), which was controlled and gradual. However, phosphate groups caused PBS to have a dominant effect on the degradation and release of the drug. Evaluation of antibacterial activity by viable cell count method revealed that CLN@ZIF-8 has a greater effect compared to CLN and ZIF-8, and in a short time within 6 h, can neutralize both Gram-negative and Gram-positive bacteria. According to the results, it can be concluded that in CLN@ZIF-8, ZIF-8 is able to be a suitable carrier for CLN, which improved the release and access to the drug and resulted in a more favorable antibacterial activity.
Author contributions
Sajjad Soltani: conceptualization, methodology, software, investigation, writing – original draft, and visualization. Kamran Akhbari: validation, resources, data curation, writing – review & editing, supervision, project administration, and funding acquisition.
Conflicts of interest
The authors confirm that there are no conflicts to declare.
Acknowledgements
The authors appreciate the University of Tehran and the financial support provided for this work under Grant No. 01/1/389845.
References
- J. Yao, P. Li, L. Li and M. Yang, Acta Biomater., 2018, 74, 36–55 CrossRef CAS PubMed.
- G. R. Rudramurthy and M. K. Swamy, JBIC, J. Biol. Inorg. Chem., 2018, 23, 1185–1204 CrossRef CAS PubMed.
- I. Cacciatore, M. Ciulla, E. Fornasari, L. Marinelli and A. Di Stefano, Expert Opin. Drug Delivery, 2016, 13, 1121–1131 CrossRef CAS PubMed.
- S. Senapati, A. K. Mahanta, S. Kumar and P. Maiti, Signal Transduction Targeted Ther., 2018, 3, 1–19 CrossRef CAS PubMed.
- A. R. Bilia, V. Piazzini, L. Risaliti, G. Vanti, M. Casamonti, M. Wang and M. C. Bergonzi, Curr. Med. Chem., 2019, 26, 4631–4656 CrossRef CAS PubMed.
- H. Zhang, T. Fan, W. Chen, Y. Li and B. Wang, Bioact. Mater., 2020, 5, 1071–1086 CrossRef PubMed.
- S. Hossen, M. K. Hossain, M. Basher, M. Mia, M. Rahman and M. J. Uddin, J. Adv. Res., 2019, 15, 1–18 CrossRef CAS PubMed.
- R.-V. Kalaydina, K. Bajwa, B. Qorri, A. Decarlo and M. R. Szewczuk, Int. J. Nanomed., 2018, 13, 4727 CrossRef CAS PubMed.
- T. Ramasamy, H. B. Ruttala, B. Gupta, B. K. Poudel, H.-G. Choi, C. S. Yong and J. O. Kim, J. Controlled Release, 2017, 258, 226–253 CrossRef CAS PubMed.
- E.-K. Lim, B. H. Chung and S. J. Chung, Curr. Drug Targets, 2018, 19, 300–317 CrossRef CAS PubMed.
- P. Jaiswal, B. Gidwani and A. Vyas, Artif. Cells, Nanomed., Biotechnol., 2016, 44, 27–40 CrossRef CAS PubMed.
- M. Manzano and M. Vallet-Regí, Adv. Funct. Mater., 2020, 30, 1902634 CrossRef CAS.
- M. Kotzabasaki and G. E. Froudakis, Inorg. Chem. Front., 2018, 5, 1255–1272 RSC.
- M. Shyngys, J. Ren, X. Liang, J. Miao, A. Blocki and S. Beyer, Front. Bioeng. Biotechnol., 2021, 9, 96 CrossRef PubMed.
- H. Yu, M. Fan, Q. Liu, Z. Su, X. Li, Q. Pan and X. Hu, Inorg. Chem., 2020, 59, 2005–2010 CrossRef CAS PubMed.
- E. Mirzadeh and K. Akhbari, CrystEngComm, 2016, 18, 7410–7424 RSC.
- S. Soltani, K. Akhbari and A. Phuruangrat, J. Mol. Struct., 2020, 129261 Search PubMed.
- J.-C. Tan and B. Civalleri, CrystEngComm, 2015, 17, 197–198 RSC.
- I. Thomas-Hillman, A. Laybourn, C. Dodds and S. W. Kingman, J. Mater. Chem. A, 2018, 6, 11564–11581 RSC.
- P. Horcajada, C. Serre, M. Vallet-Regí, M. Sebban, F. Taulelle and G. Férey, Am. Ethnol., 2006, 118, 6120–6124 Search PubMed.
- L. Wang, M. Zheng and Z. Xie, J. Mater. Chem. B, 2018, 6, 707–717 RSC.
- X. C. Huang, Y. Y. Lin, J. P. Zhang and X. M. Chen, Angew. Chem., Int. Ed., 2006, 45, 1557–1559 CrossRef CAS PubMed.
- Y.-T. Qin, H. Peng, X.-W. He, W.-Y. Li and Y.-K. Zhang, ACS Appl. Mater. Interfaces, 2019, 11, 34268–34281 CrossRef CAS PubMed.
- Y. Li, L. H. Wee, A. Volodin, J. A. Martens and I. F. Vankelecom, Chem. Commun., 2015, 51, 918–920 RSC.
- Y. Liu, R. Wang, T. Zhang, S. Liu and T. Fei, J. Colloid Interface Sci., 2019, 541, 249–257 CrossRef CAS PubMed.
- R. Ricco, P. Wied, B. Nidetzky, H. Amenitsch and P. Falcaro, Chem. Commun., 2020, 56, 5775–5778 RSC.
- G. Liu, Y. Xu, Y. Han, J. Wu, J. Xu, H. Meng and X. Zhang, Dalton Trans., 2017, 46, 2114–2121 RSC.
- Y. Hu, H. Zhou, L. Dai, D. Liu, S. Al-Zuhair and W. Du, ACS Omega, 2021, 6, 2143–2148 CrossRef CAS PubMed.
- M.-R. Song, D.-Y. Li, F.-Y. Nian, J.-P. Xue and J.-J. Chen, J. Mater. Sci., 2018, 53, 2351–2361 CrossRef CAS.
- M. d. J. Velásquez-Hernández, M. Linares-Moreau, E. Astria, F. Carraro, M. Z. Alyami, N. M. Khashab, C. J. Sumby, C. J. Doonan and P. Falcaro, Coord. Chem. Rev., 2021, 429, 213651 CrossRef.
- A. Karimi, V. Vatanpour, A. Khataee and M. Safarpour, J. Ind. Eng. Chem., 2019, 73, 95–105 CrossRef CAS.
- H. Zheng, Y. Zhang, L. Liu, W. Wan, P. Guo, A. M. Nyström and X. Zou, J. Am. Chem. Soc., 2016, 138, 962–968 CrossRef CAS PubMed.
- L. Shi, J. Wu, X. Qiao, Y. Ha, Y. Li, C. Peng and R. Wu, ACS Biomater. Sci. Eng., 2020, 6, 4595–4603 CrossRef CAS PubMed.
- S. R. Venna, J. B. Jasinski and M. A. Carreon, J. Am. Chem. Soc., 2010, 132, 18030–18033 CrossRef CAS PubMed.
- M. Hoop, C. F. Walde, R. Riccò, F. Mushtaq, A. Terzopoulou, X.-Z. Chen, A. J. deMello, C. J. Doonan, P. Falcaro and B. J. Nelson, Appl. Mater. Today, 2018, 11, 13–21 CrossRef.
- Y. Li, Y. Zheng, X. Lai, Y. Chu and Y. Chen, RSC Adv., 2018, 8, 23623–23628 RSC.
- M. Nie, Y. Yang, Z. Zhang, C. Yan, X. Wang, H. Li and W. Dong, Chem. Eng. J., 2014, 246, 373–382 CrossRef CAS.
- S. Xia, Z. Gu, Z. Zhang, J. Zhang and S. W. Hermanowicz, Chem. Eng. J., 2014, 257, 98–104 CrossRef CAS.
- G. Michailidou, E. Christodoulou, S. Nanaki, P. Barmpalexis, E. Karavas, S. Vergkizi-Nikolakaki and D. N. Bikiaris, Carbohydr. Polym., 2019, 208, 1–13 CrossRef CAS PubMed.
- S. N. Nurbaeti, J. Brillault, F. Tewes and J.-C. Olivier, Eur. J. Pharm. Sci., 2019, 138, 105028 CrossRef CAS PubMed.
- K. K. Halder, B. Mandal, M. C. Debnath, H. Bera, L. K. Ghosh and B. K. Gupta, J. Drug Targeting, 2008, 16, 311–320 CrossRef CAS PubMed.
- D. A. Kuznetsova, D. R. Gabdrakhmanov, G. A. Gaynanova, L. A. Vasileva, D. M. Kuznetsov, S. S. Lukashenko, A. D. Voloshina, A. S. Sapunova, I. R. Nizameev and G. V. Sibgatullina, Colloids Surf., A, 2021, 610, 125673 CrossRef CAS.
- L. Chen and B. Li, Food Chem., 2013, 141, 23–28 CrossRef CAS PubMed.
- M. Rivas, M. Pelechà, L. Franco, P. Turon, C. Alemán, L. J. Del Valle and J. Puiggalí, Int. J. Mol. Sci., 2019, 20, 5056 CrossRef CAS PubMed.
- F. A. Al-Khodir and M. S. Refat, J. Mol. Struct., 2016, 1119, 157–166 CrossRef CAS.
- T. M. Albayati, I. K. Salih and H. F. Alazzawi, Heliyon, 2019, 5, e02539 CrossRef PubMed.
- G. T. Tihan, C. Ungureanu, R. C. Barbaresso, R. G. Zgârian, I. Rău, A. Meghea, M. G. Albu and M. V. Ghica, C. R. Chim., 2015, 18, 986–992 CrossRef.
- A. A. Nada, A. S. Montaser, R. A. A. Azeem and M. M. Mounier, Fibers Polym., 2016, 17, 1985–1994 CrossRef CAS.
- Y. Miao, X. Zhao, Y. Qiu, Z. Liu, W. Yang and X. Jia, ACS Appl. Bio Mater., 2019, 2, 895–905 CrossRef CAS PubMed.
- D. Chen, G. Zhang, R. Li, M. Guan, X. Wang, T. Zou, Y. Zhang, C. Wang, C. Shu and H. Hong, J. Am. Chem. Soc., 2018, 140, 7373–7376 CrossRef CAS PubMed.
- H. Cheng, J. Y. Zhu, S. Y. Li, J. Y. Zeng, Q. Lei, K. W. Chen, C. Zhang and X. Z. Zhang, Adv. Funct. Mater., 2016, 26, 7847–7860 CrossRef CAS.
- D. Mao, F. Hu, S. Ji, W. Wu, D. Ding, D. Kong and B. Liu, Adv. Mater., 2018, 30, 1706831 CrossRef PubMed.
- R. Weinstain, E. N. Savariar, C. N. Felsen and R. Y. Tsien, J. Am. Chem. Soc., 2014, 136, 874–877 CrossRef CAS PubMed.
- S. Soltani, K. Akhbari and J. White, CrystEngComm, 2021, 23, 7450–7461 RSC.
- N. A. H. M. Nordin, S. M. Racha, T. Matsuura, N. Misdan, N. A. A. Sani, A. F. Ismail and A. Mustafa, RSC Adv., 2015, 5, 43110–43120 RSC.
- Z. M. Idris, B. Hameed, L. Ye, S. Hajizadeh, B. Mattiasson and A. M. Din, J. Environ. Chem. Eng., 2020, 8, 103981 CrossRef.
- V. Aiassa, A. Zoppi, I. Albesa and M. R. Longhi, Carbohydr. Polym., 2015, 121, 320–327 CrossRef CAS PubMed.
- X. Zhao, H. Zhao, W. Dai, Y. Wei, Y. Wang, Y. Zhang, L. Zhi, H. Huang and Z. Gao, J. Colloid Interface Sci., 2018, 526, 28–34 CrossRef CAS PubMed.
- S. Tanaka and R. Miyashita, ACS Omega, 2017, 2, 6437–6445 CrossRef CAS PubMed.
- E. Binaeian, S. Maleki, N. Motaghedi and M. Arjmandi, Sep. Sci. Technol., 2020, 55, 2713–2728 CrossRef CAS.
- K. S. Park, Z. Ni, A. P. Côté, J. Y. Choi, R. Huang, F. J. Uribe-Romo, H. K. Chae, M. O'Keeffe and O. M. Yaghi, Proc. Natl. Acad. Sci. U. S. A., 2006, 103, 10186–10191 CrossRef CAS PubMed.
- H. Nabipour, M. Hossaini Sadr and G. Rezanejade Bardajee, J. Coord. Chem., 2017, 70, 2771–2784 CrossRef CAS.
- D. Bagchi, A. Bhattacharya, T. Dutta, S. Nag, D. Wulferding, P. Lemmens and S. K. Pal, ACS Appl. Bio Mater., 2019, 2, 1772–1780 CrossRef CAS PubMed.
- D. Luo, C. Wang, Y. Tong, C. Liu, Y. Xiao, Z. Zhu, D. Liu and Y. Wang, RSC Adv., 2020, 10, 7360–7367 RSC.
- A. Karava, M. Lazaridou, S. Nanaki, G. Michailidou, E. Christodoulou, M. Kostoglou, H. Iatrou and D. N. Bikiaris, Pharmaceutics, 2020, 12, 594 CrossRef CAS PubMed.
- J. Cravillon, S. Münzer, S.-J. Lohmeier, A. Feldhoff, K. Huber and M. Wiebcke, Chem. Mater., 2009, 21, 1410–1412 CrossRef CAS.
- N. Nordin, A. Ismail, A. Mustafa, P. Goh, D. Rana and T. Matsuura, RSC Adv., 2014, 4, 33292–33300 RSC.
- P. D. Patil and G. D. Yadav, ChemistrySelect, 2018, 3, 4669–4675 CrossRef CAS.
- S. Soltani and K. Akhbari, JBIC, J. Biol. Inorg. Chem., 2021, 1–7 Search PubMed.
- J. Zhuang, C.-H. Kuo, L.-Y. Chou, D.-Y. Liu, E. Weerapana and C.-K. Tsung, ACS Nano, 2014, 8, 2812–2819 CrossRef CAS PubMed.
- W. Liang, R. Ricco, N. K. Maddigan, R. P. Dickinson, H. Xu, Q. Li, C. J. Sumby, S. G. Bell, P. Falcaro and C. J. Doonan, Chem. Mater., 2018, 30, 1069–1077 CrossRef CAS.
- S. B. Novaković, G. A. Bogdanović, C. Heering, G. Makhloufi, D. Francuski and C. Janiak, Inorg. Chem., 2015, 54, 2660–2670 CrossRef PubMed.
- M. d. J. Velásquez-Hernández, R. Ricco, F. Carraro, F. T. Limpoco, M. Linares-Moreau, E. Leitner, H. Wiltsche, J. Rattenberger, H. Schröttner and P. Frühwirt, CrystEngComm, 2019, 21, 4538–4544 RSC.
- M. A. Luzuriaga, C. E. Benjamin, M. W. Gaertner, H. Lee, F. C. Herbert, S. Mallick and J. J. Gassensmith, Supramol. Chem., 2019, 31, 485–490 CrossRef CAS PubMed.
- N. K. Maddigan, O. M. Linder-Patton, P. Falcaro, C. J. Sumby, S. G. Bell and C. J. Doonan, ACS Appl. Mater. Interfaces, 2021, 13, 51867–51875 CrossRef CAS PubMed.
- R. Karimi Alavijeh and K. Akhbari, Inorg. Chem., 2020, 59, 3570–3578 CrossRef CAS PubMed.
- J. Abdi, Colloids Surf., A, 2020, 604, 125330 CrossRef CAS.
Footnote |
| † Electronic supplementary information (ESI) available. See DOI: 10.1039/d1ce01593a |
|
| This journal is © The Royal Society of Chemistry 2022 |
Click here to see how this site uses Cookies. View our privacy policy here. 
 and
Kamran
Akhbari
and
Kamran
Akhbari