The effects of cis and trans butenedioic acid on the physicochemical behavior of lumefantrine†
Devendrasingh
Tomar
a,
Anurag
Lodagekar
a,
Anilkumar
Gunnam
 b,
Suryanarayana
Allu
 b,
Rahul B.
Chavan
a,
Minakshi
Tharkar
 c,
T. G.
Ajithkumar
c,
Ashwini K.
Nangia
c,
T. G.
Ajithkumar
c,
Ashwini K.
Nangia
 *bc and
Nalini R.
Shastri
 *a
*a
aSolid-State Pharmaceutical Research Group (SSPRG), Department of Pharmaceutics, National Institute of Pharmaceutical Education and Research (NIPER), Hyderabad, 500 037, India. E-mail: nalini.niperhyd@gmail.com; Fax: +91 040 23073751; Tel: +91 040 23423749
bSchool of Chemistry, University of Hyderabad, Prof. C. R. Rao Road, Gachibowli Central University P.O., Hyderabad 500 046, India. E-mail: ashwini.nangia@gmail.com
cCSIR-National Chemical Laboratory, Dr. Homi Bhabha Road, Pune 411 008, India
First published on 9th November 2021
Abstract
The present work investigates the effects of cis and trans butenedioic acid isomers (maleic acid and fumaric acid) on the crystallinity and pharmaceutical behavior of lumefantrine. Differential scanning calorimetry (DSC), powder X-ray diffraction (PXRD), attenuated total reflectance infrared spectroscopy (ATR-IR), solid-state nuclear magnetic resonance spectroscopy (ss-NMR), and single-crystal X-ray diffraction (SC-XRD) studies were employed. Lumefantrine–fumaric acid crystallized as a salt in the monoclinic space group P21/c. In comparison, DSC and PXRD showed the formation of a co-amorphous solid with maleic acid. Complete proton transfer with a strong ionic interaction led to crystalline salt formation with the trans isomer, whereas weaker/fewer hydrogen bonds with the cis isomer of butenedioic acid led to a co-amorphous salt. The in vitro dissolution of both salts resulted in a similar 2.6–2.7-fold improvement in dissolution rate when compared to that of the crystalline lumefantrine. The crystalline and co-amorphous salts were stable under accelerated stability conditions (40 ± 2 °C and 75 ± 5% RH) for one month.
Introduction
Dicarboxylic acids have been widely used to modify the physicochemical properties of poorly water-soluble drugs1 due to their different physicochemical and structural properties which makes them ideal conformers to alter the physicochemical properties of Biopharmaceutical Classification System (BCS) class II and IV drugs.2,3 This is mainly due to their ability to form hetero or homo synthons with the pyridine moiety or heteroatoms such as the nitrogen of the heterocyclic ring of drugs favoring an orientation towards the acid group and yielding cocrystals, salts and co-amorphous systems with superior pharmaceutical attributes than the individual drugs.2,4,5 Fumaric acid and maleic acid are the trans and cis isomers of butenedioic acid, respectively, and are abundantly found in nature.6 Hereafter, trans and cis butenedioic acid terminology will be replaced by fumaric acid and maleic acid, respectively, in this paper. Fumaric acid and maleic acid have different physical and structural properties such as melting point (296 °C and 142 °C), solubility (0.0042 mg mL−1 and 789 mg mL−1), polarity (dipole moment values of 0 D and 7.22 D) and rigidity/flexibility, respectively. The broad difference in their physical and chemical properties for two simple diacid isomers is noteworthy. They have been studied to improve the solubility of different categories of drugs by forming salts, cocrystals and co-amorphous systems.2,6–8 However, the impact of trans and cis isomers on differences in crystallization and physicochemical behavior of a poorly water-soluble drug has not been reported.Lumefantrine is a BCS class IV drug with poor aqueous solubility and permeability (aqueous solubility of lumefantrine 0.012 μg mL−1 and logP values 8.34) which limit its bioavailability, hence this was selected as a model drug to modify its physicochemical properties.9 Various formulation approaches such as a wet milling technique,10 amorphous solid dispersion,11 self-nano emulsifying drug delivery systems12 and solid lipid nanoparticles13 have been tested in an attempt to improve the poor solubility, dissolution rate and bioavailability of lumefantrine. These techniques however are prone to certain limitations.14–18 Amorphous solid dispersions (ASDs) of lumefantrine with enteric polymers to improve dissolution release and physical stability were recently reported by Hiew et al.19 The low melting point and high lipophilicity (logP 8.34) of lumefantrine make it a grease ball like molecule. It has been reported that ball milling of such molecules fails to improve the bioavailability because they are poorly hydrated and their solubility is solvation limited. Self-nano emulsifying drug delivery systems for lumefantrine using oleic acid and Cremophor EL have been reported.18 However, Cremophor EL is associated with side effects such as bronchospasms, hypotension, and hypersensitivity. Solid lipid nanoparticles have a low drug loading capacity because of the crystalline nature of lipids with a high probability of drug expulsion during storage. The ASDs suffer from drawbacks such as poor solubility of the drug in the polymer matrix, hygroscopicity and bulkiness of dosage form. In the past, polymeric ASD products had to be recalled by the FDA because of the previously mentioned issues associated with ASD.14–18 In 2012, Pfizer recalled its commercial troglitazone capsule (Rezulin) due to a failure to meet quality specifications.20
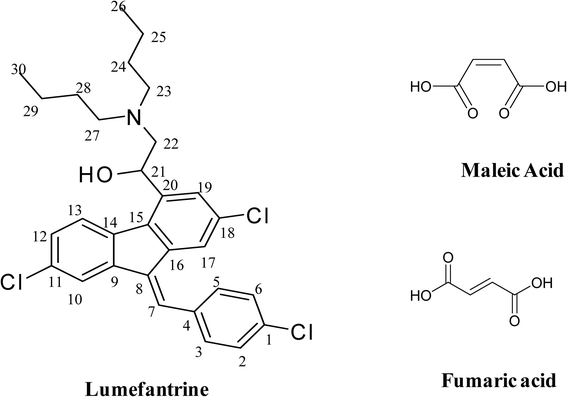
The objective of the current study was to explore the effect of isomerism within butenedioic acid while simultaneously aiming to improve the physicochemical properties of lumefantrine by generating new solid forms such as salts or cocrystals and/or co-amorphous systems. The binary forms were characterized by DSC, PXRD, ATR-IR, and ss-NMR. Moreover, the structure of a single crystal of lumefantrine–fumaric acid was elucidated using SC-XRD. The solid forms were evaluated for their in vitro dissolution rate in 0.1 N HCl containing 0.5% benzalkonium chloride (BKC). The effect of fumaric acid and maleic acid isomers on lumefantrine resulting in a salt and a co-amorphous solid, respectively, is reported. The chemical structures of lumefantrine, fumaric acid and maleic acid are shown in Fig. 1.
Materials and methods
Materials
The lumefantrine was kindly gifted by Mangalam Drugs & Organics Ltd. (Mumbai, India). Fumaric acid and maleic acid were purchased from Alfa Aesar, India and Avra Synthesis, India. Benzalkonium chloride (50% aqueous solution) was purchased from Merck Life Science (Mumbai, India). All other solvents and chemicals were of analytical grade. In house generated double distilled water was used throughout the study.Methodology
The preliminary screening was performed using a solvent evaporation method. It was reported previously, that small molecules (amino acids, organic acids and nutraceuticals) are good conformers for cocrystallization, salt formation and co-amorphization of crystalline compounds.21,22 Hence, screening was performed with several conformers such as gallic acid, vanillin, vanillic acid, alanine, aspartic acid, malic acid, benzoic acid, citric acid, para-hydroxylbenzoic acid, fumaric acid and maleic acid, with acetone as a solvent (Table S1, ESI†). The feasibility of the formation of novel complex/cocrystal/salt/co-amorphous solids of lumefantrine was determined by polarized light microscopy for the birefringence and changes in melting point. The screening study suggested that fumaric acid and maleic acid were able to form stable, harvestable novel solid systems with lumefantrine (Table S1, ESI†).Solution crystallization
Samples equivalent to 1057.8 mg of lumefantrine and 116.07 mg of fumaric acid giving a 2![[thin space (1/6-em)]](https://www.rsc.org/images/entities/char_2009.gif) :
:![[thin space (1/6-em)]](https://www.rsc.org/images/entities/char_2009.gif) 1 molar ratio were transferred to a beaker containing 40 mL of acetone and then covered with aluminum foil. The beaker was kept on a hot plate at 45 °C for 20 min to obtain a clear solution. Next, the clear solution was filtered, and the filtered portion was poured into a conical flask. The conical flask was covered with aluminum foil and kept for slow evaporation at room temperature. After 72 h, the crystals were collected and stored in airtight vials.
1 molar ratio were transferred to a beaker containing 40 mL of acetone and then covered with aluminum foil. The beaker was kept on a hot plate at 45 °C for 20 min to obtain a clear solution. Next, the clear solution was filtered, and the filtered portion was poured into a conical flask. The conical flask was covered with aluminum foil and kept for slow evaporation at room temperature. After 72 h, the crystals were collected and stored in airtight vials.
For the solution crystallization of lumefantrine (528.93 mg) with maleic acid (116.07 mg) in a 1![[thin space (1/6-em)]](https://www.rsc.org/images/entities/char_2009.gif) :
:![[thin space (1/6-em)]](https://www.rsc.org/images/entities/char_2009.gif) 1 molar ratio, the same protocol as used previously was adapted for the solvent evaporation. However, after 72 h instead of a crystalline product, a powdered sample was observed in the conical flask. The powder was collected and stored in airtight vials.
1 molar ratio, the same protocol as used previously was adapted for the solvent evaporation. However, after 72 h instead of a crystalline product, a powdered sample was observed in the conical flask. The powder was collected and stored in airtight vials.
Solid-state characterization
Differential scanning calorimetry (DSC)
The DSC curves for the samples were recorded on a Mettler Toledo DSC system equipped with STARe software. About 5–10 mg of sample was placed in a hermetically sealed aluminum pan. The DSC curves for lumefantrine, fumaric acid and its single crystals were recorded over a temperature range of 20 to 300 °C, whereas the curve for the lumefantrine–maleic acid powder sample was recorded over a temperature range of 20 to 160 °C. After melting, the sample was cooled and then reheated at 10 °C min−1 to determine the glass transition (Tg) of lumefantrine. The heating rate was maintained at 10 °C min−1 under a constant supply of nitrogen with a purging rate of 60 mL min−1.Powder X-ray diffraction (PXRD)
Diffractograms of all the samples were obtained using a D8 Advance diffractometer (Bruker AXS, Karlsruhe, Germany) using Cu-Kα X-rays (λ = 1.5406 Å) at 40 kV and 30 mA power. The data was collected over the 2θ range of 5–50°.Attenuated Total reflectance infrared (ATR-IR) spectroscopy
The ATR-IR spectra of the samples were recorded on a FT-IR spectrophotometer (PerkinElmer) over the range of 1200 to 3600 cm−1. Approximately 4 to 10 mg of the sample was directly placed on a diamond crystal. The spectrum was scanned for an average of 16 scans with a spectral resolution of 2 cm−1.Solid-state nuclear magnetic resonance (ss-NMR) spectroscopy
The 13C and 15N ss-NMR spectra were recorded on an Avance III 500 MHz spectrometer (Bruker, 13C @ 125 MHz) and Avance II 300 MHz spectrometer (Bruker, 15N @ 30.4 MHz), respectively, combined with cross-polarization-magic angle spinning (CP-MAS), and a 4 mm BL MAS probe. Approximately 500 mg of sample was packed in a 4 mm rotor and spun at a rate of 10 kHz (13C ss-NMR) or 8 kHz (15N ss-NMR) for all the experiments. The recycling time was 3 s for 13C ss-NMR spectra whereas it was 10 s, 30 s and 8 s for 15N ss-NMR spectra for lumefantrine, lumefantrine–fumaric acid 2![[thin space (1/6-em)]](https://www.rsc.org/images/entities/char_2009.gif) :
:![[thin space (1/6-em)]](https://www.rsc.org/images/entities/char_2009.gif) 1 salt, and lumefantrine–maleic acid co-amorphous form, respectively. To obtain an adequate signal-to-noise ratio, several scans of each sample were performed. All the ss-NMR experiments were conducted at room temperature.
1 salt, and lumefantrine–maleic acid co-amorphous form, respectively. To obtain an adequate signal-to-noise ratio, several scans of each sample were performed. All the ss-NMR experiments were conducted at room temperature.
Single crystal X-ray diffraction
The X-ray reflections for lumefantrine–fumaric acid 2![[thin space (1/6-em)]](https://www.rsc.org/images/entities/char_2009.gif) :
:![[thin space (1/6-em)]](https://www.rsc.org/images/entities/char_2009.gif) 1 salt were obtained by using a XtaLAB Synergy diffractometer (Rigaku) with a HyPix-3000 CCD detector (Rigaku) equipped with a graphite monochromator and Mo-Kα PhotonJet micro-focus sealed X-ray tube (λ = 0.71073 Å). The data reduction was done in CrysAlisPRO v1.171.40.35a23 (Rigaku Oxford Diffraction, 2018), and OLEX2-1.3 (ref. 24) was used to solve and refine (full matrix least squares method) the structures. PLATON24 and Mercury 2020.1 were used for visualization of the residual electron density maps and packing diagrams, respectively. All non-hydrogen atoms were refined anisotropically. Hydrogen atoms on heteroatoms were located using the difference electron density maps, and all the C–H hydrogens were fixed geometrically. Hydrogen bond geometries were determined in PLATON.
1 salt were obtained by using a XtaLAB Synergy diffractometer (Rigaku) with a HyPix-3000 CCD detector (Rigaku) equipped with a graphite monochromator and Mo-Kα PhotonJet micro-focus sealed X-ray tube (λ = 0.71073 Å). The data reduction was done in CrysAlisPRO v1.171.40.35a23 (Rigaku Oxford Diffraction, 2018), and OLEX2-1.3 (ref. 24) was used to solve and refine (full matrix least squares method) the structures. PLATON24 and Mercury 2020.1 were used for visualization of the residual electron density maps and packing diagrams, respectively. All non-hydrogen atoms were refined anisotropically. Hydrogen atoms on heteroatoms were located using the difference electron density maps, and all the C–H hydrogens were fixed geometrically. Hydrogen bond geometries were determined in PLATON.
Physicochemical evaluation
In vitro dissolution
Dissolution was performed using USP dissolution test apparatus II at 100 rpm in 0.1 N HCl containing 0.5% BKC. Approximately 120 mg of lumefantrine, amorphous lumefantrine, physical mixtures and novel forms equivalent to 120 mg of lumefantrine were placed in the dissolution bowl containing 900 mL of discrimination dissolution media maintained at 37 ± 0.5 °C. Aliquots (5 mL) were withdrawn at predetermined time intervals (5, 10, 15, 30, 45, 60, 90 and 120 min) and replaced with an equal volume of fresh dissolution medium. The collected aliquots were filtered using 0.22 μm filters, and the drug content was determined using a UV spectrophotometer at a wavelength of 335 nm. The dissolution efficiency at 15 min (% DE15), 120 min (% DE120) and similarity factor (f2) were calculated using DDsolver software25 to compare the in vitro release profile.Stability study
Samples were placed in a stability chamber (Newtronic, India) under accelerated conditions (40 ± 2 °C and 75 ± 5% RH) for one month. The samples were removed after one month and characterized by DSC and PXRD to determine any solid-state transformation, and evaluated for drug release.Results and discussion
Prior to finalizing fumaric acid and maleic acid for further studies, a series of conformers were screened to study their impact on the crystallinity of lumefantrine. Solution crystallization was used to synthesize the novel forms. The output of the screening study is shown in Table S1 (ESI†). The screened conformers and lumefantrine were dissolved in the common solvents (based on their preliminary solubility) to obtain a clear solution. The solution was subjected to slow evaporation at room temperature to give a concentrated solid sample. Solution crystallization of lumefantrine with fumaric acid and maleic acid yielded two different types of solids. Upon slow evaporation with fumaric acid, single crystals were found, whereas in the case of maleic acid, a glass-like solid mass was observed. Preliminary evaluation performed by polarized light microscopy revealed the crystalline and amorphous nature of the products (Fig. S1, ESI†).Solid-state characterization
DSC
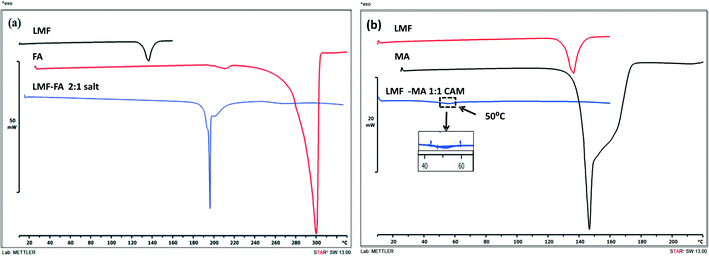
The DSC curves of lumefantrine, fumaric acid, and the lumefantrine–fumaric acid novel form are shown in Fig. 2a. Lumefantrine and fumaric acid melted at 136.07 °C and 296 °C, respectively, and this corresponding to their reported values.13,26 Crystals obtained with fumaric acid showed a single melting endotherm at 216.56 °C. This novel form showed a melting point in between that of the drug and the conformer which indicated the possibility of a cocrystal or salt formation. As per the US-FDA classification27 and the rule of 3,28,29 if the pKα difference between basic and acidic molecules, ΔpKα is >3 it leads to salt formation (because of complete transfer of a proton to give an ionic product). The ΔpKα (difference between the pKα values) of lumefantrine and fumaric acid was 4.56, which was high enough to favor strong ionic interaction and salt formation instead of formation of a neutral cocrystal (ΔpKα should be <0). However, the pKα values of a compound determined in solution were not meant to be applied to the solid state. Moreover, other factors including configuration of the molecule, crystalline environment, acidity of the compound and reaction conditions (solvent and temperature) may also affect the ionization state of the product.28,30 Hence, the ΔpKα rule should be considered only as a guide to salt/cocrystal formation and not as a rule.31The salt and cocrystal formation were further confirmed by solid state characterization techniques such as ATR-IR, PXRD, ss-NMR, and SC-XRD analysis. Crystalline lumefantrine and maleic acid gave endothermic melting events at 136.07 °C and 142.62 °C, respectively,13,32 (Fig. 2b) and amorphous lumefantrine showed a Tg event at 22.77 °C (Fig. S2, ESI†). The DSC thermograms of lumefantrine and maleic acid in 1![[thin space (1/6-em)]](https://www.rsc.org/images/entities/char_2009.gif) :
:![[thin space (1/6-em)]](https://www.rsc.org/images/entities/char_2009.gif) 1 molar ratio sample showed a Tg at 50 °C. The appearance of a single Tg confirmed the formation of a co-amorphous system. The Tg value for the co-amorphous lumefantrine–maleic acid product was significantly higher than those of the individual components and the higher Tg value indicated the possibility of intermolecular interactions between maleic acid and lumefantrine.1,33 The presence of intermolecular interactions was further confirmed by ATR-IR and ss-NMR.
1 molar ratio sample showed a Tg at 50 °C. The appearance of a single Tg confirmed the formation of a co-amorphous system. The Tg value for the co-amorphous lumefantrine–maleic acid product was significantly higher than those of the individual components and the higher Tg value indicated the possibility of intermolecular interactions between maleic acid and lumefantrine.1,33 The presence of intermolecular interactions was further confirmed by ATR-IR and ss-NMR.
PXRD
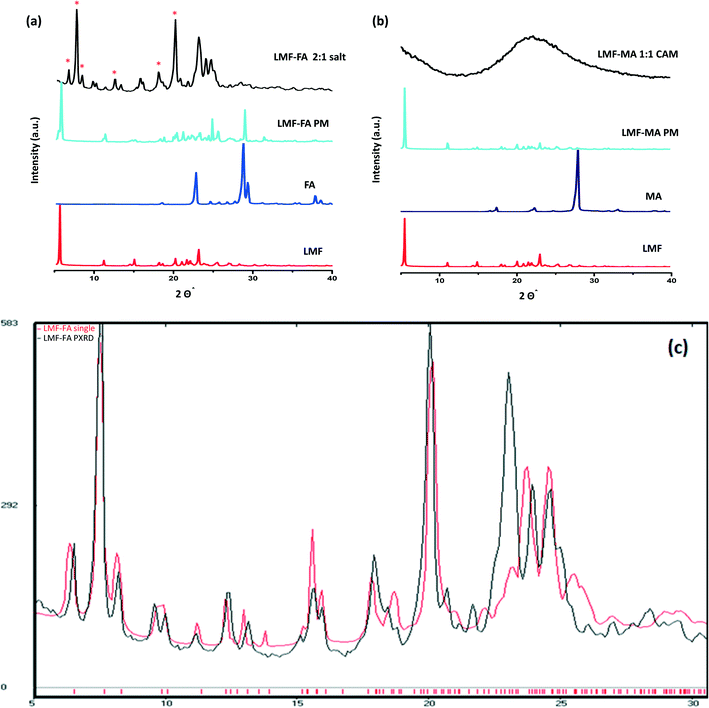
The PXRD diffractogram of the lumefantrine, fumaric acid, both the physical mixture and the salt are shown in Fig. 3a. Lumefantrine shows characteristic lines11 at 2θ = 5.54°, 11.11°, 14.96°, 20.16°, 21.95° and 23.1°. Whereas, the product obtained after solution crystallization of lumefantrine and fumaric acid showed distinct diffraction peaks at 2θ values = 6.52°, 7.56°, 8.30°, 12.40°, 13.23°, and 20.55° which were significantly different from the diffraction peaks of lumefantrine and fumaric acid. This confirmed the formation of a novel crystalline form. For lumefantrine and maleic acid in 1![[thin space (1/6-em)]](https://www.rsc.org/images/entities/char_2009.gif) :
:![[thin space (1/6-em)]](https://www.rsc.org/images/entities/char_2009.gif) 1 molar ratio, typical halo patterns were observed indicating the formation of a co-amorphous system (Fig. 3b). The co-amorphous nature was further supported by the DSC curves with a single Tg and the polarized microscopic images which showed an absence of a birefringence pattern (Fig. S1, ESI†). The calculated line pattern from the single X-ray structure of lumefantrine–fumaric acid 2
1 molar ratio, typical halo patterns were observed indicating the formation of a co-amorphous system (Fig. 3b). The co-amorphous nature was further supported by the DSC curves with a single Tg and the polarized microscopic images which showed an absence of a birefringence pattern (Fig. S1, ESI†). The calculated line pattern from the single X-ray structure of lumefantrine–fumaric acid 2![[thin space (1/6-em)]](https://www.rsc.org/images/entities/char_2009.gif) :
:![[thin space (1/6-em)]](https://www.rsc.org/images/entities/char_2009.gif) 1 salt and its PXRD overlay is given in Fig. 3c.
1 salt and its PXRD overlay is given in Fig. 3c.
ATR-IR
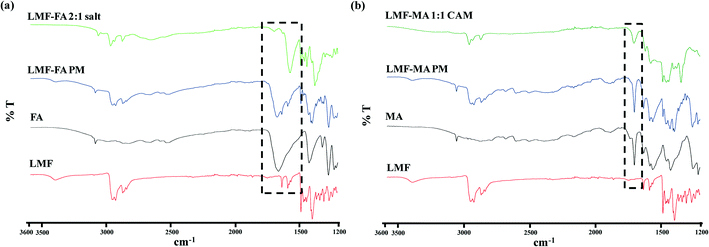
To acquire an in-depth picture of molecular interactions between the drug and conformer, ATR-IR spectroscopy was performed. The ATR spectra of lumefantrine (Fig. 4a) give characteristic peaks of O–H stretching at 3395.30 cm−1, C–H stretching at 2925.95 cm−1, C–O bending vibrations at 1084.31 cm−1, C–N stretching at 1217.24 cm−1, C–Cl stretching at 769.62 cm−1, O–H bending at 1397.61 cm−1 and 1634.14 cm−1 for the amine group.13 The IR spectra of fumaric acid (Fig. 4a) showed a characteristic sharp peak of carbonyl C![[double bond, length as m-dash]](https://www.rsc.org/images/entities/char_e001.gif) O stretching at 1660.70 cm−1. The IR spectra of lumefantrine–fumaric acid physical mixture show the diagnostic peaks of individual lumefantrine and fumaric acid. Salt formation of lumefantrine with fumaric acid can be inferred by the appearance of a peak at 1377.72 cm−1 (symmetrical C–O stretch) due to the presence of the COO– salt forming group,34 the peak shifting of amine group of lumefantrine (1634.14 to 1693.4 cm−1) and the C
O stretching at 1660.70 cm−1. The IR spectra of lumefantrine–fumaric acid physical mixture show the diagnostic peaks of individual lumefantrine and fumaric acid. Salt formation of lumefantrine with fumaric acid can be inferred by the appearance of a peak at 1377.72 cm−1 (symmetrical C–O stretch) due to the presence of the COO– salt forming group,34 the peak shifting of amine group of lumefantrine (1634.14 to 1693.4 cm−1) and the C![[double bond, length as m-dash]](https://www.rsc.org/images/entities/char_e001.gif) O stretching of fumaric acid (1660.70 to 1569 cm−1) indicating that an ionic interaction exists between lumefantrine with fumaric acid (Table S2, ESI†). Similar hydrogen bonding can be interpreted by the disappearance of the –OH stretching (3395.3 cm−1), and shifting of the C–H stretching (2925.95 to 2964.47 cm−1) of lumefantrine in salt formation, which suggests that the O–H and C–H groups of lumefantrine were involved in salt formation with the –COOH groups of fumaric acid (Table S2, ESI†).35,36
O stretching of fumaric acid (1660.70 to 1569 cm−1) indicating that an ionic interaction exists between lumefantrine with fumaric acid (Table S2, ESI†). Similar hydrogen bonding can be interpreted by the disappearance of the –OH stretching (3395.3 cm−1), and shifting of the C–H stretching (2925.95 to 2964.47 cm−1) of lumefantrine in salt formation, which suggests that the O–H and C–H groups of lumefantrine were involved in salt formation with the –COOH groups of fumaric acid (Table S2, ESI†).35,36
The IR spectra of maleic acid (Fig. 4b) showed a characteristic peak of carbonyl C![[double bond, length as m-dash]](https://www.rsc.org/images/entities/char_e001.gif) O stretching (at 1703.92 cm−1)2 and being a dicarboxylic acid, the hydroxyl group O–H formed a dimeric hydrogen bonding with the C
O stretching (at 1703.92 cm−1)2 and being a dicarboxylic acid, the hydroxyl group O–H formed a dimeric hydrogen bonding with the C![[double bond, length as m-dash]](https://www.rsc.org/images/entities/char_e001.gif) O carbonyl group (which gave a band near 2600 cm−1).2,34 The IR spectra of lumefantrine–maleic acid physical mixture showed that the peaks matched with the individual components. The ATR-IR spectra of lumefantrine–maleic acid co-amorphous system (Fig. 4b) exhibited a significant decrease in the intensity for the free carboxylic acid group with a slight shifting from 1703.92 cm−1 to 1706.00 cm−1, a shift of maleic acid, and shifting of the amine group peak of lumefantrine in the co-amorphous system at 1634.14 cm−1 to 1622.30 cm−1 (Table S2 ESI†). These observations suggest that intermolecular interactions survive between the amine group of lumefantrine and the carbonyl group of maleic acid in the co-amorphous system, indicating that the co-amorphous system may also exist in salt form. The reduction in the number of signals as well as peak broadening was attributed to the altered molecular arrangement in the co-amorphous system.37 The existence of intermolecular interaction can be inferred from the disappearance of the stretching peak of the O–H peak for dimeric hydrogen bonding with C
O carbonyl group (which gave a band near 2600 cm−1).2,34 The IR spectra of lumefantrine–maleic acid physical mixture showed that the peaks matched with the individual components. The ATR-IR spectra of lumefantrine–maleic acid co-amorphous system (Fig. 4b) exhibited a significant decrease in the intensity for the free carboxylic acid group with a slight shifting from 1703.92 cm−1 to 1706.00 cm−1, a shift of maleic acid, and shifting of the amine group peak of lumefantrine in the co-amorphous system at 1634.14 cm−1 to 1622.30 cm−1 (Table S2 ESI†). These observations suggest that intermolecular interactions survive between the amine group of lumefantrine and the carbonyl group of maleic acid in the co-amorphous system, indicating that the co-amorphous system may also exist in salt form. The reduction in the number of signals as well as peak broadening was attributed to the altered molecular arrangement in the co-amorphous system.37 The existence of intermolecular interaction can be inferred from the disappearance of the stretching peak of the O–H peak for dimeric hydrogen bonding with C![[double bond, length as m-dash]](https://www.rsc.org/images/entities/char_e001.gif) O at 3395.3 cm−1 and 2600.00 cm−1 for lumefantrine and maleic acid, respectively.37 These IR inferences were also supported by the ss-NMR results.
O at 3395.3 cm−1 and 2600.00 cm−1 for lumefantrine and maleic acid, respectively.37 These IR inferences were also supported by the ss-NMR results.
ss-NMR
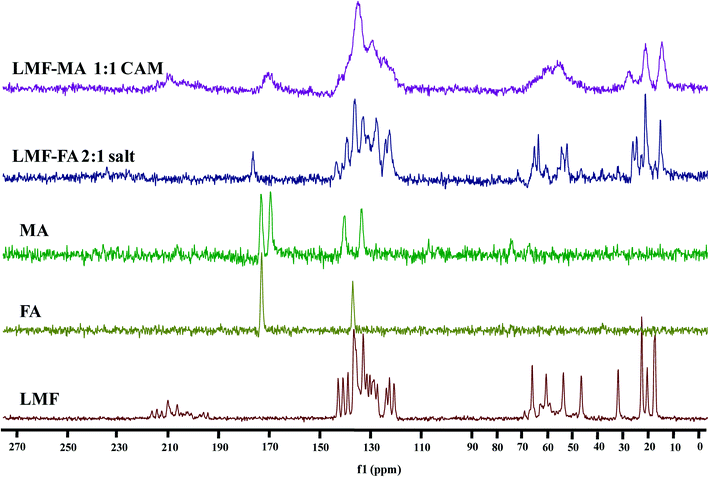
The 13C CP-MAS ss-NMR spectra were recorded (Fig. 5) to further examine the interaction of lumefantrine with fumaric acid and maleic acid which resulted in the formation of a salt and a co-amorphous system, respectively. The corresponding 13C chemical shifts are listed in Table S3 (ESI†). The chemical shift value (65.4 ppm) at C21 in lumefantrine shifted to 64.6 ppm in the salt form. The interaction of the hydroxyl group at C21 with the C![[double bond, length as m-dash]](https://www.rsc.org/images/entities/char_e001.gif) O group of the fumaric acid increased the shielding effect on the C21, thereby exhibiting an upfield shift in the salt. In the 13C CP-MAS ss-NMR spectrum peak at the position of 59.9 and 53.1 ppm for lumefantrine shifted to 60.1 and 53.3 ppm in the salt form, which indicated that an ionic bond interaction was involved in the amine group in lumefantrine due to the introduction of fumaric acid. The ionic bond formation was also reflected by 13C chemical shift in fumaric acid, which showed an obvious change from 172.6 ppm to 176.27 ppm in the salt, and this corresponded to a carboxylate group.38
O group of the fumaric acid increased the shielding effect on the C21, thereby exhibiting an upfield shift in the salt. In the 13C CP-MAS ss-NMR spectrum peak at the position of 59.9 and 53.1 ppm for lumefantrine shifted to 60.1 and 53.3 ppm in the salt form, which indicated that an ionic bond interaction was involved in the amine group in lumefantrine due to the introduction of fumaric acid. The ionic bond formation was also reflected by 13C chemical shift in fumaric acid, which showed an obvious change from 172.6 ppm to 176.27 ppm in the salt, and this corresponded to a carboxylate group.38
When compared to the salt, the broadening and merging of the NMR peaks were also observed in the co-amorphous system (Fig. 5), and this was consistent with the findings from the IR spectra. The broadening of the peak in the co-amorphous system caused the merging of two peaks at 172.7 ppm and 169.0 ppm into one peak and the peak at 170.3 ppm in the co-amorphous system was in agreement with the IR spectra which also indicates the existence of an intermolecular interaction.39
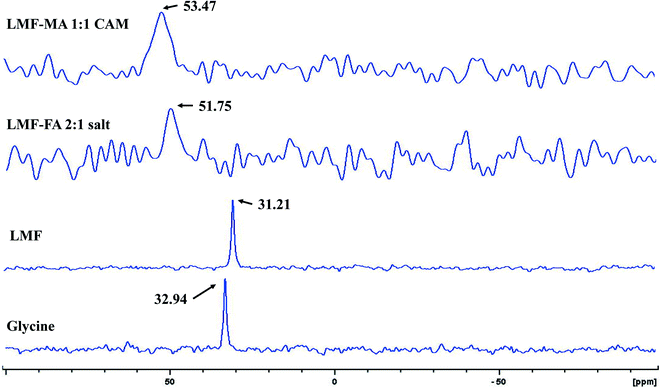
Furthermore, the salt systems of the lumefantrine–fumaric acid and lumefantrine–maleic acid were characterized by 15N ss-NMR spectroscopy (Fig. 6) with ammonium chloride as the primary reference set at 0.0 ppm, and using the amino acid, glycine (100% 15N and 13C enriched) as a secondary reference at 32.94 ppm. The neutral nitrogen in lumefantrine resonates at a chemical shift of 31.21 ppm (a similar chemical shift as that for glycine), which was shifted to 51.75 ppm and 53.47 ppm for lumefantrine–fumaric acid (2![[thin space (1/6-em)]](https://www.rsc.org/images/entities/char_2009.gif) :
:![[thin space (1/6-em)]](https://www.rsc.org/images/entities/char_2009.gif) 1), and lumefantrine–maleic acid (1
1), and lumefantrine–maleic acid (1![[thin space (1/6-em)]](https://www.rsc.org/images/entities/char_2009.gif) :
:![[thin space (1/6-em)]](https://www.rsc.org/images/entities/char_2009.gif) 1) complexes, respectively (Table S4, ESI†). The downfield shift of approximately 20 ppm clearly indicated a proton transfer from the carboxylic acid group of the conformer to the tertiary amine of lumefantrine resulting in an ammonium ion. Similar shifts were reported for the 15N ss-NMR spectra of amino acids and alkyl amines compared to their salt form.40,41
1) complexes, respectively (Table S4, ESI†). The downfield shift of approximately 20 ppm clearly indicated a proton transfer from the carboxylic acid group of the conformer to the tertiary amine of lumefantrine resulting in an ammonium ion. Similar shifts were reported for the 15N ss-NMR spectra of amino acids and alkyl amines compared to their salt form.40,41
Single crystal X-ray diffraction
Single crystals of lumefantrine–fumaric acid were obtained by slow evaporation from acetone solvent at room temperature after 3 d. The crystal structure of lumefantrine–fumaric acid was solved and refined in the monoclinic P21/c space group (CCDC deposition number 2025163) as a (1![[thin space (1/6-em)]](https://www.rsc.org/images/entities/char_2009.gif) :
:![[thin space (1/6-em)]](https://www.rsc.org/images/entities/char_2009.gif) 0.5) salt. The asymmetric unit of lumefantrine–fumaric acid with a stoichiometry of 1
0.5) salt. The asymmetric unit of lumefantrine–fumaric acid with a stoichiometry of 1![[thin space (1/6-em)]](https://www.rsc.org/images/entities/char_2009.gif) :
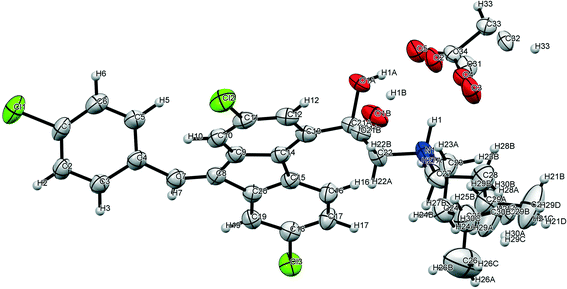
:![[thin space (1/6-em)]](https://www.rsc.org/images/entities/char_2009.gif) 0.5, and its corresponding ORTEP image with 50% thermal ellipsoidal probability is shown in Fig. 7. In the crystal structure, the lumefantrine–fumaric acid (1
0.5, and its corresponding ORTEP image with 50% thermal ellipsoidal probability is shown in Fig. 7. In the crystal structure, the lumefantrine–fumaric acid (1![[thin space (1/6-em)]](https://www.rsc.org/images/entities/char_2009.gif) :
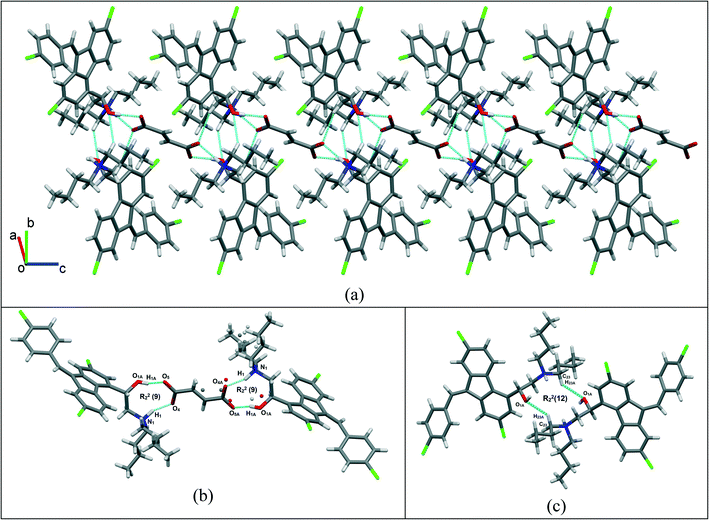
:![[thin space (1/6-em)]](https://www.rsc.org/images/entities/char_2009.gif) 0.5) salt is stabilized by O–H⋯O−, N+–H⋯O−, C–H⋯O and weak C–H⋯Cl interactions. The crystallographic packing of lumefantrine–fumaric acid salt in a 1D array is shown in Fig. 8a. Such 1D packed ionic units of lumefantrine and fumaric acid salt were connected by O–H⋯O− (O1A–H1A⋯O5A, 1.71 Å, 165°) as well as ionic N+–H⋯O− (N1–H1⋯O4A, 1.74 Å, 158°) hydrogen bonds in the R22(9) ring motif (Fig. 8b). Furthermore, these ionic salt units of LMF–FA 1
0.5) salt is stabilized by O–H⋯O−, N+–H⋯O−, C–H⋯O and weak C–H⋯Cl interactions. The crystallographic packing of lumefantrine–fumaric acid salt in a 1D array is shown in Fig. 8a. Such 1D packed ionic units of lumefantrine and fumaric acid salt were connected by O–H⋯O− (O1A–H1A⋯O5A, 1.71 Å, 165°) as well as ionic N+–H⋯O− (N1–H1⋯O4A, 1.74 Å, 158°) hydrogen bonds in the R22(9) ring motif (Fig. 8b). Furthermore, these ionic salt units of LMF–FA 1![[thin space (1/6-em)]](https://www.rsc.org/images/entities/char_2009.gif) :
:![[thin space (1/6-em)]](https://www.rsc.org/images/entities/char_2009.gif) 0.5 were connected to another such salt unit by weak homomeric C–H⋯O (C23–H23A⋯O1A, 2.37 Å, 132°) interactions of the R22(12) ring (Fig. 8c). In addition, the lumefantrine molecules were interconnected by a weak C–H⋯Cl (C17–H17⋯Cl1, 2.85 Å, 163° and C21–H21D⋯Cl2, 2.83 Å, 116°) and C–H⋯O (C19–H19⋯O5A, 2.25 Å, 170°) interactions as infinite chains (Fig. 9). Such parallel layers of lumefantrine were connected by weak π⋯π and C–H⋯π interactions between the aromatic rings (Fig. S3, ESI†). Crystallographic data and hydrogen bond parameters for lumefantrine–fumaric acid are given in Table 1 and Table S5 (ESI†), respectively.
0.5 were connected to another such salt unit by weak homomeric C–H⋯O (C23–H23A⋯O1A, 2.37 Å, 132°) interactions of the R22(12) ring (Fig. 8c). In addition, the lumefantrine molecules were interconnected by a weak C–H⋯Cl (C17–H17⋯Cl1, 2.85 Å, 163° and C21–H21D⋯Cl2, 2.83 Å, 116°) and C–H⋯O (C19–H19⋯O5A, 2.25 Å, 170°) interactions as infinite chains (Fig. 9). Such parallel layers of lumefantrine were connected by weak π⋯π and C–H⋯π interactions between the aromatic rings (Fig. S3, ESI†). Crystallographic data and hydrogen bond parameters for lumefantrine–fumaric acid are given in Table 1 and Table S5 (ESI†), respectively.
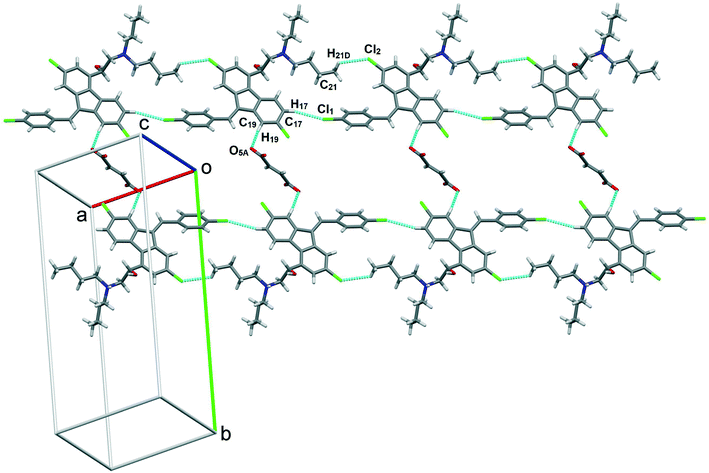 | ||
Fig. 9 Lumefantrine–fumaric acid 1![[thin space (1/6-em)]](https://www.rsc.org/images/entities/char_2009.gif) : :![[thin space (1/6-em)]](https://www.rsc.org/images/entities/char_2009.gif) 0.5 salt showing weak C–H⋯Cl interactions between lumefantrine molecules forming 1D chains connected through fumaric acid bridges via C–H⋯O interactions. 0.5 salt showing weak C–H⋯Cl interactions between lumefantrine molecules forming 1D chains connected through fumaric acid bridges via C–H⋯O interactions. | ||
![[thin space (1/6-em)]](https://www.rsc.org/images/entities/char_2009.gif) :
:![[thin space (1/6-em)]](https://www.rsc.org/images/entities/char_2009.gif) 0.5 salt
0.5 salt
| Empirical formula | C32H34Cl3NO3 |
|---|---|
| CCDC deposition number | 2025163 |
| Formula weight | 586.95 |
| Temperature (K) | 103(2) |
| Wavelength (Å) | 0.71073 |
| Crystal system | Monoclinic |
| Space group | P21/c |
| a (Å) | 11.4556(3) |
| b (Å) | 26.8887(7) |
| c (Å) | 9.5696(3) |
| α (deg) | 90 |
| β (deg) | 91.164(2) |
| γ (deg) | 90 |
| Volume (Å3) | 2947.08(14) |
| Z | 4 |
| Density (calculated) (mg m−3) | 1.323 |
| Absorption coefficient (mm−1) | 0.345 |
| F(000) | 1232.0 |
| Crystal size (mm3) | 0.2 × 0.18 × 0.16 |
| 2θ range | 2.2490 to 26.9140 |
| Range h | −14 to 14 |
| Range k | −33 to 33 |
| Range l | −11 to 11 |
| Reflections collected | 6027 |
| Observed reflections | 6001 |
| Unique reflections | 4785 |
| R 1 [I > 2σ (I)] | 0.0554 |
| wR2 (all) | 0.1392 |
| Goodness-of-fit | 1.024 |
| Parameters | 427 |
| Data completeness | 99.6% |
| Diffractometer | Rigaku XtaLAB synergy |
What makes butenedioic acid isomers behave differently?
The fumaric acid and maleic acid configuration (trans, cis) mainly change the inter-molecular interaction strength, which was attributed to the differential behavior resulting in crystalline and amorphous formation with different configurations of the same drug. Fumaric acid is a rigid and linear structure relative to maleic acid, whereas maleic acid is more flexible with a larger structure volume compared to fumaric acid.30 There is intramolecular hydrogen bonding in maleic acid which makes the diacid behave more like a mono-carboxylic acid with a high dipole moment and results in a dramatic 1.8 × 10⁵-fold increase in its aqueous solubility value compared to that of fumaric acid (0.0042 mg mL−1vs. 789 mg mL−1). The linear structure of the fumaric acid in the solid-state centrosymmetric trimer arrangement (lumefantrine–fumaric acid–lumefantrine) with lumefantrine led to close packing compared to the lumefantrine and maleic acid system.42–44 In maleic acid, because of the intramolecular hydrogen bonding, only one –COOH group was available to bond with the drug, whereas in fumaric acid both the –COOH groups were available for intermolecular hydrogen bonding. In lumefantrine–maleic acid, the dimer sub-structure was weaker than the trimer arrangement in the fumaric acid system.30,45,46 Similar observations were reported with indapamide, where strong and weak interactions resulted in cocrystal vs. co-amorphous products.42 The IR and ss-NMR spectra were consistent with strong ionic hydrogen bonds between the carboxylic acid group of fumaric acid and the amine group of lumefantrine whereas such a dramatic shift was not seen in the co-amorphous system of lumefantrine with maleic acid, thus suggesting there was a weak interaction.Evaluation
In vitro dissolution
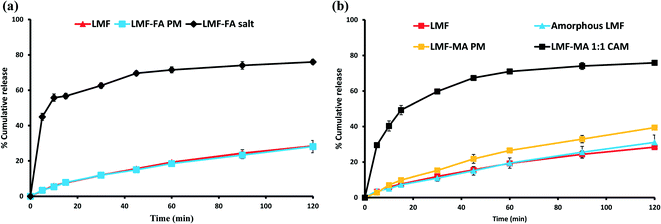
The USP Compounding Compendium suggests that the best medium to study dissolution of drugs is: 0.1 N HCl containing 1% w/v BKC solution. Therefore, the initial dissolution study was carried out in this medium. However, it was found that this medium was unable to discriminate between the release of lumefantrine from the physical mixture, salt or co-amorphous solid of lumefantrine (Fig. S4, ESI†). Hence, to clearly observe drug release, an initial equilibrium solubility study (Table S6, ESI†) of lumefantrine was conducted in 0.1 N HCl containing 0.5% or 1% w/v BKC solution. The dissolution medium containing 0.5% (w/v) BKC was able to discriminate the release of lumefantrine from the salt and the co-amorphous system. In 120 min, lumefantrine (Fig. 10a and b) and amorphous lumefantrine (Fig. 10b) showed the release of 28.39 ± 1.17% and 31.06 ± 4.14% drug release, respectively. The drug release of amorphous lumefantrine was found to be similar to that of crystalline lumefantrine (f2 value: 84.87%) (Table S7, ESI†). Amorphous lumefantrine did not show improvement in dissolution and this was attributed to poor wettability, dispersibility and also the pronounced aggregation which occurred during the dissolution.47The salt showed a higher drug release of 74.22 ± 0.88% in 120 min which was 2.61-fold more than that of crystalline lumefantrine. The rapid drug release of lumefantrine from the salt was further supported by its faster dissolution efficiency value at 15 min (% DE15) (Table S7, ESI†). The % DE15 of lumefantrine and its salt were 4.34 and 42.77, which were 9.85-fold higher than that of the crystalline lumefantrine (Fig. 10a). The release of lumefantrine from the crystalline physical mixture with fumaric acid was measured as 28.10 ± 3.4% at 120 min, a value which was similar to that of crystalline lumefantrine (f2 value 86.75).
The release of lumefantrine from the co-amorphous system was 75.84 ± 0.70% in 120 min, which was about 2.67-fold and 2.44-fold higher than that of crystalline lumefantrine and amorphous lumefantrine, respectively (Fig. 10b). The enhanced dissolution rate of lumefantrine from the co-amorphous system was further confirmed by an increased % DE15 (Table S7, ESI†) of 7.25-fold compared to that of crystalline lumefantrine. The physical mixture of lumefantrine with maleic acid showed a slight improvement (39.41 ± 0.78%). The marginal improvement of the drug release from the physical mixture of lumefantrine and maleic acid could be attributed to several possible reasons namely, intermolecular interaction between lumefantrine–maleic acid, the lower pH of the microenvironment, and the polarity of maleic acid (maleic acid is more acidic and polar than fumaric acid) in the dissolution medium.48,49
Stability study
Samples were monitored for one month under accelerated stability conditions (40 ± 2 °C and 75 ± 5% RH). The retention of the melting endotherm in the DSC curve (Fig. 11a) and the matching PXRD peaks (Fig. 11b) with the reference sample confirmed the stability of the lumefantrine–fumaric acid 2![[thin space (1/6-em)]](https://www.rsc.org/images/entities/char_2009.gif) :
:![[thin space (1/6-em)]](https://www.rsc.org/images/entities/char_2009.gif) 1 salt. The absence of the melting endotherm and a single Tg in the DSC curve (Fig. 12a) together with a halo pattern in the diffractogram (Fig. 12b) indicated that the co-amorphous form was stable during the study period of one month. Furthermore, the lumefantrine–maleic acid 1
1 salt. The absence of the melting endotherm and a single Tg in the DSC curve (Fig. 12a) together with a halo pattern in the diffractogram (Fig. 12b) indicated that the co-amorphous form was stable during the study period of one month. Furthermore, the lumefantrine–maleic acid 1![[thin space (1/6-em)]](https://www.rsc.org/images/entities/char_2009.gif) :
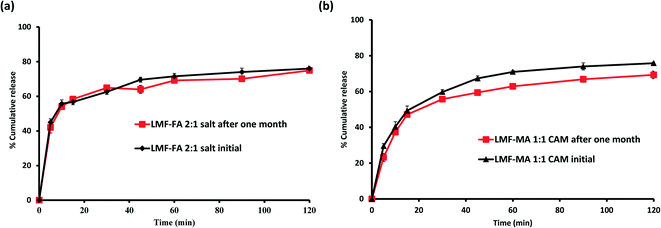
:![[thin space (1/6-em)]](https://www.rsc.org/images/entities/char_2009.gif) 1 co-amorphous system did not show any birefringence during the post-stability period (Fig. S5d, ESI†), which supported the PXRD and DSC findings. In contrast, amorphous lumefantrine exhibited birefringence (Fig. S5b, ESI†) indicating that the neat amorphous form was metastable compared to the co-amorphous system. The stability of the co-amorphous form was ascribed to the presence of intermolecular interactions between lumefantrine and maleic acid, and was confirmed by the FT-IR and ss-NMR. Further in vitro dissolution profile of the stability samples of salt (Fig. 13a) and the co-amorphous system (Fig. 13b) matched with that of the fresh samples (f2 > 50) (Table S8, ESI†) which suggested that the dissolution advantage of these systems was similar to that of the original materials, i.e., there was no deterioration in the product properties after 1 month of accelerated temperature and humidity stress.
1 co-amorphous system did not show any birefringence during the post-stability period (Fig. S5d, ESI†), which supported the PXRD and DSC findings. In contrast, amorphous lumefantrine exhibited birefringence (Fig. S5b, ESI†) indicating that the neat amorphous form was metastable compared to the co-amorphous system. The stability of the co-amorphous form was ascribed to the presence of intermolecular interactions between lumefantrine and maleic acid, and was confirmed by the FT-IR and ss-NMR. Further in vitro dissolution profile of the stability samples of salt (Fig. 13a) and the co-amorphous system (Fig. 13b) matched with that of the fresh samples (f2 > 50) (Table S8, ESI†) which suggested that the dissolution advantage of these systems was similar to that of the original materials, i.e., there was no deterioration in the product properties after 1 month of accelerated temperature and humidity stress.
Conclusions
In the present study, we report the modification of the crystalline and amorphous natures and pharmaceutical properties of lumefantrine with the butenedioic acid isomers fumaric acid and maleic acid. The stable salt and co-amorphous systems of lumefantrine with fumaric acid and maleic acid were obtained via co-crystallization and characterized by DSC, PXRD, ATR-IR, ss-NMR, and SC-XRD studies. The stronger ionic bonds with fumaric acid resulted in crystalline salt formation, whereas weaker interactions with maleic acid gave a co-amorphous salt product. Proton transfer from the amine group of lumefantrine to the carboxylic acid was confirmed for both salts based on a 15N ss-NMR downfield shift. In vitro drug release from the fumarate salt showed a 2.61-fold improvement, whereas co-amorphous maleate showed a 2.67-fold improvement compared to that of crystalline lumefantrine. The novel crystalline and co-amorphous salts were stable for one month under accelerated stability conditions. The potential of configurational conformers to produce crystalline and amorphous phases exhibiting superior physicochemical behavior may be applied to other drugs.Conflicts of interest
The authors declare that there are no conflicts of interest regarding the publication of this paper.Acknowledgements
The authors gratefully acknowledge financial support from the Department of Pharmaceuticals (DoP) and the Ministry of Chemicals and Fertilizers, India. AKN thanks CSIR-NCL and DST-SERB (JC Bose fellowship, SR/S2/JCB06/2009 and the Pharmaceutical Materials and Continuous Process, CRG/2019/001388) for research funding, and the School of Chemistry, University of Hyderabad for providing infrastructure facilities. AKN also acknowledges financial and infrastructure support from the University Grants Commission (through the UPE and CAS programs) and Department of Science and Technology (through the PURSE and FIST programs).References
- W. Wu, H. Ueda, K. Löbmann, T. Rades and H. Grohganz, Eur. J. Pharm. Biopharm., 2018, 131, 25–32 CrossRef CAS PubMed.
- Y. Han, Y. Pan, J. Lv, W. Guo and J. Wang, Powder Technol., 2016, 291, 110–120 CrossRef CAS.
- S. Ghosh, P. P. Bag and C. M. Reddy, Cryst. Growth Des., 2011, 11, 3489–3503 CrossRef CAS.
- D. A. Haynes, W. Jones and W. D. S. Motherwell, CrystEngComm, 2006, 8, 830–840 RSC.
- B. R. Bhogala, S. Basavoju and A. Nangia, CrystEngComm, 2005, 7, 551–562 RSC.
- D. Kalita and J. B. Baruah, J. Mol. Struct., 2010, 969, 75–82 CrossRef CAS.
- A. O. L. Evora, C. E. S. Bernardes, M. F. M. Piedade, A. C. L. Conceicao and M. E. Minas da Piedade, Cryst. Growth Des., 2019, 19, 5054–5064 CrossRef CAS.
- A. I. Chamorro Orué, R. Boese, C. Schauerte and K. Merz, Cryst. Growth Des., 2019, 19, 1616–1620 CrossRef.
- S. Dawre, S. Pathak, S. Sharma and P. V. Devarajan, Eur. J. Pharm. Biopharm., 2018, 123, 95–107 CrossRef CAS PubMed.
- S. Gahoi, G. K. Jain, R. Tripathi, S. K. Pandey, M. Anwar, M. H. Warsi, M. Singhal, R. K. Khar and F. J. Ahmad, Colloids Surf., B, 2012, 95, 16–22 CrossRef CAS PubMed.
- R. Fule, T. Meer, A. Sav and P. Amin, J. Pharm. Invest., 2013, 43, 305–321 CrossRef CAS.
- K. Patel, V. Sarma and P. Vavia, Daru, J. Pharm. Sci., 2013, 21, 27 CrossRef CAS PubMed.
- A. Garg, K. Bhalala and D. S. Tomar, Int. J. Pharm., 2017, 516, 120–130 CrossRef CAS PubMed.
- M. S. Surapaneni, S. K. Das and N. G. Das, ISRN Pharmacol., 2012, 2012, 623139 Search PubMed.
- R. B. Chavan, R. Thipparaboina, D. Kumar and N. R. Shastri, Int. J. Pharm., 2016, 515, 403–415 CrossRef CAS PubMed.
- M. Malamatari, K. M. G. Taylor, S. Malamataris, D. Douroumis and K. Kachrimanis, Drug Discovery Today, 2018, 23, 534–547 CrossRef CAS PubMed.
- C. A. S. Bergström, C. M. Wassvik, K. Johansson and I. Hubatsch, J. Med. Chem., 2007, 50, 5858–5862 CrossRef.
- P. P. Constantinides, K. J. Lambert, A. K. Tustian, B. Schneider, S. Lalji, W. Ma, B. Wentzel, D. Kessler, D. Worah and S. C. Quay, Pharm. Res., 2000, 17, 175–182 CrossRef CAS.
- T. N. Hiew, D. Y. Zemlyanov and L. S. Taylor, Mol. Pharmaceutics, 2021 DOI:10.1021/acs.molpharmaceut.1c00481.
- Y. Guo, E. Shalaev and S. Smith, TrAC, Trends Anal. Chem., 2013, 49, 137–144 CrossRef CAS.
- H. Mesallati, D. Conroy, S. Hudson and L. Tajber, Eur. J. Pharm. Biopharm., 2017, 121, 73–89 CrossRef CAS PubMed.
- S. J. Dengale, S. S. Hussen, B. S. M. Krishna, P. B. Musmade, G. G. Shenoy and K. Bhat, Eur. J. Pharm. Biopharm., 2015, 89, 329–338 CrossRef CAS PubMed.
- C. C. D. CrysAlis, Xcalibur PX Software, Oxford Diffraction Ltd., Abingdon, England, 2008 Search PubMed.
- O. V. Dolomanov, L. J. Bourhis, R. J. Gildea, J. A. K. Howard and H. Puschmann, J. Appl. Crystallogr., 2009, 42, 339–341 CrossRef CAS.
- Y. Zhang, M. Huo, J. Zhou, A. Zou, W. Li, C. Yao and S. Xie, AAPS J., 2010, 12, 263–271 CrossRef CAS PubMed.
- P. Saganowska and M. Wesolowski, J. Therm. Anal., 2018, 133, 785–795 CrossRef CAS.
- Guidance for industry. Regulatory classification of pharmaceutical co-crystals, https://www.accessdata.fda.gov/scripts/cder/dissolution/dsp_getallData.cfm [Accessed on September, 2018].
- S. L. Childs, G. P. Stahly and A. Park, Mol. Pharmaceutics, 2007, 4, 323–338 CrossRef CAS.
- B. Sarma, N. K. Nath, B. R. Bhogala and A. Nangia, Cryst. Growth Des., 2009, 9, 1546–1557 CrossRef CAS.
- L. Orola, M. V. Veidis, I. Mutikainen and I. Sarcevica, Cryst. Growth Des., 2016, 11, 4009–4016 CrossRef.
- A. Delori, P. T. A. Galek, E. Pidcock, M. Patni and W. Jones, CrystEngComm, 2013, 15, 2916–2928 RSC.
- J. Haneef, P. Arora and R. Chadha, AAPS PharmSciTech, 2020, 21, 10 CrossRef CAS PubMed.
- K. Löbmann, C. Strachan, H. Grohganz, T. Rades, O. Korhonen and R. Laitinen, Eur. J. Pharm. Biopharm., 2012, 81, 159–169 CrossRef PubMed.
- H. L. Lee, J. M. Vasoya, M. D. L. Cirqueira, K. L. Yeh, T. Lee and A. T. M. Serajuddin, Mol. Pharmaceutics, 2017, 14, 1278–1291 CrossRef CAS PubMed.
- Y. Lin, H. Yang, C. Yang and J. Wang, Pharm. Res., 2014, 31, 566–578 CrossRef CAS PubMed.
- G. Borodi, A. Turza, O. Onija and A. Bende, Acta Crystallogr., Sect. C: Struct. Chem., 2019, 75, 107–119 CrossRef CAS PubMed.
- K. T. Jensen, K. Löbmann, T. Rades and H. Grohganz, Pharmaceutics, 2014, 6, 416–435 CrossRef CAS PubMed.
- P. C. Vioglio, M. R. Chierotti and R. Gobetto, Adv. Drug Delivery Rev., 2017, 117, 86–110 CrossRef PubMed.
- J. Kastelic, Z. Hodnik, P. Sket, J. Plavec, N. Lah, I. Leban, M. Pajk, O. Planinsek and D. Kikelj, Cryst. Growth Des., 2010, 10, 4943–4953 CrossRef CAS.
- A. Dos, V. Schimming, S. Tosoni and H.-H. Limbach, J. Phys. Chem. B, 2008, 112, 15604–15615 CrossRef CAS PubMed.
- D. Sanz, R. M. Claramunt, M. Á. García, I. Alkorta and J. Elguero, Tetrahedron, 2011, 67, 4633–4639 CrossRef CAS.
- S. Allu, K. Suresh, G. Bolla, M. K. C. Mannava and A. Nangia, CrystEngComm, 2019, 21, 2043–2048 RSC.
- K. Yamamoto, T. Kojima, M. Karashima and Y. Ikeda, Chem. Pharm. Bull., 2016, 64, 1739–1746 CrossRef CAS PubMed.
- A. Alhalaweh, A. Alzghoul, W. Kaialy, D. Mahlin and C. A. S. Bergström, Mol. Pharmaceutics, 2014, 11, 3123–3132 CrossRef CAS.
- L. Orola, M. V. Veidis, I. Mutikainen and I. Sarcevica, Cryst. Growth Des., 2011, 11, 4009–4016 CrossRef CAS.
- T. R. Felthouse, J. C. Burnett, B. Horrell, M. J. Mummey and Y.-J. Kuo, in Kirk-Othmer Encycl. Chem. Technol, John Wiley & Sons, Inc., 2000, DOI:10.1002/0471238961.1301120506051220.a01.
- M. Aljohani, P. MacFhionnghaile, P. McArdle and A. Erxleben, Int. J. Pharm., 2019, 561, 35–42 CrossRef CAS PubMed.
- T. Kojima, K. Higashi, T. Suzuki, K. Tomono, K. Moribe and K. Yamamoto, Pharm. Res., 2012, 29, 2777–2791 CrossRef CAS PubMed.
- X. Shi, B. Fan, C. Gu, X. Zhou, C. Wang and Z. Ding, J. Drug Delivery Sci. Technol., 2020, 59, 101875 CrossRef CAS.
Footnote |
| † Electronic supplementary information (ESI) available: Solid-state forms of lumefantrine (Table S1), IR data of lumefantrine and its acid adducts (Table S2), 13C ss-NMR chemical shifts of lumefantrine (LMF) and its adducts (Table S3), 15N ss-NMR chemical shifts of lumefantrine (LMF) and its adducts (Table S4), hydrogen bonds in the crystal structures of lumefantrine–fumaric acid (Table S5), equilibrium solubility of lumefantrine (Table S6), dissolution parameters for lumefantrine and its adducts (Table S7), dissolution parameters for lumefantrine adducts after 1 month stability testing (Table S8), polarized light microscopic images of lumefantrine (Fig. S1), glass transition (Tg) of amorphous lumefantrine (Fig. S2), packing structure and weak interactions in lumefantrine (Fig. S3), dissolution profiles for lumefantrine (LMF) and its derivatives (Fig. S4), and polarized light microscopic images of amorphous and crystalline lumefantrine before and after stability testing (Fig. S5). CCDC 2025163. For ESI and crystallographic data in CIF or other electronic format see DOI: 10.1039/d0ce01709d |
| This journal is © The Royal Society of Chemistry 2022 |

